Article

Cruise Port Performance Evaluation in the Context of Port Authority: An MCDA Approach

1
Faculty of Maritime Studies and Transport, University of Ljubljana, Pot pomorščakov 4, 6320 Portorož, Slovenia
2
Faculty of Civil Engineering, Transportation Engineering and Architecture, University of Maribor, Smetanova ulica 17, 2000 Maribor, Slovenia
*
Author to whom correspondence should be addressed.
Sustainability 2022, 14(7), 4181; https://doi.org/10.3390/su14074181
Submission received: 3 March 2022 / Revised: 23 March 2022 / Accepted: 30 March 2022 / Published: 31 March 2022

Abstract

:
When it comes to analyzing cruise port performance, port operators have a challenging task because there are no widely accepted or well-known procedures for evaluating cruise port performance. Any performance measures used by port authorities are rough and only offer an approximation of the terminal’s operational performance. Therefore, the purpose of this article is to present a multi-criteria assessment model to assist port authorities in evaluating cruise port performance from a multidisciplinary perspective. We investigated the compatibility and utility of combining the AHP and TOPSIS methods in a proposed MCDA model for assessing cruise port performance. The AHP method was used to provide the weights of port performance indicators, and the TOPSIS method was used to assess the port performance and to create a rank list of ports. A case study involving four Mediterranean cruise ports, Barcelona, Piraeus, Civitavecchia, and Marseille, was used to show the model’s application. The case study results reveal that the safety–environmental aspect is the most important aspect in assessing cruise port performance. We compared the proposed model to a state-of-the-art paper and discovered that our model can successfully cope with various multi-criteria models for port performance assessment.

1. Introduction

Cruise ports in the Mediterranean experienced rapid development in the decade prior to COVID-19 due to a general increase in the regional market, varied tourist attractions with natural and historical diversity, port connectivity and accessibility, and geopolitical and economic situations in the Mediterranean region. Cruise passenger numbers in the Mediterranean increased by 11.51% in 2019 compared to the same ports in 2018 [1]. The constant development of ports, growth in cruise traffic demand, and regional attractiveness are forming competitive relationships between cruise ports in the Mediterranean region. More efficient and productive cruise ports in the area have a better chance of becoming a chosen port on a cruise ship itinerary. Ports are an essential element of the cruise industry chain since they encourage cruise lines to add ports to their itineraries and attract potential cruise passengers. Consequently, the pressure on cruise ports to invest in port development and improve their performance has increased.
The performance of cruise ports is affected by various factors, including technical, socioeconomic, safety–environmental, and touristic aspects, which are often assessed using a variety of approaches and include several decision-makers and planning actors. However, these factors also influence cruise lines’ decisions to add a port to the cruise itinerary and, as a result, to attract potential passengers to certain ports. The popularity of a cruise port is related to several factors that influence the port’s competitiveness. According to [2], the following factors are essential for cruise lines when choosing a port for a ship itinerary: the natural environment of the hinterland, cruise terminal infrastructure, tourism attractions, port connections, and accessibility to the hinterland. Similar conclusions were reached by [3], who believes that the most important factors for cruise lines to consider when choosing a port are port location and attractiveness, tourist attractiveness of the destination/region, accessibility of the destination/region, port facilities and services, and port fees. Based on this, cruise ports must have appropriate superstructures, infrastructures, supplies, and services for cruise ships and their passengers.
The cruise industry and cruise port literature focus primarily on passenger demand, itinerary planning [4,5], port infrastructure, and port competition [6,7,8], but also on cruise terminal operation and management [9]. Our literature review showed that [10] are two of the most important authors, who provided a comprehensive review of the literature relevant to the cruise industry sector. The literature often mentions that the largest port must have the highest efficiency level due to its higher number of cruise activities. However, big cruise ports can only be developed to their physical limits, making it impossible to increase efficiency. On the other hand, smaller ports may find it easier to expand and achieve more effective port management faster. Thus, port size is not the only meaningful indicator influencing cruise port efficiency and performance. As a result, numerous criteria and their indications need to be analyzed in order to evaluate cruise port performance, which can be measured based on a cruise port’s efficiency and effectiveness dimensions. Efficiency is described as performance from the standpoint of the port authority, whereas effectiveness includes the perspective of passengers as well as other actors participating in the port environment. In this study, we examined and evaluated efficiency from the perspective of the port authority. However, few researchers have studied the efficiency [9,11] and performance of cruise ports in recent decades [11,12,13]. A cruise port’s performance can be improved if the port becomes more efficient and productive. More efficient ports have a greater chance of becoming a preferred port on a cruise itinerary. As a result, ports are modernizing and investing in themselves to attract more cruise traffic. In [11], the author demonstrated that port development impacted port efficiency and, as a result, port productivity. It has been demonstrated that the most significant indicators of efficient cruise port management are port infrastructure, port facilities and amenities, political instability, cruise tourist policy (promoting cruise tourism and protecting the destination), and cruise passenger comfort and safety. These discussions are critical in determining how port management concerns should be prioritized for a cruise port’s improvement and development. Efficient port administration is critical not just for satisfying cruise passengers and ships but also for becoming a more competitive port. In [9], a study was conducted on the technical efficiency of cruise ports by analyzing the output of embarking/disembarking and transit traffic (port productivity), with input being represented by infrastructure categories in cruise operations (total berth, total length of boarding berths, maximum berth length in meters, maximum berth depth in meters, number of check-in desks, etc.).
Although the cruise sector is one of the fastest-growing and most profitable tourism segments, few studies have been undertaken on port performance evaluation. As a result, there appears to be a gap in the literature regarding the evaluation of cruise port performance using a multi-criteria approach. Most research papers measure port performance from economic (revenues, cost–benefit, etc.) or technical efficiency (productivity) perspectives. However, a cruise port’s performance should encompass other sustainability principles, such as traffic–technical, social, and safety–environmental elements, not just economic elements. These four aspects can be evaluated using various criteria, which are often incompatible, requiring a multi-criteria approach [14]. Complex transport decisions involving evaluating varied and heterogeneous aspects (e.g., environmental, social, and economic) require a multi-criteria approach [15]. Consequently, many methods for solving multi-criteria problems have been created, and the number of academic multi-criteria decision analysis (MCDA) papers is steadily expanding. However, choosing an appropriate decision support tool and justifying the choice may be a difficult task when integrating an MCDA method with other methods. Each MCDA tool has its own set of limitations, hypotheses, and perspectives; thus, it must be carefully selected, considering the needed input data as well as the outputs (qualitative/quantitative data). There are some notable examples of MCDA-integrated methods that are still overlooked in the literature [16,17,18,19]. Moreover, in relation to maritime studies and logistics, real case applications of different MCDA models were reported in [20]. Here, we report some studies that used the MCDA approach in the transport sector, e.g., in service planning and infrastructure design. The authors of [21,22,23] used single MCDA and an analytical hierarchy process (AHP) method. In maritime ports and logistics, [24,25] used the simple additive weighting (SAW) method; in road and rail projects, authors [26,27,28] used AHP and the technique of order preference similarity to the ideal solution (TOPSIS) method; in port performance measurement, [29,30] used the AHP, analytic network process (ANP), and a decision-making trial and evaluation laboratory (DEMATEL) method. Cruise port place selection was investigated by [16], wherein the authors used the ANP model for port place selection and the extended VIKOR method for ranking and selecting the most suitable place for a cruise port; in port selection, [2] used a fuzzy–AHP method. In [27] in particular, the TOPSIS method was used to compare the performance of light rail transit and bus rapid transit in similar European cities.
We discovered through a literature review that few research publications have combined these two integrated MCDA methods. As a result, we investigated the compatibility and utility of combining the AHP and TOPSIS methods in a model for assessing cruise port performance. No published research has been reported in this field that utilizes TOPSIS to rank cruise ports based on their AHP weights. As a result, we chose to apply TOPSIS analysis to assess port performance and compare cruise ports using the ranking list provided by the TOPSIS method. It is evident that weights need to be determined before conducting the TOPSIS analysis, so we used the AHP method. The significance of combining the AHP and TOPSIS methods into one MCDA model can be seen in the proposed MCDA model. Furthermore, to demonstrate the benefits and drawbacks of our proposed MCDA model, we compared it to a state-of-the-art publication [27], which used the MCDA method for port performance measurement in the context of port choice.
Furthermore, from the literature we discovered that port authorities and researchers are becoming more interested in comprehensive cruise port performance assessments. Moreover, cruise ports place a high value on terminal operations and management since they influence the level of efficiency and, as a result, the cruise port performance of cruise terminal operations. As a result, cruise port operators (decision-makers) are continually under pressure to monitor and improve port performance while providing consistently high-quality services to cruise ships and passengers. Assessing the performance of a cruise port is a difficult task for the operators (port authority), as it requires substantial knowledge and skills in the field of cruise port operations. As a result, port operators frequently utilize numerous simplifications to carry out the performance assessment, which directly impacts the accuracy and quality of the port performance assessment. This also affects the final decisions made by cruise port operators. In this context, the purpose of this paper is to propose an unconventional approach to assessing cruise port performance based on best practice analysis and multi-criteria evaluation. Besides providing a general, unorthodox evaluation model, this study also aims to establish performance criteria and their weights. With the approach given in this paper, decision-makers can analyze cruise port performance from multidisciplinary perspectives, build a ranking list of cruise ports based on port performance, and assess its competitive advantages and necessary port development measures.
The paper is organized as follows. The first section presents an introduction to the research topic and problem. In the second section, we give an overview of the literature on port performance assessment. The multi-criteria decision analysis (MCDA) approach and the cruise port performance criteria are explained and conducted in the third section. This section presents the results of the analytical hierarchy process (AHP) model conducted in the Expert Choice tool. Finally, in the Conclusion section we provide some critical thoughts and conclusions regarding using the MCDA methodology and the developed methodological approach. We must note that the goal of this study was to create a multi-criteria model for evaluating the performance of cruise ports, which is not based on an exact calculation but instead on the model’s presentation. As a result of our research, a model has been developed.

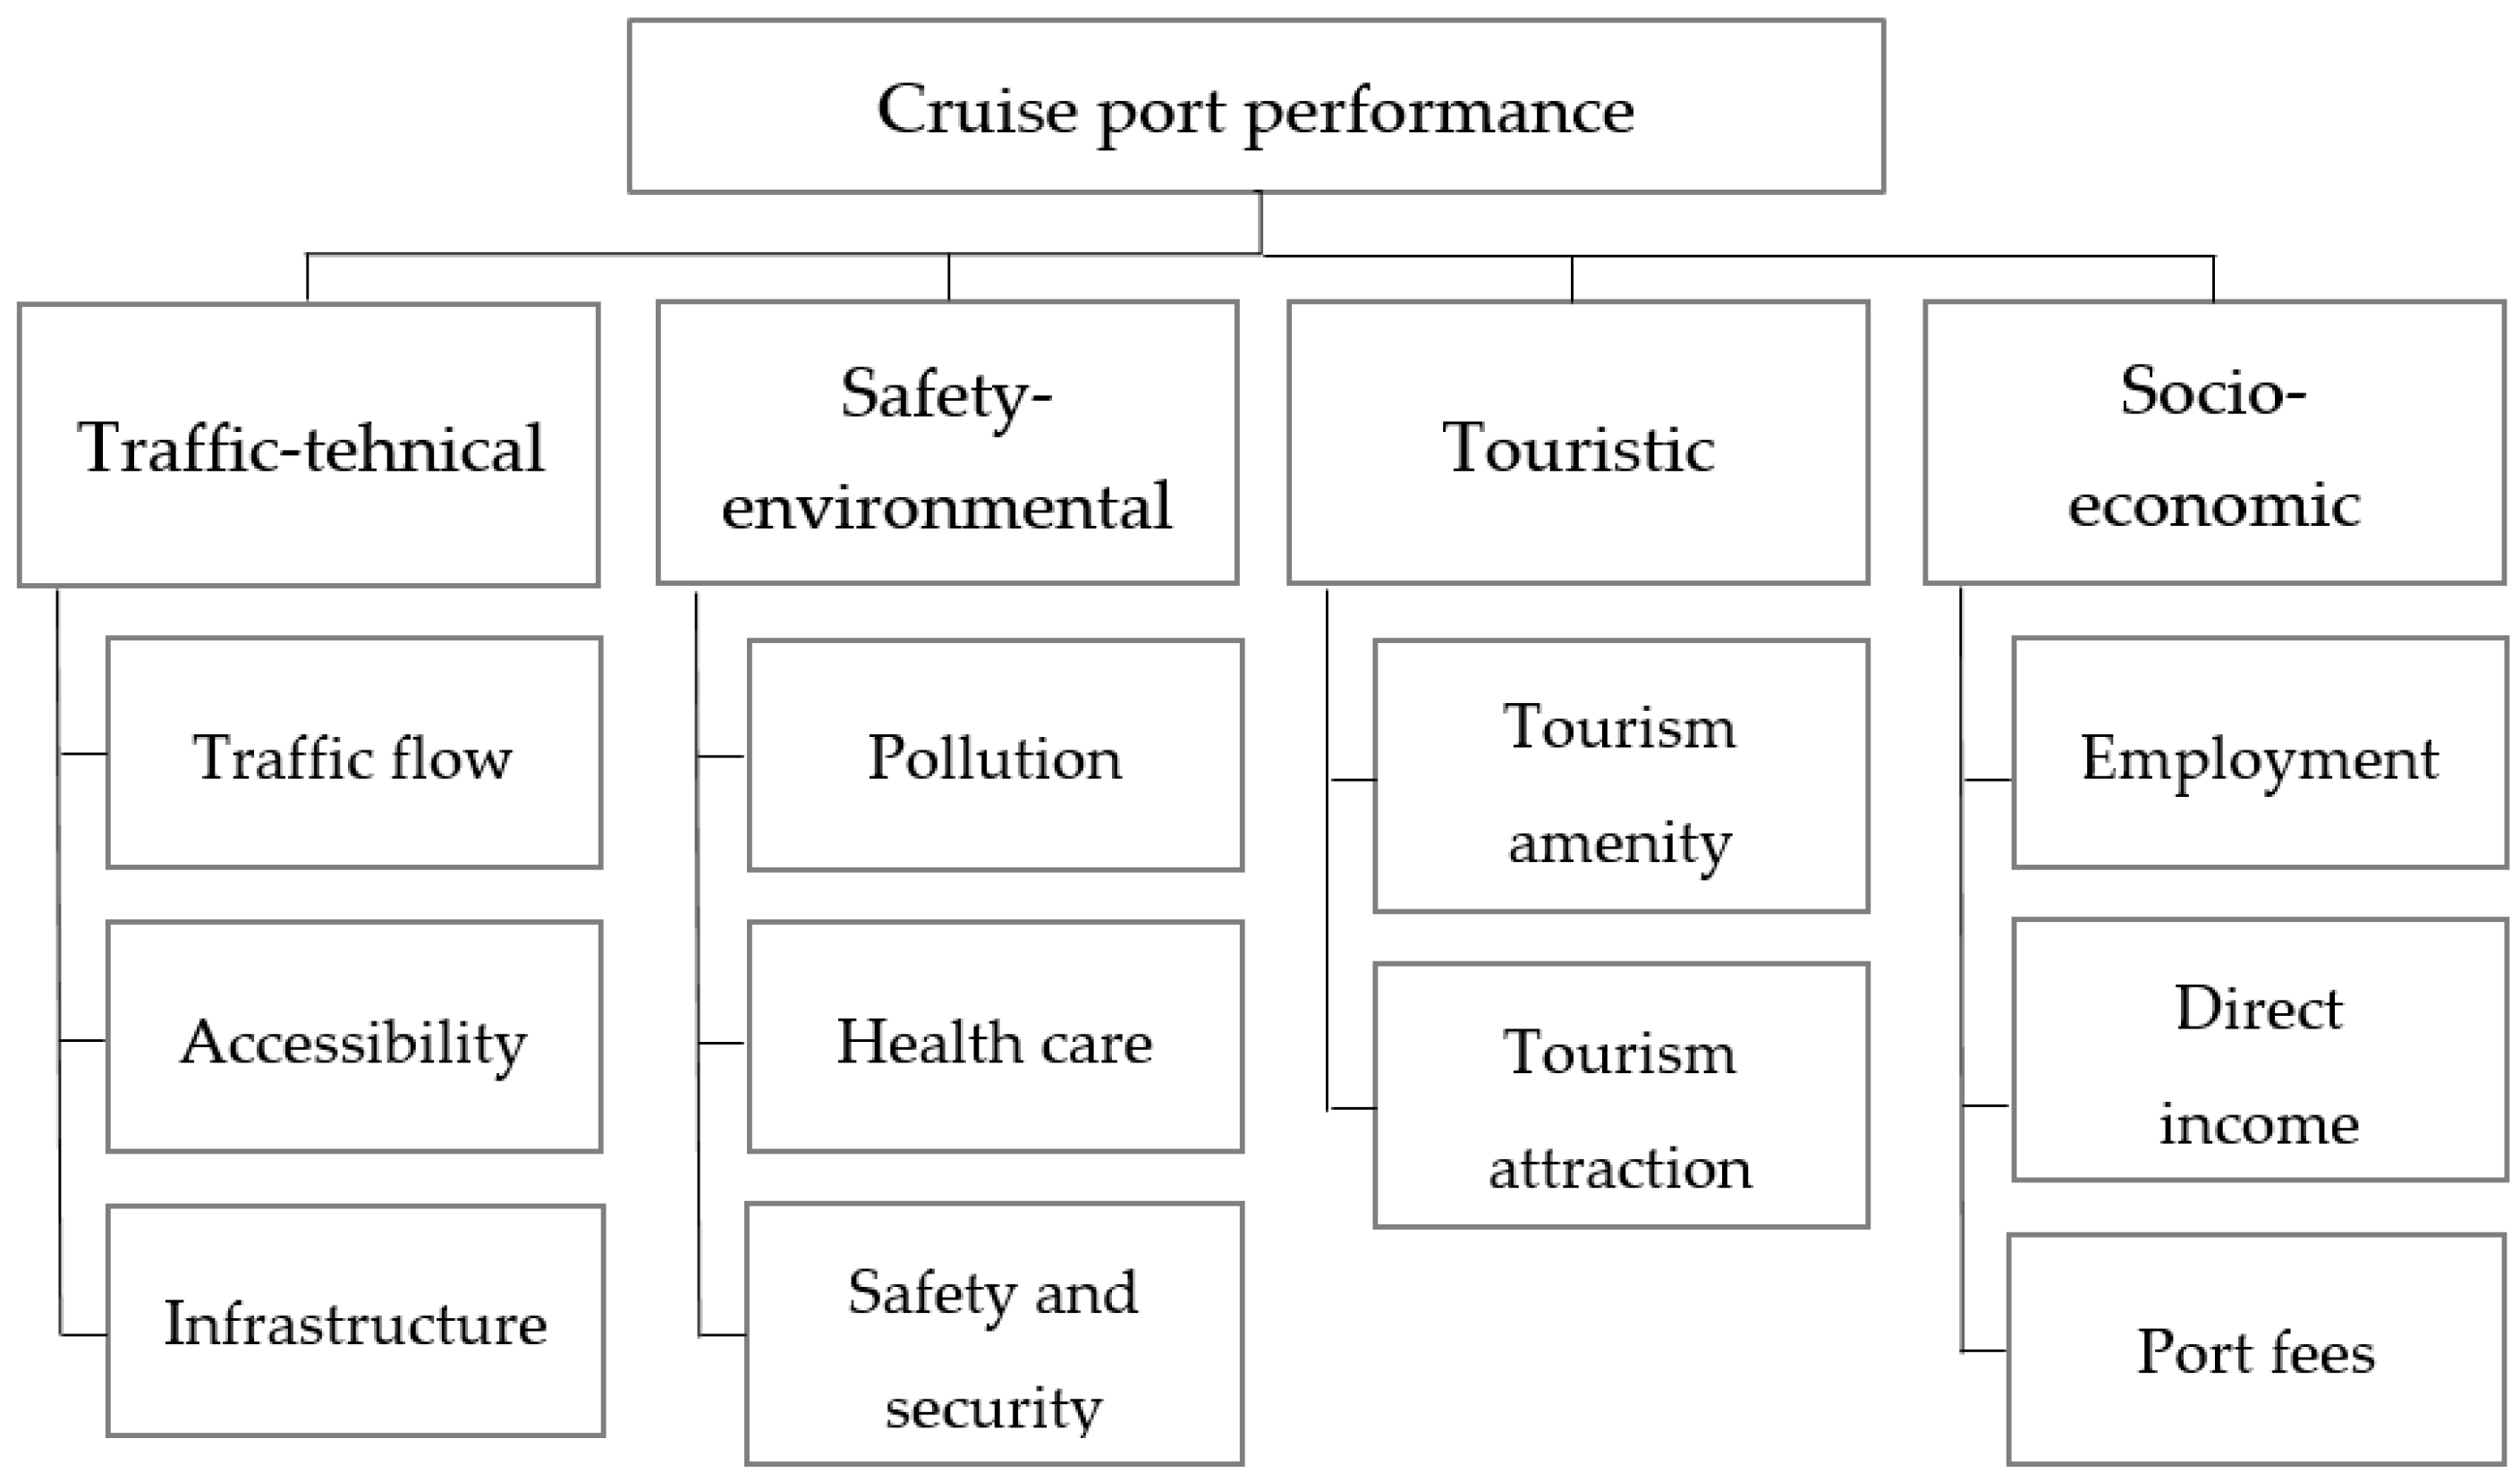
2. Multi-Criteria Decision-Making Model for Cruise Port Performance Evaluation

We conducted a meta-analysis of the literature to identify criteria for evaluating a cruise port’s performance. We eliminated papers from the search results that were not in English, were not full text, were on an unrelated topic, did not meet the criteria, and were published before 2000 (except important papers). Duplicate articles were also removed from the selection. The meta-analysis revealed 36 articles that were relevant to our study. Based on the meta-analysis, we created numerous criteria and sub-criteria to evaluate cruise port performance: Each criterion has an associated indicator and parameter to perform the analysis (Table 1).

2.1. Traffic–Technical Aspect

The traffic–technical aspect of the cruise terminal assesses traffic flow, infrastructure, and accessibility of the ports using various indicators impacting cruise terminal operation and management. The ability of the cruise terminal to optimize its output is commonly used to describe the cruise port’s efficiency (embarkation, disembarkation, and transit). The port efficiency depends on its function in cruise itineraries, as it can act as a home port (turnaround ports or hub ports), port of call (transit ports), or hybrid port. A home port is where the ship starts and finishes its itinerary, and the passenger begins and finishes their journey. Approximately 80% of all cruise ships start and end their voyages at the home port, which means that ship itineraries are usually designed as loops. The home port may also be a port of call for some cruise ships. Ports of call are those destinations (ports) where the ship regularly calls, i.e., the port where passengers can disembark for port-city sightseeing and short excursions. A hybrid port is a port that operates simultaneously as a home port and a port of call. Depending on the cruise port, operations and services also vary [31]. Furthermore, home ports have a strong economic impact on the destination and the port itself. For this reason, cruise port operators invest in the port infrastructure, attractions, and sights of the destination, and in doing so increase the range of port services for cruise ships and their passengers. This helps ports attract more cruise ships and consequently increase their revenue and contribute to the region’s economic growth. However, home port performance can play a significant role when shipowners (cruise lines) decide to choose a port for their home port operations.
To undertake an efficiency study, the number of passengers embarked, disembarked, and transited must be determined as (1) traffic flow [9,13]. Several authors have used traffic flow as input data for cruise port performance [13,32,33,34] and traffic flow forecasting [35,36,37]. We used the following traffic flow indicators (Tables 2 and 3) in the same way as [13] and other authors: (1.1) number of cruise ship calls and (1.2) number of cruise passenger movements (Pax). In this case, the traffic-flow criterion can be expressed as follows:
pt = PL · Upt + PP · Upt
where pt is the value (grade) of the traffic flow criterion, PL is the value of the indicator of number of cruise ship calls, and PP is the value of the indicator of number of cruise passengers in the port. The values PL and PP are first normalized, then multiplied by the weight of the traffic flow criterion Upt, and finally summed.
The port accessibility and port connectivity significantly impact the cruise traffic and performance of a cruise port. The passenger journey consists of two segments: The first is the journey to the port and the second is the cruise itself. Therefore, the port must have good land transport connections (highways and railways) and good connectivity to high-capacity airports. For example, the ports of Barcelona and Civitavecchia are the main ports in the Mediterranean, with good accessibility and connectivity to the airport (air connections). However, the connectivity of the cruise port is an essential factor, especially for home port selection. The port’s proximity to an airport with air connections to the main cruise source markets, a train station with good hinterland connections, and a highway connection are primary drivers for potential home port establishment.
An essential factor influencing cruise port performance is (2) accessibility; therefore, developed ports with good facilities and infrastructure are in great demand. The authors of [4,38,39] concluded that port cities with well-planned transportation infrastructure and connectivity are more visited and developed. Accessibility is an important factor for port performance since it substantially impacts efficiency, competitiveness, and economic growth. Furthermore, accessibility directly impacts the port–city interaction and, as a result, the region’s economic growth. The optimum port scenario for cruises allows good passenger and cargo accessibility. The port should generally have good direct connections to the port city center, including accessible footpaths and cycle routes, minor traffic disturbances, and good transport accessibility. At the same time, the port must ensure that its cruise ship services are of high quality. In terms of the sustainable pillar, we identified three types of accessibility: accessibility by public transport, accessibility by car, and accessibility by walking and biking. The design of public transportation routes, stations, and timetables and the design of the road network has a significant impact on (2.1) accessibility by public transport. The number of public transport stops and stations within 2 km (or a 25 min walk) of the terminal was calculated. This is the maximum distance a pedestrian will need to walk. A walk between two public transport stops is typically 400 m (5 min), which is considered a comfortable distance for most people [40]. The physical characteristics of the cruise terminal and passenger facility, which are given as infrastructure categories in cruise operations, are connected to (2.2) accessibility by bike and walking. These include the number of check-in desks, elevators, escalators, gangways, stairways, total passenger building space, number of floors in the passenger building, and the length of pedestrian walkways [9,13]. We measured public transport, walking, and cycling accessibility by counting the number of associated infrastructures (roads, footpaths, etc.) within 2 km (or a 25 min walk) of the cruise terminal, which was considered the maximum walking distance for a passenger. The accessibility of a port city is influenced by the geometry of roads and spaces, which affects the choice of walking and cycling routes [41]. We looked at the overall length of all routes within a 2 km radius of the cruise port to determine bike and pedestrian accessibility. The study was carried out using the QGIS software, with the QuickOSM plugin being utilized to obtain the required indicator items. (2.3) Accessibility by car is the third form of accessibility that we discussed and assessed. This accessibility is especially important for home ports. The authors of [42] assumed that 85% of passengers arrive by private car, 10% by taxi, and 5% by bus. We calculated the number of parking spaces within a 2 km radius of the passenger terminal. The accessibility indicators were evaluated using OpenStreetMap (OSM) data and spatial analysis in the QGIS environment. Amenity (parking, parking space) is the key and value of the items we utilized for the analysis in QGIS. We used the ArcMap application and the Buffer tool to draw a circle with a radius of 2 km and a cruise terminal as the centroid. All the parking spaces outside the circle were removed. The accessibility criterion can be described with the equation:
do = DJPP · Udo + DPK · Udo + DOA · Udo
where do is the value (grade) of the accessibility criterion, DJPP is the value of the indicator of accessibility by public transport, DPK is the value of the indicator of accessibility by bike and walking, and DOA is the value of the indicator of accessibility by car. First, we normalize the values of DJPP, DPK, and DOA, then multiply them by the weight of the accessibility criterion Udo and sum them.
Since cruise ships are becoming more extensive than ever, port operations and services are becoming more complex. Because the infrastructure provision is difficult to adjust in the short term, infrastructure substantially impacts port management at the terminal level. The authors of [9] concluded that a port’s competitive advantage is related to its infrastructure qualities, which also influence the cruise ship’s port of call and itinerary planning. It has been observed that achieving a high degree of technological efficiency, particularly for certain cruise terminals, is a sign that a terminal has reached full capacity. In this case, the authorities would need to consider possible investment to improve the capacity of the cruise operation. From the standpoint of a cruise line, the port’s performance will improve due to increased flow and capacity. As a result, ports require proper (3) infrastructure and facilities. This is especially crucial when port authorities must manage passenger flows safely via the passenger facility due to unforeseen circumstances and incidents. We chose to use the indicator in this case of (3.1) passenger buildings, which vary based on whether the port is a home port or a port of call. All passenger buildings have one thing in common: Passenger flows must be managed quickly, safely, and effectively without causing congestion. The port’s cruise activities determine the size and type of passenger building. When a cruise port is first established, it is common to construct temporary structures or utilize other structures that were not designed specifically for cruise activities (convertible buildings). The infrastructural features, such as quays and berth size, cruise ship draft, and so on, all have an impact on the cruise port’s operation. According to [32], a port’s poorly designed infrastructure may prevent a certain cruise ship from docking. When a cruise port hits its physical growth limits and is unable to expand further, this impacts port efficiency and, as a result, port performance.
Several authors [2,3,43] have stated that port infrastructure is one of the most important elements impacting the growth in cruise ship traffic. The maximum allowed draft of the ship, according to [32], is the most important measurement for docking cruise ships in port. As a result, the number of cruise ships that may dock simultaneously is limited by the number of berths and piers available. When evaluating cruise terminals and their infrastructure, it is necessary to consider their physical characteristics and others, which determine whether they meet the requirements for cruise terminals and whether they are appealing to cruise lines and passengers. As a result, we used the physical limitations of port infrastructure elements (quay and berth size) as a port performance indicator. As for an indicator of the infrastructure criterion, we utilized (3.2) number of berths and (3.3) cruise ship draft. The following equation may be used to represent the infrastructure criterion:
in = PZ · Uin + PO · Uin + UL · Uin
where in is the value (grade) of the infrastructure criterion, PZ is the value of the cruise terminal building indicator, PO is the value of the indicator of number of berths, and UL is the value of the cruise ship draft indicator. First, we normalize the PZ, PO, and UL values and then multiply them by the weight of the infrastructure criterion Uin and sum them.

2.2. Safety–Environmental Aspect

The pollution level in the port city and port surroundings can evaluate the environmental impact of cruises [44]. Cruise ships negatively influence the port environment, as highlighted by [45]. They believe that environmental challenges associated with cruises are an essential aspect of port development’s long-term sustainability. As a result, ports must start implementing environmental steps to preserve their destinations to ensure a long-term future.
The environmental criterion considers pollutants caused by port activities and the health benefits that may be gained via effective port–city interface area development (green spaces). SOx and NOx emissions are the most common indicators of pollution, which generate sulfate aerosols and fine particles that are harmful to human health and induce acid rain and soil acidification [46,47]. As a result, it was decided to include a more subjective indicator of environmental quality: the (4.1) pollution index from the Numbeo database [48]. The database was produced based on the results of a pollutant survey that was conducted. They use a measuring scale from 0 to 100, where a pollution index of 0 implies very little pollution and a value of 100 implies a lot of pollution. The pollution index is a measure of a city’s overall pollution. The algorithm for computing the pollution index is extremely complicated, is written in Java, and can be accessed on the Numbeo website.
All cruise ports have waste-related issues, such as trash disposal and recycling, waste management in ports, and so on. Cruise ships generate massive amounts of (4.2) waste, which can substantially influence the ecosystem where it ends up. Because much of this waste ends up in the seas and oceans, ports must have the option of accepting waste [49,50]. However, because there is a large amount of waste aboard the ships and the fee for disposing of ship-generated waste is often high, ships seldom hand it over to the port, meaning that the waste mainly ends up in the seas. As a result, ports must provide waste collection services. The authors of [51] assessed the amount of solid waste received (paper, plastic, glass, household food waste, etc.) in Split port by utilizing the average number of solid wastes produced by one person on board for a single cruise day. According to the author of [46], each passenger on a cruise ship with 3000 passengers produces 4 kg of solid waste per day. The amount of solid waste was calculated by multiplying 4 kg by the number of passengers each year and then by the cruise ship’s average detention time in Split (expressed in units of the day). As a result, they discovered how much solid waste the port of Split received from cruise ships on average. The authors of [52] investigated waste production on a cruise ship by calculating or estimating the amount of solid waste produced by cruise ship passengers in the three main Croatian ports. The amount of solid waste produced by the cruise ship was calculated by multiplying the total number of passengers remaining during the ship’s visit by the average number of days the ship stays in port. These numbers were then multiplied by the average value of waste produced by each passenger to calculate the amount of solid waste. The average value of waste produced by passengers on board was expressed in m3 per unit for the three major forms of solid waste (plastic, food, and household waste such as glass, paper, cans, etc.). However, for the sake of safety and the environment we use a quantifiable waste indicator with the parameter of the amount of solid waste received from cruise ships. It is estimated in the same way as in [51]; however, we use a value of 3 kg/person/day for the average amount of waste generated per person aboard a cruise ship. Ports do not want waste since it introduces additional environmental difficulties (landfills, recycling, etc.). However, suppose the port has a sound environmental and sustainable strategy, such as a garbage collection and management plan. In that case, this may constitute a considerable portion of the port’s revenue and boost shipowners’ interest in stopping at such a port. Each ship that arrives in port decides whether to hand over the waste to the port or proceed to the next port of call, where the waste will be delivered. This is determined by the ship’s storage capacity and the accumulation of waste during the trip until the cruise ship’s next stop. According to [50], every cruise port, including the home port and ports of call, should offer enough waste disposal facilities (capacity). In this study, we look at waste as having a beneficial impact on ports since there is a trend toward reducing the pollution of the oceans and burdening the ecosystem with waste from cruise ships. We calculated the amount of solid waste produced by ships in ports by creating a database of ships in individual ports in 2018. We calculated the total time of ship stops in the port and the average time of the individual ship’s stop and the average size of the ship that was in the port. The pollution criterion can be expressed mathematically as follows:
on = PI · Uon + G · Uon
where on is the value (grade) of the pollution criterion, PI is the value of the pollution indicator, and G is the value of the waste indicator. First, we normalize values PI and G then multiply them by the weight of the pollution criterion Uon and sum them.
After the Costa Concordia shipwreck in 2012 and the COVID-19 infectious disease outbreak in 2019, which also spread aboard cruise ships, the literature on health and safety has grown significantly. This has raised concerns about passenger safety and health on board ships and in cruise ports where passengers board and depart. Additionally, accidents occur during passenger stays at the port and port city. Ship liners, of course, do not want their passengers to experience accidents (injuries, deaths), as this might have a negative impact on the passenger experience. However, if an unfortunate event occurs, ship liners and passengers want fast and professional medical care for their injuries. Therefore, we used (5.1) health care as a criterion, which is evaluated in a port city. We used the Numbeo website to access the passenger health care indicator, which tracks and saves the state of the health care index in different cities. The index is calculated using data from respondents who have completed surveys on the Numbeo website. The survey findings are presented in the conclusion on a scale of 0 to 100, which makes the data more understandable for readers. The value of the health care index refers to an evaluation of the total quality of a city’s healthcare system, including healthcare employees, physicians, equipment, expenditures, and so on. The method for determining the value of the healthcare criterion is quite complicated, is written in Java, and can be found on the Numbeo website. The equation for the health care criterion is as follows:
zd = Zv · Uzd
where zd is the value (grade) of the health care criterion and Zv is the value of the indicator of health care. First, we normalize the value of ZV and then multiply it by the weight of health care Uzd.
Passenger safety and the cleanliness of the passenger terminal are two factors that influence whether a cruise ship chooses a port as its destination. Many authors have made the same observation [32,38,39]. Safety for cruise passengers visiting the port city is a major concern. In many cases, the choice to visit a port as a cruise destination is linked to the city’s crime rate, as cruise lines and tourist boards recognize that it is in their best financial interests to keep their passengers safe. In this regard, we decided to include the safety and security of passengers as one of the safety indicators by using the (6.1) crime index in the port city. The Numbeo database was used to obtain crime rates [48]. It is also critical that ports and ships have emergency protocols to protect passengers from criminal activity. The Numbeo database, which monitors and saves the condition of the crime index, was used to obtain the crime index values. A very low crime rate is recognized if the crime index value approaches 0, whereas a very high crime rate is recognized if the number approaches 100. Based on a survey performed by the Numbeo website, data on crime rates were collected. The crime index is a calculation of a city’s total crime rate. The algorithm for computing the pollution index is extremely complicated, is written in Java, and can be found on the Numbeo website. The safety and security criterion can be expressed mathematically as follows:
va = CI · Uva
where va is the value (grade) of the safety criterion and CI is the value of the crime index indicator. First, we normalize the value of CI and then we multiply it by the weight of the safety criterion Uva.

2.3. Touristic Aspect

Cruises should be evaluated based on what the city has to offer passengers in terms of its attractiveness as a destination [53]. As a result, as a touristic criterion, we chose (7.1) tourism amenity. Even if cruise ships have different time frames of stops for each port, we can expect that the cruise ship passengers will travel a maximum of 2 km from the port to see the cultural sights of the surrounding urban area. In this case, the indicator considers the presence of tourist amenities within a 2 km radius accessible on foot. Therefore, to assess the number of sites in an area, a radius of 2 km (or a 25 min walk) from the passenger terminal was analyzed. The study was carried out using the ArcMap and QGIS software, with the QuickOSM plugin being utilized to obtain the required indicator items. The following equation can be used to represent the criterion for tourism amenity:
tz = Tz · Utz
where tz is the value (grade) of the tourism amenity criterion and TZ is the value of the tourism amenity indicator. First, we normalize the value of TZ and then multiply it by the weight of the tourism amenities Utz criterion.
An important criterion of the tourist aspect is (8.1) tourism attraction. It is worth noting that the more diverse and interesting a port city’s tourist attractions are, the more interest there is in including it on a cruise ship’s itinerary. Passengers and ships are also attracted to the port because of the leisure activities [54]. Passengers aboard cruise ships desire to discover leisure activities on the shore, such as sailing, canoeing, wakeboarding, or attending festivals and events in the port city, among other things. That is why most cruise ships search for “something different” at ports, anything that would provide their passengers with lifelong memories. As a result, ports strive to increase port capacity and collaborate with travel companies and the local community to provide the destination’s most interesting tourist attractions. The author of [38] examined the factors that influence whether cruise ships choose a (home) port. Tourist sights and attractions scored fifth out of the 12 criteria studied. The availability of tourist attractions in the port city was our criterion for tourism attraction. The number of tourist attractions in the region was counted and analyzed based on a radius of 2 km (or a 25 min walk) from the passenger terminal. The study was carried out using the ArcMap 10.5 and QGIS 3.10.13. application, with the QuickOSM plugin being utilized to obtain the required indicator elements. The following equation may be used to represent the criterion for a tourist attraction:
ta = TA · Uta,
where ta is the value (grade) of the tourism attraction criterion and TA is the value of the indicator of tourism attraction. First, we normalize the value TA and then multiply it by the weight of the tourism attraction Uta criterion.

2.4. Socioeconomic Aspect

Nowadays, ports are considered one of the most important engines of economic growth in the communities where they are located, producing revenue through direct spending by cruise passengers, crews, cruise lines during their stay, and so on [55]. Many port cities depend on cruise ship traffic as their primary source of income. CLIA analyzed the socio-economic impact of cruise traffic. It has been noted that cruising sustained 1,177,000 jobs, equaling USD 50.24 billion in wages and salaries and USD 150 billion total output worldwide in 2018 [56].
We use the (9) employment criterion in the context of cruise port performance. K and Dwarakish (2020) also highlighted employment as a metric for evaluating port performance. The European Commission studied the economic impact of cruises on the port region to evaluate the economic impact of cruises in EU ports and the implications for employment in the region. In research, the economic effects of cruises on employment can be calculated by multiplying the number of passengers by the number of jobs produced by each passenger [57]. We defined employment as the number of jobs produced by cruises in the port region. The employment criterion can be expressed mathematically as follows:
za = ZA · Uza
where za is the value (grade) of the employment criterion and ZA is the value of the employment indicator. First, we normalize value ZA and then multiply it by the employment criterion Uza.
The expenditure of passengers, crew, and shipowners during a port visit positively influences the local economy. Direct passenger expenditure is recognized as a crucial variable [58,59]. Travel, transportation, food and drink, shopping, and other miscellaneous purchases at the destination account for most passenger spending. The impacts of cruise ship passenger expenditure on port and destination income have been studied by several researchers [60,61,62,63,64]. We utilized the indicator (10) direct income, represented by the average passenger expenditure from cruise ships, to analyze the economic performance of cruise ports. Official port reports, CLIA reports, MedCruise reports [1], and the Eurostat statistics database were used to gather data on passenger expenditure. We used data from the CLIA report to estimate the direct expenditure of cruise passengers, which shows that the average expenditure per passenger in a port of call is EUR 62. In comparison, the average expenditure per passenger in the home port is EUR 81. According to the CLIA, around 30% of all passengers at home ports spend at least one night in the city, generating EUR 292 in indirect expenditure. Furthermore, each crew member spends an average of EUR 23 in each port. However, in the Mediterranean, medium-sized cruise ships (1000–2000 passengers) have an average of 600 crew members. The equation for the direct income criterion is as follows:
dp = DP · Udp
where dp is the value (grade) of the direct income criterion and DP is the value of the direct income indicator. First, we normalize the value of DP and then multiply it by the weight of the direct income criterion Udp.
(11) Port fees, which are collected by ports for each passenger at each embarkation, disembarkation, and transit, are a very significant economic criterion for cruise ports, and notably for ship liners. Ships must, of course, pay other port fees such as mooring fees, waste collection, and so on. The cost of waste collection, on the other hand, might vary depending on the type of waste (different for solid and liquid waste). These are computed based on the amount of waste (m3) received. This study used port charges per passenger to assess a port’s revenue from cruise ship fees. The authors of [12,13] analyzed how port fees affect port income by assuming that the pier will be expanded to accommodate additional ships. They pointed out that this factor (pier lengthening) substantially influences the number of ships that arrive and the revenue generated by the port. According to several researchers, port fees are one of the primary elements influencing a ship’s choice to pick a port as a cruise ship destination [32,38,39]. The port fees criterion can be presented with the following equation:
pp = IPP · Upp
where pp is the value (grade) of the port fees criterion and IPP is the value of the indicator of port fees. First, we normalize the value of IPP then we multiply it by the weight of the port fees criterion Upp.

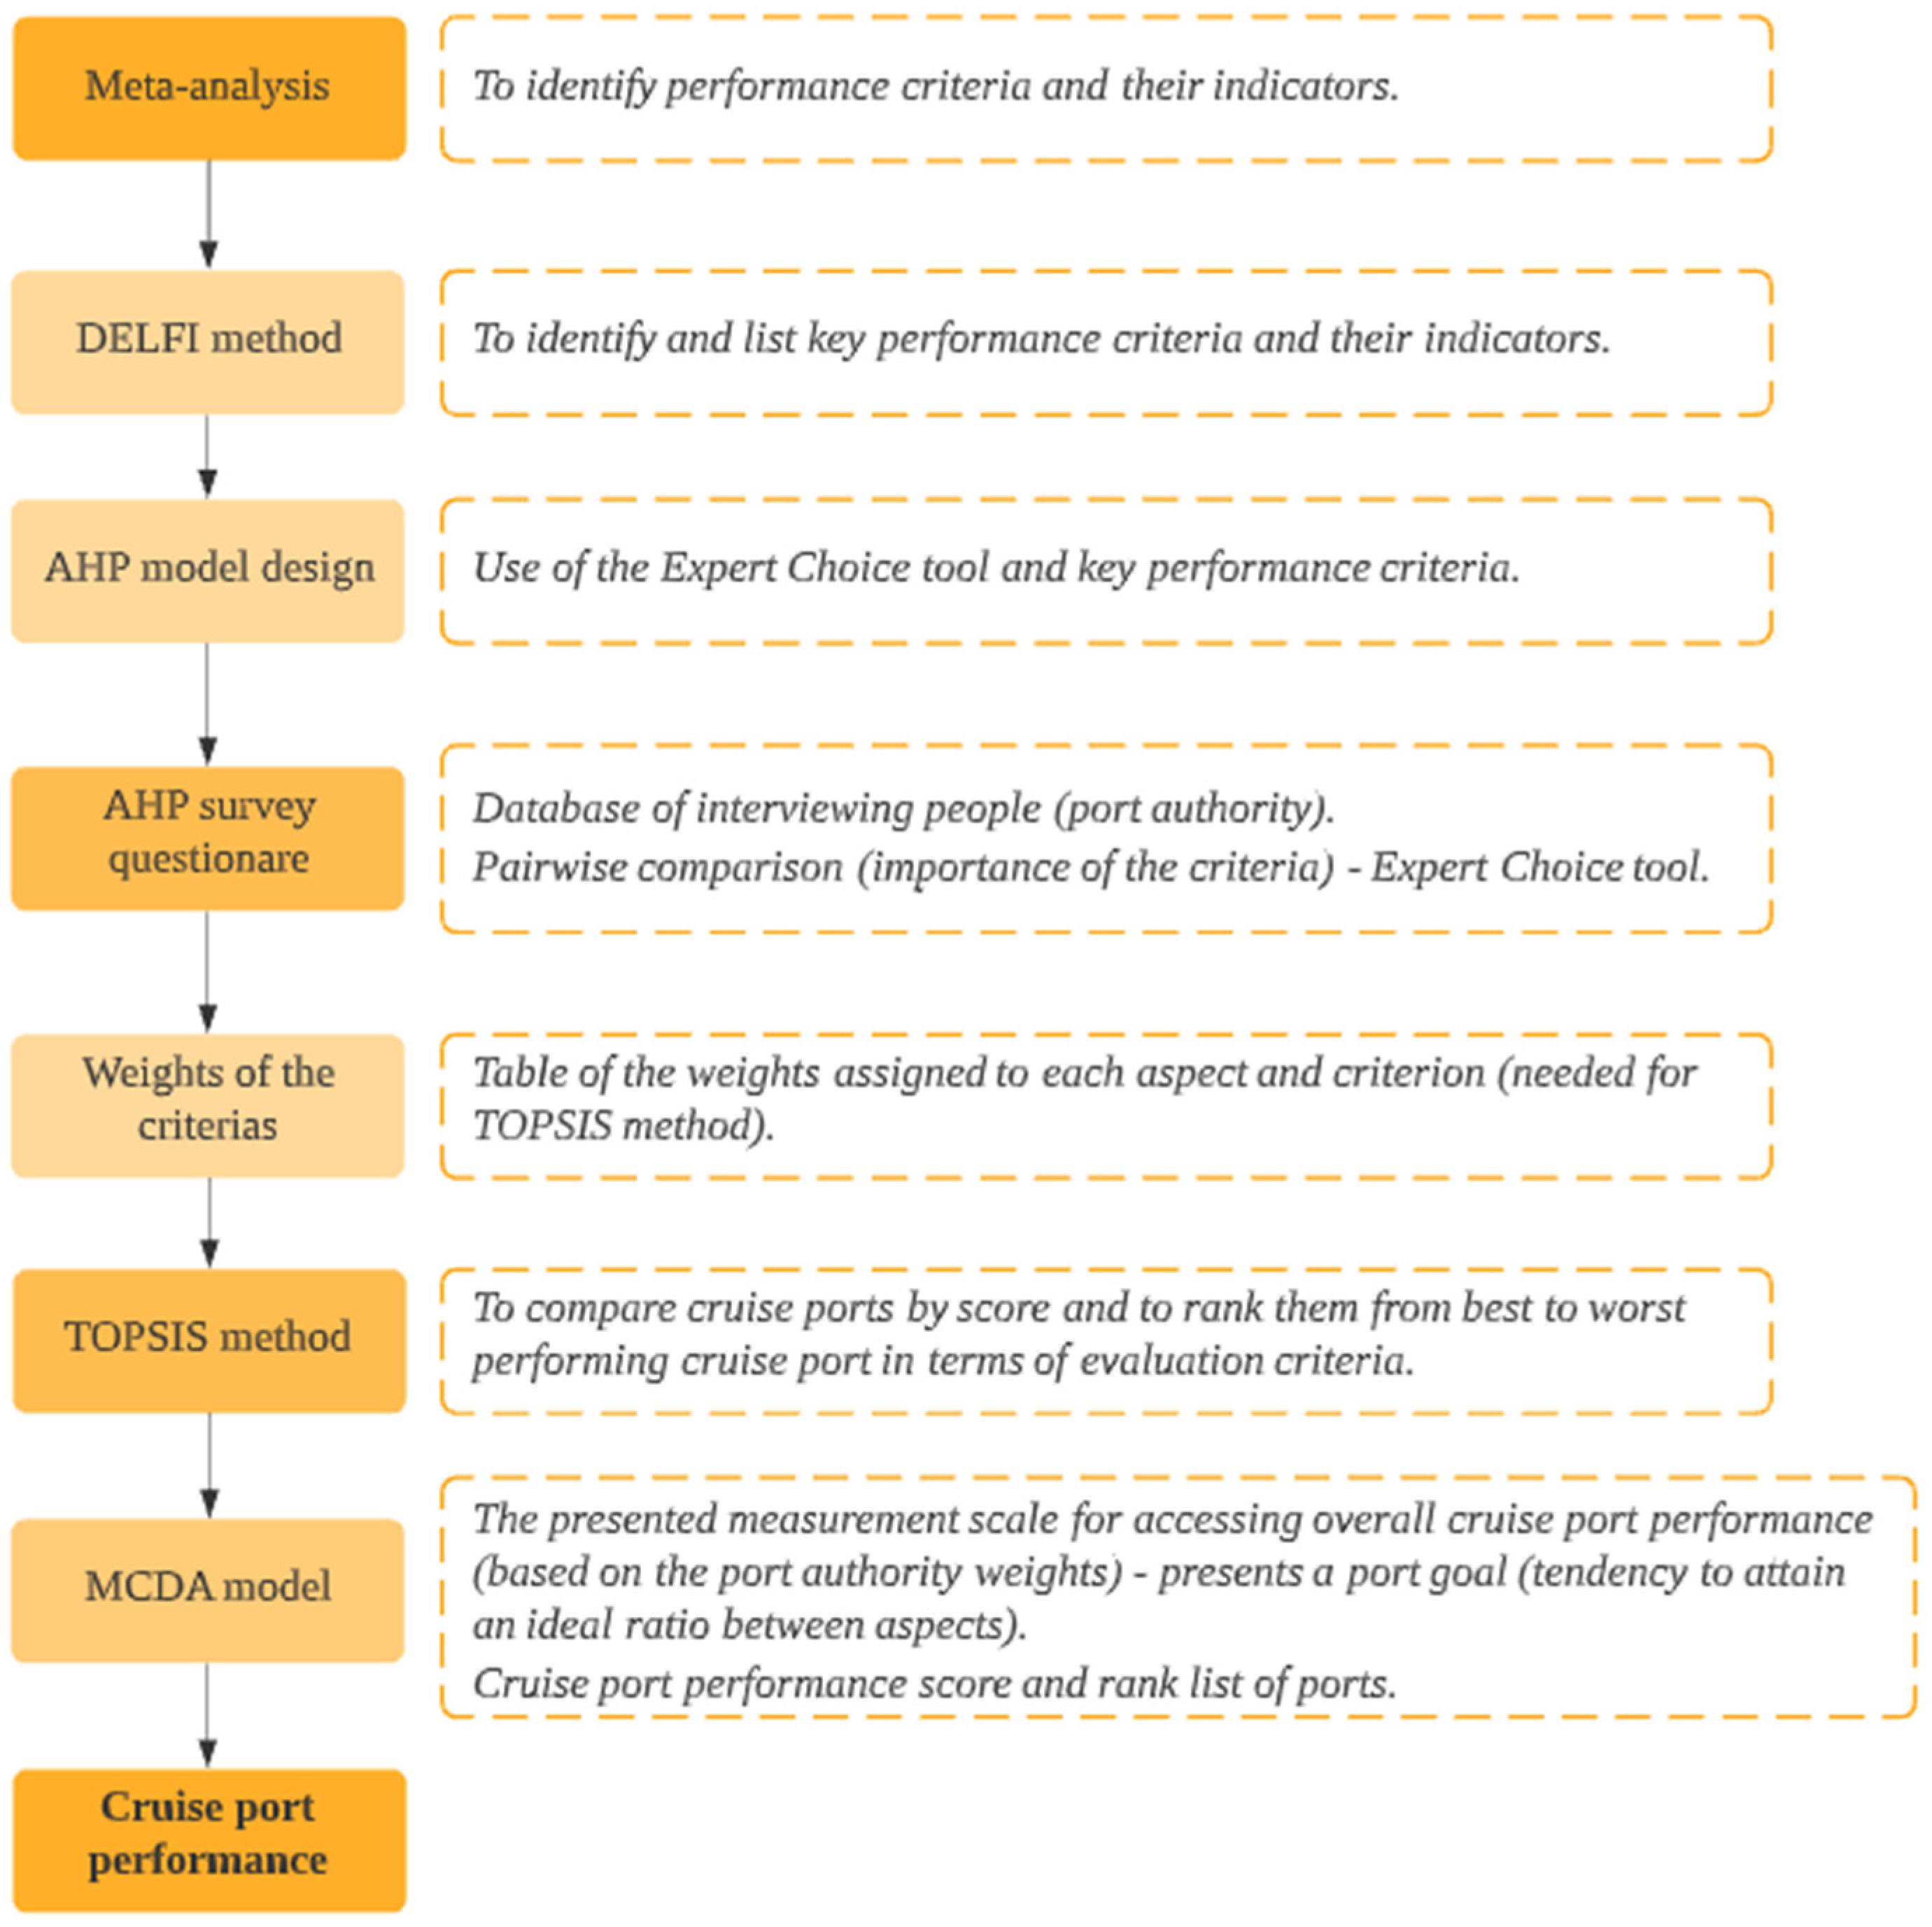
2.5. The Formulation and Application of the Multi-Criteria Decision-Making Model

In Section 2.1, we defined a hierarchy of criteria with four aspects and 11 criteria. The AHP technique divides aspects into levels or subsets of criteria, as shown in Figure 1.
The formula for evaluating the performance of a cruise port using a multi-criteria approach is as follows:
U = PT + VO + T + SE
where U is the performance assessment of the port passenger terminal, PT is the contribution of the traffic–technical criterion, VO is the contribution of the safety–environmental criterion, T is the contribution of the touristic criterion, and SE is the contribution of the socioeconomic criterion to the overall performance assessment.
Because the multi-criteria approach for evaluating cruise port performance is composed of individual criteria, it can also be written as:
U = (pt · Upt + do · Udo + in · Uin) + (on · Uon + zd · Uzd + va · Uva) +
(tz · Utz + ta · Uta) + (za · Uza + dp · Udp + pp · Upp)
where pt is the value of the traffic flow criterion, up is the value of the accessibility criterion, in is the value of the infrastructure criterion, on is the value of the pollution criterion, zd is the value of the health care criterion, va is the value of the safety and security criterion, tz is the value of the criterion of tourist amenity, ta is the value of the criterion of tourism attraction, za is the value of the criterion of employment, dp is the value of the criterion of direct income, and pp is the value of the criterion of port fees. Upt, Udo, …, Upp are the weights of the corresponding criteria.
To illustrate the path to access the cruise port performance through the proposed multi-criteria decision-making model, we present the following flow chart (Figure 2):

3. Case Study Application of the Proposed Multi-Criteria Decision-Making Model

The case study application is a suitable research strategy for our proposed model, as we wanted to study the implementation of the proposed model for port performance measurement. Using a case study method, we took a holistic view of the problem of the cruise port performance measurement. However, case studies, in contrast to surveys and experiments, rely on analytical rather than statistical generalizations. Whereas statistical generalization happens when results from a correct sample are extrapolated to larger samples, analytical generalization includes the application of a particular set of findings to a broader theory. Therefore, in this section we present an application of the proposed MCDA model to a case study to provide a holistic view of complexity of cruise port performance measurement.
In the case study application we included four Mediterranean ports: Barcelona, Piraeus, Civitavecchia, and Marseille. We were restricted to European cruise ports in the Mediterranean Sea, excluding cruise ports in the Ionian Sea, Adriatic Sea, and Black Sea, as well as North African cruise ports. The cruise ports included in the analysis were chosen based on their total Pax (passenger movement) ranking in 2018 (pre-COVID-19 situation) being the highest. Firstly, for the model application, we obtained the necessary data for each indicator of the proposed MCDA model for all four selected ports. From the AHP survey results, we acquired the weights of the indicators, which were needed for further analysis. Then, we determined the best practice criterion values among the four ports, which served as the basis for the TOPSIS method and the multi-criteria model. The results of the TOPSIS analysis demonstrate the cruise ports’ success in terms of the evaluation criteria. Secondly, we presented the measurement scale for assessing the cruise port performance, which is needed to calculate the actual port performance and the tendency of a cruise port to achieve the ideal ratio of ratings between aspects, as specified by port authorities using Equation (12) of the multi-criteria model.

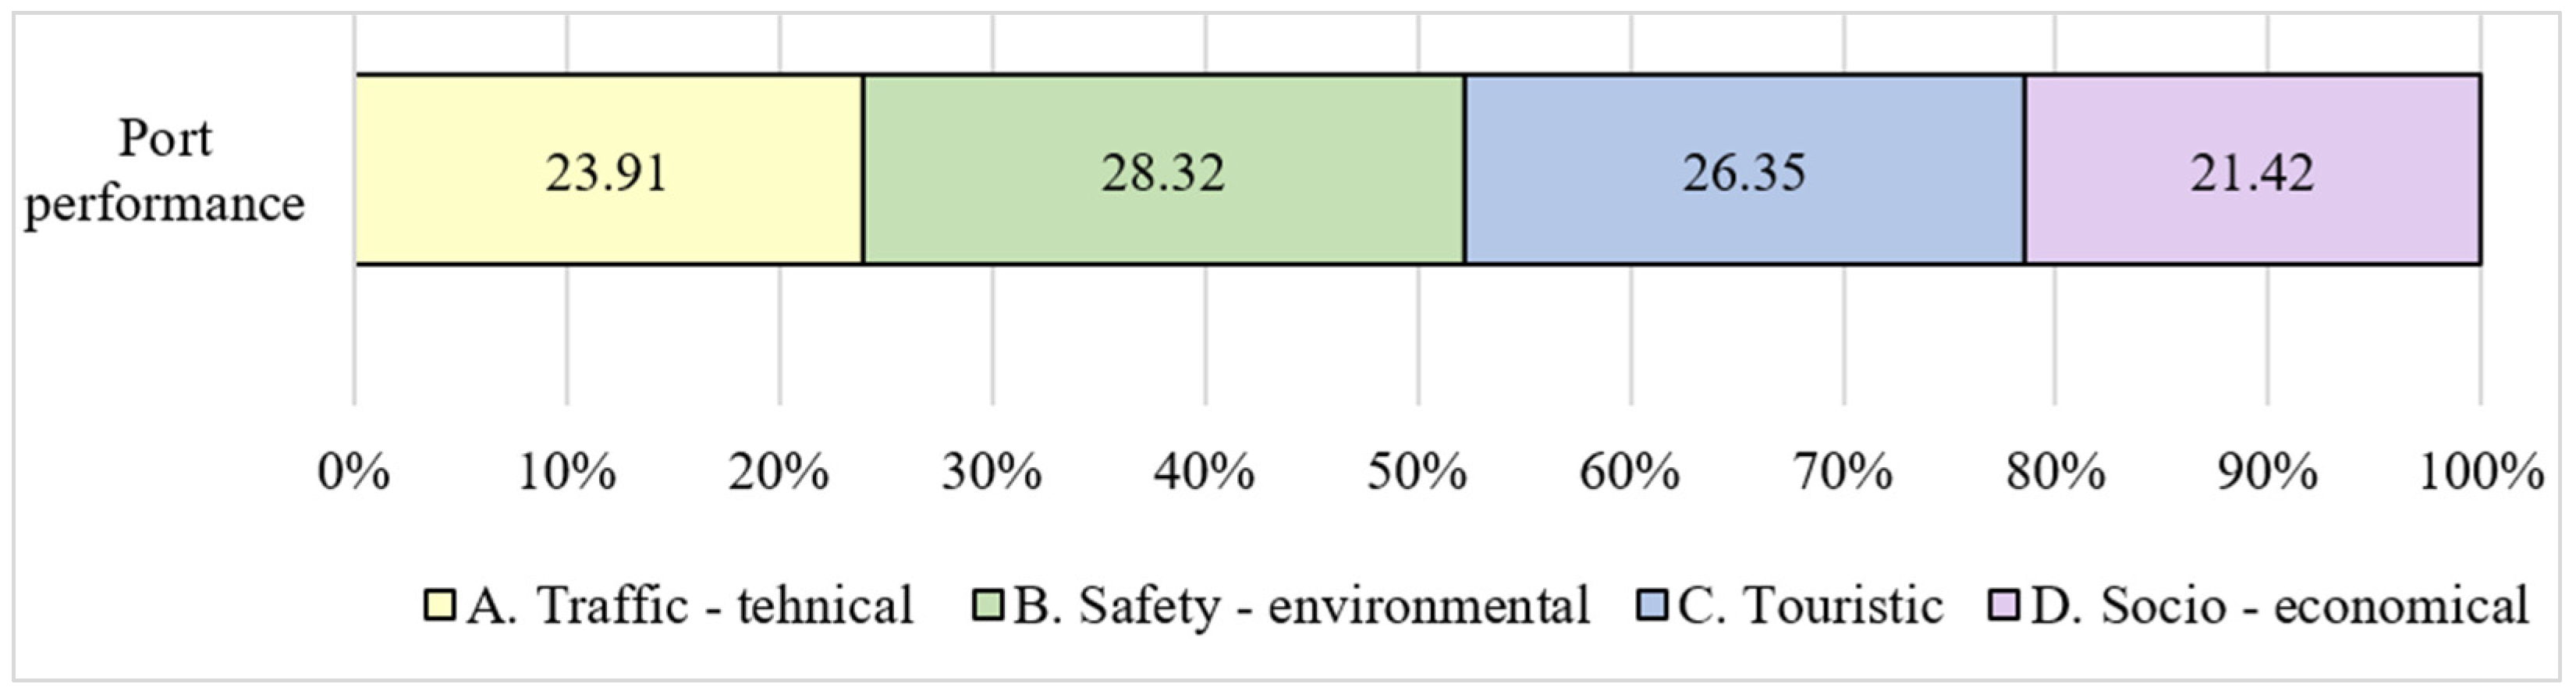
3.1. Analytic Hierarchy Process (AHP) and Weights of Performance Evaluation Criteria

We defined the AHP model and used the Expert Choice tool to attain the needed weights for the TOPSIS evaluation. Thomas L. Saaty created the AHP approach in the 1970s. He presented a detailed approach to quantifying the weights of decision criteria, with experts assessing the relative importance of criteria in a specially designed questionnaire using pairwise comparisons. According to [65], the relative relevance of criteria i and j is examined using a measuring scale ranging from 1 to 9 for all levels of the hierarchical model. A matrix of comparisons of the relevance of the criteria was created.
One of the AHP’s main disadvantages is that it creates trade-offs rather than weights. As a result, they are unhelpful in evaluating alternatives since they are unrelated to the main issue. Instead, they represent what is on the mind of the decision-makers. However, obtaining objective weights was challenging in our scenario, and we needed an expert’s judgment to produce weights and classify the criteria given by our conceptual framework (Figure 1); thus, we needed to apply AHP. We used the Expert Choice tool based on the AHP to produce subjective weights based on experts’ judgments (port authorities). The size of the expert group was included in the AHP analysis, and the number of included experts must usually exceed at least 10 people. Therefore, we selected 22 experts (presenting port authorities) from 22 different Mediterranean cruise ports. The profile of individual experts may be investigated, but the experts were selected based on their expertise (employment: cruise manager, cruise department, strategic planning) and on the suggestions of a member of the Board of Directors of the MedCruise Association.
In the transport sector, the application of Expert Choice for decision-making is limited. It is generally used in multi-criteria analyses and urban mobility decision-making, such as selecting optimal solutions for managing public transportation demand [53] or integrating public urban passenger transportation [66,67]. There was no evidence of any research using the AHP and Expert Choice to assess cruise port performance metrics (indicators).
The synthesis of local priority criteria to identify the global priorities of the criterion is the final step in the AHP method. The distribution method and the ideal method are used to synthesize the results. Normalization, which shares the outcomes of each alternative with just the best-rated alternative for each criterion, is used in the ideal method. The AHP method (later known as the distributive synthesis method) has a historical process that is based on a distribution method that accepts additive aggregation by normalizing the sum of local priorities according to the formula [68]:
p i = j w j · l i j
where pi is the global priority of alternative I, lij is the local priority of the indicator, and wj is the weight of criterion j.
We produced weights for each criterion for evaluating cruise port performance (Table 2) using the AHP method and the Expert Choice tool, which were then used in the implementation of the TOPSIS method. The weights (total estimations) for individual criteria were normalized using the TOPSIS method, resulting in the cruise port’s performance rating.
Table 2. The weight assigned to each criterion, expressed as a percentage and rank.
Criteria\WeightPort AuthoritiesRank
A. Traffic–technical aspect23.91
    1. Traffic flow6.389
    2. Accessibility7.198
    3. Infrastructure10.344
B. Safety–environmental aspect28.32
    4. Pollution6.2710
    5. Health care10.383
    6. Safety and security11.672
C. Touristic aspect26.35
    7. Tourism amenity7.306
    8. Tourism attraction19.051
D. Socioeconomic aspect21.42
    9. Employment9.185
    10. Direct income7.306
    11. Port fees4.9411
According to the distributive method of synthesis, Table 2 illustrates the weights or intensity of the estimations of each criterion. The more weight an aspect or criterion has, the more important that aspect or criterion is. When it comes to the total weight of port authorities’ assessments, the safety–environmental element was given the most weight. The tourism aspect came in second, followed by the traffic–technical aspect in third and the socioeconomic aspect in fourth.
For the reliability of the results, we conducted an analysis of the inconsistencies in judgments. The inconsistency ratio (CR) must be less than or equal to 0.1 (10%), according to [65], indicating that there is confidence in the judgments (data are consistent). For all judgements, we obtained an inconsistency check, whereby we calculated the inconsistency ratio (CR). The results show that judgments in the traffic–technical aspect had an average CR = 0.10, which means that the judgements were acceptable. The touristic aspect had an average CR = 0.001. The judgements of the safety–environmental and socioeconomic aspect had an average CR = 0.09. The results show that all the judgements could be used because the judgments had enough confidence.

3.2. The Technique of Order Preference Similarity to the Ideal Solution (TOPSIS)

TOPSIS is a multi-criteria decision analysis method that was initially proposed by [69] and has since been widely used by other academics. It assumes that the optimal option is the one that has the shortest distance from the positive ideal solution (PIS) and the farthest distance from the negative ideal solution (NIS) or anti-ideal solution [70]. TOPSIS compares alternatives by computing the geometric distance between alternatives and the ideal alternative, the best score in each criterion, and the weight of each criterion. The analysis allows us to create an efficient ranking of cruise ports.
The TOPSIS method may choose the best alternative from a decision matrix, which means that the best cruise port has the highest performance value. However, one problem occurs when computing the weightage of the criteria. From the TOPSIS method, we could not determine weights directly, so we used the analytic hierarchy process (AHP) to create a comparison matrix to evaluate the criteria. As a result, the TOPSIS evaluation is based on the weights obtained from the AHP survey. Based on this, we chose the cruise port with the best (highest) performance indicators. Table 3 shows the best indicator values obtained among the four selected ports, which served as the basis for the TOPSIS method and the multi-criteria model.
Table 3. Best practice indicator values used in the TOPSIS method for computing cruise port performance evaluation.
IndicatorParameterBest PracticesParameter Value
1.1 Number of cruise ship callsTotal number of cruise ship calls (home port, port of call).Barcelona830
1.2 Number of cruise passengersTotal number of cruise passengers (embarked, disembarked, and transit passengers). Barcelona3,041,963
2.1 Accessibility by public transportNumber of transit stops/stations within 2 km of the cruise terminal. Barcelona292
2.2 Accessibility by bike and walkingLength of pedestrian paths in a 2 km radius from the cruise terminal.Barcelona408.93
2.3 Accessibility by carNumber of parking lots within 2 km of the cruise terminal.Marseille14,546
3.1 Port passenger terminalNumber of the present passenger terminal, else 0.Barcelona7
3.2 Number of berthsTotal number of berths, else 0.Civitavecchia33
3.3 Cruise ship draftMaximum allowed draft of a cruise ship in port (meters). Civitavecchia18
4.1 Pollution indexSurvey results.Piraeus57.95
4.2 WasteThe amount of solid waste that the cruise port receives from cruise ships (tons).Piraeus64,381
5.1 Health careSurvey results.Marseille83.69
6.1 Crime indexSurvey results.Marseille56.96
7.1 Tourism amenityNumber of tourism amenities within 2 km of the cruise terminal. Barcelona3,982
8.1 Tourism attractionNumber of tourist attractions within 2 km of the cruise terminal. Barcelona549
9.1 EmploymentNumber of jobs in the region generated indirectly due to the cruise passengers.Barcelona5,476
10.1 Direct incomeCalculated expenditures of cruise passengers in the port city. Barcelona125.78
11.1 Port feesPort income from fees paid by the cruise ship for each passenger embarking, disembarking, and transiting at the port.Barcelona10.04
Table 3 shows the findings of the best practices, which reveal that Barcelona had the most high-value indicators. Barcelona had the most cruise traffic in 2018; it is the Mediterranean’s largest cruise port and the sixth largest in the world. Its success with cruise ship reception is due to its closeness to the city’s main tourist attractions, as indicated by the high values achieved for the spatial indicators.
The TOPSIS analysis is carried out in six steps [69,70]. The method’s sixth step is to rank the alternatives (ports) in decreasing order using S i j   ( i = 1 ,   m ) . The alternative (port) with the highest S i j is the best.
Table 4 demonstrates the cruise port’s success in terms of evaluation criteria. The greater the port’s rating, the more successful the cruise port is. Table 5 shows that, based on the selected parameters, the port of Barcelona was the most successful, followed by Marseille in second place. The ports of Civitavecchia and Marseille overtook Barcelona in terms of the traffic–technical aspects. In terms of the touristic and socioeconomic aspects, the port of Barcelona had the highest possible value (score 1). It needs to be noted that the port of Barcelona has significantly more touristic attractions and tourism amenities than the worst-performing port of Civitavecchia, which has only a few touristic attractions/amenities and presents a gateway port to the hinterland attractions. The score is based on the calculated relative proximity between those two ports, which is the longest distance from all analyzed pairs of ports. The longest geometric distance between these ports is calculated based on the number of tourism amenities and tourism attractions. The same analogy can be used to calculate the score of the socioeconomic aspects and others. If we compare Barcelona to other cruise ports not included in this study (for example, the port of Miami), we find that Barcelona does not perform so well (in terms of its touristic and socio-economic aspects), and it receives a lower score due to other ports performing better (having higher indicator values).
Figure 3 shows the results of the TOPSIS analysis from Table 4 graphically as a radar graph.
The criterion estimates for each analyzed port can be presented in the same way as the four aspects in Figure 3. Figure 4 shows the criteria that each port needs to improve in order to dominate the other cruise ports.

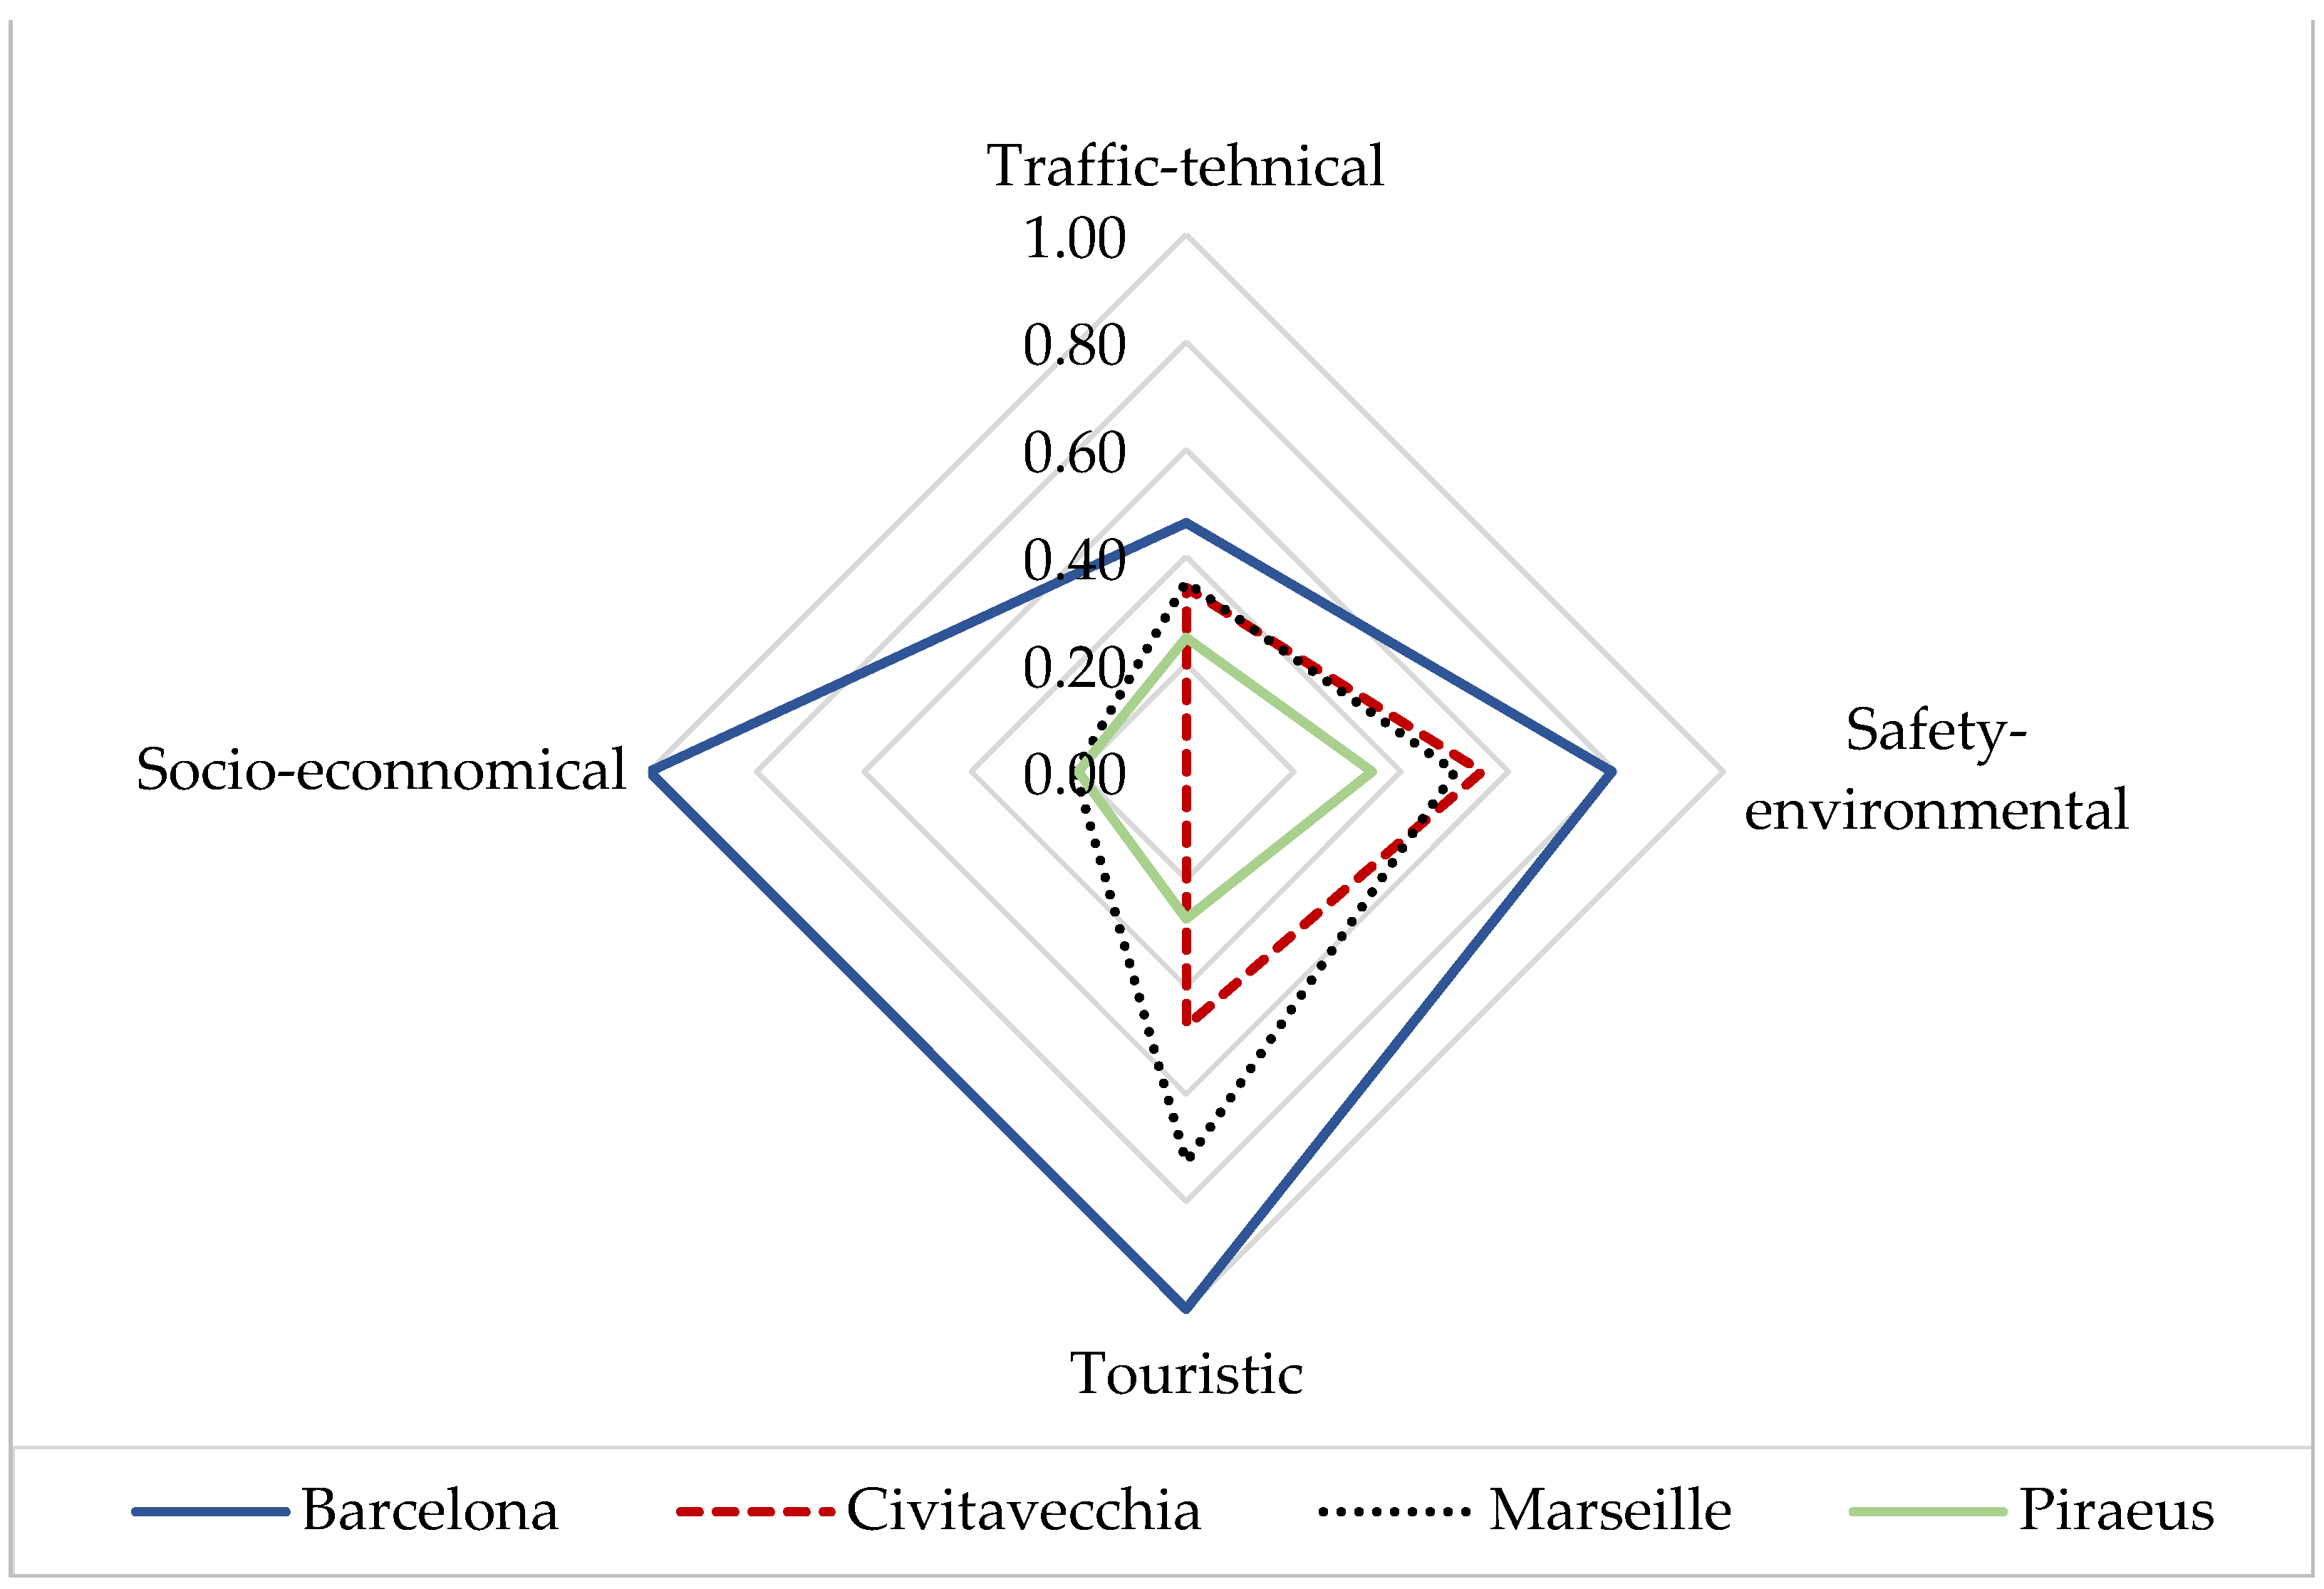
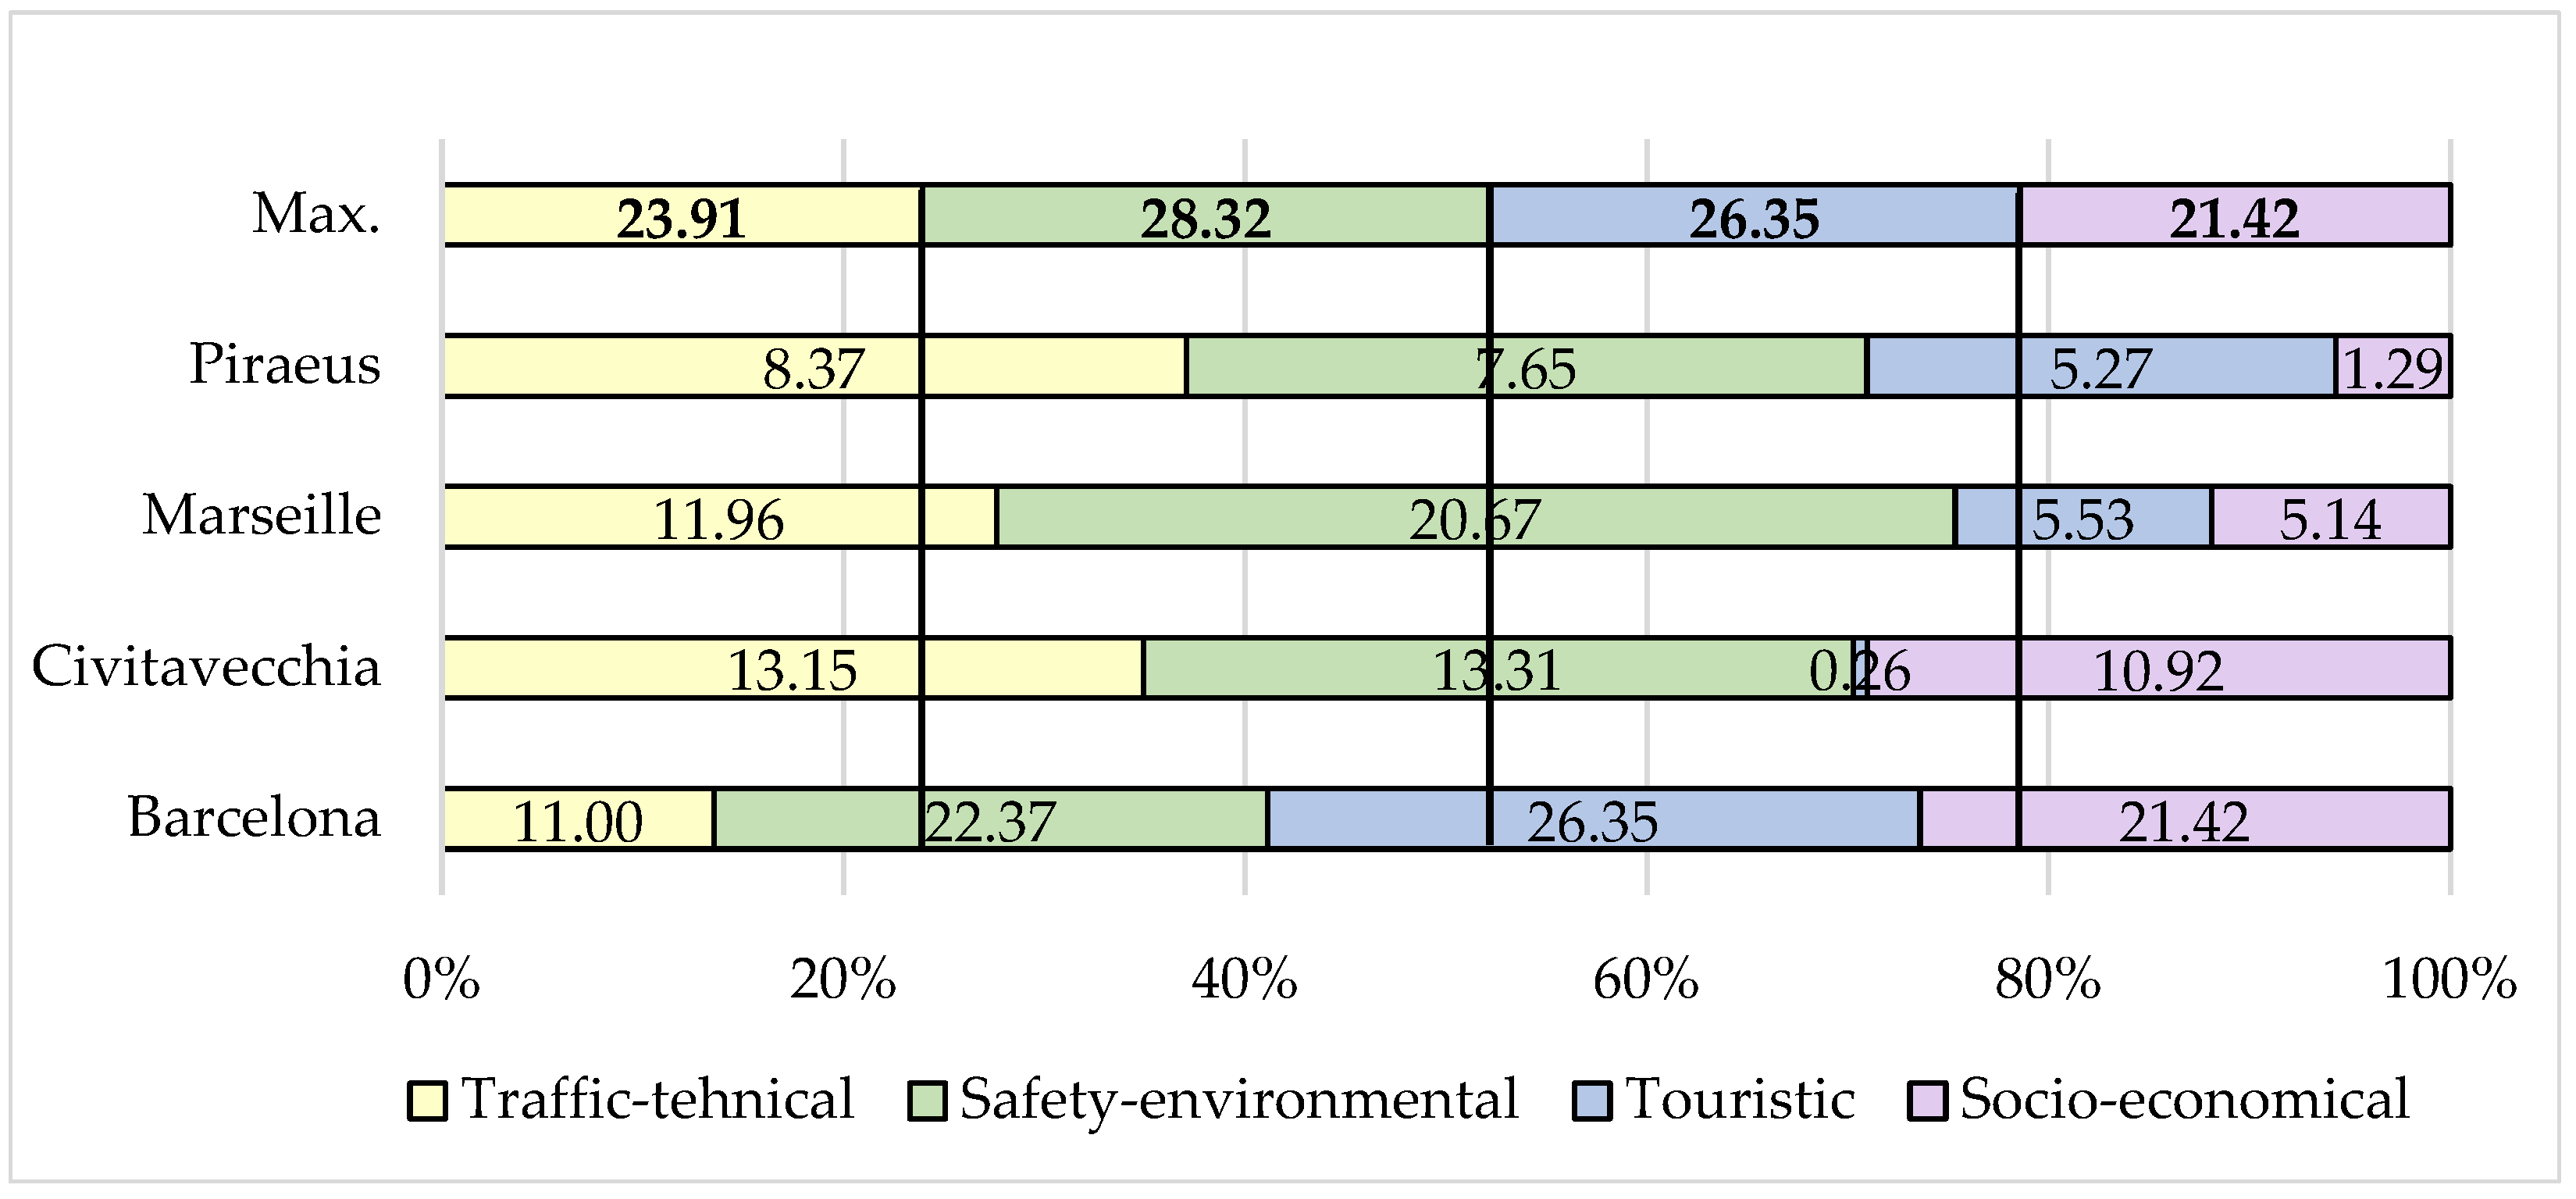
3.3. Measurement Scale of Cruise Port Performance and Case Study Results

What does Table 5 reveal to us? In terms of evaluation criteria, it shows how successful the cruise ports are. Is the best performance the one with the highest score in an aspect? Yes, when only one aspect is analyzed and compared. However, what if we compare all four aspects? What is the best balance of all aspects for a cruise port to succeed and perform at its best? We must achieve the best possible balance between all four aspects to answer these questions. In this case, we used the weights (port authority) of the aspects from the AHP survey (Table 2) to develop the measurement scale for evaluating a cruise port’s performance (Figure 5).
Figure 5 shows the port performance scale based on aspect evaluations and the port authority’s overall evaluation of the cruise port. These values show the best estimate ratio between port evaluation aspects (representing the target for ports). The port evaluation in terms of aspects highlights the port’s advantages and where it should be improved. In addition, what activities should the port take on to improve its performance (competitive position)?
Figure 6 shows that the port of Barcelona performs like the port authority’s expectations in terms of tourism and socio-economic development. The traffic–technical aspect (criteria) and safety–environmental aspect of the port of Barcelona were identified as disadvantages. If the port wants to become more efficient and competitive, it must concentrate its efforts on these two aspects.
Now we could calculate the actual port performance on the tendency of a cruise port for an ideal ratio of ratings between aspects, as specified by port authorities, using the formula of the multi-criteria model for assessing the performance of cruise ports U = PT + VO + T + SE. This method was used to determine the sum of percentages from Figure 6, and as a result the overall port performance estimate was represented as a percentage of cruise port performance (Table 6). Table 6 shows the final performance rating of the evaluated cruise ports. It should be mentioned that Barcelona was the most successful port in terms of its tendency to attain an ideal ratio between aspects. Marseille was in second and Civitavecchia was in third place regarding their performance scores.

3.4. Comparison of the Proposed MCDA Method with a Recent State-of-the-Art Method

Among the MCDA methods, AHP is obviously one of the most sophisticated and functional approaches for various selection and ranking problems. As a result, we compared our model for port performance evaluation, which utilizes the AHP and TOPSIS weighting method, to a novel approach [29] using the MCDA best–worst method (BWM). The referenced research focused on two extensions: measuring port performance and choosing a port. The authors developed a methodology for measuring port performance from the perspective of port choice, which includes hinterland performance and a weighting of indicators from a port choice perspective. For weighting port performance indicators selected from a literature review, they proposed the best–worst method (BWM). The weighting of port performance indicators is based on the survey participants’ score, which is attained via pairwise comparisons. When the consistency ratio (CR) is between 0 and 1 (max 10%), as it was for AHP in our paper, it is acceptable in the BWM method. The BWM method, in comparison to the AHP method, provides higher consistency for a large number of pairwise comparisons among a large number of decision criteria. However, in our model there are small clusters of pairwise comparisons, and judgment consistency is sufficient. As a result, the BWM was not necessary for our purposes. Nonetheless, the BWM has a significant practical benefit over AHP since the evaluation phase is less demanding, whereas AHP covers all possible pairwise comparisons among the decision attributes. Thus, AHP provides more information on the relation of the attribute pairs than BWM. As a result, we used the AHP approach to define the relative weights of the evaluation criteria in our paper, as well as the TOPSIS method to calculate cruise port rankings. Another disadvantage of the compared paper can be exposed here, which is the number of respondents for the BWM survey, which implies that the generalizability of the weights obtained for the decision criteria is limited. The paper had a 9.5% response rate, whereas in our paper we had a 38.6% response rate by stakeholders (port authorities).
However, some similarities may be seen between these two papers. Both the AHP and BWM methods use a scale with only integers for pairwise comparisons, avoiding the problem of an imbalanced scale. The BWM model calculates the total performance score as the sum of the weighted scores of the set of criteria, like our MCDA model with the application of the proposed measurement scale of cruise port performance. The higher the overall score for an alternative, the higher the performance of that alternative, so the analogy is the same in our model.
The advantages of our proposed MCDA model are its broader usability in the transport sector and for decision-making in projects, investments, management, etc. This can be attributed to its simple utility and method. Based on the proposed model results and the comparison, we can conclude that the proposed MCDA method can effectively compete with other multi-criteria models for port performance evaluation. However, our method has some limitations and weaknesses: (1) The obtained weights could change after the COVID-19 pandemic, hence the need for a new evaluation (changing priorities), and (2) experts’ (port authority) evaluations are based only on Mediterranean ports.

4. Conclusions

Assessing the performance of a cruise port is critical when making decisions and strategizing about the port’s future development. This is true because evaluating port performance may reveal whether the port is following the strategy and the goals of the port. The criteria can reveal how successful the port is in doing so. Therefore, in this paper, we proposed a multi-criteria model to evaluate the performance of a cruise port, whereby terminal operators can analytically assess the port performance from multiple perspectives, extract competitive advantages, and determine which actions are required to make the cruise port more competitive and successful. Moreover, the multi-criteria model results can indicate which actions must be taken to optimize port development and performance.
The case study provided in the paper provides some implications and suggestions for the port authority to provide a port performance assessment and to improve the attractiveness of the port, which also influences the competitiveness of the port. The results of the case study show that the safety–environmental aspect is the most considerable criterion when assessing port performance. This was confirmed through the case study application, wherein the best-performing port had the best score in the safety–environmental aspect, and the second-place port had the second score in the same aspect. The second most important criterion was the touristic aspect, and third was the socioeconomic aspect. The port authorities concluded that the traffic–technical aspect is the least important aspect of the four.
In this paper, we combined two methods, the AHP and TOPSIS methods, in a model for assessing cruise port performance. There have been no reports in this field that utilize TOPSIS to rank cruise ports based on AHP weights. As a result, we chose to apply TOPSIS analysis to assess port performance and compare cruise ports using a ranking list. The significance of combining the AHP and TOPSIS methods into one MCDA and the benefits and drawbacks of our proposed model were shown in comparison to a state-of-the-art publication. The addition of the weights, in combination with the TOPSIS and presented measurements scale for assessing cruise port performance, provides a new and more complete view of port performance assessments that may be considered representative of the port authorities’ views.
When comparing the proposed model to a state-of-the-art paper, we discovered that our model can successfully cope with various multi-criteria models for port performance evaluation, as was shown by a comparison of the proposed model outcomes and those of another method.
In terms of future research, the importance of each of the 11 criteria in relation to the port performance measurement should be analyzed in detail, and the assessment of the weights needs to be newly determined, as the weights of the criteria could change due to political, health, economic, and other factors affecting the cruise industry. Furthermore, the proposed MCDA model can be used to compare other cruise ports that were not analyzed in this paper and that are in a competitive position with those ports. Thus, is recommended that we compare ports in competitive relationships, e.g., home port with home port and port of call with port of call. However, the model can still be used for comparisons between a port of call and a home port and vice versa. Therefore, an analysis of other competitive ports in the Mediterranean region that were not analyzed in this paper should be undertaken.

Author Contributions

Conceptualization, V.L., E.T. and M.L.; methodology V.L., E.T. and M.L.; writing—original draft preparation, V.L. All authors have read and agreed to the published version of the manuscript.

Funding

This research received no external funding.

Informed Consent Statement

Informed consent was obtained from all subjects involved in the study.

Conflicts of Interest

The authors declare no conflict of interest.

References

  1. MedCruise. MedCruise Statistic Report 2019. 2020. Available online: http://www.medcruise.com/ (accessed on 18 February 2022).
  2. Wang, Y.; Jung, K.-A.; Yeo, G.-T.; Chou, C.-C. Selecting a cruise port of call location using the fuzzy-AHP method: A case study in East Asia. Tour. Manag. 2014, 42, 262–270. [Google Scholar] [CrossRef]
  3. Pallis, A. Working Paper: Cruise Shipping and Urban Development: State of the at of the Industry and Cruise Ports; No. 2015-14; OECD: Paris, France, 2015. [Google Scholar]
  4. Rodrigue, J.-P.; Notteboom, T. The geography of cruises: Itineraries, not destinations. Appl. Geogr. 2013, 38, 31–42. [Google Scholar] [CrossRef]
  5. Rodrigue, J.-P.; Notteboom, T. The geography of cruise shipping: Itineraries, capacity deployment and ports of call. In Proceedings of the International Association of Maritime Economists (IAME) 2012 Conference, Taipei, Taiwan, 5–8 September 2012; pp. 6–8. [Google Scholar]
  6. Marti, B.E. Shift-share analysis and port geography: A New England example. Marit. Policy Manag. 1982, 9, 241–250. [Google Scholar] [CrossRef]
  7. Notteboom, T.E. Concentration and load centre development in the European container port system. J. Transp. Geogr. 1997, 5, 99–115. [Google Scholar] [CrossRef]
  8. Esteve-Perez, J.; Garcia-Sanchez, A. Dynamism Patterns of Western Mediterranean Cruise Ports and the Coopetition Relationships Between Major Cruise Ports. Pol. Marit. Res. 2018, 25, 51–60. [Google Scholar] [CrossRef] [Green Version]
  9. Vaio, A.D.; Medda, F.; Trujillo, L. An analysis of the efficiency of italian cruise terminals. Int. J. Transp. Econ. 2011, 38, 1000–1018. [Google Scholar]
  10. Dowling, R.; Weeden, C. Cruise Ship Tourism, 2nd ed.; CABI: Oxfordshire, UK, 2017. [Google Scholar]
  11. Monpanthong, P. Efficiency of Cruise Port Management: A Comparison of Phuket and Singapore. Pertanika J. Soc. Sci. Humanit. 2018, 26, 22. [Google Scholar]
  12. Vaggelas George, K. Measurement of port performance from users’ perspective. Marit. Bus. Rev. 2019, 4, 130–150. [Google Scholar] [CrossRef]
  13. Kofjač, D.; Škurić, M.; Dragović, B.; Škraba, A. Traffic Modelling and Performance Evaluation in the Kotor Cruise Port. Stroj. Vestn.-J. Mech. Eng. 2013, 9, 526–535. [Google Scholar] [CrossRef]
  14. Lorenčič, V.; Twrdy, E.; Giuffrida, N.; Ignaccolo, M.; Inturri, G. Measuring and evaluating the performance of cruise ports with a multicriteria approach. In Proceedings of the 19th International Conference on Transport Science, Portoroz, Slovenia, 17–18 September 2020; Zanne, M., Bajec, P., Twrdy, E., Eds.; Faculty of Maritime Studies and Transport: Portoroz, Slovenia, 2020; pp. 185–192. [Google Scholar]
  15. Martel, J.-M.; Matarazzo, B. Other Outranking Approaches. In Multiple Criteria Decision Analysis: State of the Art Surveys; Figueira, J., Greco, S., Ehrogott, M., Eds.; Springer: New York, NY, USA, 2005; pp. 197–259. [Google Scholar] [CrossRef]
  16. Demirel, N.Ç.; Yücenur, G.N. The Cruise Port Place Selection Problem with Extended VIKOR and ANP Methodologies under Fuzzy Environment. In Proceedings of the World Congress on Engineering 2011, London, UK, 6–8 July 2011. [Google Scholar]
  17. Wudhikarn, R. Improving the intellectual capital management approach using the hybrid decision method. J. Intellect. Cap. 2018, 19, 670–691. [Google Scholar] [CrossRef]
  18. Samiappan, S.; Shamaskin, A.; Liu, J.; Linhoss, A.; Evans, K. Strategic Conservation of Gulf Coast Landscapes Using Multi-Criteria Decision Analysis and Open Source Remote Sensing and GIS Data. In Proceedings of the IGARSS 2020—2020 IEEE International Geoscience and Remote Sensing Symposium, Waikoloa, HI, USA, 26 September–2 October 2020; IEEE: Piscataway Township, NJ, USA, 2020; pp. 6662–6665. [Google Scholar]
  19. Zhang, R.; Yang, S.; Zhang, Q.; Xu, L.; He, Y.; Zhang, F. Graph-based few-shot learning with transformed feature propagation and optimal class allocation. Neurocomputing 2021, 470, 247–256. [Google Scholar] [CrossRef]
  20. Lee, P.; Yang, Z. Multi-Criteria Decision Making in Maritime Studies and Logistics; Applications and Cases; Springer: Berlin/Heidelberg, Germany, 2018. [Google Scholar]
  21. Kang, S.; Lee, S.M. A Policy Decision Process for Construction of Public Transportation City Model: Case Study of Jeju, Korea. In Proceedings of the 2007 International Conference on Multimedia and Ubiquitous Engineering (MUE’07), Seoul, Korea, 26–28 April 2007; pp. 477–483. [Google Scholar]
  22. Niaraki, A.S.; Kim, K. Ontology based personalized route planning system using a multi-criteria decision making approach. Expert Syst. Appl. 2009, 36, 2250–2259. [Google Scholar] [CrossRef]
  23. Sharifi, M.A.; Boerboom, L.; Shamsudin, K.B.; Veeramuthu, L. Spatial multiple criteria decision analysis in integrated planning for public transport and land use development study in Klang Valley, Malaysia. In Proceedings of the ISPRS Technical Commission II Symposium, Vienna, Austria, 12–14 July 2006; pp. 12–14. [Google Scholar]
  24. Olba, X.B.; Daamen, W.; Vellinga, T.; Hoogendoorn, S.P. Multi-criteria evaluation of vessel traffic for port assessment: A case study of the Port of Rotterdam. Case Stud. Transp. Policy 2019, 7, 871–881. [Google Scholar] [CrossRef]
  25. Qureshi, M.R.; Kumar, P.; Kumar, D. Framework for benchmarking logistics performance using fuzzy AHP. Int. J. Bus. Perform. Supply Chain Model. 2009, 1, 82. [Google Scholar] [CrossRef]
  26. Gerçek, H.; Karpak, B.; Kılınçaslan, T. A multiple criteria approach for the evaluation of the rail transit networks in Istanbul. Transportation 2004, 31, 203–228. [Google Scholar] [CrossRef]
  27. Lambas, M.E.L.; Giuffrida, N.; Ignaccolo, M.; Inturri, G. Comparison between bus rapid transit and light-rail transit systems: A multi-criteria decision analysis approach. Urban Transp. XXIII 2017, 176, 143. [Google Scholar]
  28. Macharis, C.; Bernardini, A. Reviewing the use of Multi-Criteria Decision Analysis for the evaluation of transport projects: Time for a multi-actor approach. Transp. Policy 2015, 37, 177–186. [Google Scholar] [CrossRef]
  29. Rezaei, J.; Palthe, L.V.W.; Tavasszy, L.; Wiegmans, B.; Van Der Laan, F. Port performance measurement in the context of port choice: An MCDA approach. Manag. Decis. 2019, 57, 396–417. [Google Scholar] [CrossRef] [Green Version]
  30. Ha, M.-H.; Yang, Z. Comparative analysis of port performance indicators: Independency and interdependency. Transp. Res. Part A Policy Pract. 2017, 103, 264–278. [Google Scholar] [CrossRef]
  31. Theo, N.; Athanasios, P.; Jean-Paul, R. Port Economics, Management and Policy, 1st ed.; Routledge: London, UK, 2022; p. 690. [Google Scholar]
  32. Baird, A.J. An investigation into the suitability of an enclosed seaport for cruise ships the case of Leith. Marit. Policy Manag. 1997, 24, 31–43. [Google Scholar] [CrossRef]
  33. Lorenčič, V.; Twrdy, E.; Batista, M. Development of Competitive—Cooperative Relationships among Mediterranean Cruise Ports since 2000. J. Mar. Sci. Eng. 2020, 8, 374. [Google Scholar] [CrossRef]
  34. Sciozzi, D.; Jugović, T.P.; Jugović, A. Structural analysis of cruise passenger traffic in the world and in the Republic of Croatia. Pomorstvo 2015, 29, 8–15. [Google Scholar]
  35. Maiorov, N.; Fetisov, V. Improvement of the quality of the sea passenger terminal based on methods of forecasting. Naše More 2018, 65, 135–140. [Google Scholar] [CrossRef]
  36. Lorenčič, V.; Twrdy, E. Forecasting cruise passenger demand in Mediterranean cruise ports. In Proceedings of the International Conference of Maritime Science & Technology Naše More 2019, Dubrovnik, Croatia, 17–18 October 2019; Maritime Department, University of Dubrovnik: Dubrovnik, Croatia, 2019. [Google Scholar]
  37. Çuhadar, M.; Cogurcu, I.; Kukrer, C. Modelling and Forecasting Cruise Tourism Demand to Izmir by Different Artificial Neural Network Architectures. Int. J. Bus. Soc. Res. 2014, 4, 12–28. [Google Scholar]
  38. Lekakou, M.; Pallis, A.; Vaggelas, G. Which homeport in Europe: The cruise industry’s selection criteria. Tourismos 2009, 4, 215–240. [Google Scholar]
  39. Papachristou, A.A.; Pallis, A.A.; Vaggelas, G.K. Cruise home-port selection criteria. Res. Transp. Bus. Manag. 2020, 100584, (Available online 6 November 2020, in press, Corrected Proof). [Google Scholar] [CrossRef]
  40. Lohvinenko, V.; Rossolov, A. Evaluation of Transport Accessibility of the Public Transport Network on the Basis of Stop Points Parametrization; Cracow University of Technology: Krakow, Poland, 2019. [Google Scholar]
  41. Iacono, M.; Krizek, K.J.; El-Geneidy, A. Measuring non-motorized accessibility: Issues, alternatives, and execution. J. Transp. Geogr. 2010, 18, 133–140. [Google Scholar] [CrossRef] [Green Version]
  42. Tawes, K. Duluth Superior cruise ship terminal facility study. In Preliminary Site Assessment for the Arrowhead Regional Development Commission Duluth Superior Metropolita Interstate Council (ARDC/MIC); ARDC/MIC: Duluth, MN, USA, 2013; Available online: https://dsmic.org/wp-content/uploads/2017/01/Duluth-Superior-Cruise-Ship-Terminal-Study.pdf (accessed on 14 February 2022).
  43. Marti, B.E. Geography and the cruise ship port selection process. Marit. Policy Manag. 1990, 17, 157–164. [Google Scholar] [CrossRef]
  44. Paiano, A.; Crovella, T.; Lagioia, G. Managing sustainable practices in cruise tourism: The assessment of carbon footprint and waste of water and beverage packaging. Tour. Manag. 2020, 77, 104016. [Google Scholar] [CrossRef]
  45. Asero, V.; Skonieczny, S. Cruise Tourism and Sustainability in the Mediterranean. Destination Venice. In Mobilities, Tourism and Travel Behavior—Contexts and Boundaries; InTechOpen Limited: London, UK, 2018. [Google Scholar] [CrossRef] [Green Version]
  46. Carić, H. Direct pollution cost assessment of cruising tourism in the Croatian Adriatic. Financ. Theory Pract. 2010, 34, 161–180. [Google Scholar]
  47. Toscano, D.; Murena, F. Atmospheric ship emissions in ports: A review. Correlation with data of ship traffic. Atmos. Environ. X 2019, 4, 100050. [Google Scholar] [CrossRef]
  48. Numbeo. 2020. Available online: https://www.numbeo.com/ (accessed on 14 February 2022).
  49. Johnson, D. Environmentally sustainable cruise tourism: A reality check. Mar. Policy 2002, 26, 261–270. [Google Scholar] [CrossRef]
  50. Butt, N. The impact of cruise ship generated waste on home portsand ports of call: A study of Southampton. Mar. Policy 2007, 31, 591–598. [Google Scholar] [CrossRef]
  51. Slišković, M.; Ukić, H.; Božić, K. Assessment of Solid Waste from Cruise Ships in the Port of Split. Trans. Marit. Sci. 2016, 5, 155–160. [Google Scholar] [CrossRef] [Green Version]
  52. Presburger Ulniković, V.; Vukić, M.; Milutinović-Nikolić, A. Analysis of solid waste from ships and modeling of its generation on the river Danube in Serbia. Waste Manag. Res. 2013, 31, 618–624. [Google Scholar] [CrossRef]
  53. Seabra, F.; Beck, A.L.; Manfredini, D.; Muller, M. Do Tourist Attractions of An Itinerary Pull Cruise Ship Lines? A Logit Model Estimation for Southern Hemisphere Destinations. Tour. Plan. Dev. 2019, 17, 37–45. [Google Scholar] [CrossRef]
  54. Lau, Y.-Y.; Yip, T.L. The Asia cruise tourism industry: Current trend and future outlook. Asian J. Shipp. Logist. 2020, 36, 202–213. [Google Scholar] [CrossRef]
  55. Pesce, M.; Terzi, S.; Al-Jawasreh, R.I.M.; Bommarito, C.; Calgaro, L.; Fogarin, S.; Russo, E.; Marcomini, A.; Linkov, I. Selecting sustainable alternatives for cruise ships in Venice using multi-criteria decision analysis. Sci. Total Environ. 2018, 642, 668–678. [Google Scholar] [CrossRef] [PubMed]
  56. CLIA. Reports—Cruise Industry Outlook; State of the Industry; CLIA: London, UK, 2019. [Google Scholar]
  57. Commission, E. Tourist Facilities in Ports. The Economic Factor. 2009, Directorate-General for Maritime Affairs and Fisheries; Policy Research Corporation: Rotterdam, The Netherlands, 2009; p. 65. [Google Scholar]
  58. Brida, J.G.; Scuderi, R. Determinants of tourist expenditure: A review of microeconometric models. Tour. Manag. Perspect. 2013, 6, 28–40. [Google Scholar] [CrossRef] [Green Version]
  59. Brida, J.G.; Zapata, S. Cruise tourism: Economic, socio-cultural and environmental impacts. Int. J. Leis. Tour. Mark. 2010, 1, 205. [Google Scholar] [CrossRef]
  60. Chase, G.; Alon, I. Evaluating the Economic Impact of Cruise Tourism: A Case Study of Barbados. Anatolia 2002, 13, 5–18. [Google Scholar] [CrossRef]
  61. Vayá, E.; Garcia, J.R.; Murillo, J.; Romaní, J.; Suriñach, J. Economic impact of cruise activity: The case of Barcelona. J. Travel Tour. Mark. 2018, 35, 479–492. [Google Scholar] [CrossRef]
  62. Stefanidaki, E.; Lekakou, M. Generated Economic Impact on Cruise Destinations: The Piraeus Case. In Cruise Tourism and Society; A Socioeconomic Perspective; Springer: Berlin/Heidelberg, Germany, 2012; pp. 69–84. [Google Scholar]
  63. Papadopoulou, G.; Sambracos, E. Recent Evolution of Cruise Activities in European Ports of Embarkation: A Quantitative and Economic Approach; University Library of Munich: Munich, Germany, 2014. [Google Scholar]
  64. Douglas, N.; Douglas, N. Cruise ship passenger spending patterns in Pacific Island Ports. Int. J. Tour. Res. 2004, 6, 251–261. [Google Scholar] [CrossRef]
  65. Saaty, T.L. Relative measurement and its generalization in decision making why pairwise comparisons are central in mathematics for the measurement of intangible factors the analytic hierarchy/network process. RACSAM-Rev. Real Acad. Cienc. Exactas Fis. Nat. Ser. A Mat. 2008, 102, 251–318. [Google Scholar] [CrossRef]
  66. Higashi, O. Analytic Hierarchy Process for Evaluation of Public Transport Policy Design in Phnom Penh City. Proc. East. Asia Soc. Transp. Stud. 2013, 9, 17. [Google Scholar]
  67. Nosal, K.; Solecka, K. Application of AHP Method for Multi-criteria Evaluation of Variants of the Integration of Urban Public Transport. Transp. Res. Procedia 2014, 3, 269–278. [Google Scholar] [CrossRef] [Green Version]
  68. Ishizaka, A.; Nemery, P. Multi-Criteria Decision Analysis: Methods and Software; John Wiley & Sons: Hoboken, NJ, USA, 2013. [Google Scholar]
  69. Hwang, C.-L.; Yoon, K. Multiple Attribute Decision Making: Methods and Applications; Springer: New York, NY, USA, 1981. [Google Scholar]
  70. Acuña-Soto, C.; Liern, V.; Pérez-Gladish, B. Normalization in TOPSIS-based approaches with data of different nature: Application to the ranking of mathematical videos. Ann. Oper. Res. 2021, 296, 541–569. [Google Scholar] [CrossRef]
Figure 1. Aspects and criteria for evaluating cruise port performance.
Sustainability 14 04181 g001
Figure 2. Workflow chart for assessing cruise port performance.
Sustainability 14 04181 g002
Figure 3. Radar chart for final TOPSIS results for the four aspects considered.
Sustainability 14 04181 g003
Figure 4. Radar chart for final TOPSIS results for all criteria.
Sustainability 14 04181 g004
Figure 5. The measurement scale for assessing cruise port performance.
Sustainability 14 04181 g005
Figure 6. Cruise port performance comparison of four aspects.
Sustainability 14 04181 g006
Table 1. Aspects, criteria, indicators, and parameters of the MCDA.
AspectCriteriaIndicatorParameter
Traffic—technical1. Traffic flow1.1 Number of cruise ship callsThe total number of cruise ship calls (home port, port of call).
1.2 Number of cruise passengers The total number of cruise passengers (embarked, disembarked, and transit passengers).
2. Accessibility2.1 Accessibility by public transport The number of transit stops/stations within 2 km of the cruise terminal.
2.2 Accessibility by bike and walkingThe length of pedestrian paths within 2 km of the cruise terminal.
2.3 Accessibility by carThe no. of parking lots within 2 km of the cruise terminal.
3. Infrastructure3.1 Port passenger terminalThe no. of the present passenger terminal, else 0.
3.2 Number of berthsThe total no. of berths, else 0.
3.3 Cruise ship draftThe maximum allowed draft of a cruise ship in port (meters).
Safety—environmental4. Pollution4.1 Pollution indexSurvey results.
4.2 WasteThe amount of solid waste that the cruise port receives from cruise ships (tons).
5. Health care5.1 Health care Survey results.
6. Safety and security6.1 Crime indexSurvey results.
Touristic7. Tourism amenity7.1 Tourism amenityThe number of tourism amenities within 2 km of the cruise terminal.
8. Tourism attraction8.1 Tourism attractionThe number of tourism attractions within 2 km of the cruise terminal.
Socio-economic9. Employment9.1 Employment The no. of jobs in the region generated indirectly due to cruise passengers.
10. Direct income10.1 Direct incomeThe calculated expenditure of cruise passengers in the port city.
11. Port fees11. Port feesPort income from fees paid by cruise ships for each passenger embarking, disembarking, and transiting the port.
Source: authors.
Table 4. TOPSIS step six.
Traffic–TechnicalSafety–EnvironmentalTouristicSocioeconomic
Barcelona0.460.791.001.00
Civitavecchia0.550.470.010.51
Marseille0.500.730.210.24
Piraeus0.350.270.200.06
Table 5. TOPSIS step six—ranking ports in order from best (1) to worst (4) position.
Traffic–TechnicalSafety–EnvironmentalTouristicSocioeconomic
Barcelona3111
Civitavecchia1342
Marseille2223
Piraeus4434
Table 6. Port performance score of the cruise ports.
Port\AspectPTVOTSEScore (%)Rank
Barcelona11.0022.3726.3521.4281.141
Civitavecchia13.1513.310.2610.9237.653
Marseille11.9620.675.535.1443.302
Piraeus8.377.655.271.2922.574
Publisher’s Note: MDPI stays neutral with regard to jurisdictional claims in published maps and institutional affiliations.

