Article

Towards Environmental Sustainability in China: Role of Globalization and Hydroelectricity Consumption

by
Rahmi Deniz Özbay
1,
Seyed Alireza Athari
2,
Chafic Saliba
3 and
Dervis Kirikkaleli
4,*
1
Department of Economics, Faculty of Business, İstanbul Commerce University, Istanbul 34445, Beyoğlu, Turkey
2
Department of Business Administration, Faculty of Economics and Administrative Sciences, Cyprus International University, Nicosia 99258, Northern Cyprus, Turkey
3
School of Business, Lebanese International University, Beirut 146404, Lebanon
4
Department of Banking and Finance, Faculty of Economics and Administrative Sciences, European University of Lefke, Lefke 99010, Northern Cyprus, Turkey
*
Author to whom correspondence should be addressed.
Sustainability 2022, 14(7), 4182; https://doi.org/10.3390/su14074182
Submission received: 22 February 2022 / Revised: 19 March 2022 / Accepted: 29 March 2022 / Published: 31 March 2022

Abstract

:
Countries encounter conflicting policy options in reaching fast development goals due to high resource use, rapid economic expansion, and environmental degradation. Thus, the present research examined the connection between CO2 emissions and urbanization, globalization, hydroelectricity, and economic expansion in China utilizing data spanning the period between 1985 and 2018. The novel quantile-on-quantile (QQ) and quantile regression (QR) approaches were applied to assess this interconnection. The QQ approach is characterized by its ability to incorporate quantile regression fundamentals and non-parametric estimation research. As a result, the method appears to transform the quantile of one parameter into another. The QQ outcomes revealed that in all quantiles (0.1–0.95), gross domestic product (GDP), urbanization, and globalization trigger CO2 emissions in China, while in each quantile (0.1–0.985), hydroelectricity consumption mitigates CO2 emissions. The QR outcomes also affirmed the outcomes of the QQ regression estimates. Policies are suggested based on these findings.

1. Introduction

Since the opening up and reform in 1978, China has seen fast economic expansion, surpassing Japan as the globe’s 2nd largest economy in 2010, a phenomenon dubbed the “China Miracle.” With the rapid growth of information technology and industrialization, China’s expanding economy has not only had a significant influence on people’s living conditions but has also piqued the interest of practitioners and academics worldwide. As a consequence, it is critical to investigate and pinpoint the drivers of China’s economic miracle, both theoretically and practically. By sharing valuable economic development experience, China’s economic success can profit several other emerging nations. Moreover, as numerous global environmental issues, especially global warming, gain importance, policymakers around the globe are emphasizing the importance of mitigating GHG emissions. As a result, scholars all over the globe are studying the economic expansion influence on GHGs, such as CO2.
Globalization (GLO) is a worldwide occurrence that influences human lives all around the globe on a political and social level (Kirikkaleli et al., 2020), and it has a greater favorable effect than negative consequences, notably in terms of poverty reduction in developing countries and income disparity. Currently, China ranks third in the world in terms of FDI flows and second in terms of imports [1].
China is swiftly becoming the newest financial source of economic partnership and globalization, owing to new business expansion chances, and the world economy is placing its attention on China. Scholars have debated the globalization–environment interrelationship regularly; nonetheless, mixed findings regarding this connection have surfaced. To put it another way, certain studies demonstrate that globalization reduces sustainability of the environment [2,3], while some scholars [4,5,6] showed that globalization mitigates CO2. The preceding debates illustrate that globalization is gaining some traction and is becoming a powerful champion of the economic expansion of the nation. Globalization, in particular, can assist economic growth by lowering tariffs and taxes whilst enhancing financial development and trade openness (Gundnor et al., 2021). Nevertheless, real growth can lead to environmental degradation, and several studies have found a link between CO2 and economic expansion [7,8,9,10]. Significant numbers of people in China have migrated to urban areas in search of a better living standard and more employment opportunities, leading to the surge in urbanization. In 1960, China’s urban populace accounted for 16% of the total population. Despite this, China’s urban population contributed to 60% of the nation’s total population in 2019. Several studies [11,12,13] established that increased urbanization increase CO2 emissions.
Due to the upsurge in CO2 emissions in China, policymakers have initiated numerous strategies to boost renewable energy usage. China, for instance, has enforced a number of policies to stimulate green energy, such as the 2009 and 2006 policy processes and the subsidy programs in 2010 and 2003, all of which were designed to increase the country’s renewable energy utilization. Hydroelectricity is by far the most common renewable energy source in China. In 2021, other renewable sources of energy contributed to only 5% of the total energy mix, while hydroelectricity contributed to 8% of the total energy mix [14]. The utilization of hydroelectricity and electricity, in particular, is increasing in tandem with China’s growing economic activities. Moreover, China is one of the globe’s top 10 hydroelectricity suppliers. This source of renewable energy could aid in mitigating emissions levels in China. The importance of hydroelectricity in China increased dramatically between 1980 and 2021, as production doubled. Several researchers such as [12,15] established that hydroelectricity aids in mitigating environmental degradation. The above results are mixed findings regarding the relationship between CO2 emissions and economic expansion, globalization, hydroelectricity usage, and urbanization. Therefore, the present empirical investigation is driven by the mixed findings from prior studies.
The following are the major study contributions to the research. First, focusing on China is motivated by the fact that it is the largest emitter of CO2. Moreover, China is a major contributor to CO2 pollution, with a populace of 1408 billion and a GDP per capita of US $10,263 in 2019 (World Bank, 2020). Furthermore, the research outcomes will provide essential policy recommendations on curbing China’s emissions levels and also a good lesson for others in the international context. Second, the significance of hydroelectricity utilization has not been thoroughly studied. Considering renewable energy as a whole without considering the complicated nature of its constituents can conceal the different impacts of various types of energy utilization and result in erroneous policy suggestions for each component—in particular, hydroelectricity, which is different from other types of energy and has a dissimilar influence on China’s CO2 emissions. Third, over the years, numerous studies [16,17,18] have been conducted in an attempt to notify the public about the influence of urbanization, hydroelectricity consumption, globalization, and GDP on CO2. The conclusions, however, are frequently limited by traditional approaches such as VECM, ARDL, FMOLS, DOLS, and VAR, which do not take into account variables’ nonlinearity attributes.
Acknowledging these problems, Refs. [19,20] noted that techniques are vital in obtaining unbiased analytical findings, and that fresh econometric approaches are essential. Therefore, this research utilized an innovative QQ methodology to assess the effect of hydroelectricity consumption, globalization, urbanization, and GDP on CO2. The Q–Q approach is characterized by its capacity to incorporate the fundamentals of QR and non-parametric estimation research. As a result, the method appears to transform the quantile of one parameter into another. The study concludes that the findings include a broad representation of the critical effect of hydroelectricity consumption, globalization, urbanization, and GDP on CO2 that will not be feasible using traditional approaches.
The subsequent sections are as follows: a synopsis of prior studies is illustrated in Section 2. Section 3 and Section 4 disclose data and methods. Section 5 depicts findings. The last section concludes the research.

2. Literature Review

Over the years, copious research has been done on the association between CO2 pollution, urbanization, hydroelectricity consumption, and GDP; however, the outcomes vary depending on the nation(s) and region(s) utilized, the timeframe of the study, and empirical method utilized. These differences are impossible to explain concisely. This section presents previous studies on the interrelationship between GDP, CO2 emission, urbanization, hydroelectricity consumption, and utilization of energy.

2.1. GDP and CO2 Interrelationship

The research of [8] on the CO2–GDP interconnectedness in South Korea utilize data between 1965 and 2019. The investigators applied the wavelet coherence and ARDL tests to examine this association, and their findings revealed that GDP contributed to an upsurge in CO2. Moreover, a unidirectional causal interrelationship surfaced from GDP to CO2. In the same vein, in Chile, Ref. [21] assessed the GDP–CO2 dynamics using the NARDL and data from 1990 to 2018. The outcome of the BDS supported the usage of the NARDL. Furthermore, an increase and decrease in GDP triggered CO2 in Chile whilst there was causality from growth due to CO2. Moreover, Ref. [10] used the frequency domain causality and ARDL approaches and assessed the GDP–CO2 association in Mexico between 1990 and 2018. Their empirical outcome showed that GDP growth and CO2 were positively connected while the causality test showed proof of unidirectional causality from GDP to CO2 in different periods, i.e., short, medium, and long term. In South Africa, the research of [22] showed that an upsurge in GDP impacted CO2 emissions positively, thereby causing environmental havoc. In Indonesia, Ref. [23] assessed the GDP–CO2 association utilizing data from 1965 to 2019. The investigators utilized both time-domain and time-frequency approaches to analyze this linkage. Their empirical outcomes showed that GDP and CO2 were positively linked. The wavelet coherence test also showed positive comovement between GDP and CO2. Similarly, the study of [24] reported a positive GDP–CO2 association in Malaysia.

2.2. CO2 and Globalization

Utilizing diverse econometric tools to analyze panel data and time series, several researchers have analyzed the connections between CO2 emissions and globalization (GLO). These investigations have shown conflicting outcomes for these two factors, and academics are still divided as to whether globalization boosts CO2 emissions. In addition, Ref. [4] assessed the globalization–CO2 emissions interconnection in 18 Latin American nations utilizing data spanning the period between 1990 and 2014. The investigators used panel ARDL and NARDL to investigate this connection. Their outcomes from the panel ARDL showed positive globalization–emissions interrelationships. Furthermore, the outcomes of the NARDL varied. Likewise, Ref. [25] assessed the interconnectedness between CO2 emissions and globalization. The investigator applied the DOLS and causality tests to assess this interconnection. The study outcome showed a globalization–emissions negative association. In addition, globalization causes CO2 emissions. Utilizing data between 1990 and 2017, Ref. [5] assessed the association between globalization and emissions in 23 African economies. The investigators applied the ARDL and Driscoll–Kraay estimator to assess this connection. The empirical outcomes showed that globalization impacted CO2 pollution negatively. In Turkey, Ref. [26] assessed the CO2–globalization connection. The authors applied the novel dual adjustment approach and FMOLS tests to explore this connection, and their finding showed that GLO impacted CO2 positively. The study of [27] on the CO2–GLO connection in advanced nations utilizing CCEMG and panel Granger causality tests showed that globalization triggered CO2 pollution. Moreover, Ref. [28] explored the CO2–globalization interconnection in Brazil utilizing data spanning from the period 1971–2014.

2.3. CO2 and Hydroelectricity Consumption

Limited research has assessed the interconnectedness between CO2 and hydroelectricity consumption. In India, Ref. [12] scrutinized the CO2–hydro interrelationship. The authors utilized ARDL to explore this interrelationship. Their empirical outcomes showed that utilization of hydro reduced CO2. Furthermore, the Granger causality showed a two-way causal interrelationship between CO2 and HYDRO in China and India. Likewise, in Malaysia, Ref. [29] looked into the influence of hydroelectricity use on CO2 pollution using a dataset between 1965 and 2010. The investigators applied the cointegration and Granger causality tests to assess this association. Their outcomes showed unidirectional causal linkage from hydroelectricity use to CO2. Similarly, Ref. [30] scrutinized the hydro- CO2 linkage in Malaysia utilizing data stretching from 1988 to 2016 and applied OLS and SUR tests. Their outcomes showed that hydroelectricity use impacted CO2 pollution negatively. This suggests that an upsurge in hydroelectricity curbs CO2. The research of [31] on the hydro- CO2 connection in E-7 nations utilizing panel approaches between 1990 and 2018 showed that hydroelectricity use aids in mitigating environmental degradation.

2.4. CO2 and Urbanization

The study of [27] investigated urbanisation- CO2 pollution in five selected Latin American nations. The outcome of the study showed causality from URB to CO2. Moreover, Ref. [32] explored the association between CO2 and urbanization in APEC nations. The empirical research outcomes showed that urbanization can predict CO2. Utilizing ARDL and VECM, Ref. [33] assessed the influence of urbanization on emissions in Canada and Australia. The outcomes of the ARDL showed positive urbanization–CO2 association. Furthermore, the causality test showed unidirectional causality from urbanization to CO2 in Canada and Australia. Likewise, the study of [34] on the urbanization–CO2 interconnection in Asian nations showed that urbanization triggered CO2 pollution. Utilizing eight Asian nations, Ref. [35] assessed the urbanization–CO2 pollution linkage utilizing FMOLS and DOLS. The outcomes of the study showed that urbanization triggered CO2 pollution positively. Moreover, Ref. [36] assessed the association between CO2 and population in 32 advanced economies and 155 emerging nations. The investigators utilized panel techniques, and their outcome showed that the population impacted CO2 positively. Utilizing the novel wavelet coherence and ARDL techniques, Ref. [37] looked at the CO2–URB interrelationship in Malaysia between 1970 and 2018. The outcome of the ARDL showed that urbanization impacted CO2 positively.

3. Data and Methodology

In order to obtain more reliable results in the study, the panel data analysis method, in which cross-section and time-series are used together, was preferred. Panel data analysis is superior to time series and cross-section data as it reduces the possibility of linearity between variables. Panel data analysis is the collection of cross-sectional observations such as countries, companies, household statistics, etc., covering a certain time period. In recent years, panel data analysis has emerged as a method frequently used in the mutual comparison of country data (purchasing power parity, the convergence of growth, international R&D expansion, innovation, etc.) [5]. Although panel data analysis has features specific to both time series and cross-section data analysis, it can also eliminate the disadvantages of these methods [27].
The generally accepted equation in panel data analysis is as follows.
Yit = β0it + β1itXit + β2itX2it + β3itX3it + … + βkitXkit + εit
According to Equation (1); Yit = the dependent variable value of the i’th cross-section unit at time t, Xit = the value of the i’th unit of the independent variable at time t, βit = the coefficient of the independent variable, i = 1.2 … n cross-section units, t = 1.2 … t is the time period, and εit = the error term. While estimating the model in panel data analysis, different approaches can be applied in the estimation of unobservable effects, taking into account the covariance structure of error terms.

3.1. Data

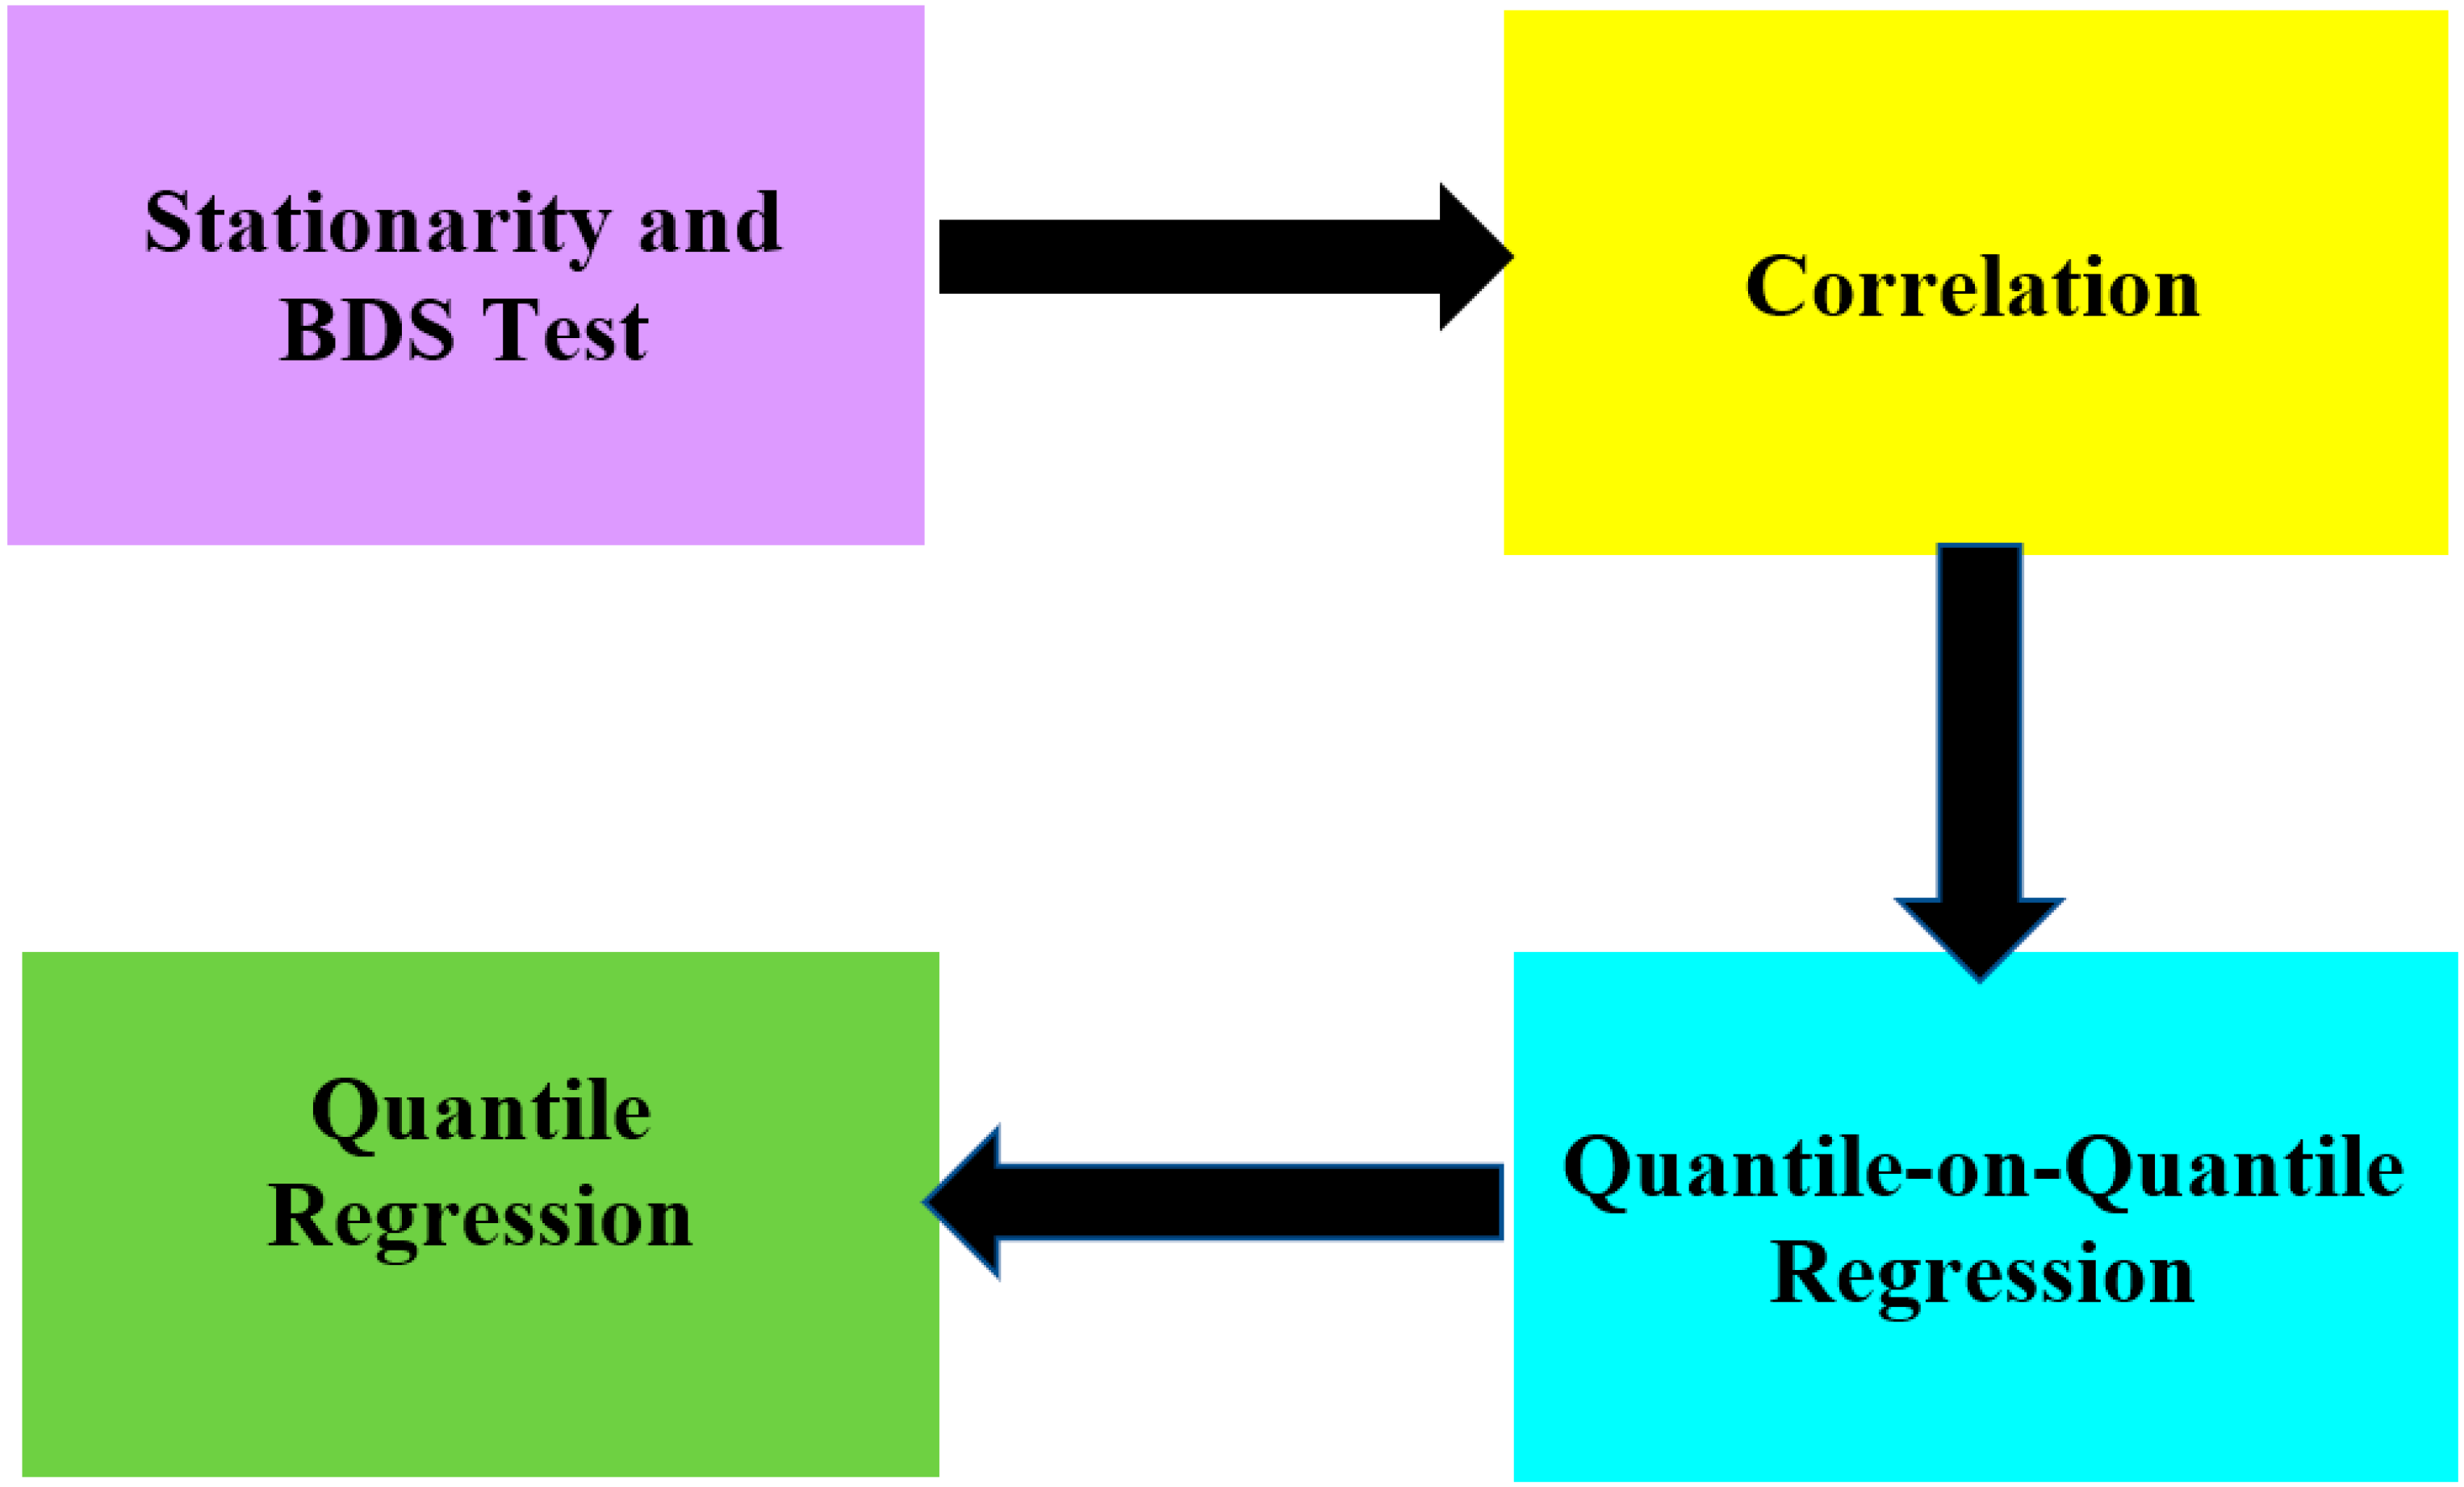
The present research utilized a dataset from 1985 to 2018 to explore the interconnectedness between CO2 and urbanization (URB), globalization (GLO), hydroelectricity consumption (HYD), and economic growth (GDP) in China. The dependent variable was CO2 emission, which was measured as emissions per capita. The exogenous variables included urbanization, which was measured as urban population, hydroelectricity consumption measured as the electricity share of hydro (% electricity), globalization measured as (economic social, and political) globalization, and GDP measured as GDP per capita constant US$. In this study, GDP and URB data were obtained from a database of the World Bank, CO2 and hydroelectricity use data were obtained from the BP database, and globalization, as well as the economic, social, and political dimensions were measured through The KOF Globalization Index. The current research used a radar chart to present the description of data. Figure 1 portrays the fader chart. The outcomes from the radar chart showed that the URB mean was the highest, followed by that of the GDP, GLO, HYD, and CO2. Since URB had the highest mean, it scored better on average than the other variables such as GDP, GLO, HYD, and CO2. The score of hydroelectricity consumption was more consistent as revealed by standard deviation values. The skewness showed that globalization and urbanization were skewed negatively while CO2, GDP, and hydroelectricity use were skewed positively. Moreover, the skewness values showed that the variables aligned with normality. Additionally, the kurtosis showed that series of studies affirmed normality since their values were less than 3. Furthermore, we assessed the correlation among the variables of consideration. The outcomes showed a positive correlation among the series with the exemption of hydroelectricity consumption, which had a negative correlation with all other variables (GDP, CO2, GLO, and URB) (see Table 1). Figure 2 presents the workflow of the analysis.

3.2. Methodology

Most papers initially employed linear regression and then the quantile regression technique of [38] when estimating the dynamics between two variables. Over time, the orthodox quantile regression technique became a workhorse when analyzing tail dynamics and the time-varying dependence relationship. However, a major limitation of the [38] quantile regression technique is its failure to adequately capture the dependency relationship since it only estimates the conditional distribution of the criterion variable and not the independent variable. Ref. [39] filled this gap by developing quantile–quantile (QQ) regression, a combination of quantile regression and non-parametric estimation It can elaborately capture the variations in the relationship between dependent and independent variables at each point of their conditional distribution. Thus, to estimate the relationship between the quantiles of Y and quantiles of X, this study employed the [39] QQ regression approach, which can be expressed as follows:
Y t = α π X t + μ t π
where Y t represents the dependent variable in period t , X t , specifically explains the exogenous variable in period t , π denotes the quantile of the exogenous variable and μ t π is the π -quantile error term that is equal to zero. Due to the lack of prior knowledge of the association between changes in the endogenous and exogenous variables, the function α π (.) is assumed to be unknown. To examine the nexus between the π -quantile of geopolitical risks and the π -quantile of the endogenous variable, orthodox linear regression was used to linearize the unknown function α π (.) with a first-order Taylor extension of α π (.) around the G P R π , as follows:
α π ( X t )   α π ( X ω ) + α π ( X ω ) ( X t X ω )
α π ( X ω ) and α π ( X ω ) can be redefined as α 0 ( π ,   ω ) and α 1 ( π ,   ω ) , respectively (see Sim and Zhou, 2015). Equation (3) can be stated as:
α π ( X t )   α 0 ( π ,   ω ) + α 1 ( π ,   ω ) ( X t X ω )
Equation (1) can then be expressed as:
Y t = α 0 ( π ,   ω ) + α 1 ( π ,   ω ) ( X t X ω ) + μ t π  
To weight the observations surrounding the empirical quantile of uncertainty, the Gaussian kernel was used, dependent on the precise bandwidth for evaluating the impact of the π quantile of uncertainty locally expended.

4. Findings and Discussion

It is crucial to affirm the linear characteristics before further analyses are initiated. Therefore, the present research employed the BDS test to discover the linearity features of the indicators. The BDS test outcomes are illustrated shown in Table 2. The BDS test outcomes revealed that all variables were non-linear. Therefore, utilizing linear approaches (e.g., ARDL, FMOLS, DOLS, VECM, and GMM, etc.) will produce misleading outcomes. The present research also assessed the series stationarity characteristics by employing the Zivot and Andrew (ZA) unit root test with outcomes revealing stationarity at first difference as reported in Table 3.
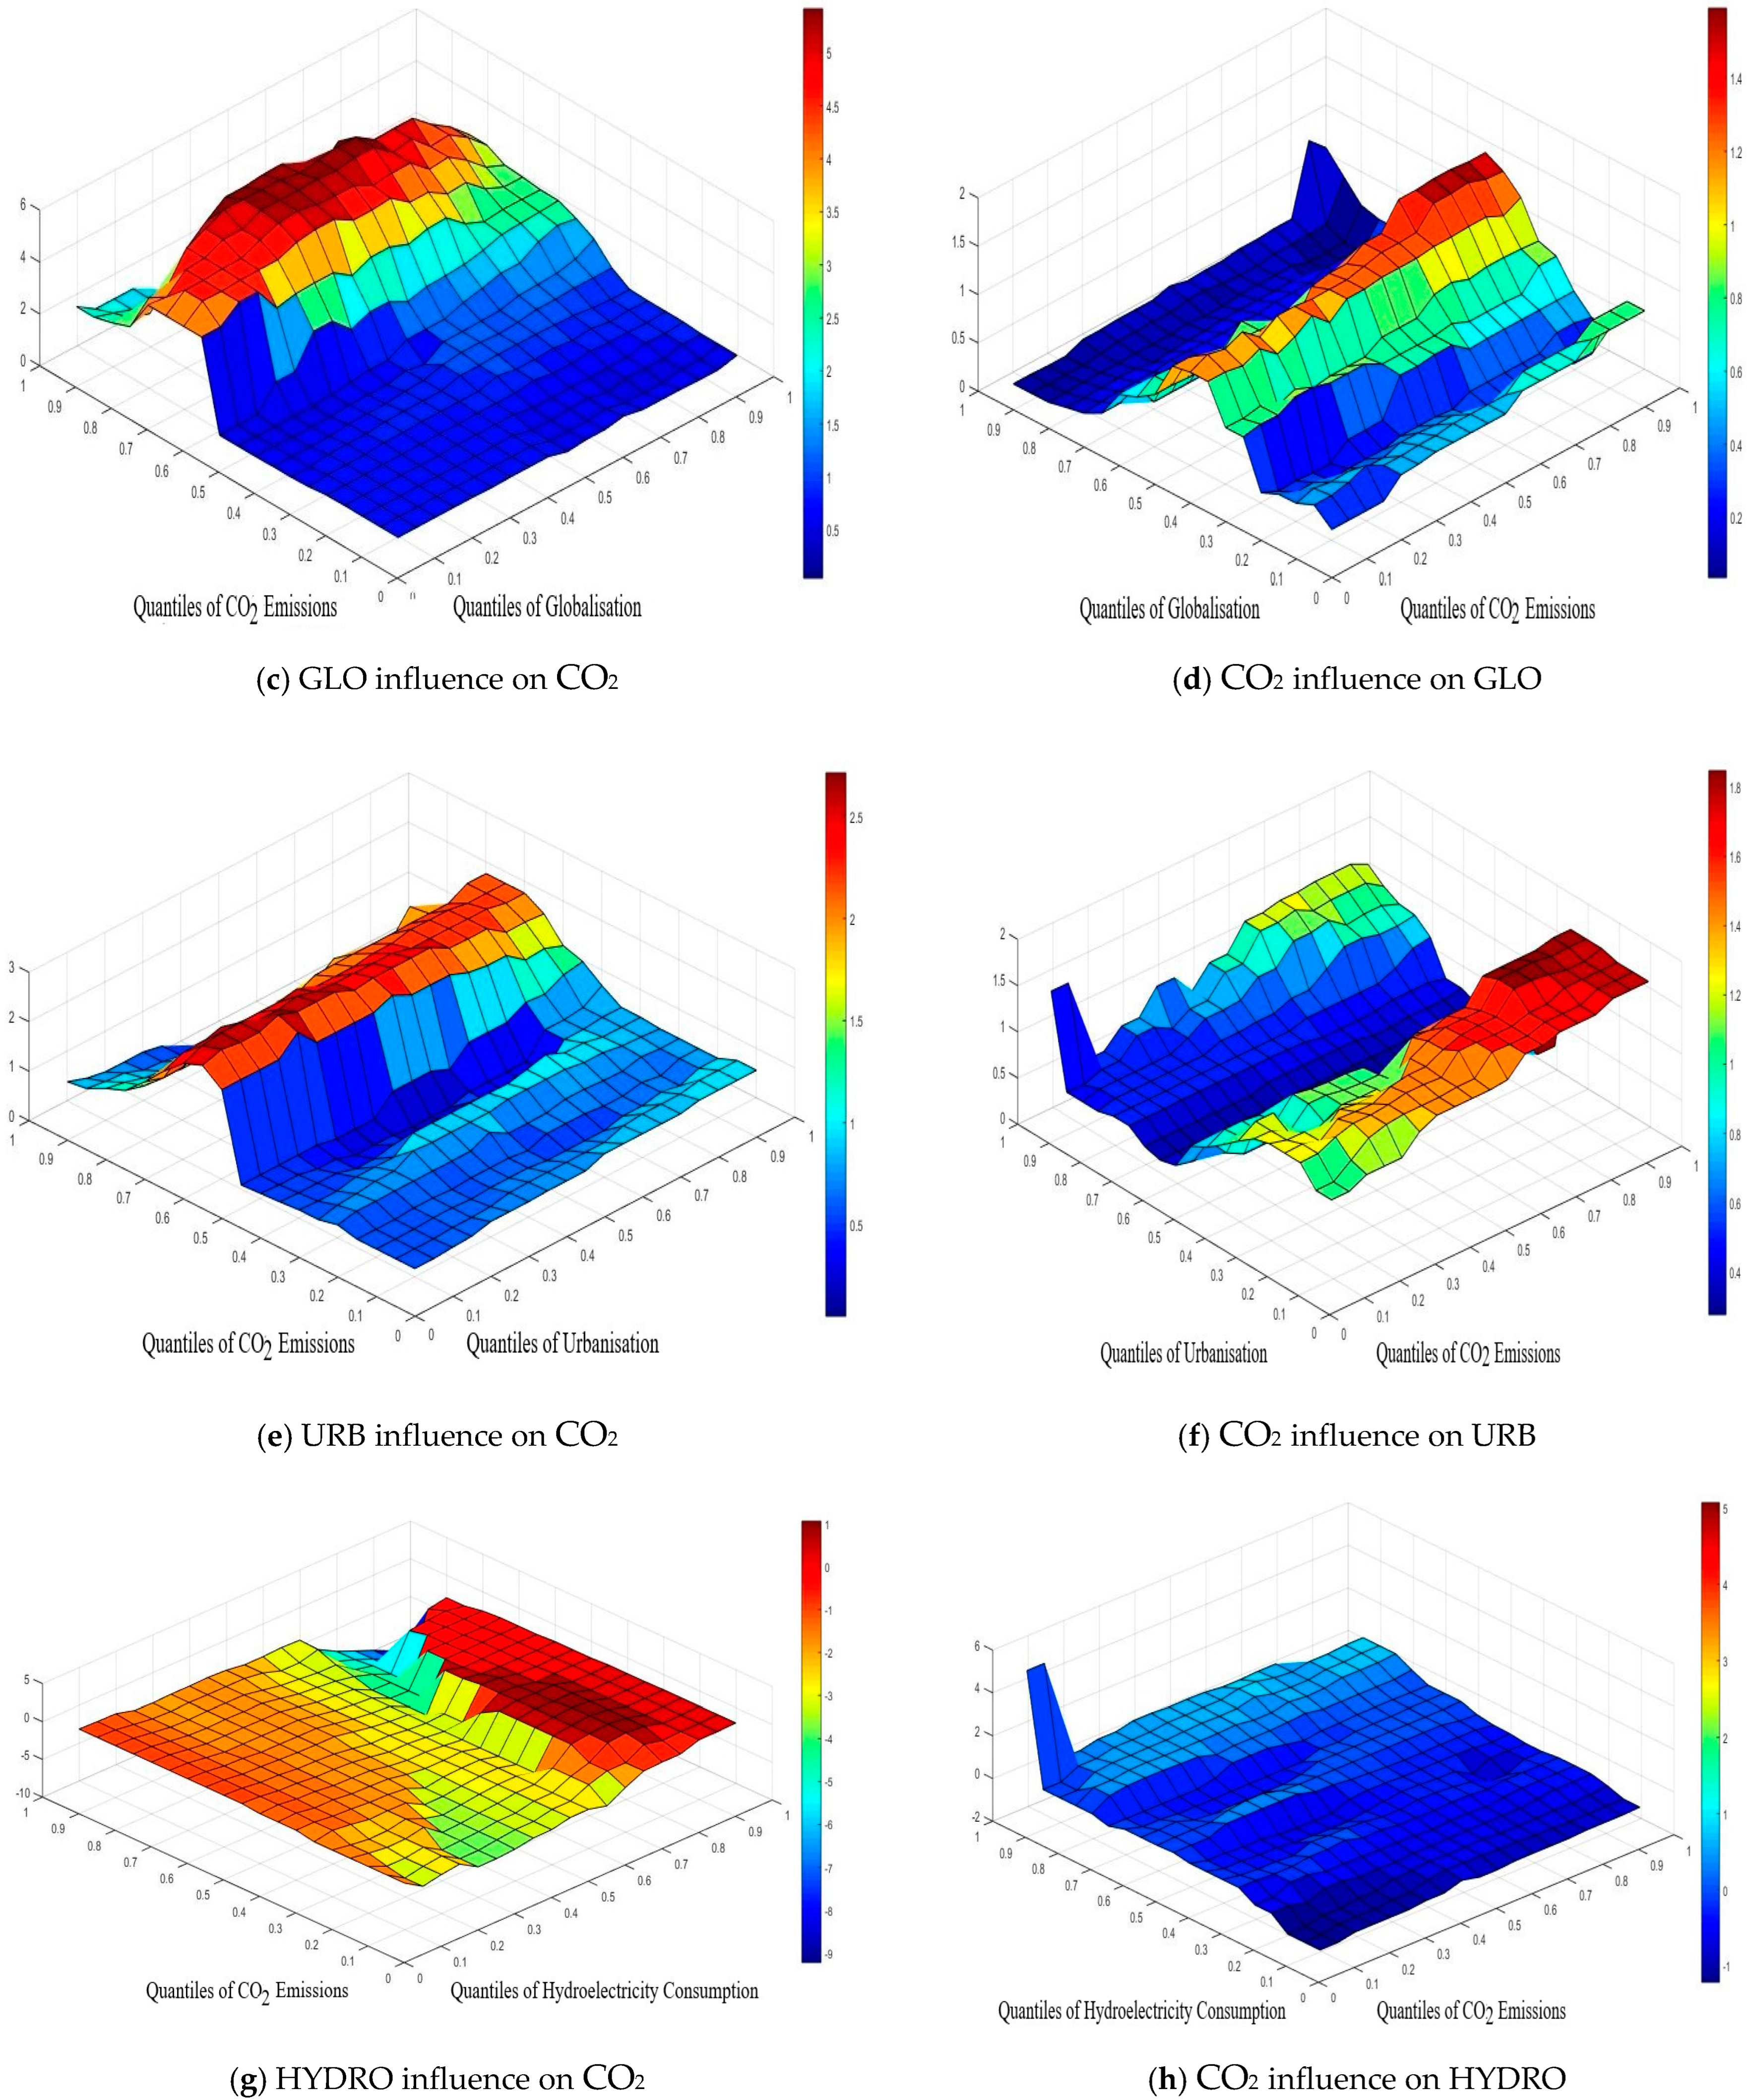
This portion of the analysis discloses the results of the QQ approach of the influence of CO2, HYD, GLO, GDP, and URB on CO2 in China. Figure 3a–h revealed the QQR outcomes. The influence of GDP on CO2 pollution is portrayed in Figure 3a. The slope coefficient was between 0 and 2. The effect of GDP on CO2 was weak and positive; nevertheless, the positive influence of GDP on CO2 was slightly stronger in the middle tails (0.65–0.90) of the GDP and higher tails (0.65–0.90) of CO2 pollution. These outcomes showed a feedback-positive CO2–GDP connection. Figure 3b portrays the effect of CO2 on GDP in China with a slope coefficient between 1 and 3.5. For the majority of the combination of the quantiles of CO2 and GDP, the influence of CO2 on GDP was positive. Figure 3c shows the influence of GLO and CO2 in China. The influence of GLO on CO2 was weak and positive in all quantiles (0.1–0.95) of GLO and the lower and middle tails (0.1–60) of CO2. However, for all tails of GLO (0.1–0.95) and higher tails (0.70–0.95) of CO2, the influence of GLO on CO2 was strong and positive. The CO2 influence on GLO is shown in Figure 3d with a slope coefficient ranging from 0.1 to 1.4. The CO2 influence on GLO was positive in all quantiles of CO2 and the middle and higher tails of GLO; however, for all tails of CO2 (0.1–0.95) and high tails of GLO (0.70–95), the influence of CO2 on GLO was weak and positive. These outcomes showed positive feedback interconnection between CO2 and GLO.
The URB influence on CO2 is revealed by Figure 3e with a slope coefficient ranging from 0.5 to 2.5. The URB influence on CO2 was weak and positive for all tails of URB (0.1–0.95) and the low and middle tails (0.1–65) of CO2. In addition, for the higher tails of CO2 and URB, the effect of URB on CO2 was strong and positive. Figure 3f depicts the influence of CO2 on URB in China with coefficients ranging from 0.4 to 1.8. The impact of CO2 on URB was strong and positive for all tails (0.1–0.95) of CO2 and in the low and middle quantiles (0.1–0.60) of CO2. Further, for all tails of CO2 (0.1–0.95) and in the high quantiles (0.70–0.95) of URB, the influence of CO2 on URB was weak and positive. These results showed positive feedback interconnection between CO2 and URB. The effect of HYD on CO2 is illustrated in Figure 3g, with a coefficient ranging from −9 to 1. The HYD influence on CO2 was negative for a combination of quantiles of HYD and CO2 emissions. Figure 3h shows the influence of CO2 on HYD with a slope coefficient ranging from −1 to 5. For all combinations of quantiles of CO2 and HYD, the influence of CO2 on HYD was negative. These outcomes showed negative feedback interconnection between CO2 and HYD.
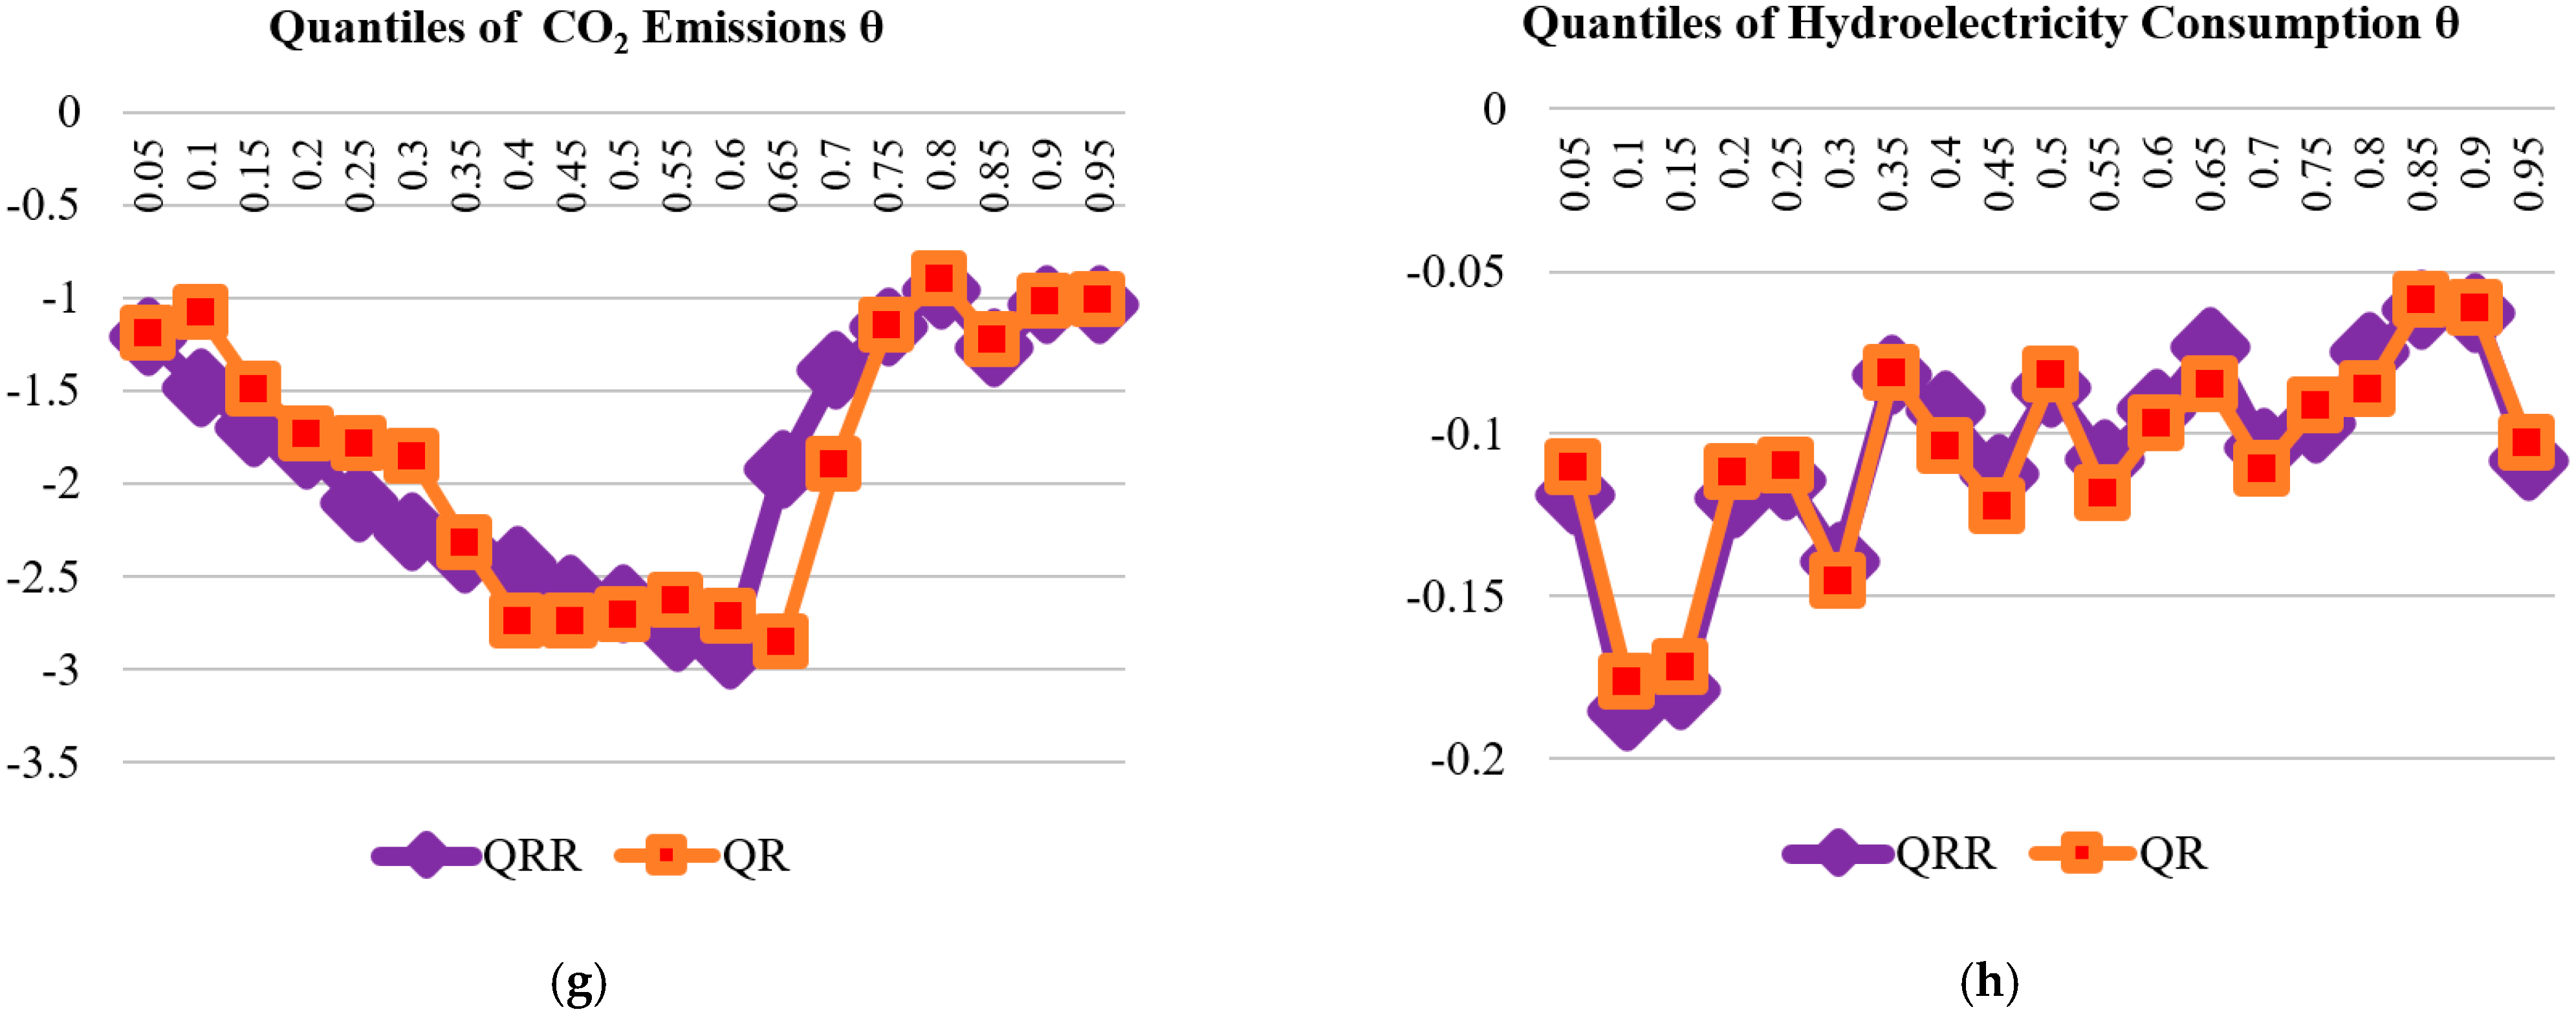
The present research utilized the QR as a robustness check for the QQR approach. Figure 4a–h shows that the average QQR estimates of the coefficient slope were extremely similar to the QR estimates for China, regardless of the quantile used. Figure 4a shows that the QQR and the QR estimate outcomes were similar for all quantiles for the GDP impact on CO2. This implies that QR affirmed the QQR outcome. Furthermore, Figure 4b affirmed that the QQR and QR outcomes for the CO2 effect on GDP were similar in all quantiles. Moreover, Figure 4c shows that the QQR and the QR estimates outcomes were similar in all quantiles for the globalization impact on CO2. This implies that QR affirmed the outcomes of QQR outcome. In addition, Figure 4d affirmed that the QQR and QR outcomes for the CO2 effect on globalization were similar in all quantiles.
Furthermore, Figure 4e shows that the QQR and the QR estimate outcomes were similar in all quantiles for the hydroelectricity utilization impact on CO2. This implies that QR affirmed the outcomes of QQR. In addition, Figure 4f affirmed that the QQR and QR outcomes for the CO2 effect on hydroelectricity utilization were negative and similar in all quantiles. Moreover, Figure 4g shows that the QQR and the QR estimate outcomes were similar in all quantiles for the positive urbanization impact on CO2. This implies that QR affirmed the outcomes of QQR. In addition, Figure 3h affirmed that the QQR and QR outcomes for the negative CO2 effect on urbanization were similar in all quantiles. Based on the QR and QQR outcomes, we conclude that our findings are robust. Thus, policy recommendations can be obtained from the QQR outcomes.
This study portion discussed the findings. The outcomes above showed that for all combinations of tails (0.1–0.95) of GDP and CO2 emissions, the GDP–CO2 association was positive. This implies that in the Chinese economy, the scale effect outweighs composite and technique effects. The rise in income has boosted economic activity, including utilization of natural resources and industrialization in all sectors of the economy. As a result, levels of CO2 have risen and the ecosystem has deteriorated. The environment and growth are inextricably linked, thus all economic actions are linked to environment. Another reason for the positive effect of GDP on CO2 is due to China’s economic expansion acceleration over the last two decades. This outcome is most likely due to the Chinese government’s aggressive efforts to enlarge the manufacturing sector and create more employment. The key subsectors of China’s industrial sector, such as construction and manufacturing, have shown to be the globe’s worst polluters. The current discourses reveal that, albeit economically beneficial, the expansion of the industrial sector has harmed environmental quality. Increased development and industry activity have exacerbated China’s already precarious emissions levels. This outcome complies with the studies of [8] for South Korea, [40] for Portugal, [41] for Chile, [13] for Turkey, [42] for Turkey, and [11] for Thailand.
The research also showed that for all combination tails (0.1–0.95) of GDP and globalization, the effect of globalization on CO2 was positive and significant. There are numerous explanations in the literature explaining globalization’s positive impact on CO2 emissions in China. As Shahbaz et al., 2015 stated, the process of globalization permits sophisticated technology to be transferred from advanced nations to developing economies, enabling these economies to enhance the division of labor and boost the comparative advantage of various economies. Globalization also expands investment opportunities through FDI and enhances financial markets through financial deregulation. This process, in fact, benefits economic growth, financial markets, trade, as well as consumption of energy and the environment. Moreover, Ref. [43] share the same point of view, claiming that the process of globalization corroborates the findings of [44,45]; however, the outcome contradicts the outcomes from the studies of [46] for Saudi Arabia, [47] for BRICS nations, and [48] for China.
Moreover, in all quantiles (0.1–0.95) of a combination of CO2 and urbanization, the effect of urbanization on CO2 pollution was positive and significant. This means that urbanization in China is causing ecological degradation. This study suggests that China’s urbanization has resulted in an increase in energy demand, which is supported by nonrenewable energy resources, leading to an upsurge in the emissions of CO2. Considering that these networks (electrical appliances demand and residential and commercial building construction and transportation) are the source of CO2, this is not an unexpected finding. Rather than a sustainable environment, societies frequently seek comfort and flexibility in the initial stages of urbanization by depending on personal cars. Our empirical finding corroborates the studies of [49] for Latin American nations and [50] for Malaysia.
Regarding the impact of hydroelectricity on CO2, for a majority of the tails, the negative influence of hydroelectricity consumption on CO2 was evident. This outcome was expected given the fact that higher hydroelectricity use is linked to a reduction in the use of fossil fuels. Hydroelectricity is presently only a small part of the energy mix, but there is still room for improvement. Hydroelectricity accounted for 8% of China’s total energy mix in 2020 [14]. China’s government has put in place programs and measures to encourage hydroelectricity utilization in the country. China is home to the world’s largest hydroelectricity system, the Three Gorges Dam hydropower plant. It originally opened to the public in 2003, and in 2012, construction was completed [51]. China’s green energy investments totaled $US83.4 billion in 2019, accounting for 23% of the investment in renewable energy globally. China is gradually becoming the world’s largest green energy market (CSIS, 2020). This outcome is consistent with the studies of [30,52], who established a negative hydroelectricity–emissions interrelationship.

5. Conclusions and Policy Direction

This paper assesses the effect of economic growth, hydroelectricity consumption, urbanization, and globalization on China’s CO2 emissions using data from 1985 to 2018. The present study utilized the BDS test, which showed that using the linear techniques to investigate this connection will yield misleading outcomes. Thus, the present study applied the quintile-on-quantile and nonparametric causality approaches to determine the interrelationship between CO2 and the regressors. The QQ regression outcomes showed that for all tails of a combination of GDP and CO2, the influence of GDP was positive. Furthermore, urbanization impacted CO2 emissions positively in the combination of quantiles of urbanization and CO2. Moreover, the effect of globalization on CO2 emissions was significant and positive for the majority of the tails. Lastly, in a majority of the quantiles, the effect of hydroelectricity consumption on CO2 emissions was negative. We used the quantile regression test as a robustness check, and the results support the QQ outcomes.
The research concludes that the government of China needs to strengthen its institutions via environmental regulations and laws. The Kyoto Protocol and the Paris Agreement, for instance, are vital for limiting emissions and guaranteeing that the global average temperature rise does not exceed 1.5 °C. Ahead of COP26 in October 2021, China officially submitted its carbon neutrality “before 2060” target and updated NDC targets to the UNFCCC, strengthening its previous non-fossil share and carbon intensity targets, while adding a new renewable energy capacity target. China’s government is implementing some measures to increase renewable energy, and other decarbonization efforts, vowing to hit peak emissions before 2030 and to be carbon neutral by 2060 by adopting “more vigorous policies and measures”. In order to meet these targets, China’s government must step up its efforts to develop, plan, and promote sustainable and green urbanization, which would result in advancements and continued economic growth without inflicting environmental harm. Furthermore, the ongoing improvement of urban residents’ health status via the implementation of timely and useful policies will reduce CO2 emissions. The use of nonrenewable energy, which makes up a large portion of CO2, is expected to decline as hydroelectricity becomes more prevalent in the energy mix. These findings have policy implications since greater utilization of hydroelectricity is expected to lower emissions. Furthermore, owing to persistent economic progress, rising levels of income, and expanded availability of services and goods, China’s increased energy demand, such as hydroelectricity usage, has been expanding. Therefore policymakers in China should formulate policies that will boost the consumption of hydroelectricity. Furthermore, policymakers should formulate policies to boost other renewables energies such as solar, wind, tidal, and geothermal. Additionally, since globalization degrades the quality of the environment, policymakers should establish mechanisms to assess the environmental sustainability of foreign investment and take action against companies that use outdated polluting technology. Furthermore, foreign investors should be urged to embrace clean technologies and participate in greener energy projects by offering attractive incentives. The social partnership with other nations should be enhanced, and the use of electronic media to promote environmental awareness should be encouraged.
Although this present study employs novel techniques to assess the impact of hydroelectricity consumption, growth, and urbanization on the quality of the environment in China, CO2 emissions are viewed as a proxy for environmental pollution, which is not the only cause of the degradation of the environment. Additionally, further research should be conducted in other developing and developed countries, as well as employing other environmental variables.

Author Contributions

Conceptualization, D.K.; methodology, D.K.; software, C.S. and R.D.Ö.; validation, S.A.A.; formal analysis, S.A.A.; investigation; R.D.Ö.; resources, R.D.Ö.; data curation, C.S.; writing—original draft preparation, C.S. and R.D.Ö.; writing—review and editing D.K. and S.A.A.; visualization, D.K.; supervision, R.D.Ö.; project administration, S.A.A. All authors have read and agreed to the published version of the manuscript.

Funding

This research received no external funding.

Institutional Review Board Statement

The study was conducted according to the research guidelines approved by the Ethics Committees of Authors Institutions.

Informed Consent Statement

Not applicable.

Data Availability Statement

Not applicable.

Conflicts of Interest

The authors declare no conflict of interest.

References

  1. Soylu, Ö.B.; Adebayo, T.; Kirikkaleli, D. The Imperativeness of Environmental Quality in China Amidst Renewable Energy Consumption and Trade Openness. Sustainability 2021, 13, 5054. [Google Scholar] [CrossRef]
  2. Adebayo, T.S.; Rjoub, H.; Akadiri, S.S.; Oladipupo, S.D.; Sharif, A.; Adeshola, I. The role of economic complexity in the environmental Kuznets curve of MINT economies: Evidence from method of moments quantile regression. Environ. Sci. Pollut. Res. 2021, 18, 1–13. [Google Scholar] [CrossRef] [PubMed]
  3. Acheampong, A.; Boateng, E.B. Modelling carbon emission intensity: Application of artificial neural network. J. Clean. Prod. 2019, 225, 833–856. [Google Scholar] [CrossRef]
  4. Koengkan, M.; Fuinhas, J.A.; Santiago, R. Asymmetric impacts of globalisation on CO2 emissions of countries in Latin America and the Caribbean. Environ. Syst. Decis. 2019, 40, 135–147. [Google Scholar] [CrossRef]
  5. Leal, P.H.; Marques, A.C. The environmental impacts of globalisation and corruption: Evidence from a set of African countries. Environ. Sci. Policy 2020, 115, 116–124. [Google Scholar] [CrossRef]
  6. Gygli, S.; Haelg, F.; Potrafke, N.; Sturm, J.-E. The KOF Globalisation Index–revisited. Rev. Int. Organ. 2019, 14, 543–574. [Google Scholar] [CrossRef] [Green Version]
  7. Adebayo, T.S.; Kirikkaleli, D. Impact of renewable energy consumption, globalization, and technological innovation on environmental degradation in Japan: Application of wavelet tools. Environ. Dev. Sustain. 2021, 23, 16057–16082. [Google Scholar] [CrossRef]
  8. Adebayo, T.S.; Awosusi, A.A.; Kirikkaleli, D.; Akinsola, G.D.; Mwamba, M.N. Can CO2 emissions and energy consumption determine the economic performance of South Korea? A time series analysis. Environ. Sci. Pollut. Res. 2021, 28, 38969–38984. [Google Scholar] [CrossRef]
  9. Bekun, F.V.; Alola, A.A.; Gyamfi, B.A.; Yaw, S.S. The relevance of EKC hypothesis in energy intensity real-output trade-off for sustainable environment in EU-27. Environ. Sci. Pollut. Res. 2021, 28, 51137–51148. [Google Scholar] [CrossRef]
  10. He, X.; Adebayo, T.S.; Kirikkaleli, D.; Umar, M. Consumption-based carbon emissions in Mexico: An analysis using the dual adjustment approach. Sustain. Prod. Consum. 2021, 27, 947–957. [Google Scholar] [CrossRef]
  11. Adebayo, T.S.; Akinsola, G.D.; Odugbesan, J.A.; Olanrewaju, V.O. Determinants of Environmental Degradation in Thailand: Empirical Evidence from ARDL and Wavelet Coherence Approaches. Pollution 2021, 7, 181–196. [Google Scholar] [CrossRef]
  12. Solarin, S.A.; Al-Mulali, U.; Musah, I.; Ozturk, I. Investigating the pollution haven hypothesis in Ghana: An empirical investigation. Energy 2017, 124, 706–719. [Google Scholar] [CrossRef]
  13. Adebayo, T.S.; Rjoub, H.; Akinsola, G.D.; Oladipupo, S.D. The asymmetric effects of renewable energy consumption and trade openness on carbon emissions in Sweden: New evidence from quantile-on-quantile regression approach. Environ. Sci. Pollut. Res. 2021, 29, 1875–1886. [Google Scholar] [CrossRef] [PubMed]
  14. BP. British Petroleum. Available online: https://www.bp.com/content/dam/bp/business-sites/en/global/corporate/pdfs/energy-economics/statistical-review/bp-stats-review-2019-china-insights.pdf (accessed on 30 May 2021).
  15. Tiwari, A.K.; Shahbaz, M.; Hye, Q.M.A. The environmental Kuznets curve and the role of coal consumption in India: Cointegration and causality analysis in an open economy. Renew. Sustain. Energy Rev. 2013, 18, 519–527. [Google Scholar] [CrossRef] [Green Version]
  16. Tufail, M.; Song, L.; Adebayo, T.S.; Kirikkaleli, D.; Khan, S. Do fiscal decentralization and natural resources rent curb carbon emissions? Evidence from developed countries. Environ. Sci. Pollut. Res. 2021, 28, 49179–49190. [Google Scholar] [CrossRef]
  17. Sarkodie, S.A.; Adams, S. Renewable energy, nuclear energy, and environmental pollution: Accounting for political institutional quality in South Africa. Sci. Total Environ. 2018, 643, 1590–1601. [Google Scholar] [CrossRef]
  18. Magazzino, C. The relationship among economic growth, CO2 emissions, and energy use in the APEC countries: A panel VAR approach. Environ. Syst. Decis. 2017, 37, 353–366. [Google Scholar] [CrossRef]
  19. Adebayo, T.S.; Akadiri, S.S.; Adedapo, A.T.; Usman, N. Does interaction between technological innovation and natural resource rent impact environmental degradation in newly industrialized countries? New evidence from method of moments quantile regression. Environ. Sci. Pollut. Res. 2021, 29, 3162–3169. [Google Scholar] [CrossRef]
  20. Alola, A.A.; Adebayo, T.S.; Onifade, S.T. Examining the dynamics of ecological footprint in China with spectral Granger causality and quantile-on-quantile approaches. Int. J. Sustain. Dev. World Ecol. 2021, 29, 263–276. [Google Scholar] [CrossRef]
  21. Ahmed, Z.; Le, H.P. Linking Information Communication Technology, trade globalization index, and CO2 emissions: Evidence from advanced panel techniques. Environ. Sci. Pollut. Res. 2020, 28, 8770–8781. [Google Scholar] [CrossRef]
  22. Adebayo, T.S.; Kirikkaleli, D.; Adeshola, I.; Oluwajana, D.; Akinsola, G.D.; Osemeahon, O.S. Coal Consumption and Environmental Sustainability in South Africa: The role of Financial Development and Globalization. Int. J. Renew. Energy Dev. 2021, 10, 527–536. [Google Scholar] [CrossRef]
  23. Bekun, F.V.; Emir, F.; Sarkodie, S.A. Another look at the relationship between energy consumption, carbon dioxide emissions, and economic growth in South Africa. Sci. Total Environ. 2019, 655, 759–765. [Google Scholar] [CrossRef] [PubMed]
  24. Zhang, L.; Li, Z.; Kirikkaleli, D.; Adebayo, T.S.; Adeshola, I.; Akinsola, G.D. Modeling CO2 emissions in Malaysia: An application of Maki cointegration and wavelet coherence tests. Environ. Sci. Pollut. Res. 2021, 28, 26030–26044. [Google Scholar] [CrossRef] [PubMed]
  25. Rahman, M.M. Environmental degradation: The role of electricity consumption, economic growth and globalisation. J. Environ. Manag. 2020, 253, 109742. [Google Scholar] [CrossRef]
  26. Kirikkaleli, D.; Adebayo, T.S.; Khan, Z.; Ali, S. Does globalization matter for ecological footprint in Turkey? Evidence from dual adjustment approach. Environ. Sci. Pollut. Res. 2020, 28, 14009–14017. [Google Scholar] [CrossRef]
  27. Shahbaz, M.; Sharma, R.; Sinha, A.; Jiao, Z. Analyzing nonlinear impact of economic growth drivers on CO2 emissions: Designing an SDG framework for India. Energy Policy 2020, 148, 111965. [Google Scholar] [CrossRef]
  28. Usman, O.; Akadiri, S.S.; Adeshola, I. Role of renewable energy and globalization on ecological footprint in the USA: Implications for environmental sustainability. Environ. Sci. Pollut. Res. 2020, 27, 30681–30693. [Google Scholar] [CrossRef]
  29. Lau, L.-S.; Choong, C.-K.; Ng, C.-F.; Liew, F.-M.; Ching, S.-L. Is nuclear energy clean? Revisit of Environmental Kuznets Curve hypothesis in OECD countries. Econ. Model. 2018, 77, 12–20. [Google Scholar] [CrossRef]
  30. Bello, M.O.; Solarin, S.A.; Yen, Y.Y. The impact of electricity consumption on CO2 emission, carbon footprint, water footprint and ecological footprint: The role of hydropower in an emerging economy. J. Environ. Manag. 2018, 219, 218–230. [Google Scholar] [CrossRef]
  31. Adebayo, T.S.; Akadiri, S.S.; Akpan, U.; Aladenika, B. Asymmetric effect of financial globalization on carbon emissions in G7 countries: Fresh insight from quantile-on-quantile regression. Energy Environ. 2022, 3, 45–61. [Google Scholar] [CrossRef]
  32. Wang, J.; Xu, Y. Internet Usage, Human Capital and CO2 Emissions: A Global Perspective. Sustainability 2021, 13, 8268. [Google Scholar] [CrossRef]
  33. Rahman, M.M.; Vu, X.-B. The nexus between renewable energy, economic growth, trade, urbanisation and environmental quality: A comparative study for Australia and Canada. Renew. Energy 2020, 155, 617–627. [Google Scholar] [CrossRef]
  34. Yazdi, S.K.; Beygi, E.G. The dynamic impact of renewable energy consumption and financial development on CO2 emissions: For selected African countries. Energy Sources Part B Econ. Plan. Policy 2017, 13, 13–20. [Google Scholar] [CrossRef]
  35. Ling, G.; Razzaq, A.; Guo, Y.; Fatima, T.; Shahzad, F. Asymmetric and time-varying linkages between carbon emissions, globalization, natural resources and financial development in China. Environ. Dev. Sustain. 2021, 4, 1–29. [Google Scholar] [CrossRef] [PubMed]
  36. Khan, Z.; Ali, S.; Umar, M.; Kirikkaleli, D.; Jiao, Z. Consumption-based carbon emissions and International trade in G7 countries: The role of Environmental innovation and Renewable energy. Sci. Total Environ. 2020, 730, 138945. [Google Scholar] [CrossRef]
  37. Zhang, J.; Dai, Y.; Su, C.-W.; Kirikkaleli, D.; Umar, M. Intertemporal change in the effect of economic growth on carbon emission in China. Energy Environ. 2021, 32, 1207–1225. [Google Scholar] [CrossRef]
  38. Koenker, R.; Bassett, G. Regression Quantiles. Econometrica 1978, 46, 33–50. [Google Scholar] [CrossRef]
  39. Sim, N.; Zhou, H. Oil prices, US stock return, and the dependence between their quantiles. J. Bank. Financ. 2015, 55, 1–8. [Google Scholar] [CrossRef]
  40. Adebayo, T.S.; Oladipupo, S.D.; Adeshola, I.; Rjoub, H. Wavelet analysis of impact of renewable energy consumption and technological innovation on CO2 emissions: Evidence from Portugal. Environ. Sci. Pollut. Res. 2021, 2, 1–18. [Google Scholar] [CrossRef]
  41. Adebayo, T.S.; Udemba, E.N.; Ahmed, Z.; Kirikkaleli, D. Determinants of consumption-based carbon emissions in Chile: An application of non-linear ARDL. Environ. Sci. Pollut. Res. 2021, 28, 43908–43922. [Google Scholar] [CrossRef]
  42. Kirikkaleli, D.; Adebayo, T.S. Do public-private partnerships in energy and renewable energy consumption matter for consumption-based carbon dioxide emissions in India? Environ. Sci. Pollut. Res. 2021, 28, 30139–30152. [Google Scholar] [CrossRef] [PubMed]
  43. Kirikkaleli, D.; Adebayo, T.S. Do renewable energy consumption and financial development matter for environmental sustainability? New global evidence. Sustain. Dev. 2020, 29, 583–594. [Google Scholar] [CrossRef]
  44. Adebayo, T.S.; Acheampong, A.O. Modelling the globalization-CO2 emission nexus in Australia: Evidence from quantile-on-quantile approach. Environ. Sci. Pollut. Res. 2021, 29, 9867–9882. [Google Scholar] [CrossRef] [PubMed]
  45. Adebayo, T.S.; Agyekum, E.B.; Altuntaş, M.; Khudoyqulov, S.; Zawbaa, H.M.; Kamel. Does information and communication technology impede environmental degradation? fresh insights from non-parametric approaches. Heliyon 2022, 3, 22–35. [Google Scholar] [CrossRef]
  46. Xu, Z.; Baloch, M.A.; Danish; Meng, F.; Zhang, J.; Mahmood, Z. Nexus between financial development and CO2 emissions in Saudi Arabia: Analyzing the role of globalization. Environ. Sci. Pollut. Res. 2018, 25, 28378–28390. [Google Scholar] [CrossRef]
  47. Ulucak, Z.S.; Yucel, A.G. Can renewable energy be used as an effective tool in the decarbonization of the Mediterranean region: Fresh evidence under cross-sectional dependence. Environ. Sci. Pollut. Res. 2021, 28, 52082–52092. [Google Scholar] [CrossRef]
  48. Umar, M.; Ji, X.; Kirikkaleli, D.; Xu, Q. COP21 Roadmap: Do innovation, financial development, and transportation infrastructure matter for environmental sustainability in China? J. Environ. Manag. 2020, 271, 111026. [Google Scholar] [CrossRef]
  49. Yuping, L.; Ramzan, M.; Xincheng, L.; Murshed, M.; Awosusi, A.A.; Bah, S.I.; Adebayo, T.S. Determinants of carbon emissions in Argentina: The roles of renewable energy consumption and globalization. Energy Rep. 2021, 7, 4747–4760. [Google Scholar] [CrossRef]
  50. Chen, Y.; Wang, Z.; Zhong, Z. CO2 emissions, economic growth, renewable and non-renewable energy production and foreign trade in China. Renew. Energy 2018, 131, 208–216. [Google Scholar] [CrossRef]
  51. IEA. International Energy Association. 2021. Available online: https://www.iea.org/countries/sweden (accessed on 1 June 2021).
  52. Cherni, A.; Jouini, S.E. An ARDL approach to the CO2 emissions, renewable energy and economic growth nexus: Tunisian evidence. Int. J. Hydrog. Energy 2017, 42, 29056–29066. [Google Scholar] [CrossRef]
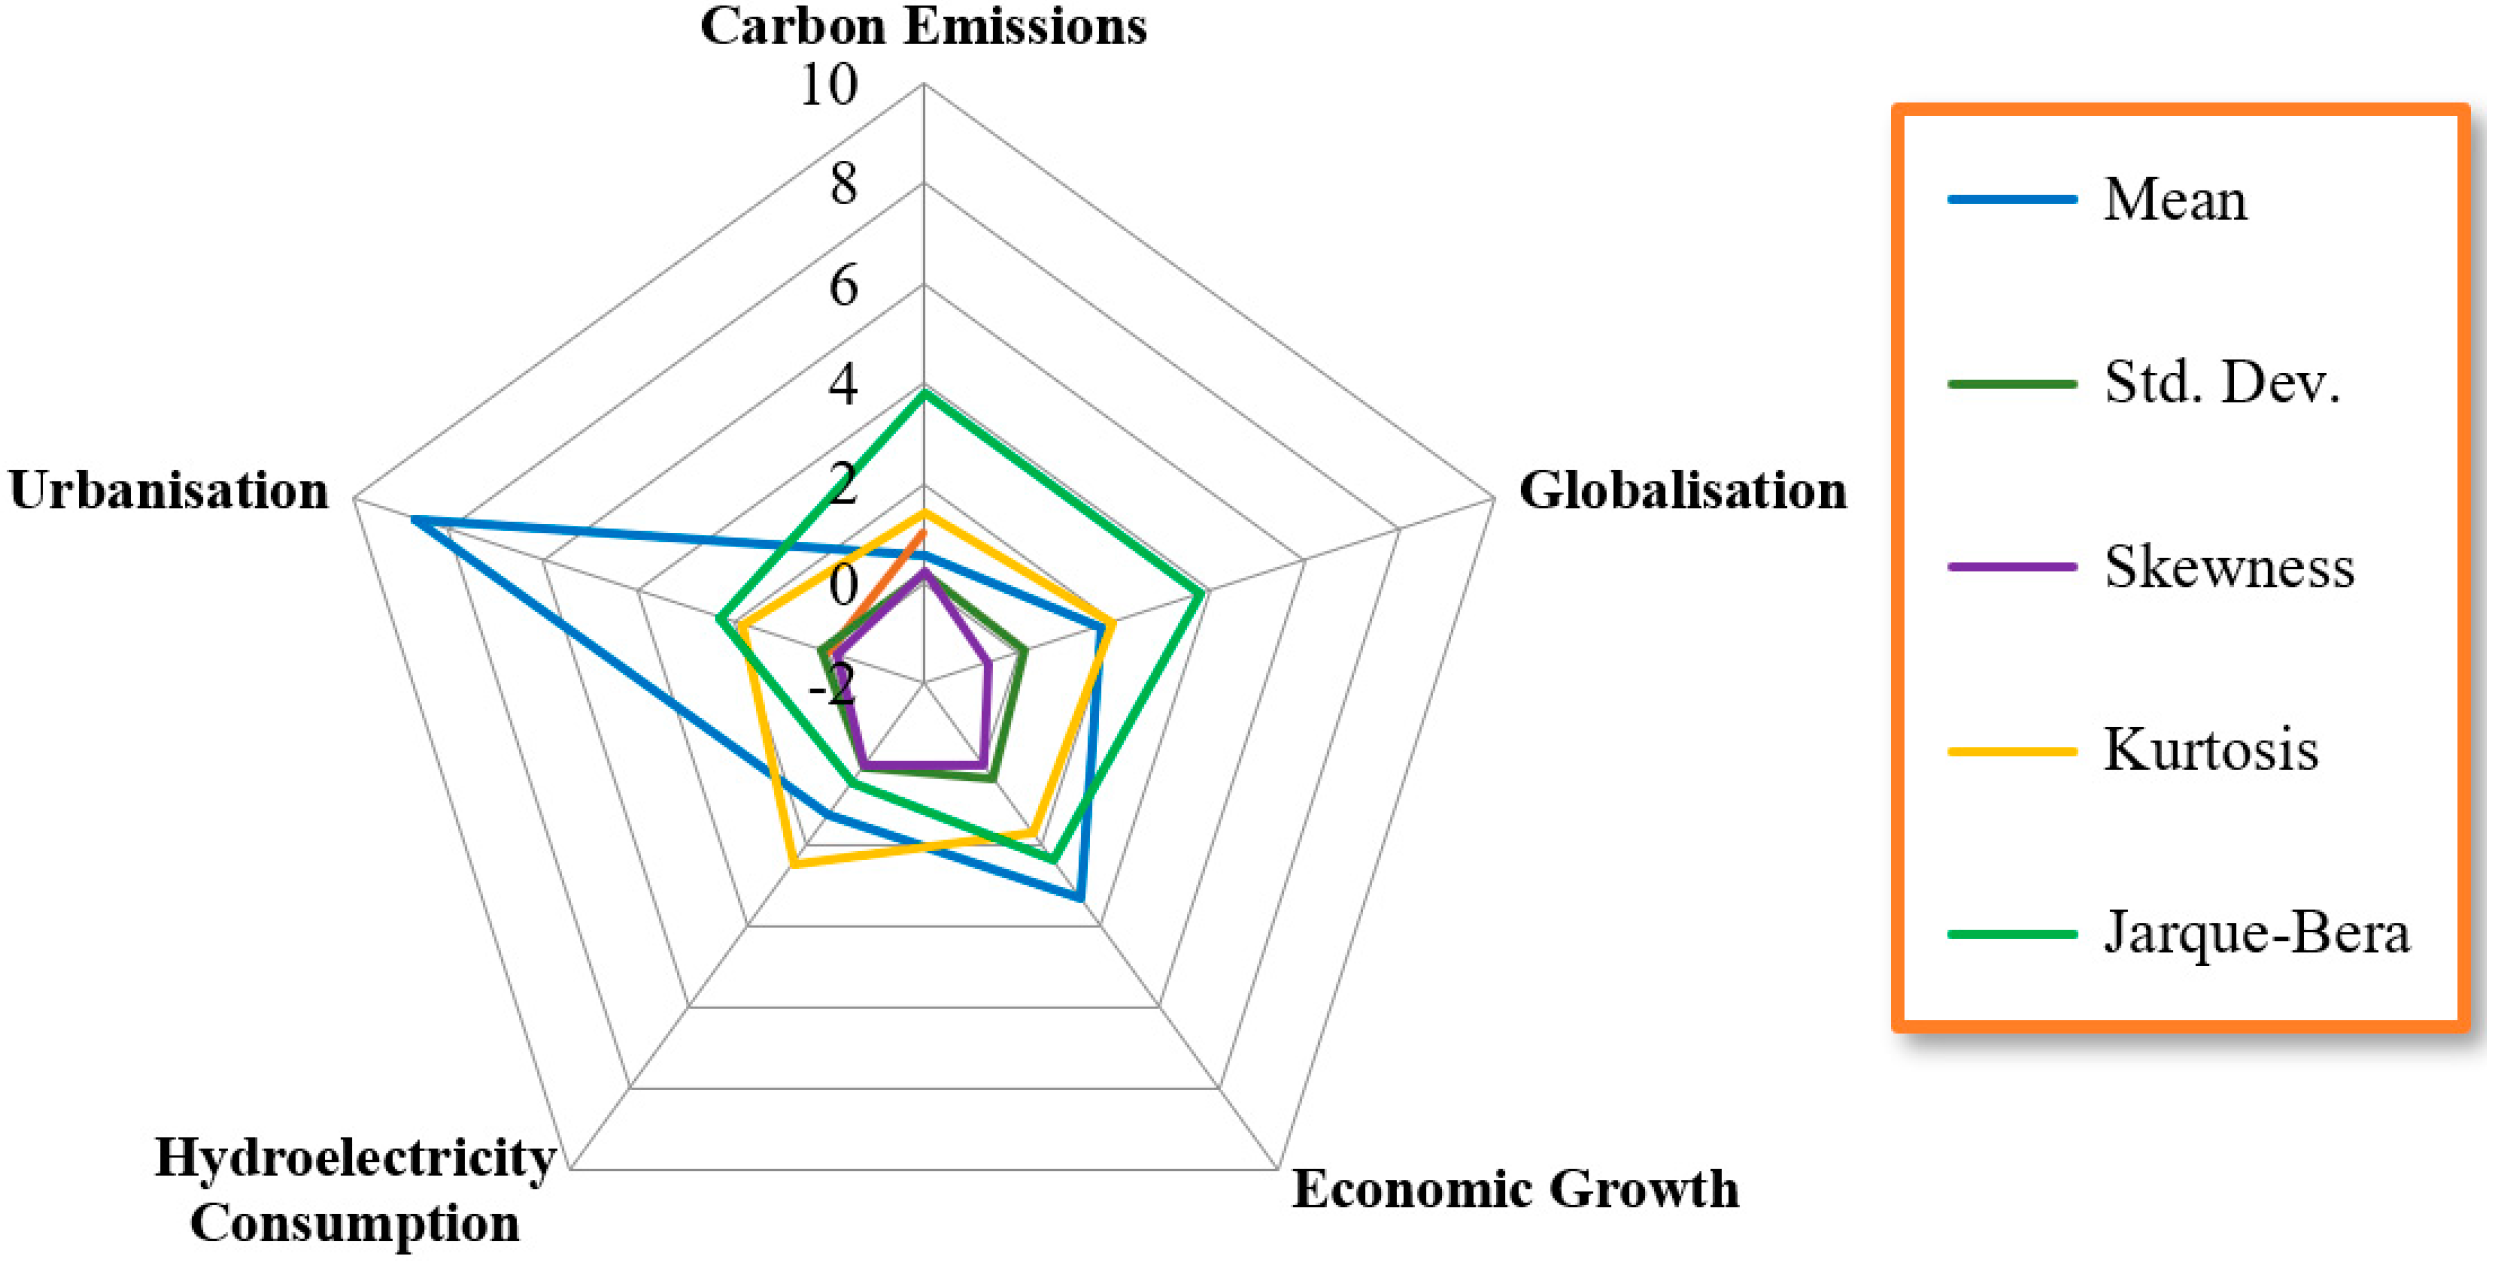
Figure 1. Descriptive Statistics.
Sustainability 14 04182 g001
Figure 2. Workflow of the Analysis.
Sustainability 14 04182 g002
Figure 3. QQ estimates of the slope coefficient.
Sustainability 14 04182 g003aSustainability 14 04182 g003b
Figure 4. Comparison of QR and QQR estimate. (a) Effect of GDP on CO2; (b) Effect of CO2 on GDP; (c) Effect of GLO on CO2; (d) Effect of CO2 on GLO; (e) Effect of URB on CO2; (f) Effect of CO2 on URB; (g) Effect of HYDRO on CO2; (h) Effect of CO2 on HYDRO.
Sustainability 14 04182 g004aSustainability 14 04182 g004b
Table 1. Correlation Test.
ProbabilityCO2GLOGDPHYDURB
CO21.0000
GLO0.9029 *1.0000
GDP0.9765 *0.9536 *1.0000
HYD−0.4717 *−0.6700 *−0.4983 *1.0000
URB0.9623 *0.9729 *0.9962 *−0.5429 *1.0000
Note: significance level of 1% is illustrated by *.
Table 2. BDS Test.
Table 2. BDS Test.
CO2URBGLOGDPHYD
M221.847 *28.171 *19.632 *28.511 *11.690 *
M322.161 *29.279 *20.642 *29.295 *11.283 *
M422.640 *31.053 *21.921 *30.732 *10.355 *
M523.734 *33.997 *23.806 *33.264 *10.088 *
M625.299 *38.152 *26.654 *37.106 *10.387 *
Note * signifies the 0.01 level of significance.
Table 3. ZA Unit root Tests.
I(0)I(1)
Variablest-StatBYt-StatisticBY
CO2−3.36811996−5.701 *2003
URB.−1.75212004−6.024 *2002
GDP−4.21742009−5.295 **2005
GLO−3.26162004−6.178 **2008
HYD−4.03222012−5.835 *2012
Note: 1% and 5% levels are shown by * and **.
Publisher’s Note: MDPI stays neutral with regard to jurisdictional claims in published maps and institutional affiliations.