Abstract
Corporate social responsibility (CSR) is a concept which has been approached from various perspectives and application areas. One of these areas regards how individuals perceive this concept and how their own personal characteristics define a given vision of business responsibility. The present study seeks to explore connections between individuals’ sociodemographic characteristics and CSR perception. By using unionized workers as research subjects, analysis techniques applied in Social Media and models based on metric spaces, we explore the attitudes of these subjects towards CSR. Both empirical and theoretical results provide evidence for the existence of a well-behaved relation between sociodemographic aspects and CSR dimensions, which future studies could approach in more depth using techniques based on machine learning.
1. Introduction
Corporate social responsibility (CSR) is considered a strategy, model and institutional orientation, which recognizes the relevance of various interest groups in each one of the various decision-making processes companies have [1,2]. The preceding conception is the result of the re-signifying of institutional management, which centers people [3] as shown in relations with strategic partners and even in respective reports on sustainability actions that aid in creating shared value [4,5,6]. This conception and focus on a human level is linked to business innovations and tensions particular to a more informed, empowered and changing society [7,8]. These business innovations take shape in strategic implementations, which aim to install mechanisms that include the needs and requirements of various stakeholders in each of their decision-making processes [9]. These include environmental changes along with the characteristics of various industries [10,11], and are linked to environmental management, corporate sustainability, CSR and sustainable management [12,13,14]. By contrast, this study considers CSR from the theory presented by [15], constituting four dimensions: economic, legal, ethical and philanthropic. These points have principally led to the development of studies by outside interest groups [16], such as customers [17,18,19]; suppliers are also included to a lesser degree [20]; considerations of internal interest groups, termed employees, closely follow [21]. This highlights the importance of employees’ perception of corporate success.
Implementing CSR contributes to perpetuating the company due to generating benefits which are the result of shared value creation between various stakeholders [22], including both internal and external intervening parties [23], and sets the framework for a relation of trust and reciprocity based on social wellbeing [24]. Nonetheless, this view is mainly established from companies’ own perspective. An understanding about the views and perceptions of CSR from workers themselves thus becomes an interesting aspect in CSR research. In particular, determining whether such views and perceptions are a result of specific traits among people is, in the authors’ view, a research problem worth addressing. This could help in designing socially responsible policies, strategies and actions in any sort of firm.
The present study seeks to develop empirical and theoretical results capable of supporting the fact that specific human traits could define particular CSR perceptions. This task is tackled by applying techniques based on Social Network Analysis (SNA) and Vector Space Theory. Empirically, evidence based on network structure and spectral distances shows a level of similarity between sociodemographic traits and CSR perceptions. Theoretically, a result based on a Vector Space Theory proves that a relation can be constructed between sociodemographic variables and CSR perception. Such a relation could be useful to either classify or predict perceptions from sociodemographic profiles, which is strategically important for organization addressing CSR as a positioning tactic. The existence of a homomorphism between a space of sociodemographic features and a space of CSR perceptions is the argument used for demonstrating that an internal relationship is preserved between these spaces [25]. Additionally, a bound on the level of similarity between sociodemographic features (or CSR perceptions) is provided. Thereby, a similarity metric (such as the Minkowski distance) can be sensitized by establishing thresholds that specify when two sociodemographic features (or CSR perception) are deemed equals.
2. Literature Review
Interest in studying CSR has motivated its approach from various perspectives and application areas. These include extraction, manufacturing and services, the last of which includes organizations dedicated to education, tourism, hospitality and healthcare [26,27,28,29]. Regarding our study, we consider various entities operating within the aforementioned areas. These various ways to approach social responsibility create supplies which make it possible to identify the needs of communities and individual workers [30]. In this way, business philosophy changes and adapts to new environmental demands, which appear in constructs including social, environmental, political, training, financial, philanthropic, legal and ethical aspects [4].
The latter indicate the cross-sectionality of socially responsible management, resulting from the actions of business figures who have undermined corporate credibility, sustainability, transparency and ethics [31,32]. This damage to companies’ reputations can be overcome via consultations approaching CSR perception among various stakeholders. The information generated can help mitigate actions which go against ethics and social responsibility in corporations.
The study of CSR considers stakeholders [33], given that they are the subject of different studies that give evidence about the effectiveness of socially responsible strategies. This has motivated its approach from perceptions, attitudes and preferences of the groups of interest, revealing their attributes for managing deals [34]. Therefore, the stakeholder theory justifies its consideration for creating value for each intervention in decision making [35], as a result of the management based on people and values that sustain interpersonal relationships [36].
Studies have been carried out considering both internal and external stakeholders [37]. These studies about CSR define study objects and conceptual perspectives, including approaches centered on consumers, supply chains, suppliers and financial services [38]. This indicates the need to include new practices and focuses leading to the incorporation of integral strategies associated with sustainability, leadership, culture and organizational change management [39,40,41]. This line of work includes studies emphasizing a focus on workers, cooperatives and union leaders [42], placing job satisfaction in a high position [43].
Regarding the aforementioned points, and in correspondence with this study, other research examines the perceptions of internal interest groups, including employees and their relation to the role of CSR in the workplace [44]. For their part, Su and Swanson [16] explore the influence of employees’ perception about CSR regarding wellbeing and behavior. Ng et al. [45] analyze the socio-emotional micro foundations of corporate social responsibility (CSR) in relation to employees’ perception–emotion–attitude–behavior sequence. Finally, this study gathers the attitudes and perceptions of workers from the theory presented by Carroll [15], which proposes that CSR should be assumed via economic, legal, ethical and philanthropic responsibilities.
Studies about unionized workers show longitudinal evidence of a tense relation between their social demands and existing Chilean institutions [46], due to the typical restrictions of a society which finds itself in a state of collective non-conformism, leading to social, political, health, environmental and epistemic crises [28] which do not exempt the practices and policies regulating labor relations [47,48]. These are strongly related with the c of the actions, which unions can carry out to demand the fulfillment of their own social and collective rights, and even human rights corresponding to decent, dignified employment [49].
In the aforementioned context, the State must be the guarantor of the relations underlying workers’ interests and company owners’ demands, aimed at protecting the tissue of society. This point has been motivated by supra-national organizations [50]. Companies must therefore aim to have healthy, fair and transparent labor relations [19] which seek and find points of agreement that contribute to organizational continuity; socially responsible business practices are one mechanism for this [51,52,53,54].
It is common to find studies that use the study subjects’ characteristics (including their sociodemographic traits), which allow for characterizing the respective samples, as well as providing supplies for their use leading to exploring attitudes and perceptions [55]. These include gender, age, functions, profession, occupation, origin, income level and others, all of which cover both qualitative and quantitative research, applying various research designs [56]. However, these sociodemographic traits do not necessarily constitute a profile (various simultaneous characteristics) [57]. Studies analyzing variables of this kind include Lu et al. [58], Sannino et al. [59] and Katmon et al. [60].
This literature analysis shows the importance of the perception which certain interest groups have about the use of CSR. Thus, from a strategic point of view, the capacity to anticipate this perception would help to establish courses of action which could improve organizations’ positioning. In particular, it would be interesting if they could establish whether certain individual traits define a particular vision of CSR. Specifically, we would want to know how given sociodemographic profiles can establish predictions about a certain perception regarding CSR. CSR literature apparently has not extensively developed this idea, which is what we intend to approach in this study via the use of techniques based on vectorial models and network analysis. Studies applying these techniques in a CSR context have been found, along with others, which seek to establish relations between information management and individual behavior [61,62,63,64]. However, these studies are mainly focused on describing relations between subjects based on their ideas regarding CSR, and not on determining how an individual profile defines a particular concept of CSR.
3. Materials and Methods
3.1. Research Focus and Design
A quantitative focus was chosen to approach the study objective, with a descriptive reach and an exploratory, cross-sectional cut, since the intention was to identify possible relations between sociodemographic characteristics of the union leaderships and their perceptions about CSR. To achieve this, we considered the generation of primary information which is studied via techniques based in Social Network Analysis. We also develop a metric space model that can help to identify the existence of a well-behaved relation between sociodemographic variables and CSR perception. Figure 1 depicts our research process. The study design is non-experimental, as none of the variables or study subjects undergo any experimentation [65].
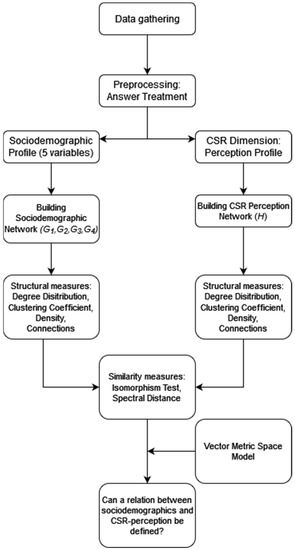
Figure 1.
Research Process.
3.2. Population and Sample
In the Maule Region of Chile, there are 447 [66] active union organizations, each with its representatives and directors. A non-probabilistic convenience sample was determined, which was made up of 108 union directorates; these were directly contacted during June 2017.
3.3. Instrument
The instrument used is a survey from Maignan [52], containing 16 affirmations which permit describing the perception of CSR as well as gathering information related to five interviewee sociodemographic variables: age, gender, educational level, income level and urbanization level.
This instrument has been applied to various consumers from France, Germany and the United States. These statements are directly related to the study carried out by Carroll [39] and his model involving CSR dimensions (economic, legal, ethical and philanthropical).
3.4. Data Gathering
Data were gathered from the primary sources during 2017 with the instrument described. For the application, each union leader was asked to voluntarily answer the instrument, with 25 minutes to complete the survey and allowing for possibility to clarify any doubts arising.
3.5. Analysis Techniques
3.5.1. Treatment for Answers
In order to facilitate the construction of the Network Model, the union representatives’ answers were digitalized to create a spreadsheet database. To handle the information, two reclassifications were carried out on both the affirmations and width of the Likert-type scale. Variable elimination is a product of their own contributions regarding the analysis of the study object from a statistical and epistemological perspective, which responds to the perception of the union representatives’ expectations. On the other hand, the adjustment of the Likert scale scope lies in the statistical analysis strategy proposed in this study, passing from six response levels (1 = Strongly disagree; 2 = Disagree; 3 = Slightly disagree; 4 = Slightly agree; 5 = Agree; 6 = Strongly agree) to three (1 = Disagree; 2 = Indifferent; 3 = Agree). To this end, we used the principles from Quero [67]. Everything discussed here takes up the theoretical proposal from Carroll [39], which has been widely studied in North America, Europe and Asia, and to a lesser extent in Latin America.
It should be mentioned that both reclassifications, from the perspective of the technique to be used, do not distort the reality of the results obtained via the survey. In the latter procedure, to objectively carry out this grouping, a simple arithmetical mean calculation was carried out. In other words, those answers within levels (1) and (2) were classified within the new level (1); the answers in levels (3) and (4) were classified within the new level (2), and the answers in levels (5) and (6) were classified within the new level (3).
Reclassifying the answers made it possible to supply the data provided to facilitate information treatment and grouping. This aligns with the research design and statistical strategies according to the findings' depth. One major reference point here is the proposal from Carroll [39] regarding corporate social responsibility: economic, legal, ethical and philanthropic dimensions.
3.5.2. Network Model
Using networks to model phenomena has advantages over traditional statistical methods, since it allows for visualizing and better understanding the interaction dynamics between individuals, and how information is distributed between them [68].
The present study considered the construction of two non-directed networks and , whose vertex group V is the subject under study. The groups of connections E and E’ are defined based on similarity conditions, which are defined between the subjects, and which do not necessarily have the same cardinality. The first network considers sociodemographic similarity. This network has a non-directed connection between the two subjects, but only when they are sociodemographically similar. This means that their five corresponding sociodemographic variables have equal value.
Sociodemographic information was numerically coded so that each subject had a vector, grouping the corresponding values of each one of the five variables. Similarity was established by obtaining the absolute difference between the vectors associated with each pair of subjects. If this difference produces a zero vector, it will imply that the subjects are sociodemographically similar. However, for the income level and age variables, it was considered that similarity arose if the difference was less than or equal to 50,000 Chilean pesos and 5 years, respectively. Mathematically, and are two sociodemographic attribute vectors associated to the vertices and in , respectively. In this case, measures the similarity between the sociodemographic characteristics of the two vertices and .
A similar form of reasoning to the construction of was considered for structuring the second network , which addressed similarity regarding the subjects’ perception of CSR. In this case, each vertex corresponding to a subject was provided with a vector identifying the answers reclassified to each one of the four dimensions of CSR [39]. This reclassification numerically encoded the information associated with the subjects’ perception regarding the four dimensions of CSR. In this way, measures the similarity between two vertices regarding CSR.
Once constructed, the networks were structurally characterized via density estimation, grade distribution, grouping coefficient, isomorphism presence and spectral distance estimation. Furthermore, five networks, considering only part of the sociodemographic variables associated with were constructed and structurally characterized. They were descriptively contrasted with the perception network . In this, is a network built to approach gender similarity between the subjects; is a network considering similarity in gender and income level; and is a network characterizing similarity between income level and urbanization level. Similarities between gender and educational level are represented by the network . Finally, the network was built considering gender and age similarities.
Network density ρ is defined as . This means that 0 ≤ ρ ≤ 1, where n corresponds to the cardinality of set . The degree distribution of a network is the fraction of network vertices with the degree. The degree of a vertex is the number of connections it has. Thus, if a network has n vertices overall and of them have a degree, we can see that . The local grouping coefficient from a vertex quantifies how close said vertex is to forming a clique with its adjacent vertices. Next, the average grouping coefficient is defined as . Finally, two networks and are considered isomorphic if there is a bijection between their sets of vertices. Mathematically, this means , so that two vertices and in are adjacent if and only if and are adjacent in . The importance of establishing whether two networks are isomorphic lies in the way that both networks share the “same network structure”.
Further details associated with the metrics described and the problem of network isomorphism can be found in Dehmer and Emmert-Streib [69]. The study by Wills and Meyerid [70] presents the adjacent spectral distance, which is defined as . Where and are the spectra of the corresponding adjacency matrices of and , respectively. This distance establishes a similarity level between two networks based on the connectivity and properties of the Eigenvalues of the adjacency matrices. Thus, if two networks and are structurally identical, then .
All networks were implemented via the Network X 2.5 complement of Python. The same complement makes it possible to obtain the different structural metrics associated with the networks, as well as to determine the existence of isomorphisms and spectral distances.
3.5.3. Vector Metric Space Model
An alternative way to analyze relations between sociodemographic and SR-perceptions is by considering both aspects as vector metric spaces.
Let be a - dimensional metric space, where represents a set of sociodemographic vectors. Each vector is identified by real-value coordinates , and each coordinate corresponds to a sociodemographic feature. Metric is a distance function between two vectors and in X defined as
where 0 corresponds to the zero vector.
This notion of distance establishes two important characteristics: is a sociodemographic similarity metric and is a discrete metric vector space [71]. This definition provides a clear connection to the graph modeling approach as well, since edges are added to the graph based on a binary relation. For this work, it was particularly noticed that since five features define a sociodemographic profile.
Alternatively, the distance function can also be defined as
Equation (2) is known as Minkowski distance. The Manhattan and Euclidean distances are part of this family of metrics. Unlike the distance function in Equation (1), the Minkowski metric is able to deliver a more precise measurement of similarity (or dissimilarity).
For SR-perceptions, is a -dimensional metric space, where Y is a set of SR-dimensions vectors identified by real-value coordinates and analogously defined as Equation (1). Since there are three dimensions defining SR-perception, then . Distance is also a similarity perception metric and defines a discrete metric vector space.
4. Results
4.1. Empirical Analysis of the Graph Model
The sample size corresponds to 108 study subjects, all of whom were unionized workers at companies belonging to various fields in the Maule Region, Chile. Their sociodemographic characteristics are detailed in Table 1.

Table 1.
Statistical Characterization of the Sample.
The interviewees were adults with an average age of 43.3 years. The minimum age range was 23 years, while the highest age for the interviewees was 66 years.
For the gender sociodemographic variable, there was a strong male majority in the study, as men represented over 80% of the sample.
Regarding educational level, it is notable that 76% of the respondents finished high school.
It is important to mention, before going further into the income level variable, that the minimum wage in Chile at the time the study was carried out stood at CLP 264,000 (Chilean pesos), which was around USD 400 per month. In general, the average of the variable indicated that the study subjects, on average, received compensation to the amount of around CLP 500,000. This value can be affected by the distance from the legal minimum wage (CLP 270,000) to the maximum represented range (CLP 1,200,000).
One interesting sociodemographic variable to approach via this survey is the urbanization level, i.e., the geographical location where the study subjects lived. In this case, two sectors were determined: urban and rural. Statistical characterization indicates that over 80% lived in an urban location.
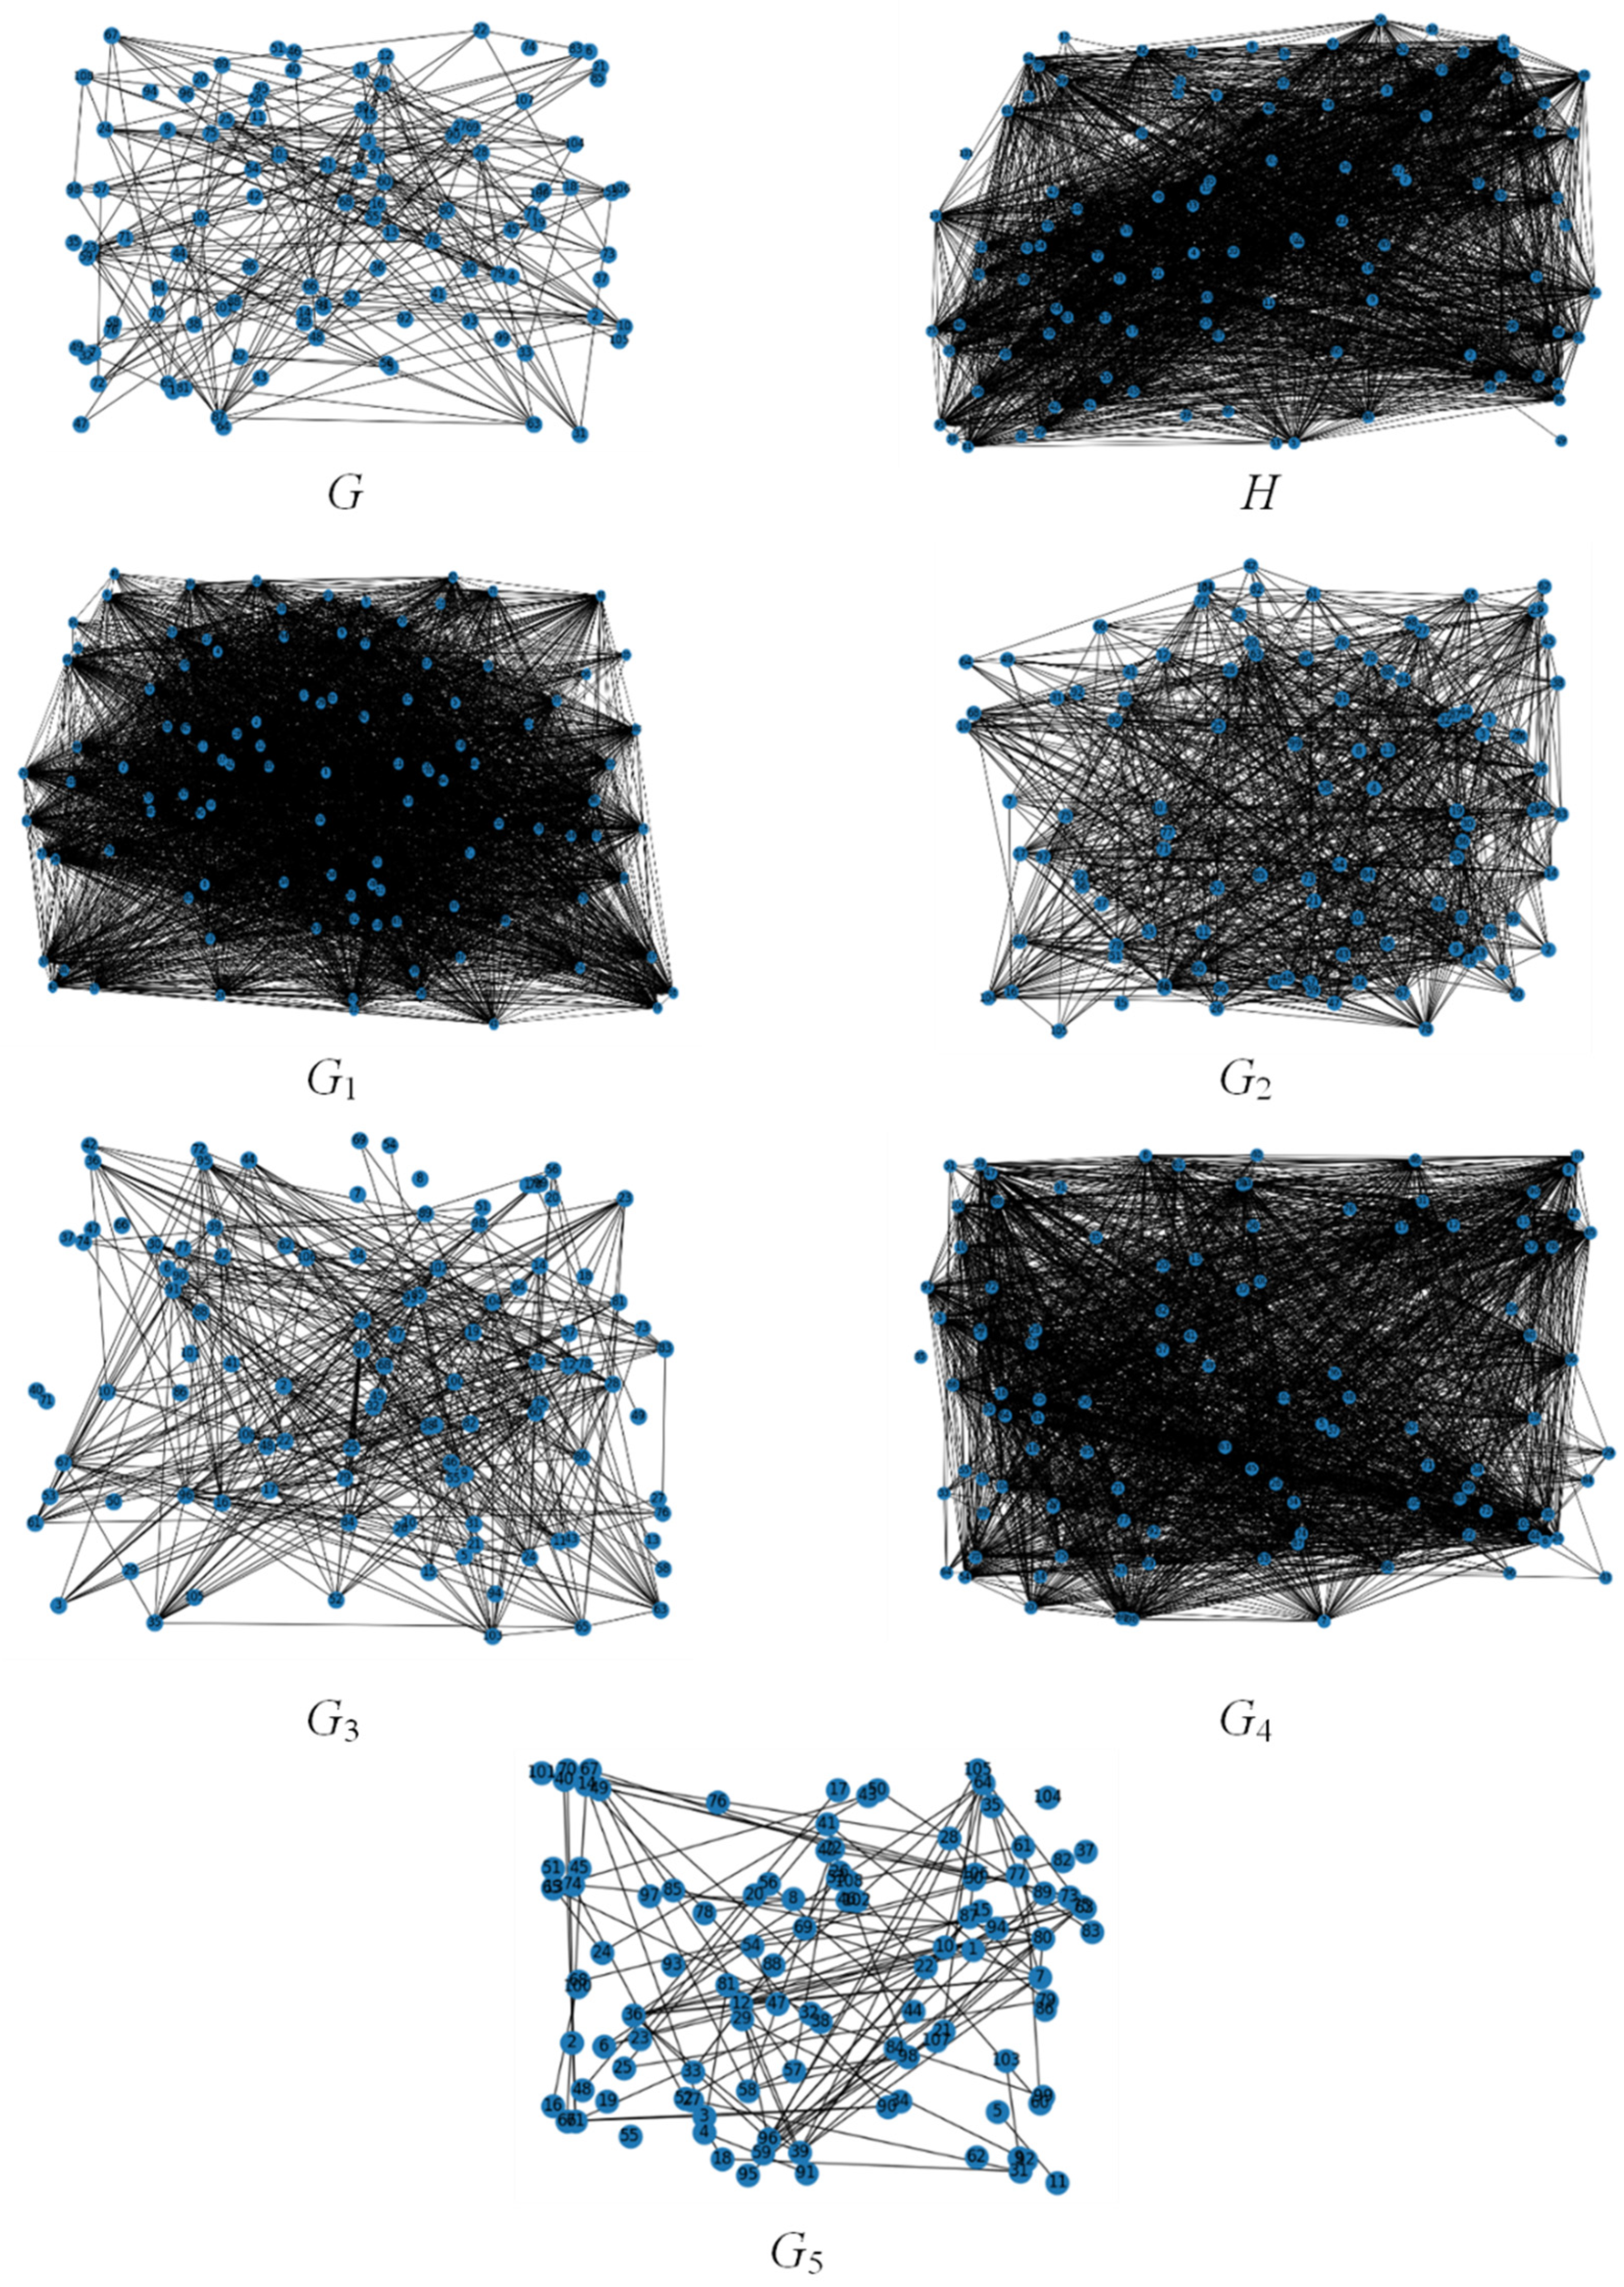
The networks are visualized in Figure 2. Darker coloring shows high density values and connection numbers. In this way, the networks , , and in that order have the highest number of connections and density.
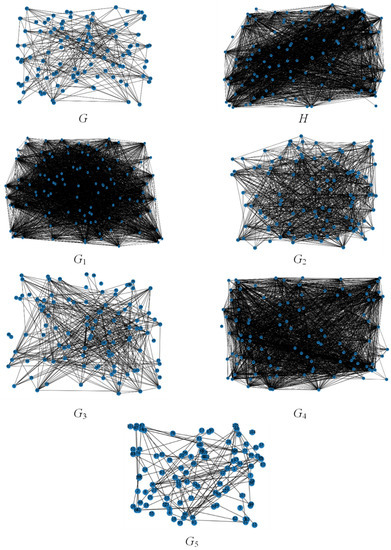
Figure 2.
Network Visualizations. (a) Sociodemographic similarity network G, (b) CSR perceptions similarity network H, (c) gender similarity network G1, (d) gender and income level similarity network G2, (e) income and urbanization similarity network G3, (f) gender and educational level similarity network G4, (g) gender and age similarity network G5.
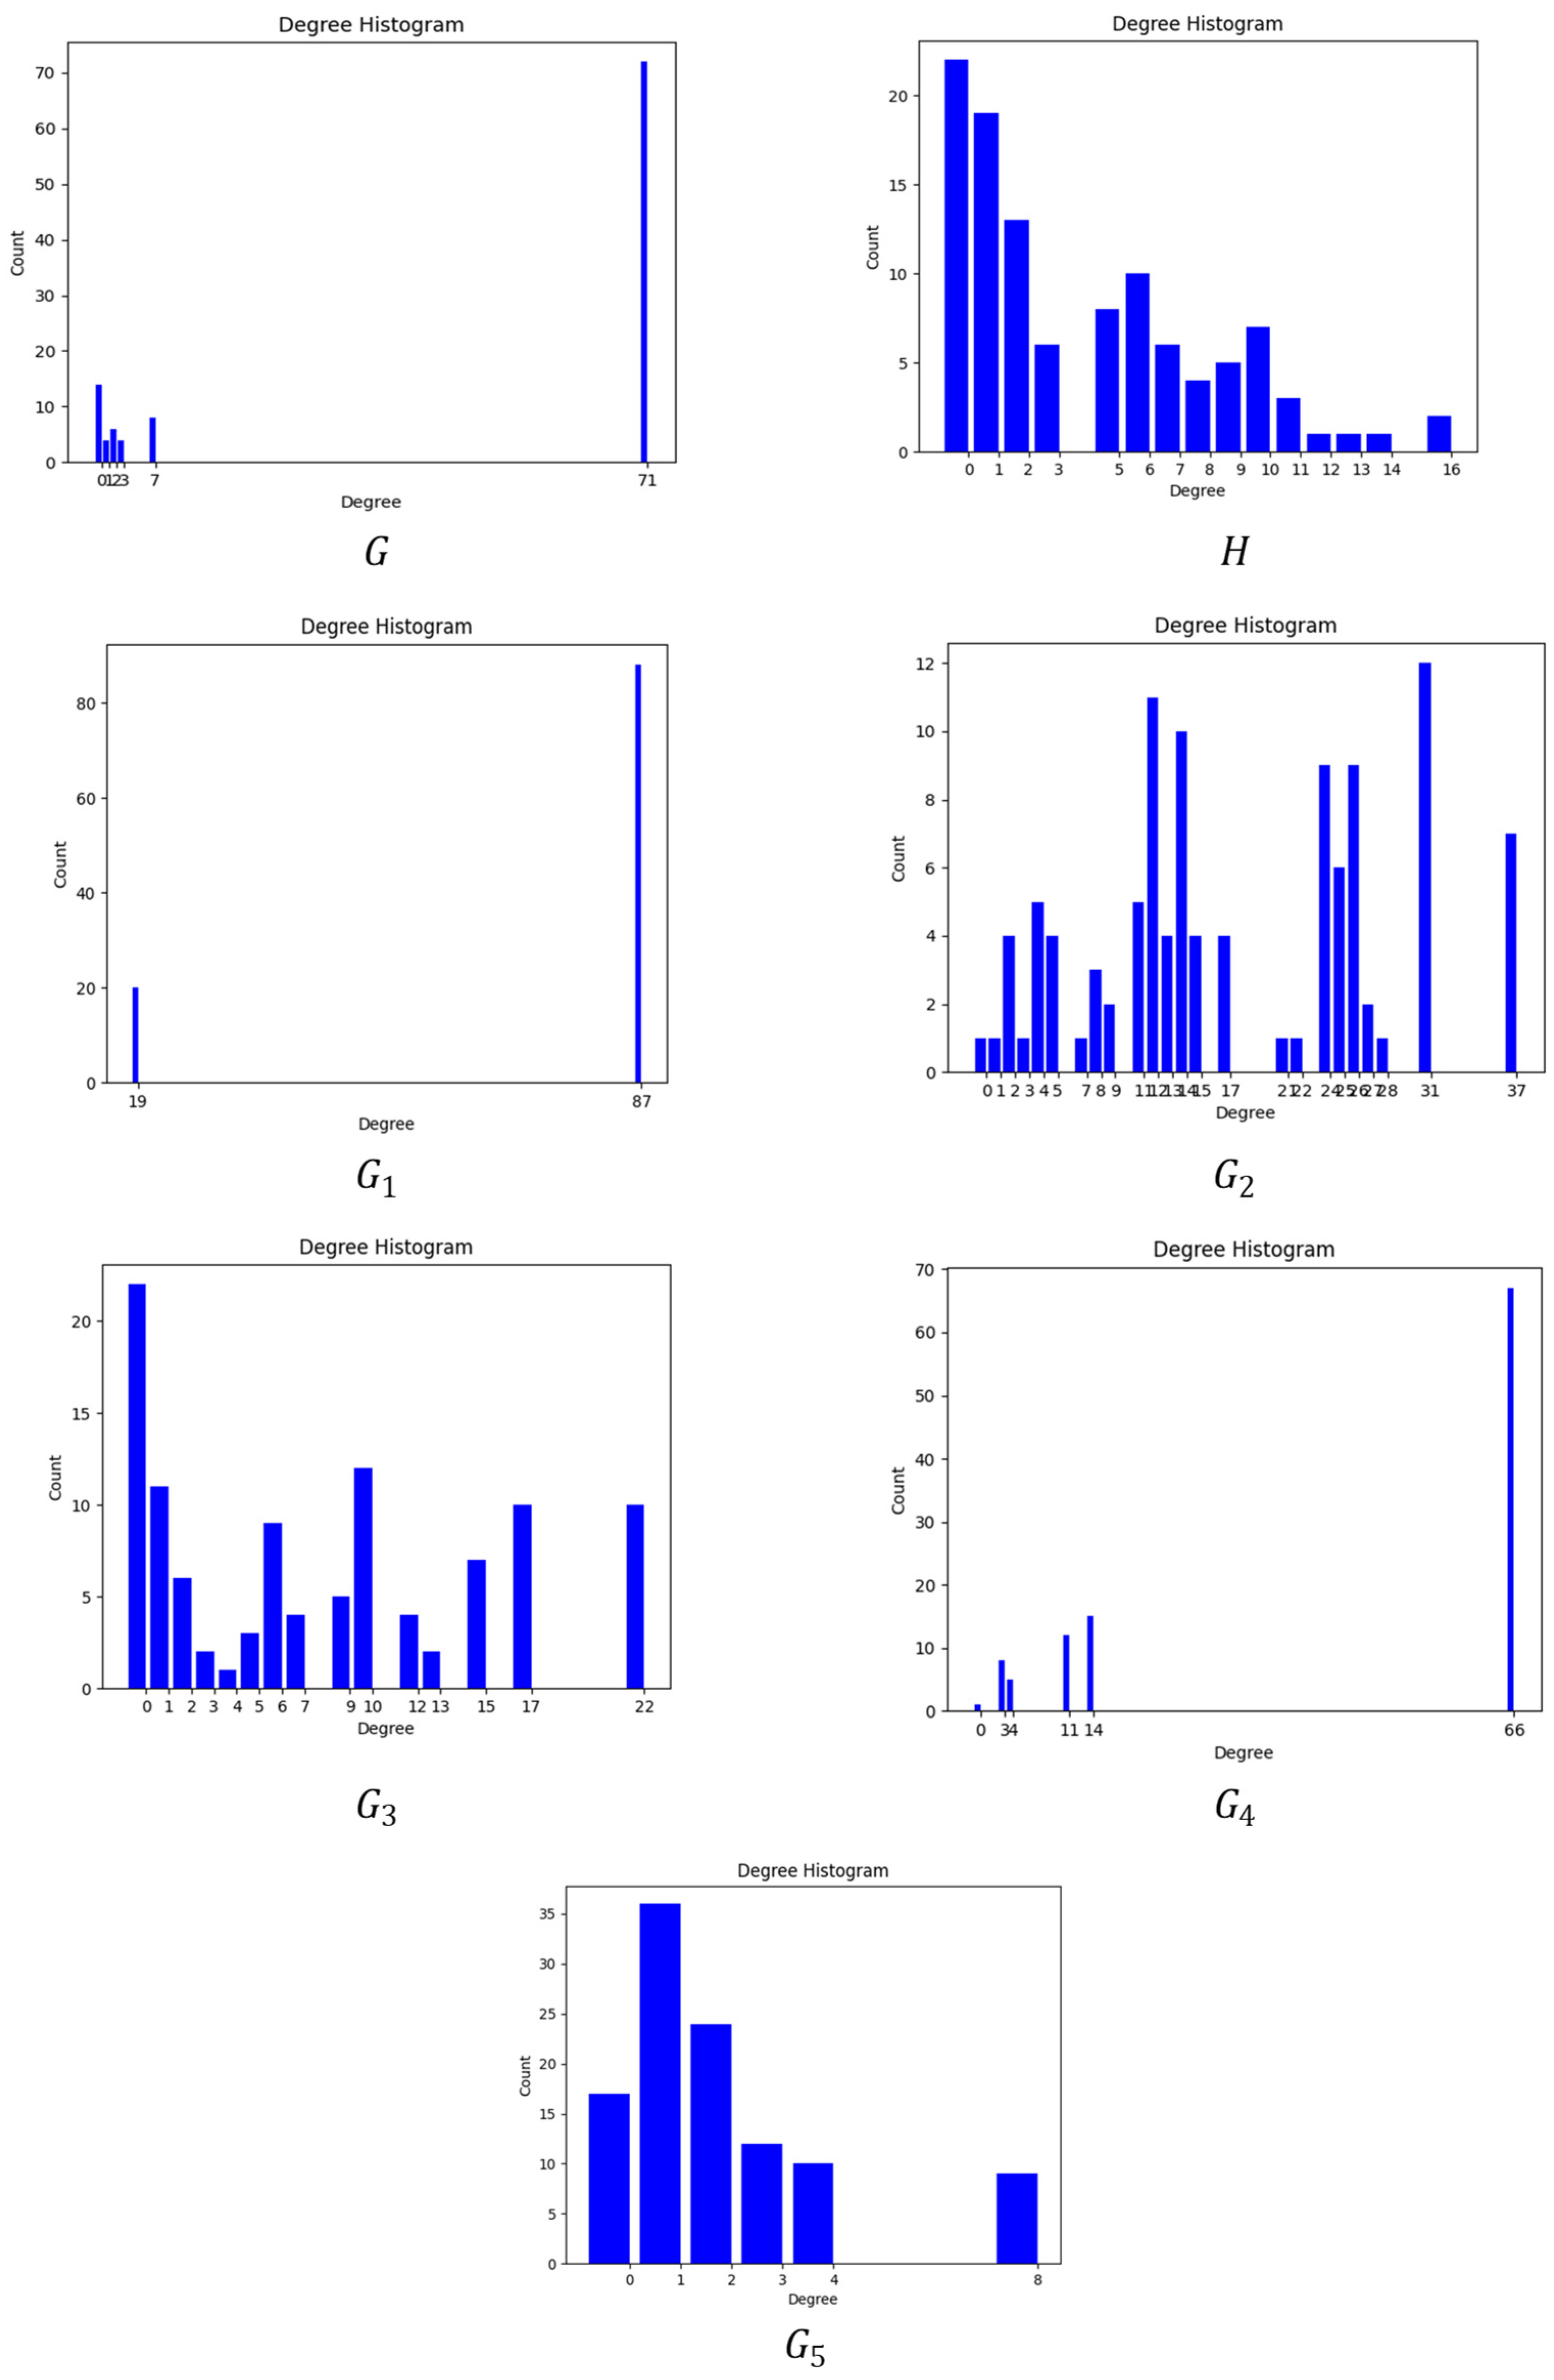
Degree distributions for the various networks are shown in Figure 3. The networks , and show high degree values for most of the vertices, while a smaller number have low values. There is also an evident gap between high and low degree values. On the other hand, the networks , , and show a dispersion with fewer vacancies and with degree values distributed between a minimum of 0 and a maximum of 37. These network biases shows a general inclination towards low degree values, except for network where the bias is insufficiently clear.
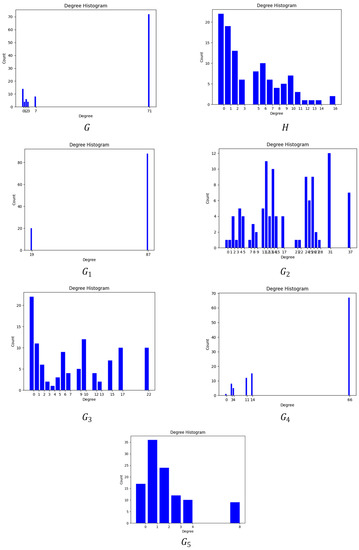
Figure 3.
Network Degree Distributions. (a) Sociodemographic similarity network G, (b) CSR perceptions similarity network H, (c) gender similarity network G1, (d) gender and income level similarity network G2, (e) income and urbanization similarity network G3, (f) gender and educational level similarity network G4, (g) gender and age similarity network G5.
The structural and similarity measurements for the networks developed are described in Table 2. Greater values for ρ and indicate a greater fulfillment of the sociodemographic similarity or CSR perception conditions. The networks , and stand out due to having over two thousand connections, which also carries high density. The aforementioned networks present higher grouping levels as well, which is shown by their corresponding coefficients. There is no presence of isomorphism regarding network arising for sociodemographic similarity networks. However, the spectral distance shows that the network is the closest in similarity to , followed by .
Table 2.
Structural and Similarity Measurements.
4.2. Theoretical Results
Two theoretical results are shown in this section. First, it is noticed that the current setting of our study allows us to prove an important property of the vector metric space model. Secondly, based on an argument presented by Steele [72], a bound on the dissimilarity is established when a metric defined over the hypercube is used.
Proposition 1.
Two discrete metric spaces representing sociodemographics and RS-perception of a set of individuals are homomorphic.
Proof of Proposition 1.
Let
and
be two discrete metric spaces, where sets X and Y represent vectors associated with sociodemographic features and SR-perceptions of individuals in set
, respectively. Next, consider labeling each vector
by assigning indexes
to each X in X so that
. Analogously, label each vector
with a
so that
. Then, the continuous function
given by
is bijective and defines a homomorphism between and since . Therefore, and are homomorphic. □
Proposition 2.
For a metric space, the following inequality holds
whereis a set of feature vectors, each composed byreal-valueinandis a constant that depends on.
Proof of Proposition 2.
Consider dividing
with
boxes with diameter
, where
correspond to Big-O notation. Note that a box can contain any unique , more than one
or no . Hence, by applying the Dirichlet’s box principle, the presented bound holds. □
5. Discussion and Conclusions
The present study aimed to provide an exploratory description of the behavior of various sociodemographic variables in contrast with CSR perceptions among unionized workers from various professions in the Maule Region of Chile. The use of tools based on techniques from Social Network Analysis has allowed us to establish research questions related to possible interdependencies, which could exist between the sociodemographic profile of a subject and their perception of CSR. In particular, spectral distance and the existence of isomorphisms are indicators allowing us to establish the possible presence of a relation. These indicators are complemented with network metrics and their degree distributions.
While the isomorphism test was negative for all the networks studied, one clear consequence of these results is that a well-behaved function between the group of sociodemographic variables and the four dimensions of CSR can be constructed by establishing a group of conditions on the sociodemographic profile of each subject. Mathematically, this can be represented as , where is the well-behaved relation which is meant to be constructed. Because of this, questions arise, including:
- Why are sociodemographic variables not interdependent with CSR perception?
- What are the sociodemographic variables where there could potentially be interdependence with CSR perception?
- If the sociodemographic variables show no interdependence, then which variables for unionized workers are interdependent with CSR perception?
The results show that gender and educational level define a similar perception level for CSR among survey respondents. This is supported by the values for spectral distance and Average Grouping Coefficient. The relation between gender and educational level variables regarding CSR perception is supported by other studies in the scientific literature, such as studies by Pérez and Rodríguez [73] and Currás, Dolz and Miquel [74]. These authors’ studies showed that gender and education level define a specific perception about CSR. However, their studies approached these sociodemographic characteristics separately and without concluding whether a relation can be established from such characteristics. In a similar view, Meyers-Levy [75] evidence that consumers react to CSR differently depending on their demographic characteristics. Nevertheless, the study only focuses on describing such reaction, and not whether such reaction can be defined from demographic variables. Consequently, the definition of any potential isomorphism between gender variables and CSR perception is a topic which future studies can address.
One notable characteristic associated with the network is its degree distribution. In Figure 3, network shows an apparent behavior as a Power Law. The existence of a Power Law in degree distributions is an indicator of a network generating process which can be based on a series of phenomena, including Preferential Attachment, Multiplicative Processes, Random Changes or Yule Processes [76]. To approach this possibility, it is necessary to increase the sample size so as to guarantee high representativity in the network model. Clearly, the existence of this Power Law and its possible generative process should be studied in greater detail.
The theoretical results pose important questions regarding the connection between sociodemographics and SR-perception. Proposition (1) shows the existence of homomorphism between both space features. However, such homomorphism does not preserve distance; hence, it becomes an interesting result to show that both spaces are isomorphic. In terms of metric spaces, this means to prove that and are isometric. Nonetheless, a distance preserving function between X and Y is not straightforward since it requires analyzing qualitative aspects that makes a specific sociodemographic profile develop a particular SR-perception. As far as the current literature review is concerned, studies developing an analysis based on any sort of mathematical morphisms are not found in the context of CSR.
Proposition (2) provides a bound on the minimum level of dissimilarity between the feature vectors of two individuals. Such a bound can be used for assessing similar behavior in a feature space. The proof relies on normalization of the feature space to , which is assumed to be possible since features (sociodemographics and RS-perception) are quantifiable in terms of real values. Additionally, the bound helps to sensitize a similarity metric (such as the Minkowski distance) so that a threshold can be established to specify when two features are considered equal [77]. For example, as the bound yields a minimum level of dissimilarity, then the value of this bound can be used as a threshold.
These theoretical results pose an interesting modeling possibility since a mathematical function could be constructed to either classify or predict CSR perceptions from sociodemographic traits. This idea becomes important for the development of company strategies based on CSR. Nonetheless, sociodemographic traits defining CSR perceptions is a premise not shared by some authors. For instance, Furman et al. [57] indicates that personal values are more useful in understanding different attitudes toward CSR than demography. Despite this, the theoretical results are robust enough to be considered in a scenario where CSR perceptions might be defined from personal values, since a subject profile based on such values can be built as well.
Finally, the application of techniques based on machine learning is becoming a worthwhile research area, thus future research can explore questions regarding the classification or prediction of CSR perception based on training data collected from different research subjects.
Author Contributions
Conceptualization, P.S.-G.; methodology, F.L.-V. and V.S.-R.; software, F.L.-V.; validation, P.S.-G.; formal analysis, F.L.-V.; investigation, P.S.-G.; resources, V.S.-R., L.Y.G. and N.G.-C.; data curation, N.A.-B.; writing—original draft preparation, N.A.-B.; writing—review and editing, P.S.-G., V.S.-R., L.Y.G. and N.G.-C. All authors have read and agreed to the published version of the manuscript.
Funding
This research received no external funding.
Institutional Review Board Statement
Not applicable.
Informed Consent Statement
Not applicable.
Data Availability Statement
Not applicable.
Conflicts of Interest
The authors declare no conflict of interest.
References
- Ali, W.; Frynas, J.G.; Mahmood, Z. Determinants of Corporate Social Responsibility (CSR) Disclosure in Developed and Developing Countries: A Literature Review. Corp. Soc. Responsib. Environ. Manag. 2017, 24, 273–294. [Google Scholar] [CrossRef]
- Ki, C.W.; Chong, S.M.; Ha-Brookshire, J.E. How fashion can achieve sustainable development through a circular economy and stakeholder engagement: A systematic literature review. Corp. Soc. Responsib. Environ. Manag. 2020, 27, 2401–2424. [Google Scholar] [CrossRef]
- Carroll, A.B. Carroll’s pyramid of CSR: Taking another look. Int. J. Corp. Soc. Responsib. 2016, 1, 3. [Google Scholar] [CrossRef] [Green Version]
- Shabana, K.M.; Buchholtz, A.K.; Carroll, A.B. The Institutionalization of Corporate Social Responsibility Reporting. Bus. Soc. 2017, 56, 1107–1135. [Google Scholar] [CrossRef]
- El Akremi, A.; Gond, J.-P.; Swaen, V.; De Roeck, K.; Igalens, J. How Do Employees Perceive Corporate Responsibility? Development and Validation of a Multidimensional Corporate Stakeholder Responsibility Scale. J. Manag. 2018, 44, 619–657. [Google Scholar] [CrossRef]
- Blanc, R.; Cho, C.H.; Sopt, J.; Branco, M.C. Disclosure Responses to a Corruption Scandal: The Case of Siemens AG. J. Bus. Ethics 2017, 156, 545–561. [Google Scholar] [CrossRef]
- Ashrafi, M.; Magnan, G.M.; Adams, M.; Walker, T.R. Understanding the Conceptual Evolutionary Path and Theoretical Underpinnings of Corporate Social Responsibility and Corporate Sustainability. Sustainability 2020, 12, 760. [Google Scholar] [CrossRef] [Green Version]
- Severino-González, P.; Medina-Giacomozzi, A.; Muñoz-Huaracán, S. Responsabilidad social empresarial y sistema de salud: Percepción de los trabajadores de la salud en Chile. Interciencia 2021, 46, 126–132. [Google Scholar]
- Lee, T.H. The status of corporate social responsibility research in public relations: A content analysis of published articles in eleven scholarly journals from 1980 to 2015. Public Relat. Rev. 2017, 43, 211–218. [Google Scholar] [CrossRef]
- Mao, Y.; He, J.; Morrison, A.M.; Coca-Stefaniak, J.A. Effects of tourism CSR on employee psychological capital in the COVID-19 crisis: From the perspective of conservation of resources theory. Curr. Issues Tour. 2021, 24, 2716–2734. [Google Scholar] [CrossRef]
- Zhang, Q.; Oo, B.L.; Lim, B.T.H. Drivers, motivations, and barriers to the implementation of corporate social responsibility practices by construction enterprises: A review. J. Clean. Prod. 2019, 210, 563–584. [Google Scholar] [CrossRef]
- Schaltegger, S.; Hörisch, J.; Freeman, R.E. Business Cases for Sustainability: A Stakeholder Theory Perspective. Organ. Environ. 2019, 32, 191–212. [Google Scholar] [CrossRef]
- Abad-Segura, E.; Cortés-García, F.J.; Belmonte-Ureña, L.J. The Sustainable Approach to Corporate Social Responsibility: A Global Analysis and Future Trends. Sustainability 2019, 11, 5382. [Google Scholar] [CrossRef] [Green Version]
- Yang, D.; Xiao, T.; Huang, J. Dual-channel structure choice of an environmental responsibility supply chain with green investment. J. Clean. Prod. 2019, 210, 134–145. [Google Scholar] [CrossRef]
- Carroll, A.B. Corporate Social Responsibility: Perspectives on the CSR Construct’s Development and Future. Bus. Soc. 2021, 60, 1258–1278. [Google Scholar] [CrossRef]
- Su, L.; Swanson, S.R. Perceived corporate social responsibility’s impact on the well-being and supportive green behaviors of hotel employees: The mediating role of the employee-corporate relationship. Tour. Manag. 2019, 72, 437–450. [Google Scholar] [CrossRef]
- Jeon, M.M.; Lee, S.; Jeong, M. Perceived corporate social responsibility and customers’ behaviors in the ridesharing service industry. Int. J. Hosp. Manag. 2020, 84, 102341. [Google Scholar] [CrossRef]
- Kim, J.; Park, T. How corporate social responsibility (CSR) saves a company: The role of gratitude in buffering vindictive consumer behavior from product failures. J. Bus. Res. 2020, 117, 461–472. [Google Scholar] [CrossRef]
- Kim, H.; Rhou, Y.; Topcuoglu, E.; Kim, Y.G. Why hotel employees care about Corporate Social Responsibility (CSR): Using need satisfaction theory. Int. J. Hosp. Manag. 2020, 87, 102505. [Google Scholar] [CrossRef]
- Bae, J.; Lund-Thomsen, P.; Lindgreen, A. Global value chains and supplier perceptions of corporate social responsibility: A case study of garment manufacturers in Myanmar. Glob. Netw. 2021, 21, 653–680. [Google Scholar] [CrossRef]
- Hyun, M.Y.; Gao, L.; Lee, S. Corporate social responsibility (CSR), ethical climate and pride in membership moderated by casino dealers’ customer orientation. Int. J. Contemp. Hosp. Manag. 2021, 33, 3256–3276. [Google Scholar] [CrossRef]
- Calabrese, A.; Costa, R.; Levialdi, N.; Menichini, T. Integrating sustainability into strategic decision-making: A fuzzy AHP method for the selection of relevant sustainability issues. Technol. Forecast. Soc. Chang. 2019, 139, 155–168. [Google Scholar] [CrossRef]
- Hansen, S.D.; Dunford, B.B.; Boss, A.D.; Boss, R.W.; Angermeier, I. Corporate Social Responsibility and the Benefits of Employee Trust: A Cross-Disciplinary Perspective. J. Bus. Ethics 2011, 102, 29–45. [Google Scholar] [CrossRef]
- Ji, Y.; Xu, W.; Zhao, Q. The real effects of stock prices: Learning, disclosure and corporate social responsibility. Account. Finance 2019, 59, 2133–2156. [Google Scholar] [CrossRef]
- Fraleigh, J.B.; Katz, V.J. A First Course in Abstract Algebra; Addison-Wesley: Boston, MA, USA, 2003; pp. 125–135. [Google Scholar]
- Xiao, Q.; Heo, C.Y.; Lee, S. How do consumers’ perceptions differ across dimensions of corporate social responsibility and hotel types? J. Travel Tour. Mark. 2017, 34, 694–707. [Google Scholar] [CrossRef]
- Luhmann, H.; Theuvsen, L. Corporate Social Responsibility: Exploring a Framework for the Agribusiness Sector. J. Agric. Environ. Ethics 2017, 30, 241–253. [Google Scholar] [CrossRef]
- Ali, M.; Mustapha, T.I.; Osman, S.B.; Hassan, U. University social responsibility: A review of conceptual evolution and its thematic analysis. J. Clean. Prod. 2021, 286, 124931. [Google Scholar] [CrossRef]
- Severino-González, P.; Antúnez, J.V.V.; González-Soto, N.; Molina, R.I.R. Perspectiva de la responsabilidad social empresarial de la salud pública chilena. Rev. Venez. Gerencia 2020, 25, 1397–1421. [Google Scholar] [CrossRef]
- Acuña-Moraga, O.; Severino-González, P.E.; Garrido-Véliz, V.; Martin-Fiorino, V. Consumo sustentable y responsabilidad social. Una visión convergente que contribuye al desarrollo sustentable. Interciencia 2020, 45, 384–389. [Google Scholar]
- Rim, H.; Kim, J.; Dong, C. A cross-national comparison of transparency signaling in corporate social responsibility reporting: The United States, South Korea, and China cases. Corp. Soc. Responsib. Environ. Manag. 2019, 26, 1517–1529. [Google Scholar] [CrossRef]
- García-Sánchez, I. Drivers of the CSR report assurance quality: Credibility and consistency for stakeholder engagement. Corp. Soc. Responsib. Environ. Manag. 2020, 27, 2530–2547. [Google Scholar] [CrossRef]
- Arrive, J.T.; Feng, M. Corporate social responsibility disclosure: Evidence from BRICS nations. Corp. Soc. Responsib. Environ. Manag. 2018, 25, 920–927. [Google Scholar] [CrossRef]
- Camilleri, M.A. Strategic attributions of corporate social responsibility and environmental management: The business case for doing well by doing good! Sustain. Dev. 2021. [Google Scholar] [CrossRef]
- Freudenreich, B.; Lüdeke-Freund, F.; Schaltegger, S. A stakeholder theory perspective on business models: Value creation for sustainability. J. Bus. Ethics 2020, 166, 3–18. [Google Scholar] [CrossRef]
- Bundy, J.; Vogel, R.M.; Zachary, M.A. Organization–stakeholder fit: A dynamic theory of cooperation, compromise, and conflict between an organization and its stakeholders. Strateg. Manag. J. 2018, 39, 476–501. [Google Scholar] [CrossRef]
- Zhong, X.; Ren, G.; Wu, X. Not all stakeholders are created equal: Executive vertical pay disparity and firms’ choice of internal and external CSR. Rev. Manag. Sci. 2021, 1–31. [Google Scholar] [CrossRef]
- Muruviwa, A.T.; Akpan, W.; Nekhwevha, F.H. Debating stakeholder reciprocity: Understanding the stakeholders’ duties in corporate social responsibility in a Zimbabwean mining town. Environ. Dev. Sustain. 2020, 22, 1787–1809. [Google Scholar] [CrossRef]
- Carroll, A.B. The pyramid of corporate social responsibility: Toward the moral management of organizational stakeholders. Bus. Horiz. 1991, 34, 39–48. [Google Scholar] [CrossRef]
- Fordham, A.E.; Robinson, G.M. Identifying the social values driving corporate social responsibility. Sustain. Sci. 2019, 14, 1409–1424. [Google Scholar] [CrossRef]
- Acuña-Moraga, O.; Severino-González, P. Sustentabilidad y comportamiento del consumidor socialmente responsable. Opción Rev. Cienc. Hum. Soc. 2018, 34, 299–324. [Google Scholar]
- Archimi, C.S.; Reynaud, E.; Yasin, H.M.; Bhatti, Z.A. How Perceived Corporate Social Responsibility Affects Employee Cynicism: The Mediating Role of Organizational Trust. J. Bus. Ethics 2018, 151, 907–921. [Google Scholar] [CrossRef] [Green Version]
- Lee, L.; Chen, L.-F. Boosting employee retention through CSR: A configurational analysis. Corp. Soc. Responsib. Environ. Manag. 2018, 25, 948–960. [Google Scholar] [CrossRef]
- Kim, M.; Kim, J. Corporate social responsibility, employee engagement, well-being and the task performance of frontline employees. Manag. Decis. 2020, 59, 2040–2056. [Google Scholar] [CrossRef]
- Ng, T.W.H.; Yam, K.C.; Aguinis, H. Employee perceptions of corporate social responsibility: Effects on pride, embeddedness, and turnover. Pers. Psychol. 2018, 72, 107–137. [Google Scholar] [CrossRef] [Green Version]
- Stecher, A.; Godoy, L.; Aravena, A. Sindicalismo y vida cotidiana en el Retail: Experiencias de dirigentes de base en Chile. Psicoperspectiva 2020, 19, 1–11. [Google Scholar] [CrossRef]
- Labra, F. Recursos de poder en el sindicato de trabajadores de Starbucks de Chile. Nueva Soc. 2017, 272, 188–197. [Google Scholar]
- Romero-Argueta, J.; Coreas-Flores, E.; Severino-González, P. Responsabilidad social del estudiante universitario en El Salvador: Género y territorio. Rev. Cienc. Soc. 2020, 26, 426–441. [Google Scholar] [CrossRef]
- Mendizábal, G.; Tufiño, B. Desafíos de la responsabilidad social corporativa (RSC) frente a los derechos humanos de los tra-bajadores: El ejemplo mexicano. Alegatos 2018, 29, 591–610. [Google Scholar]
- Fox-Hodess, K. Worker Power, Trade Union Strategy, and International Connections: Dockworker Unionism in Colombia and Chile. Lat. Am. Politi-Soc. 2019, 61, 29–54. [Google Scholar] [CrossRef]
- Bosch-Badia, M.-T.; Montllor-Serrats, J.; Tarrazon-Rodon, M.-A. The Capital Budgeting of Corporate Social Responsibility. Sustainability 2020, 12, 3542. [Google Scholar] [CrossRef]
- Maignan, I. Consumers’ Perceptions of Corporate Social Responsibilities: A Cross-Cultural Comparison. J. Bus. Ethics 2001, 30, 57–72. [Google Scholar] [CrossRef]
- Wendlandt, T.R.; Álvarez, M.T.; Nuñez, M.A.; Valdez, D.I. Validation of an instrument to measure corporate social responsibility in consumers of Mexico. AD-Minister 2016, 29, 79–100. [Google Scholar]
- Carroll, A.B. Social Issues in Management: Comments on the Past and Future. Bus. Soc. 2019, 58, 1406–1412. [Google Scholar] [CrossRef]
- Severino-González, P.; Villalobos-Antúnez, J.V.; Chamali-Duarte, N.; Vergara-Piña, G.; González-Soto, N. Social responsibility of university student and institutional educational policies. Recognizing the commitments to society. Opción 2019, 35, 1171–1197. [Google Scholar]
- Đorđević, D.B.; Vuković, M.; Urošević, S.; Štrbac, N.; Vuković, A. Studying the corporate social responsibility in apparel and textile industry. Ind. Text. 2019, 70, 336–341. [Google Scholar] [CrossRef]
- Furman, A.; Maison, D.; Sekścińska, K. Segmentation Based on Attitudes Toward Corporate Social Responsibility in Relation to Demographical Variables and Personal Values—Quantitative and Qualitative Study of Polish Consumers. Front. Psychol. 2020, 11, 450. [Google Scholar] [CrossRef] [Green Version]
- Lu, F.; Wang, Z.; Toppinen, A.; D’Amato, D.; Wen, Z. Managerial Risk Perceptions of Corporate Social Responsibility Disclosure: Evidence from the Forestry Sector in China. Sustainability 2021, 13, 6811. [Google Scholar] [CrossRef]
- Sannino, G.; Di Carlo, F.; Lucchese, M. CEO characteristics and sustainability business model in financial technologies firms: Primary evidence from the utilization of innovative platforms. Manag. Decis. 2020, 58, 1779–1799. [Google Scholar] [CrossRef]
- Katmon, N.; Mohamad, Z.Z.; Norwani, N.M.; Al Farooque, O. Comprehensive Board Diversity and Quality of Corporate Social Responsibility Disclosure: Evidence from an Emerging Market. J. Bus. Ethics 2019, 157, 447–481. [Google Scholar] [CrossRef]
- Chanda, U.; Goyal, P. A Bayesian Network Model on the Interlinkage between Socially Responsible HRM, Employee Satisfaction, Employee Commitment and Organizational Performance. J. Manag. Anal. 2020, 7, 105–138. [Google Scholar] [CrossRef]
- Zhang, Q.; Oo, B.L.; Lim, B.T.H. Linking corporate social responsibility (CSR) practices and organizational performance in the construction industry: A resource collaboration network. Resour. Conserv. Recycl. 2022, 179, 106113. [Google Scholar] [CrossRef]
- Molodetskaya, K.; Brodskiy, Y.; Fedushko, S. Model of assessment of information-psychological influence in social networking services based on information insurance. In Proceedings of the CEUR Workshop, Online, 14–15 December 2020; p. 2616. [Google Scholar]
- Habibi, M.N. Sunjana Analysis of Indonesia Politics Polarization before 2019 President Election Using Sentiment Analysis and Social Network Analysis. Int. J. Mod. Educ. Comput. Sci. 2019, 11, 22–30. [Google Scholar] [CrossRef]
- Hernández, R.; Fernández, C.; Baptista, P. Metodología de la Investigación; McGraw Hill: Mexico City, Mexico, 2006; pp. 129–130. [Google Scholar]
- Statistical Yearbook of the Chilean Labor Office. Available online: https://www.dt.gob.cl/portal/1629/w3-propertyvalue-76577.html (accessed on 1 December 2021).
- Quero, M. Confiabilidad y coeficiente Alpha de Cronbach. Telos 2010, 12, 248–252. [Google Scholar]
- Burt, R.S.; Kilduff, M.; Tasselli, S. Social Network Analysis: Foundations and Frontiers on Advantage. Annu. Rev. Psychol. 2013, 64, 527–547. [Google Scholar] [CrossRef]
- Dehmer, M.; Emmert-Streib, F. Quantitative Graph Theory: Mathematical Foundations and Applications; CRC Press: New York, NY, USA, 2014; pp. 111–140. [Google Scholar]
- Wills, P.; Meyer, F.G. Metrics for graph comparison: A practitioner’s guide. PLoS ONE 2020, 15, e0228728. [Google Scholar] [CrossRef] [Green Version]
- Shirali, S.; Vasudeva, H.L. Metric Spaces; Springer Science & Business Media: London, UK, 2005; pp. 2–16. [Google Scholar]
- Steele, J.M. Probability Theory and Combinatorial Optimization; Society for Industrial and Applied Mathematics (SIAM): Philadelphia, PA, USA, 1997; pp. 29–30. [Google Scholar]
- Pérez, A.; Del Bosque, I.R. Personal traits and customer responses to CSR perceptions in the banking sector. Int. J. Bank Mark. 2017, 35, 128–146. [Google Scholar] [CrossRef] [Green Version]
- Currás, R.; Dolz, C.; Miquel, M.J. Expectativas y Percepciones del Consumidor Español Respecto a la Responsabilidad Social: Diferencias Sociodemográficas. In Proceedings of the XXVI Encuentro de Profesores Universitarios de Marketing, AEMARK, Elche, Spain, 17–19 September 2014. [Google Scholar]
- Meyers-Levy, J. Gender differences in information processing: A selectivity interpretation in cognitive and affective responses to advertising. In Cognitive and Affective Responses to Advertising; Cafferata, P., Tybout, A., Eds.; Lexington Books: Lexington, MA, USA, 1989; pp. 219–260. [Google Scholar]
- Newman, M.E.J. Power laws, Pareto distributions and Zipf’s law. Contemp. Phys. 2005, 46, 323–351. [Google Scholar] [CrossRef] [Green Version]
- Elekes, Á.; Englhardt, A.; Schäler, M.; Böhm, K. Toward meaningful notions of similarity in NLP embedding models. Int. J. Digit. Libr. 2020, 21, 109–128. [Google Scholar] [CrossRef]

Publisher’s Note: MDPI stays neutral with regard to jurisdictional claims in published maps and institutional affiliations. |
© 2022 by the authors. Licensee MDPI, Basel, Switzerland. This article is an open access article distributed under the terms and conditions of the Creative Commons Attribution (CC BY) license (https://creativecommons.org/licenses/by/4.0/).