
Evaluation of a Polyester Filter and UV Light (PFUV) Dehumidifier to Improve Indoor Environmental Quality: Preliminary Results


Abstract
:1. Introduction
2. Materials and Methods
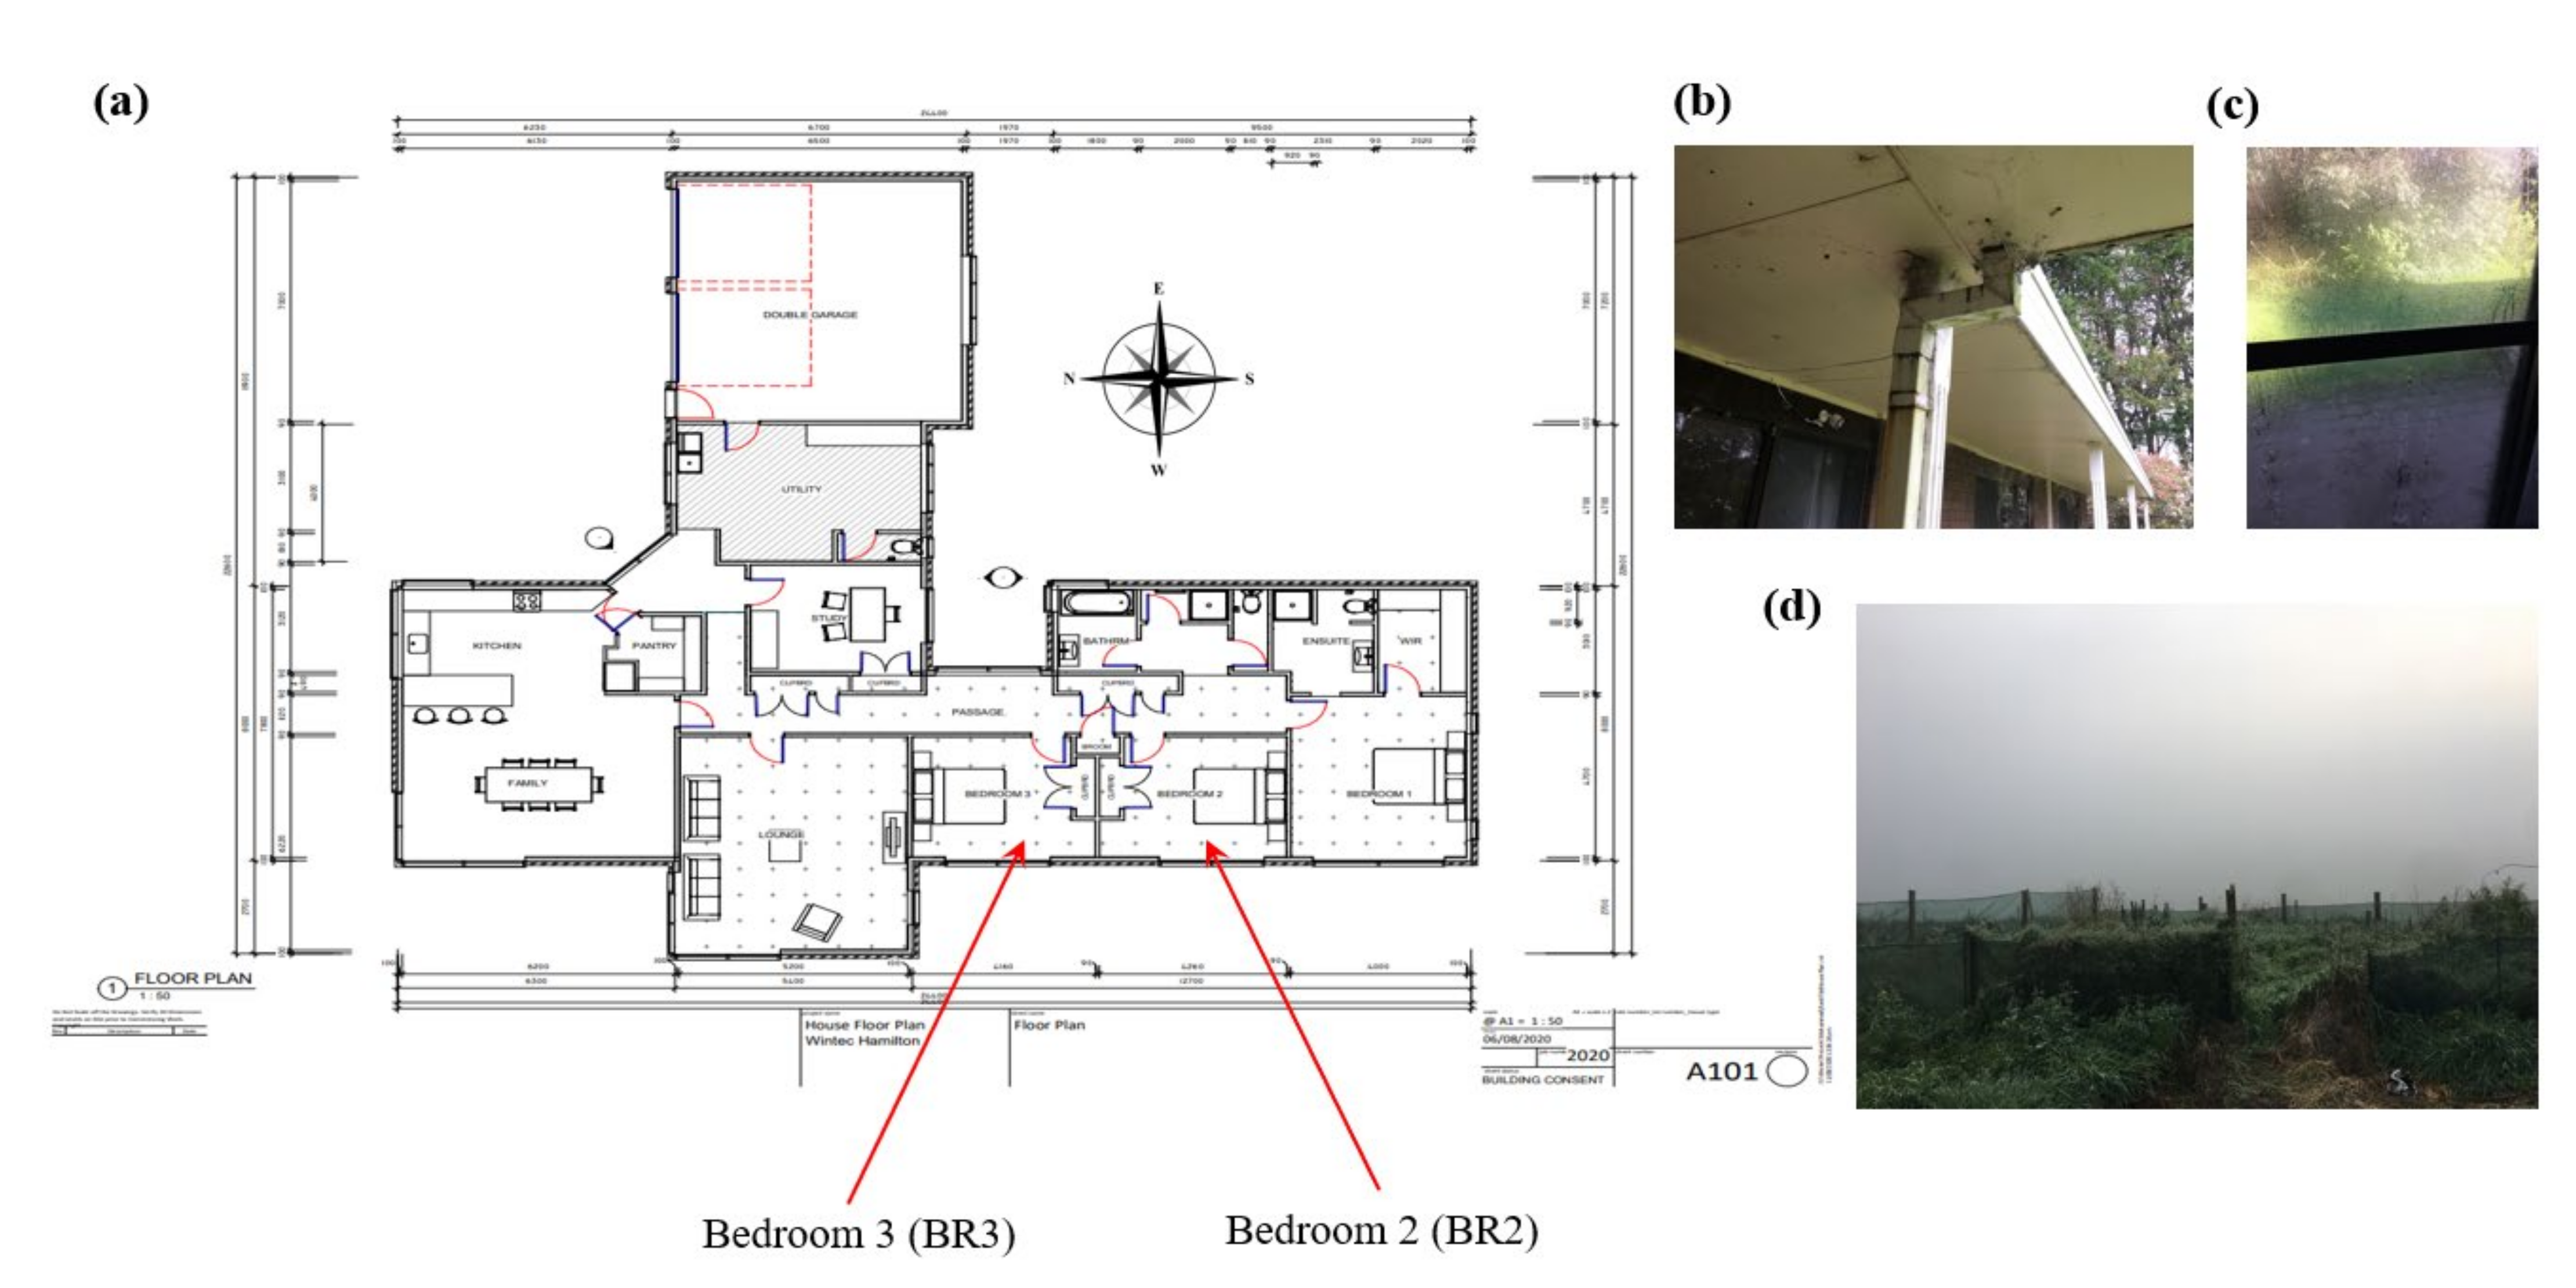
2.1. Test Location
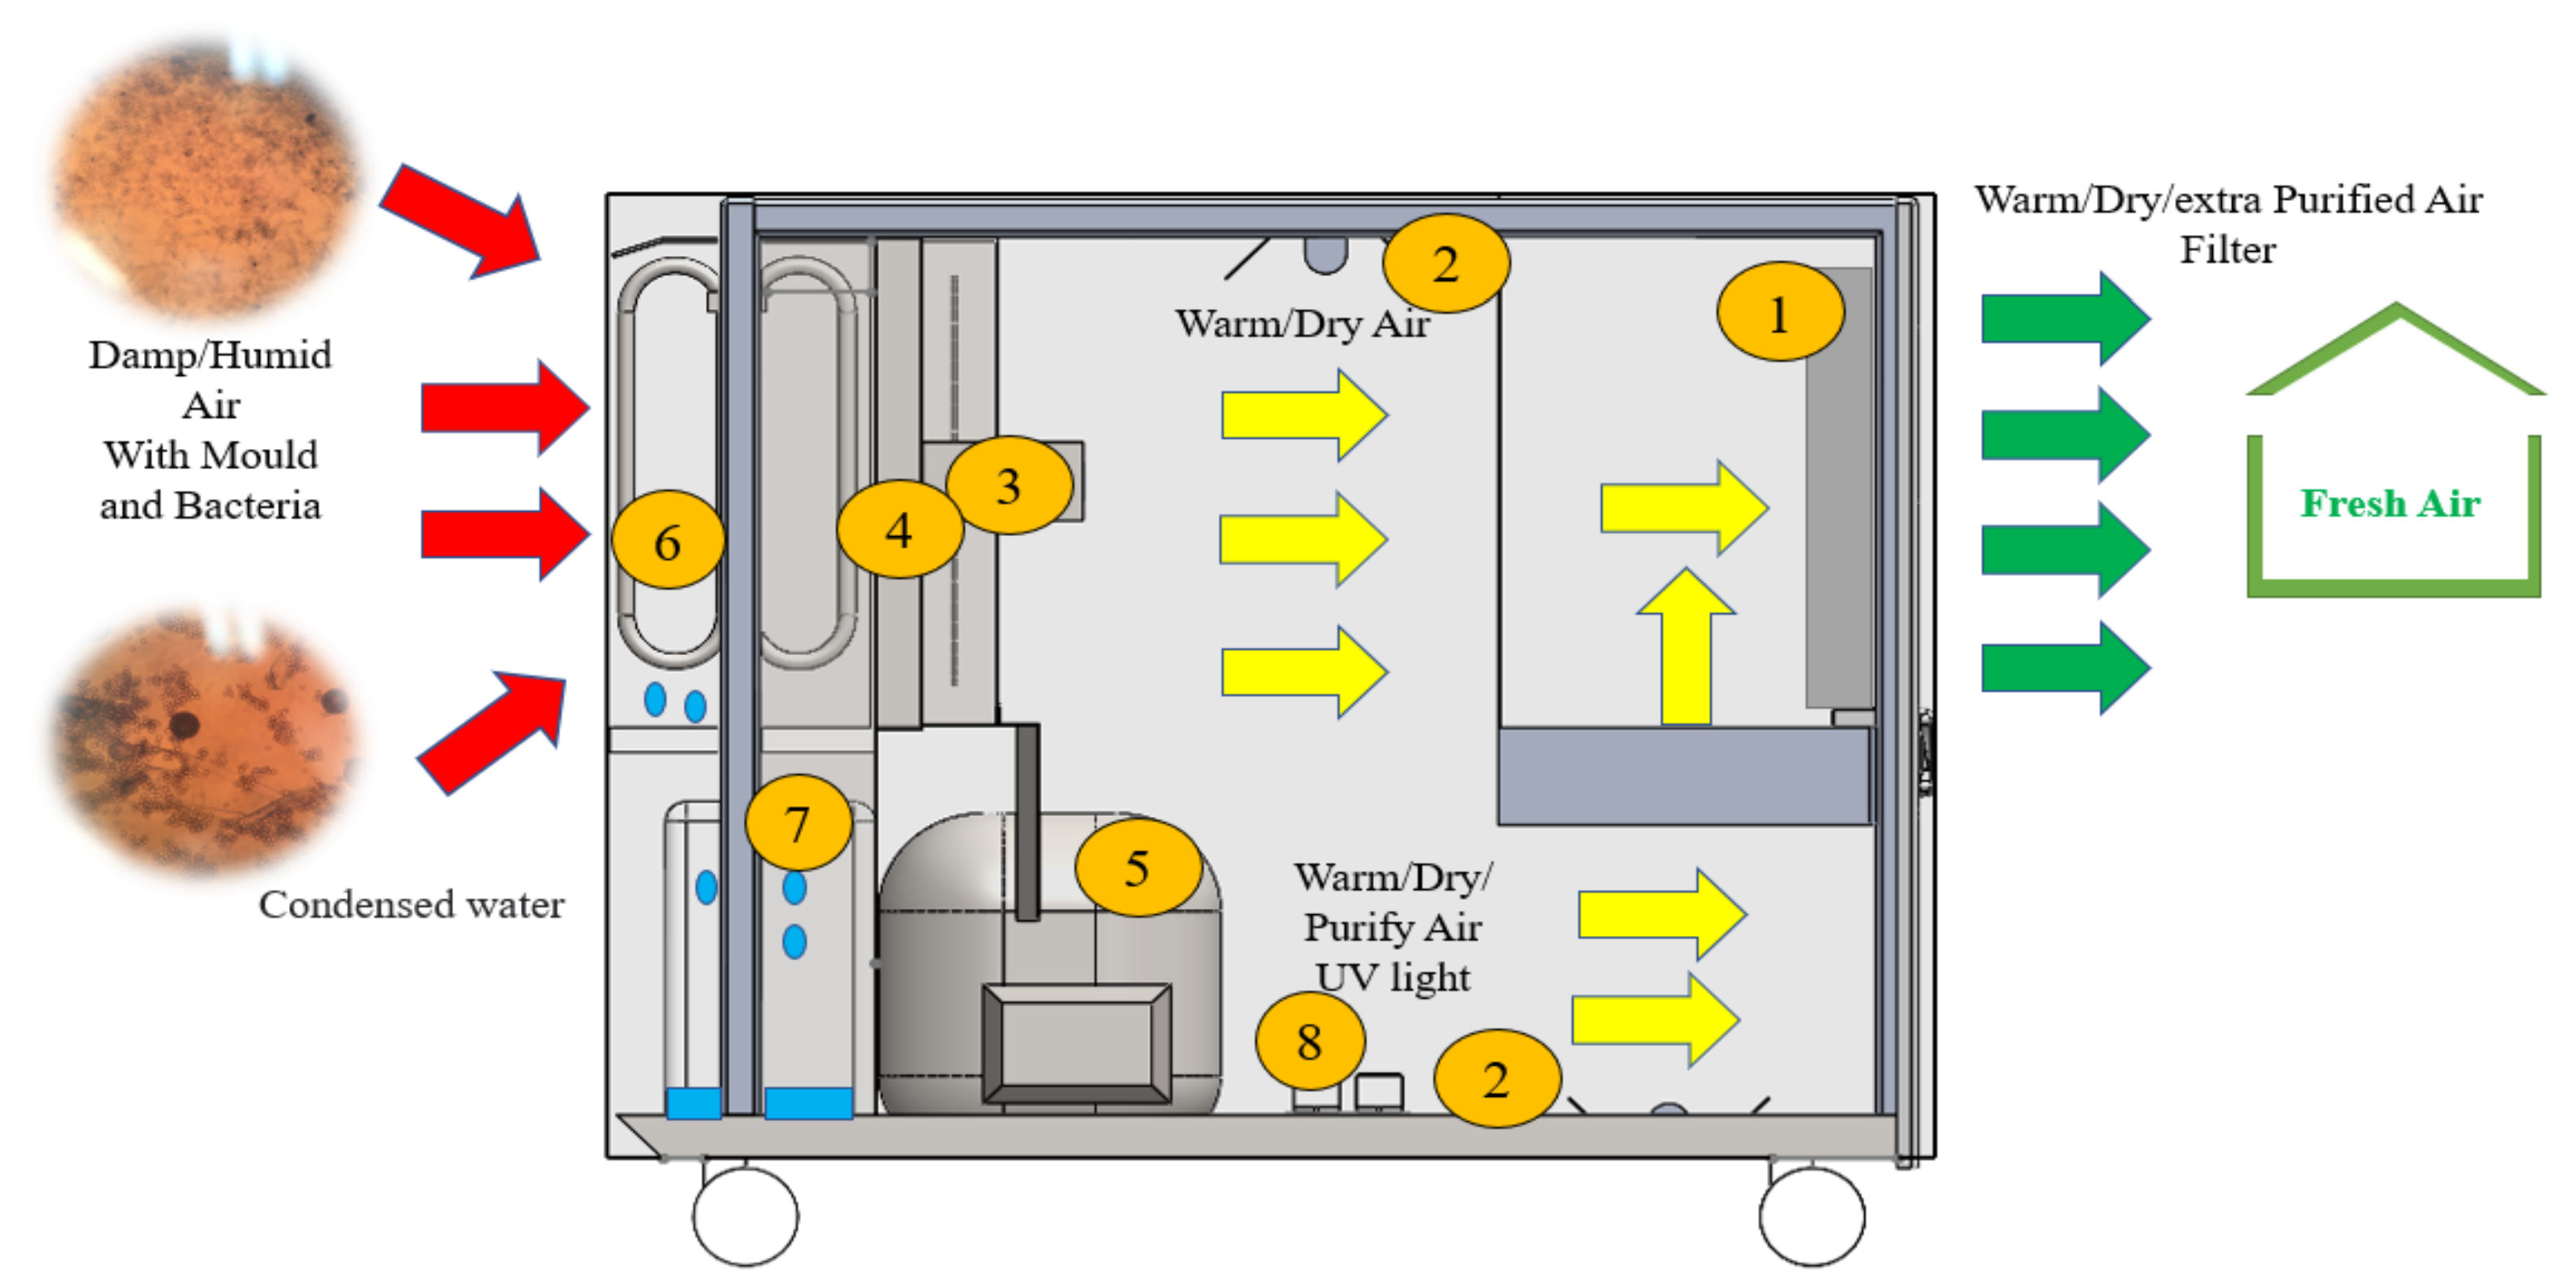
2.2. Experimental Setup
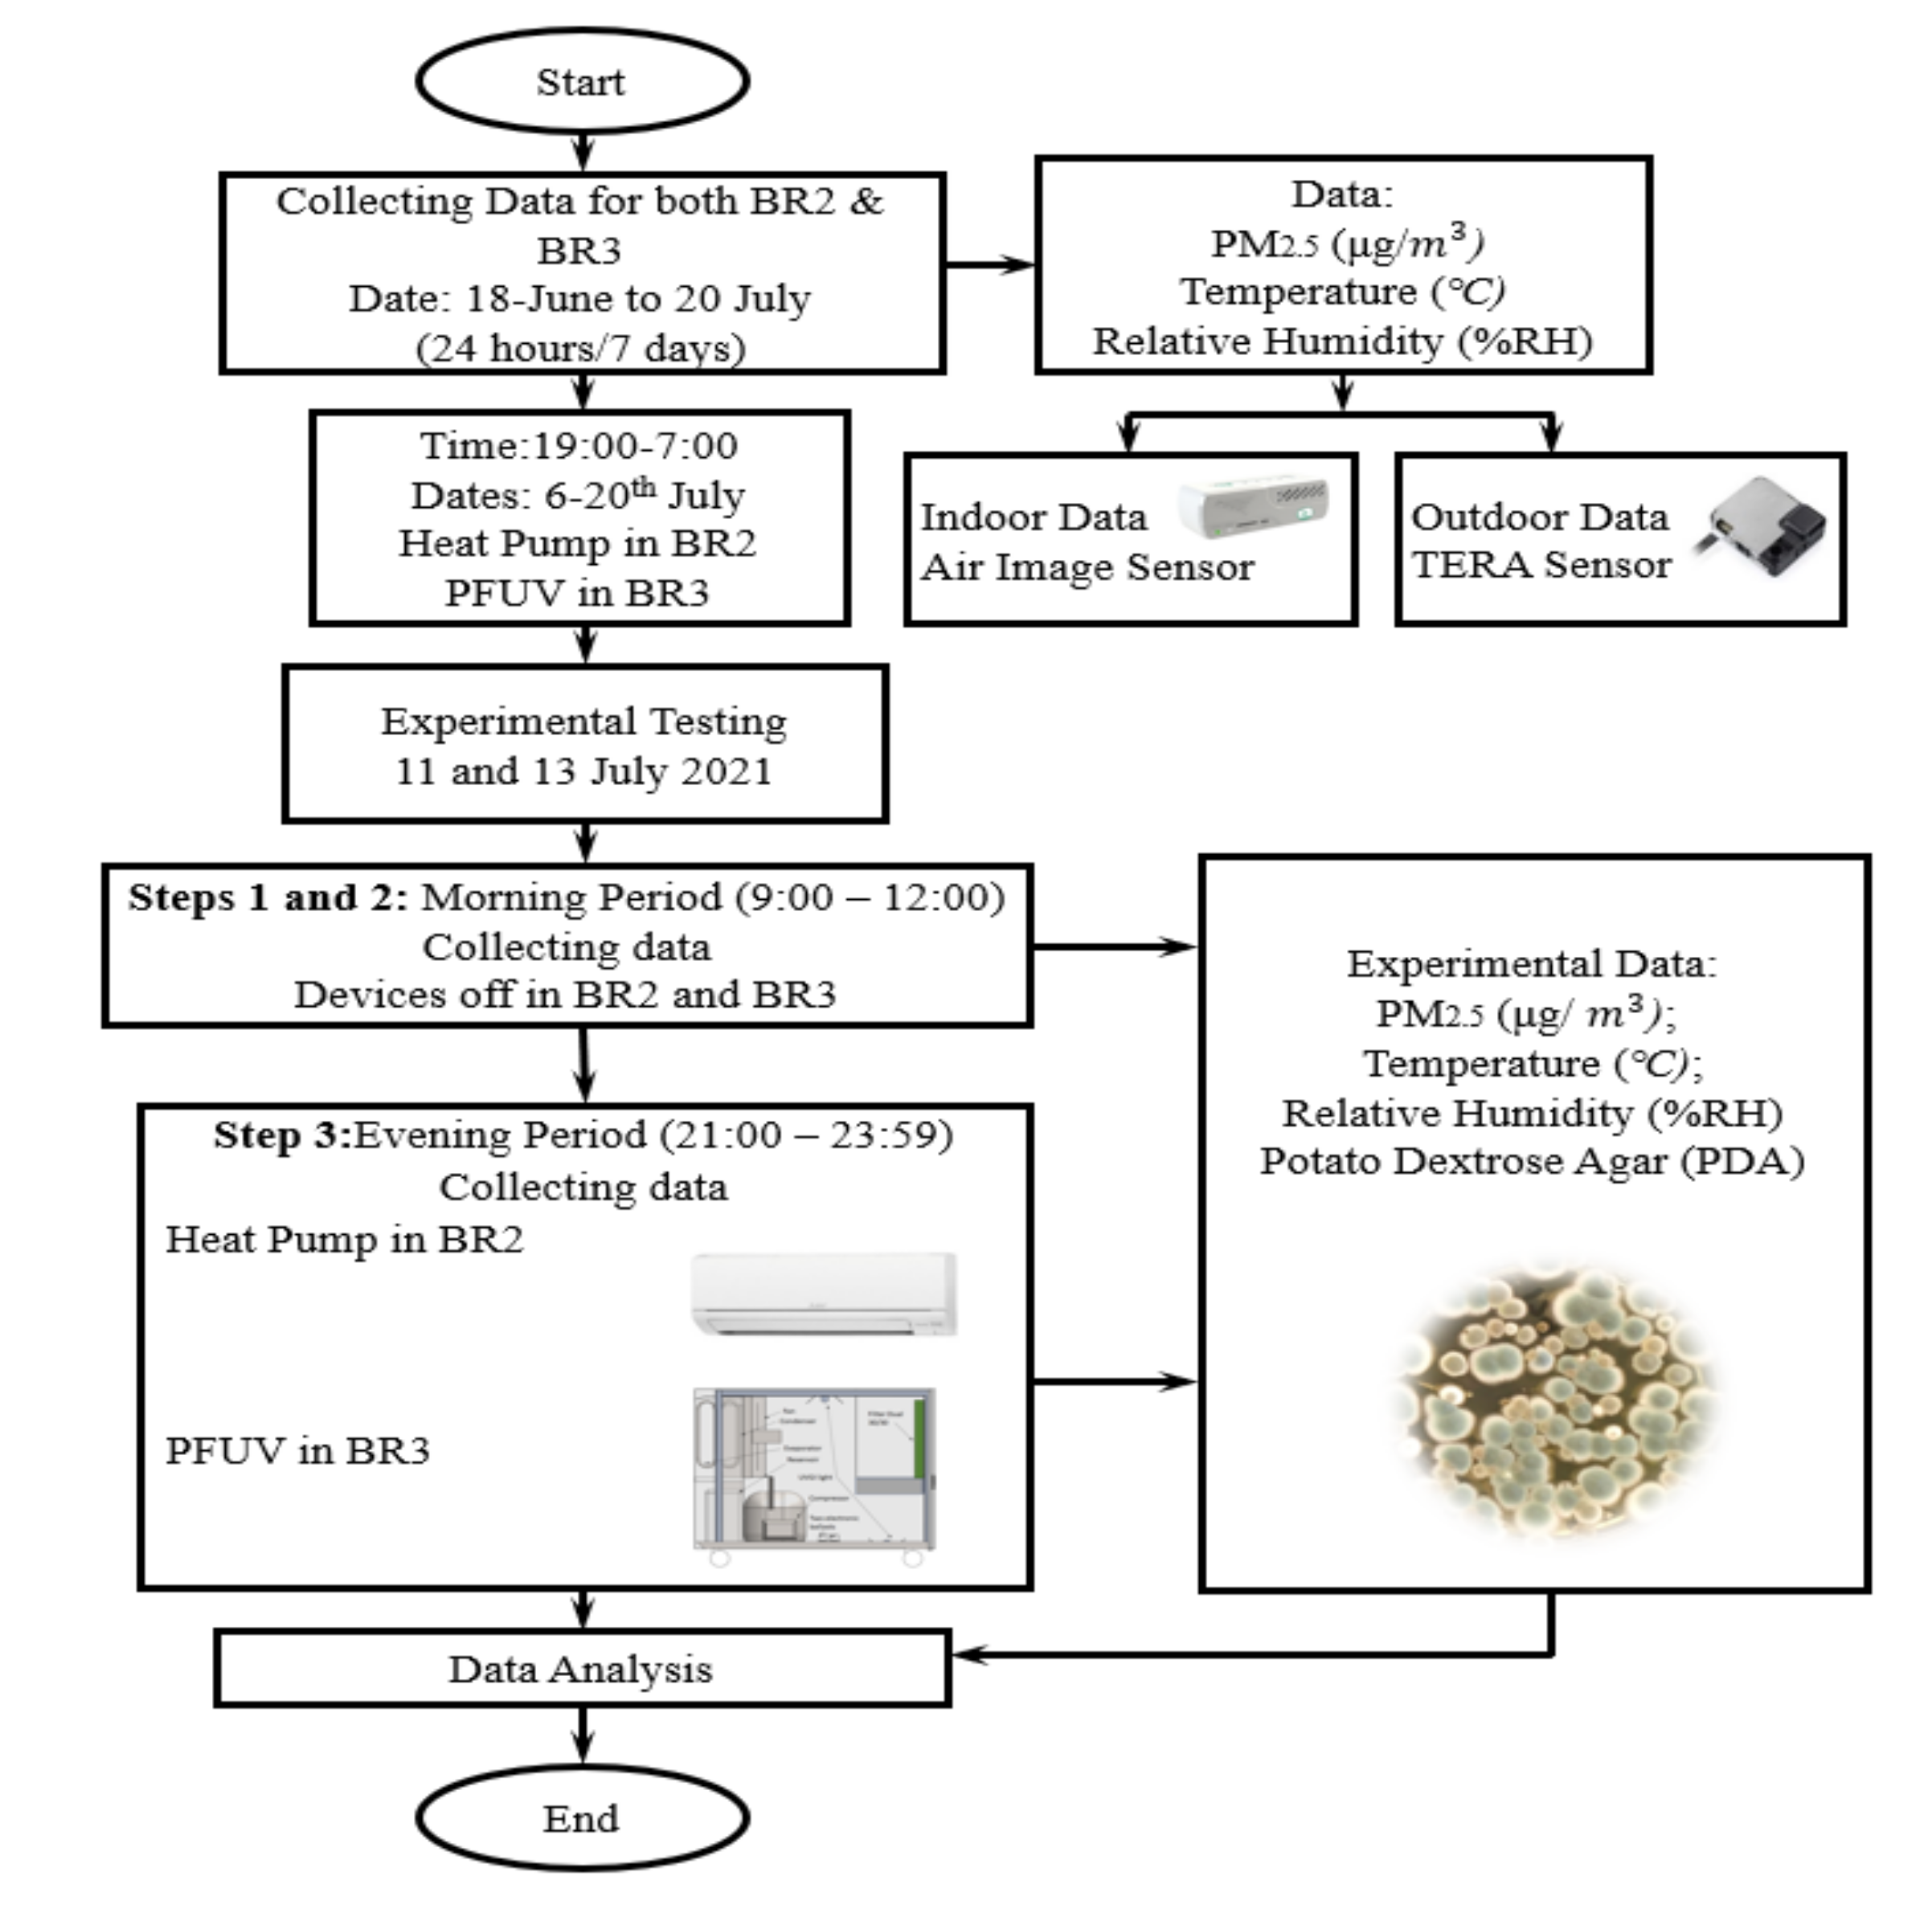
2.3. Test Method
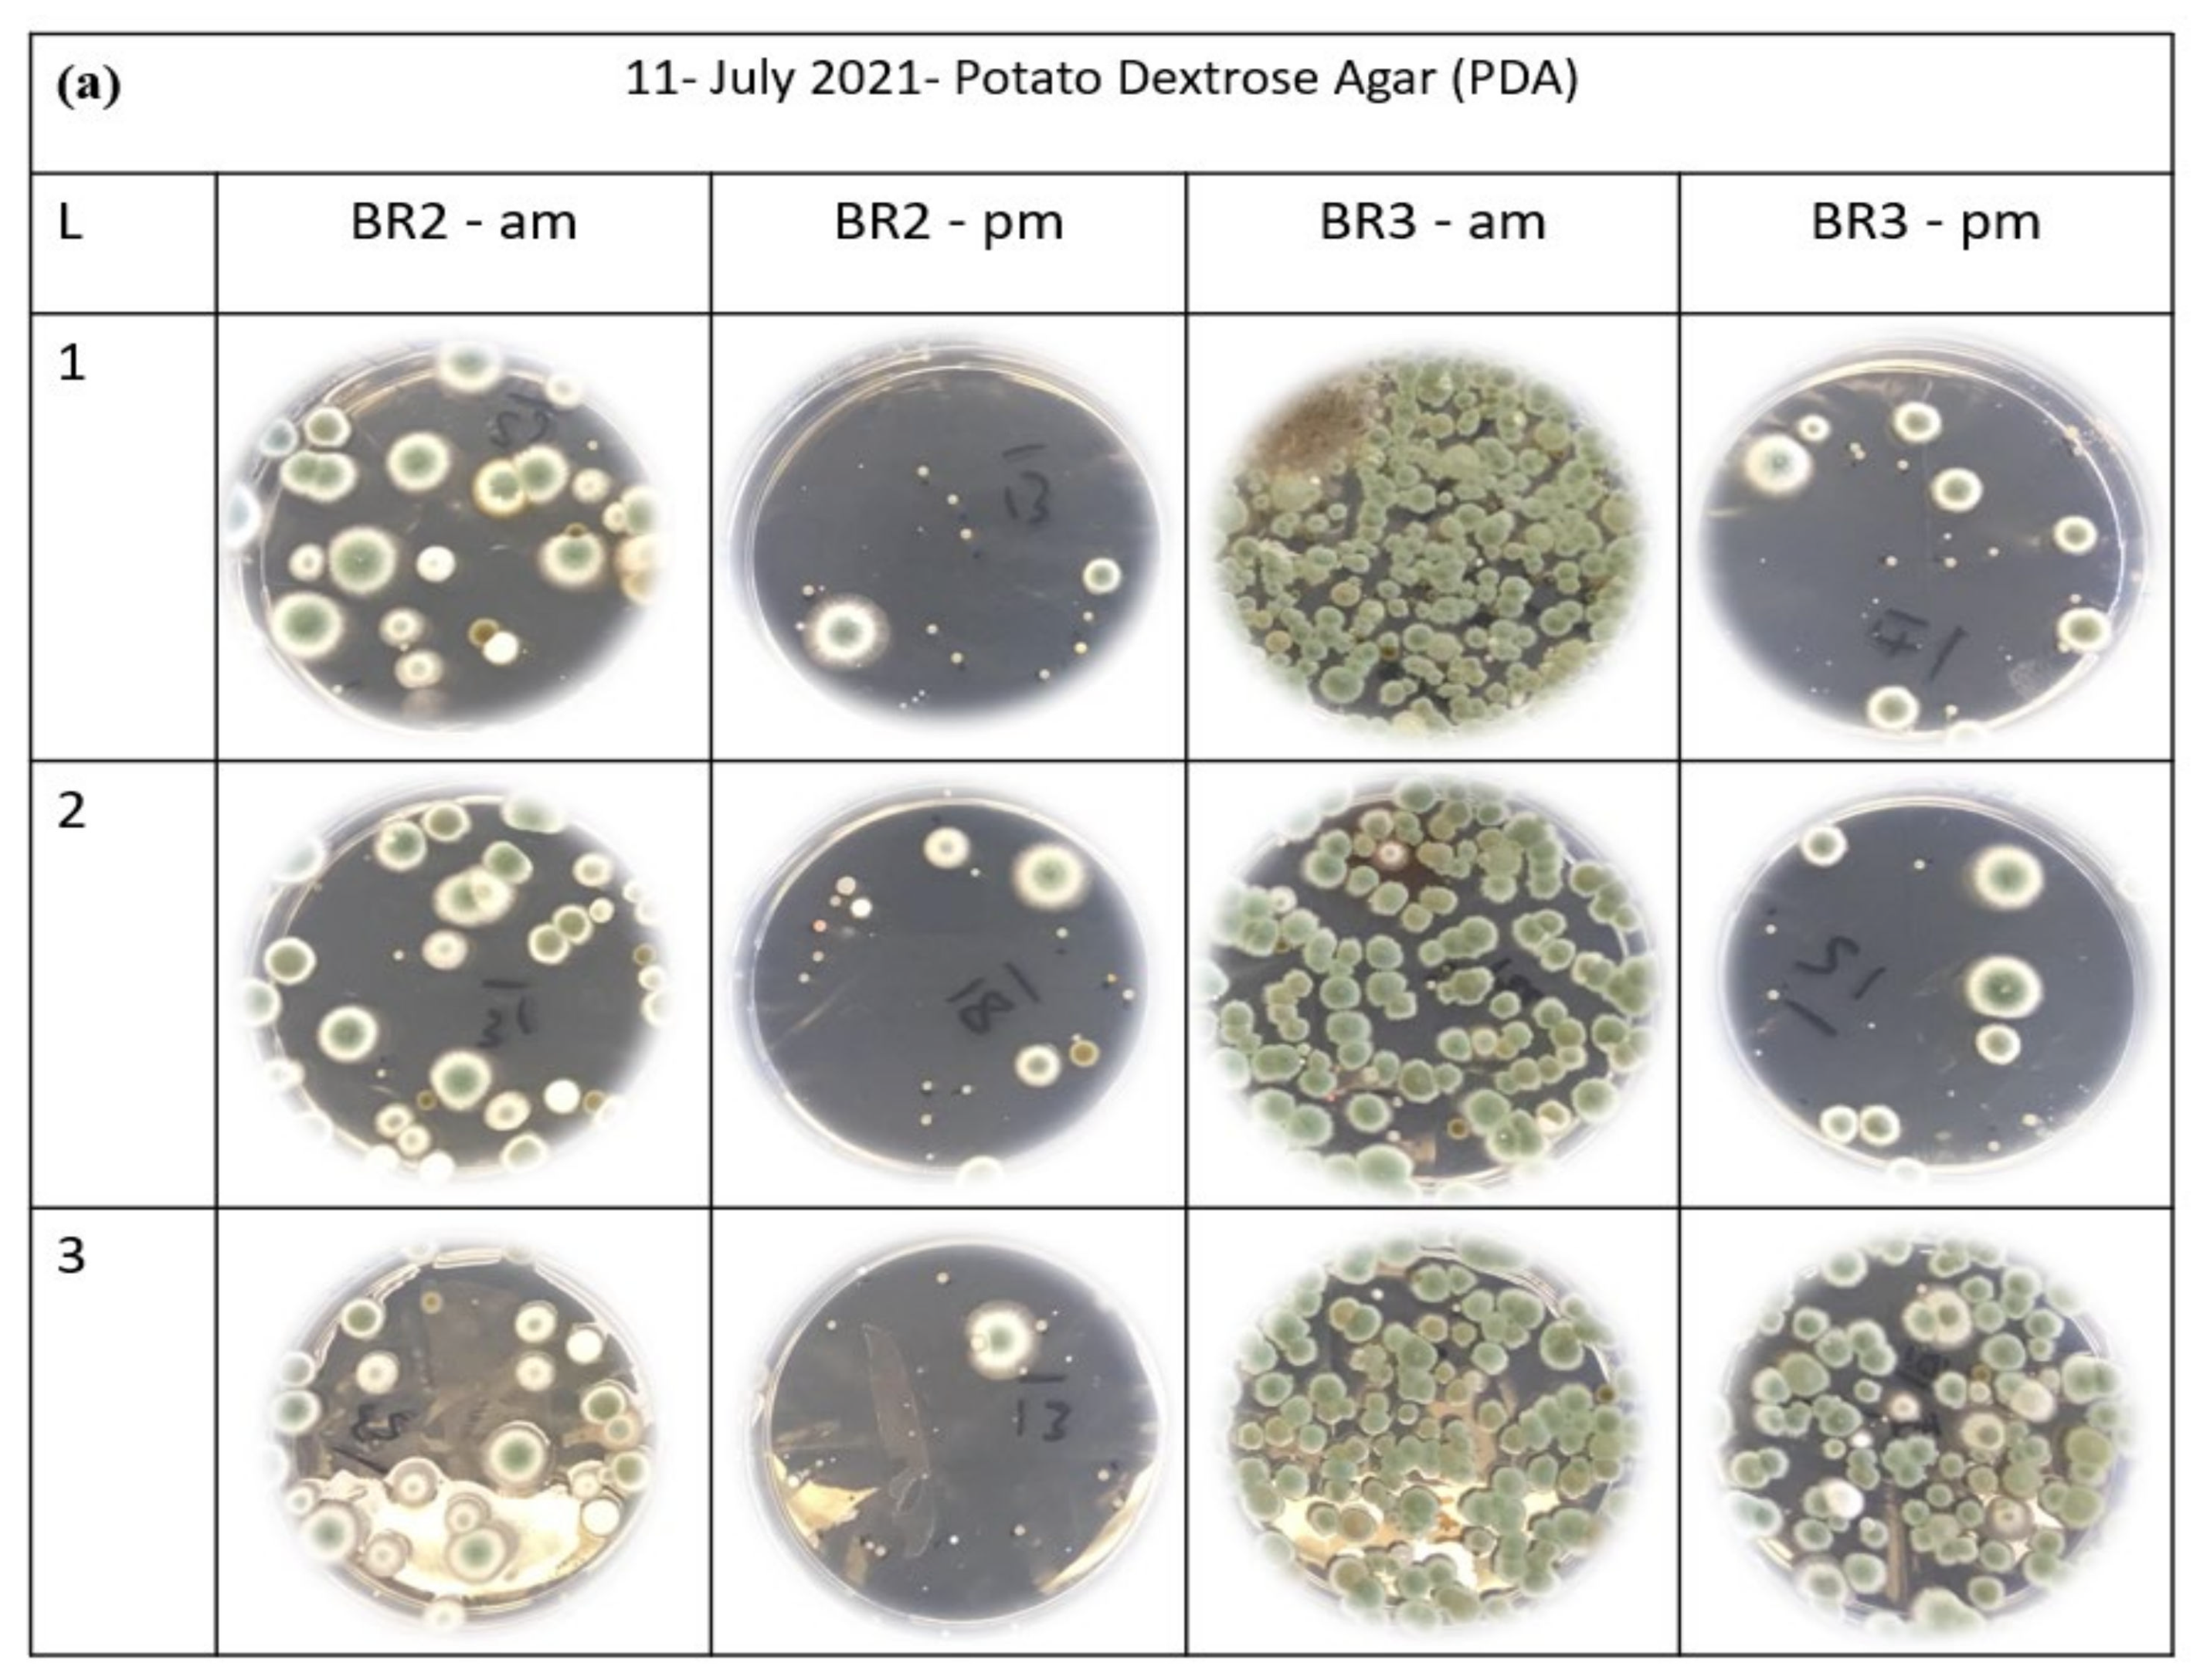
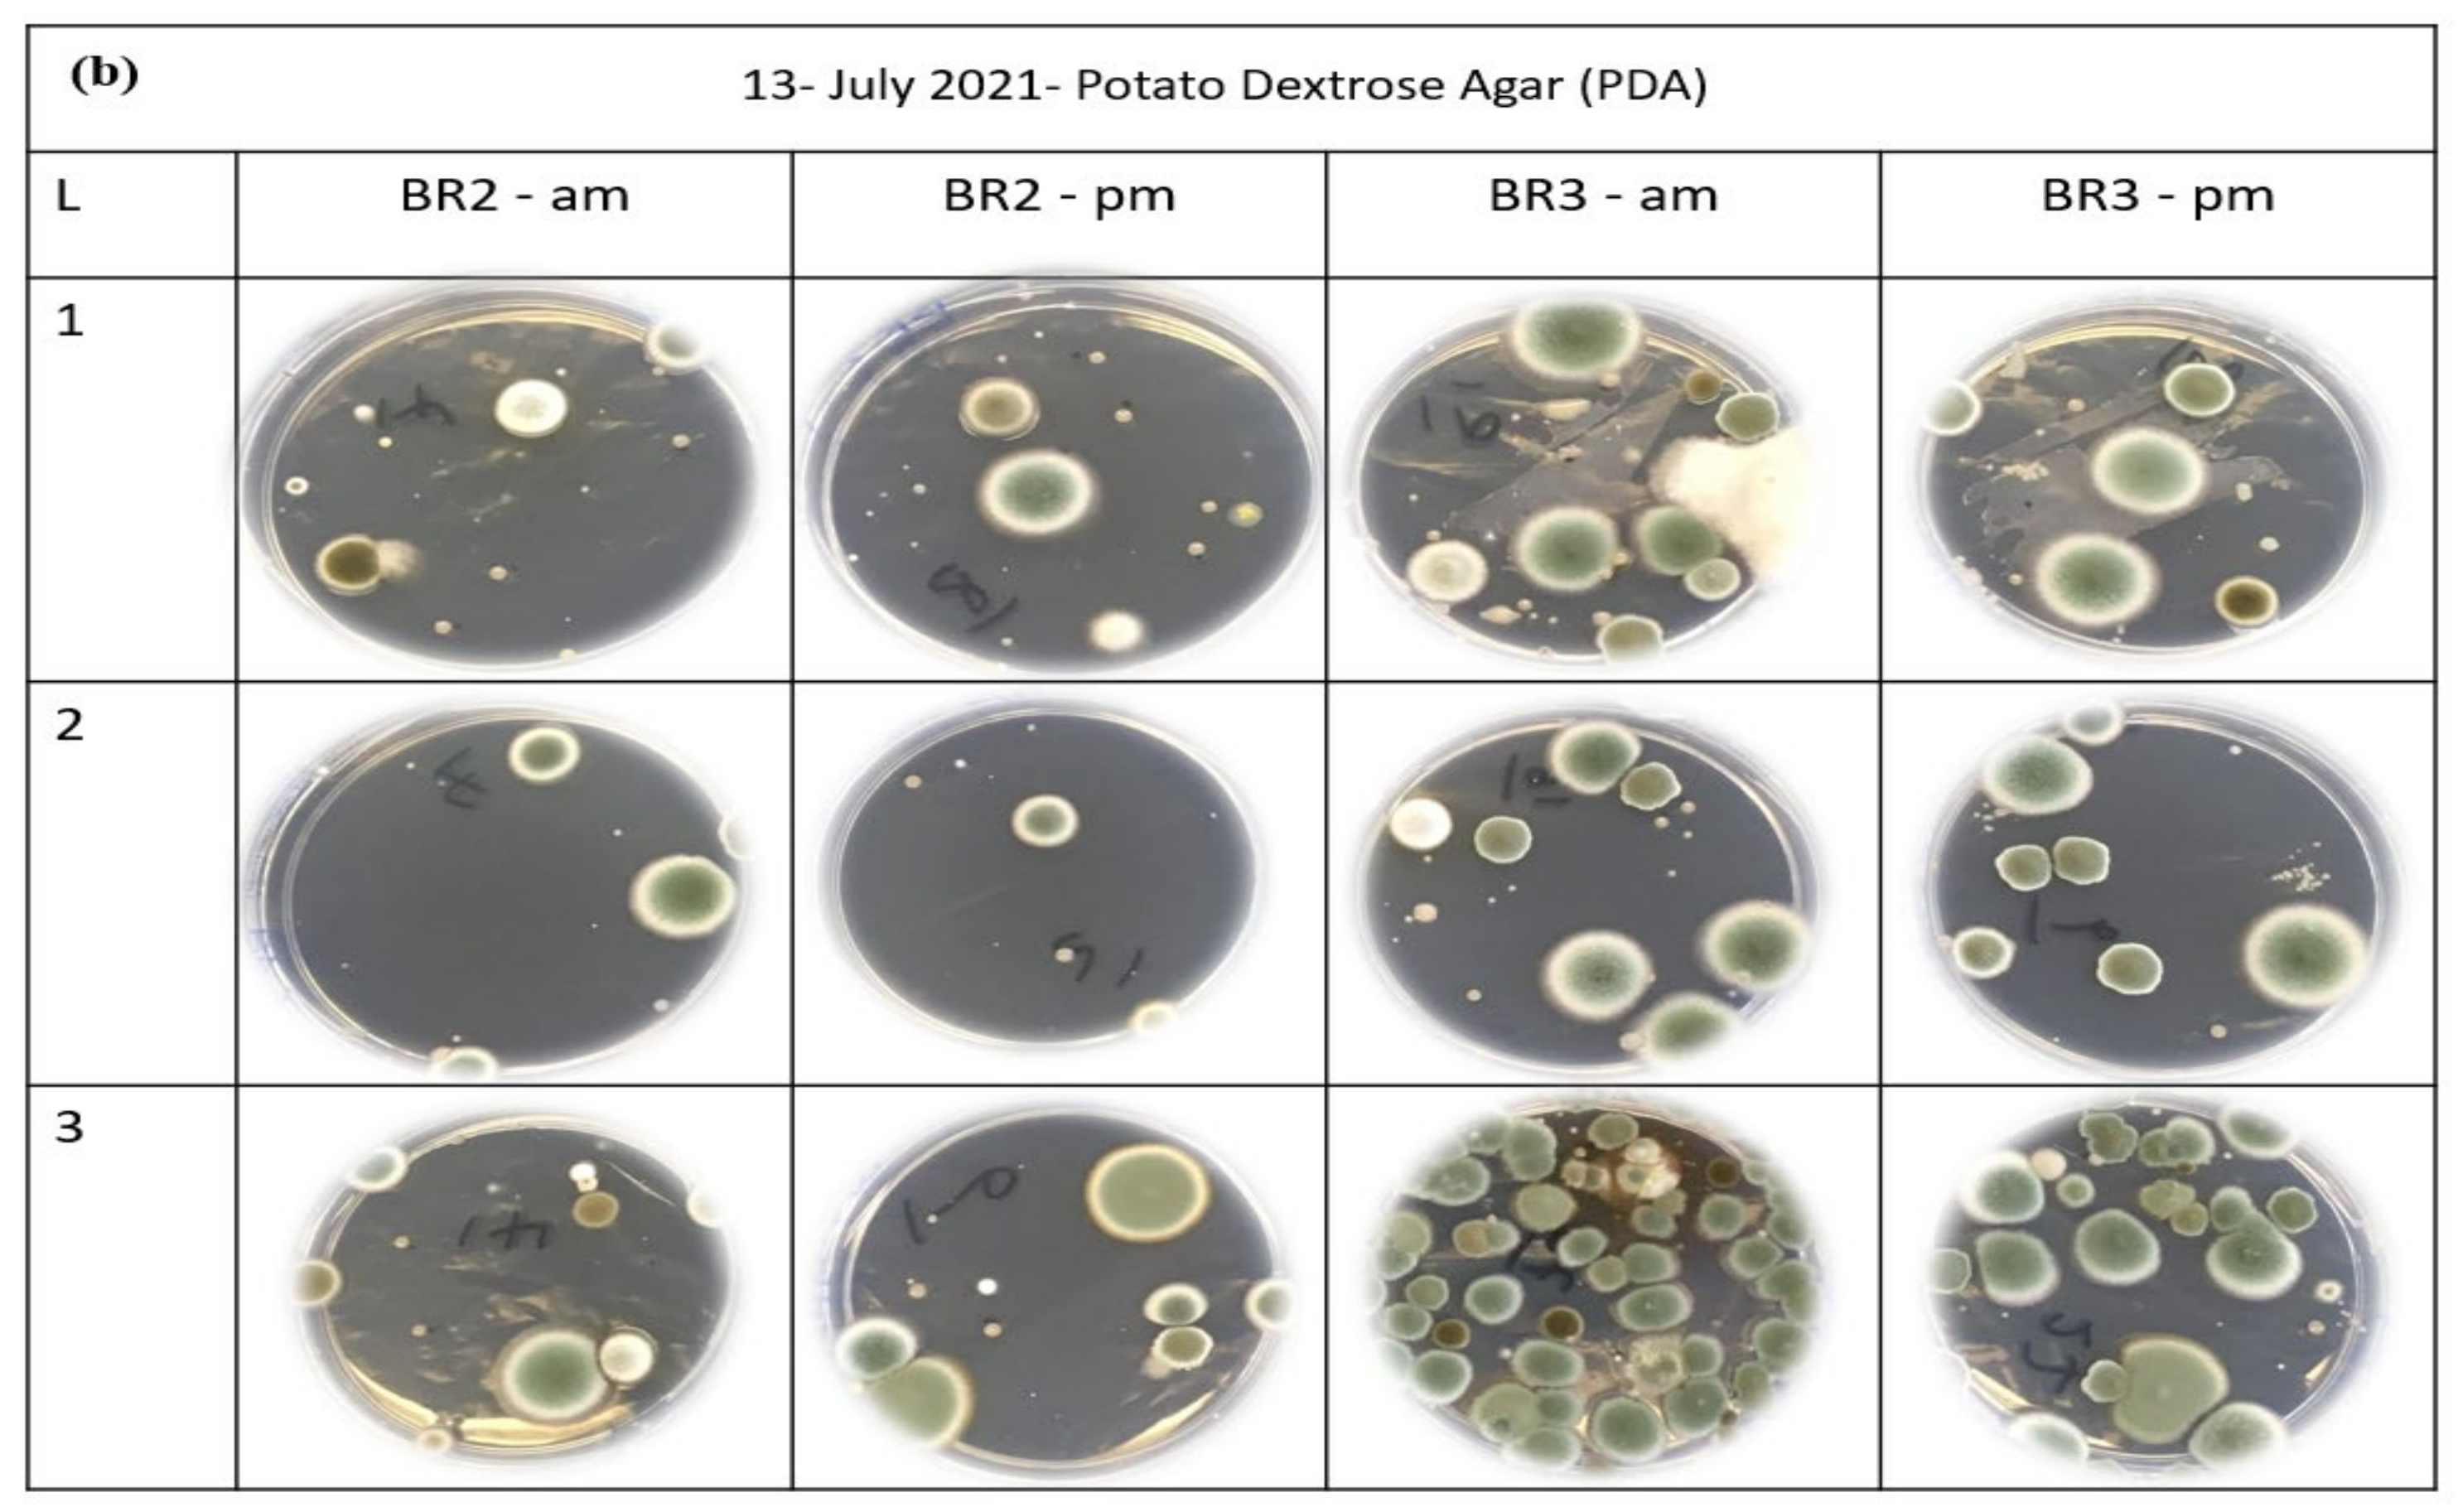
- One set (comprising 1 PDA plate) of agar plates was positioned at each of the three locations in each of BR2 and BR3, as indicated in Figure 2. The lids were removed, and the surface of the plates was exposed to the air for three hours (9.00–12.00).
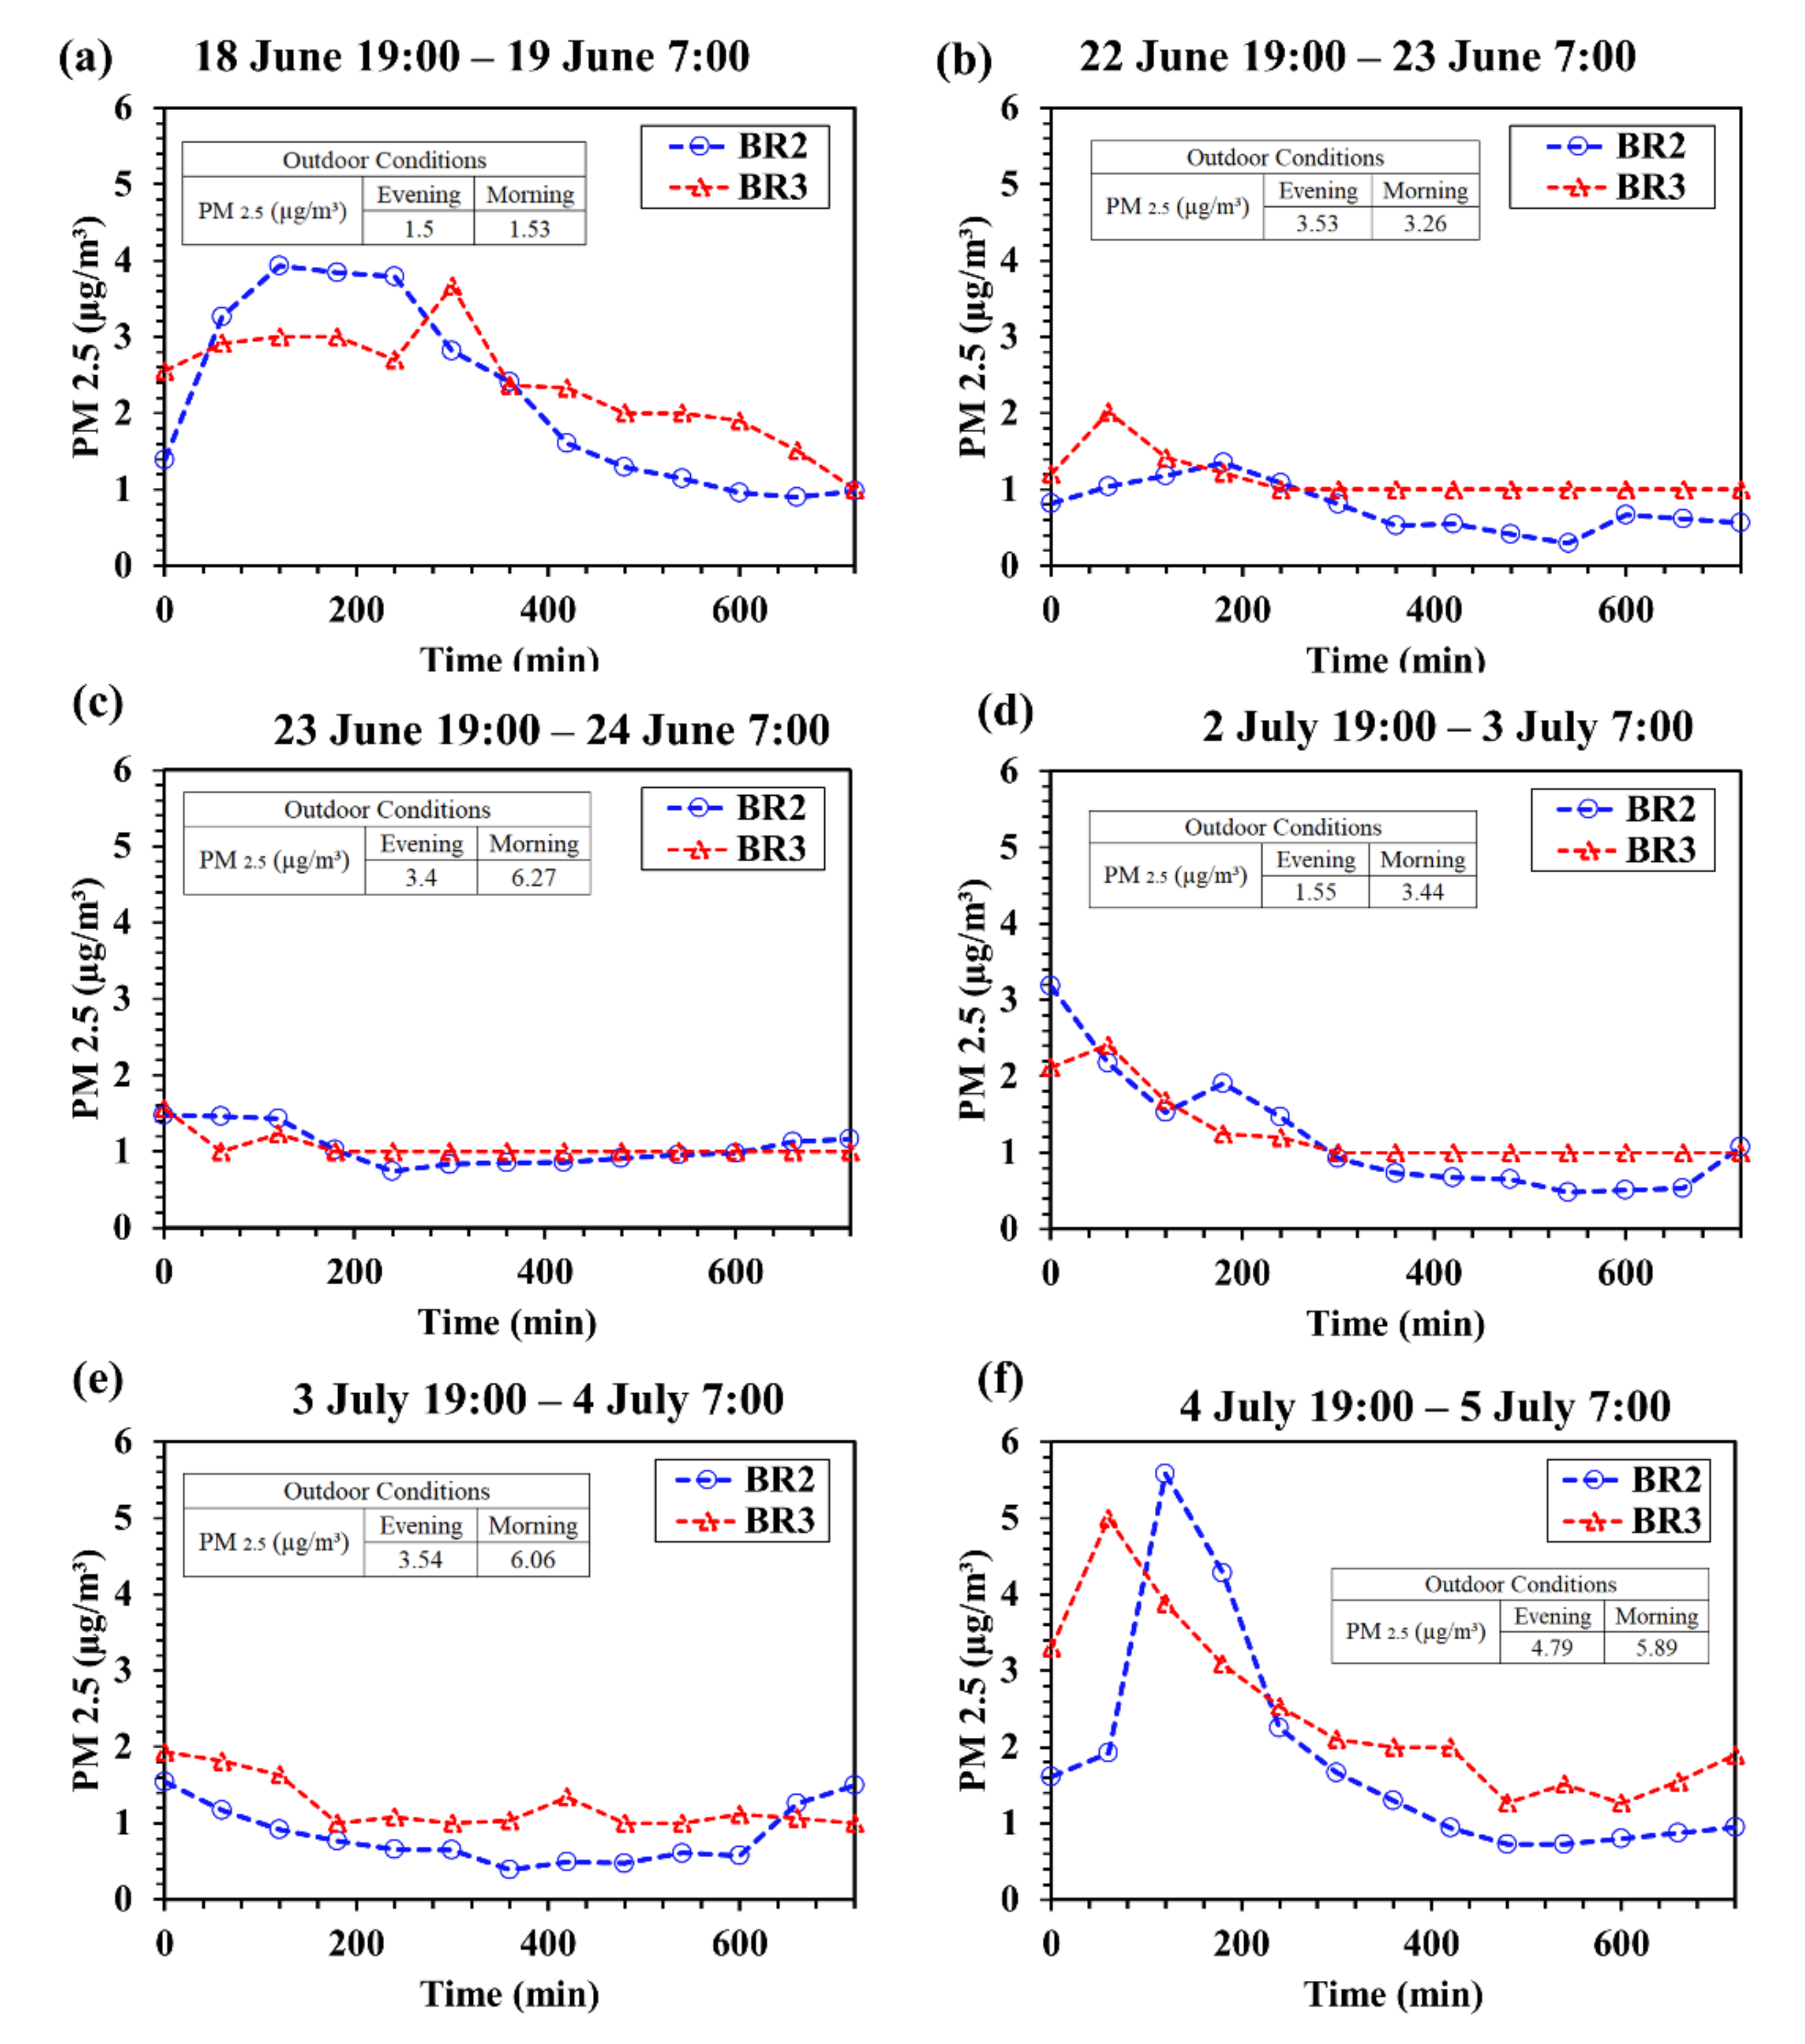
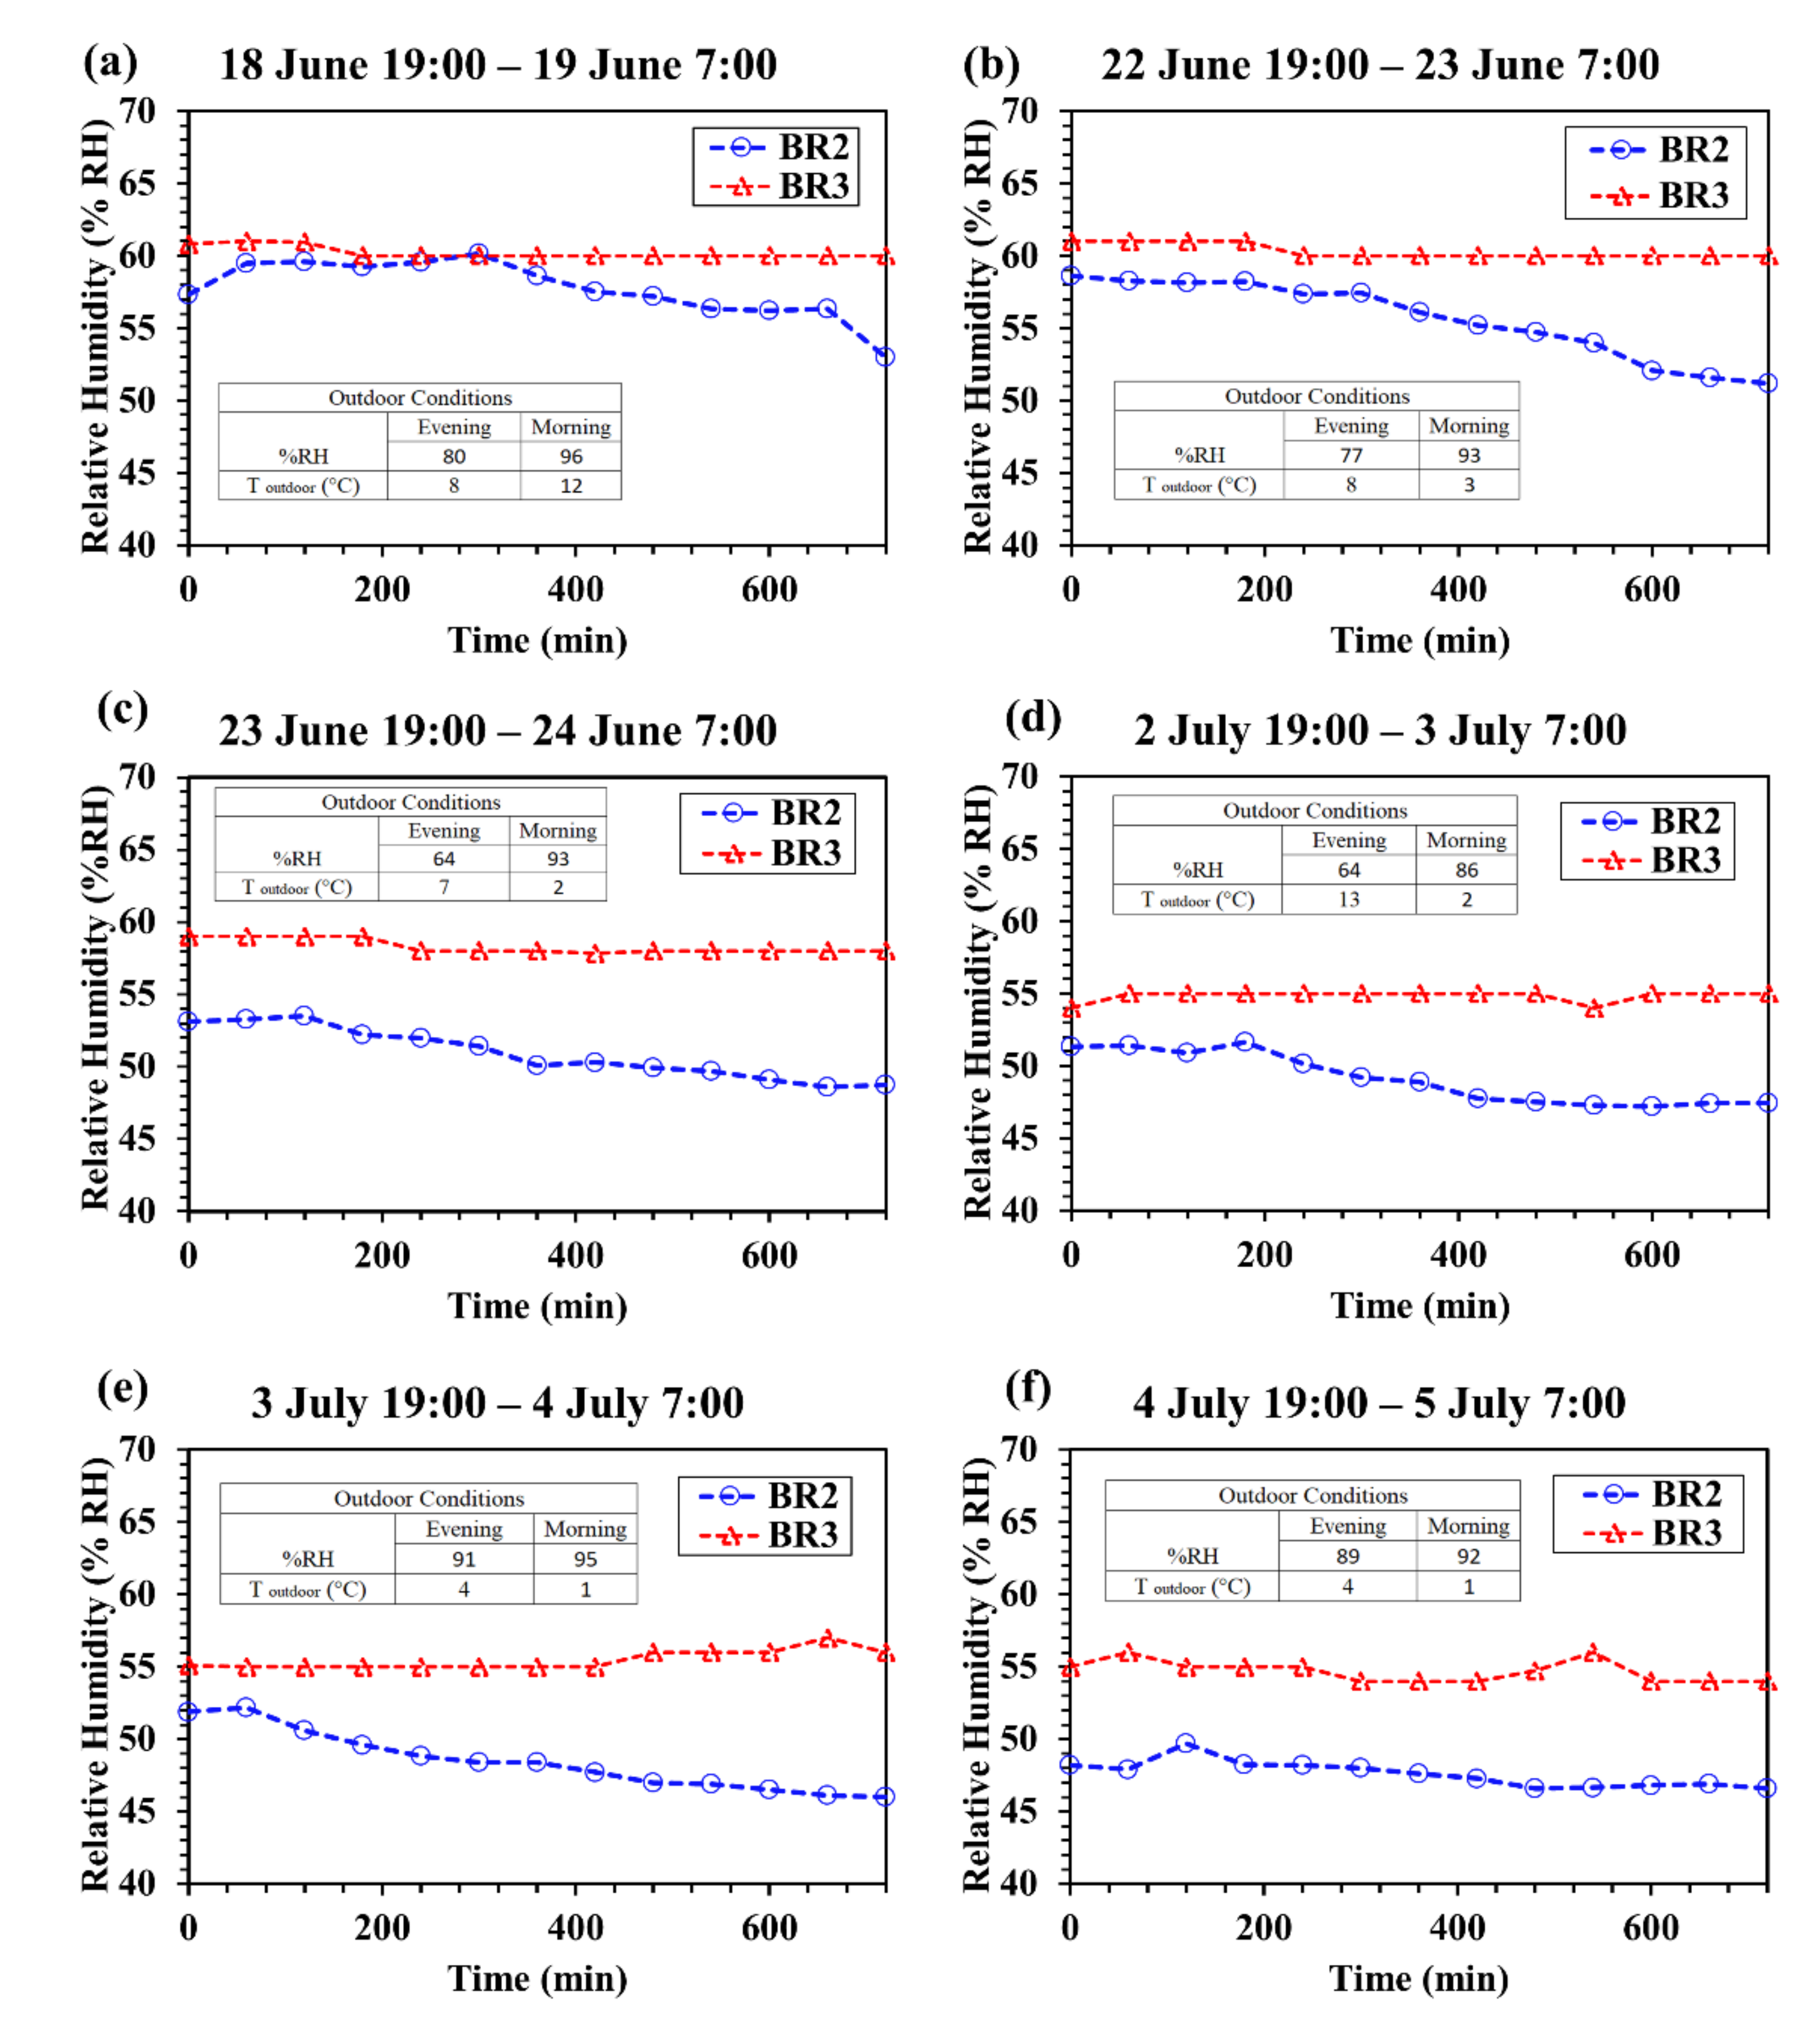
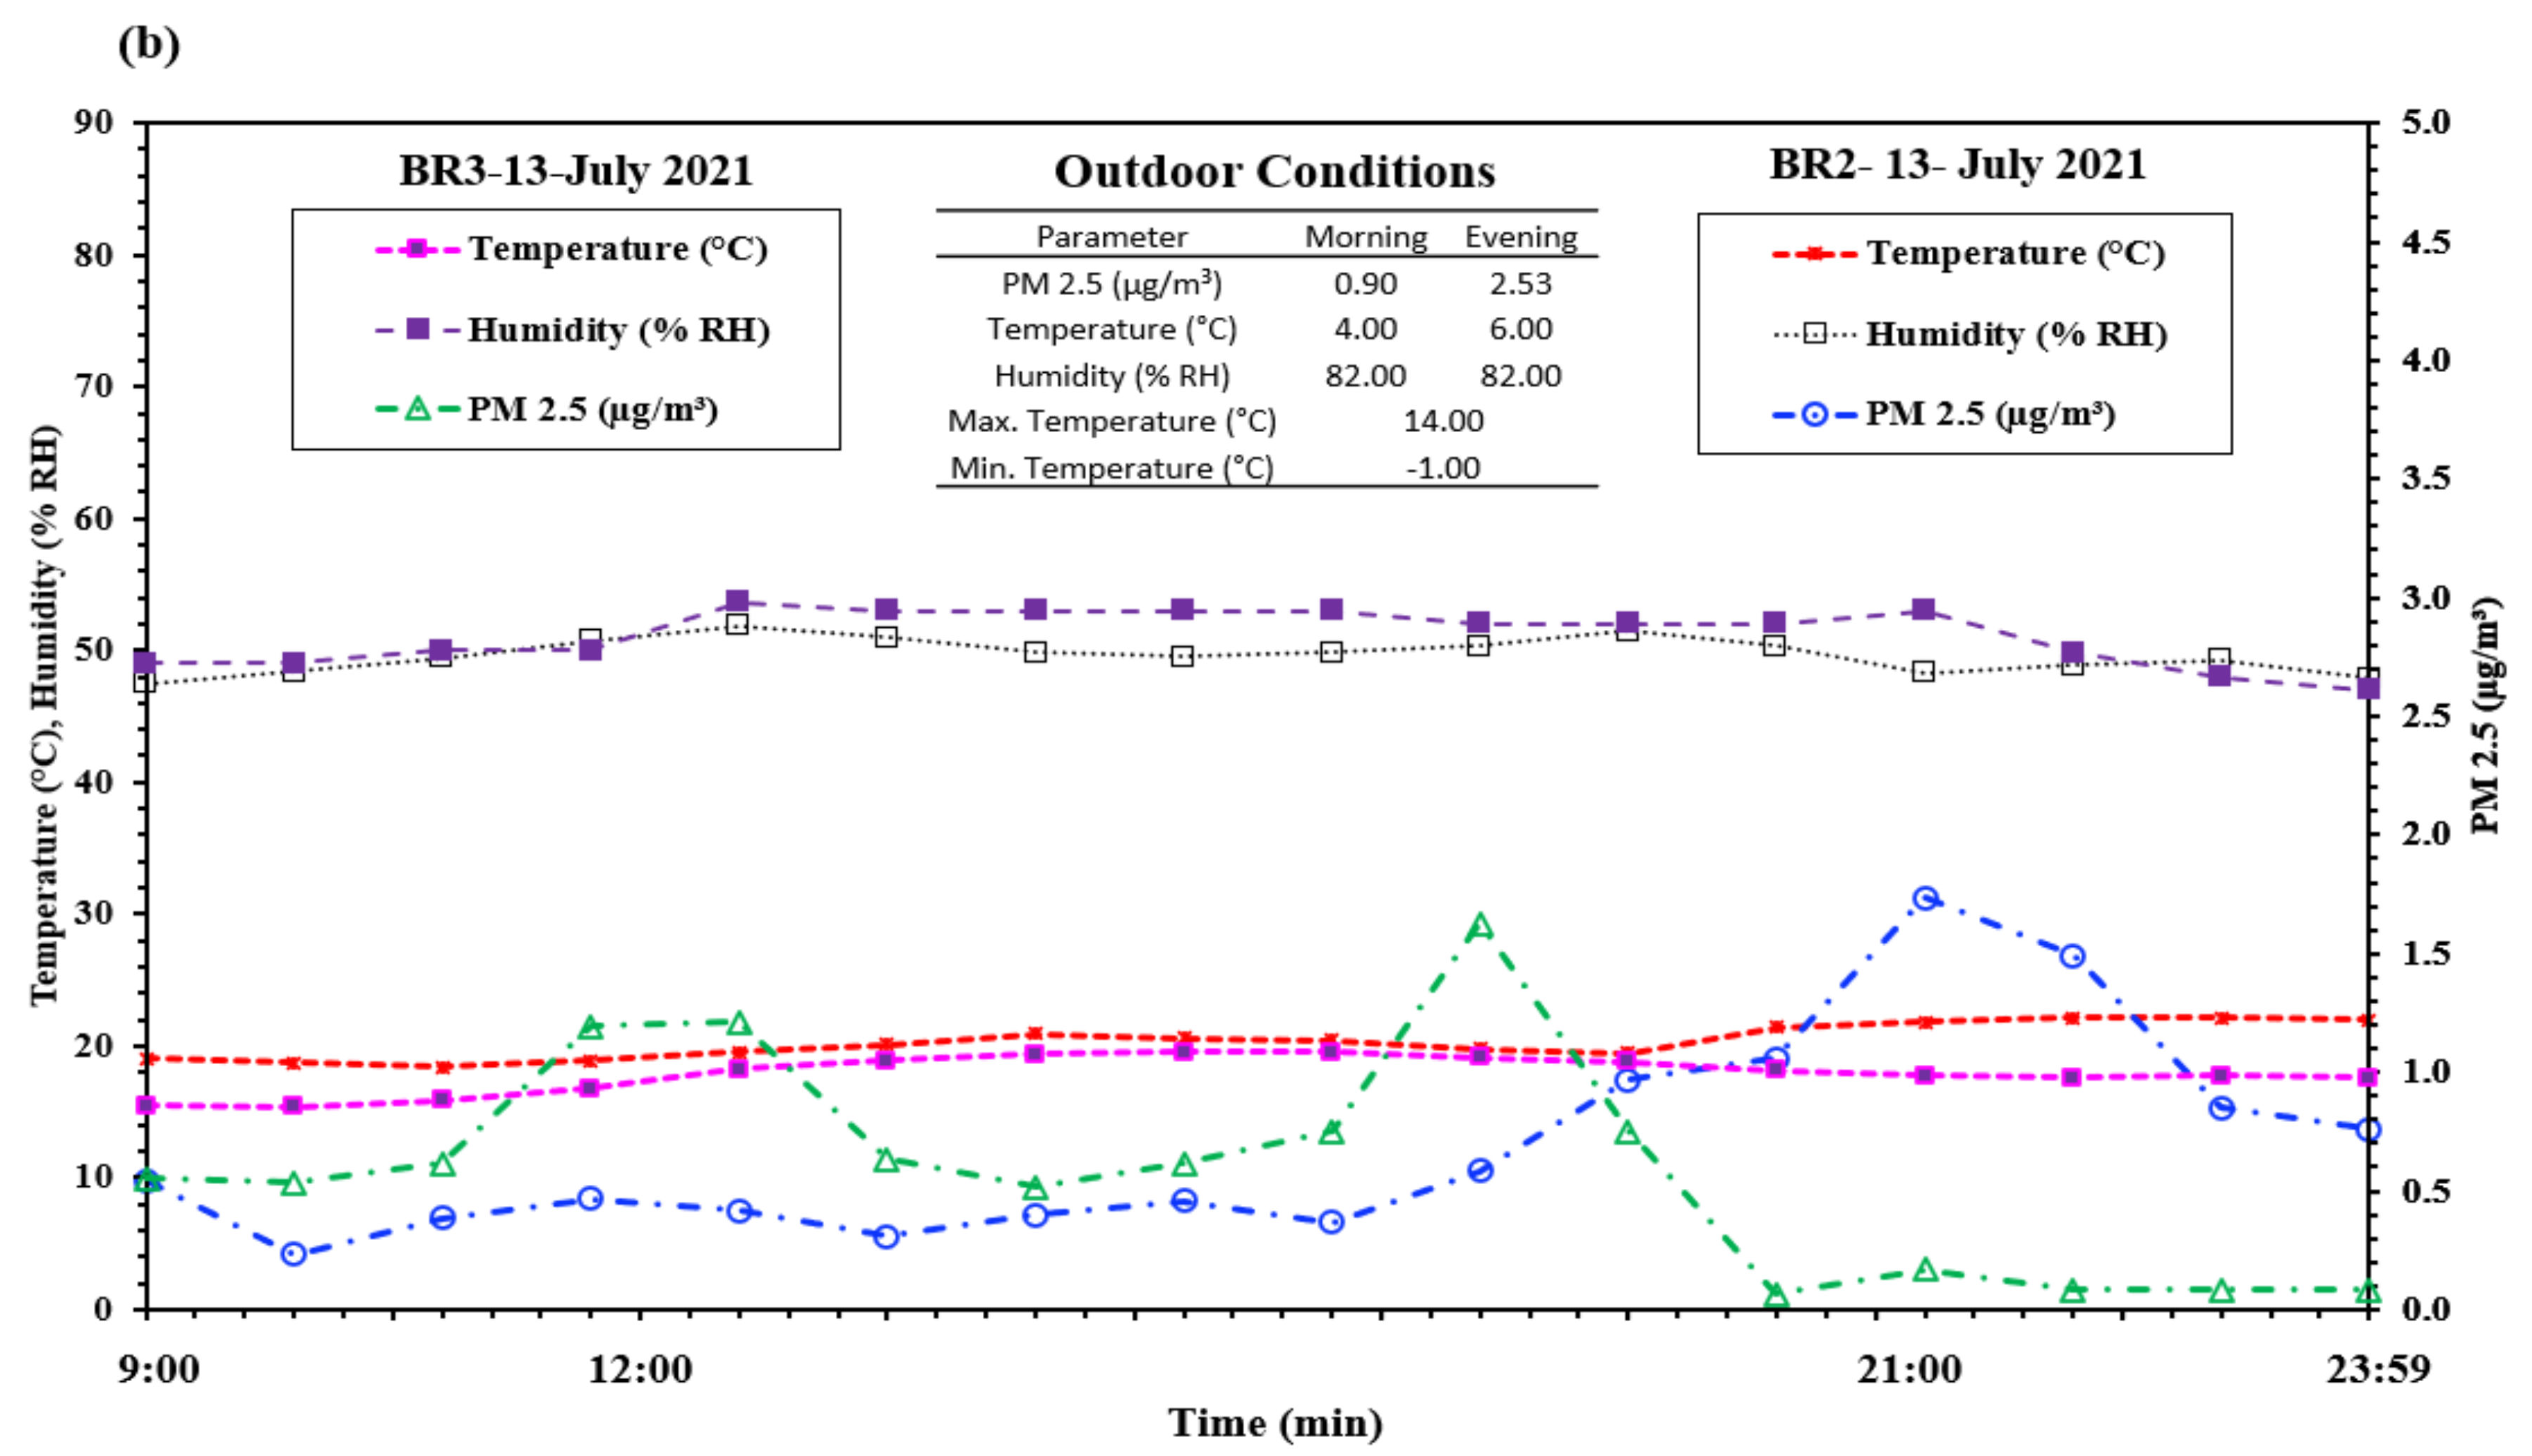
- Camfil air image sensors recorded the PM2.5 ( temperature (°C) and relative humidity (%RH) for both bedrooms.
- Simultaneously, the TERA NextPM sensor measured the outdoor conditions (PM2.5 ( temperature (°C) and relative humidity (%RH).
- At 12:00, the lids were replaced on the agar plates, and the plates were removed from the rooms and incubated at 24 °C for 5 days to allow colony formation and enumeration.
3. Results and Discussion
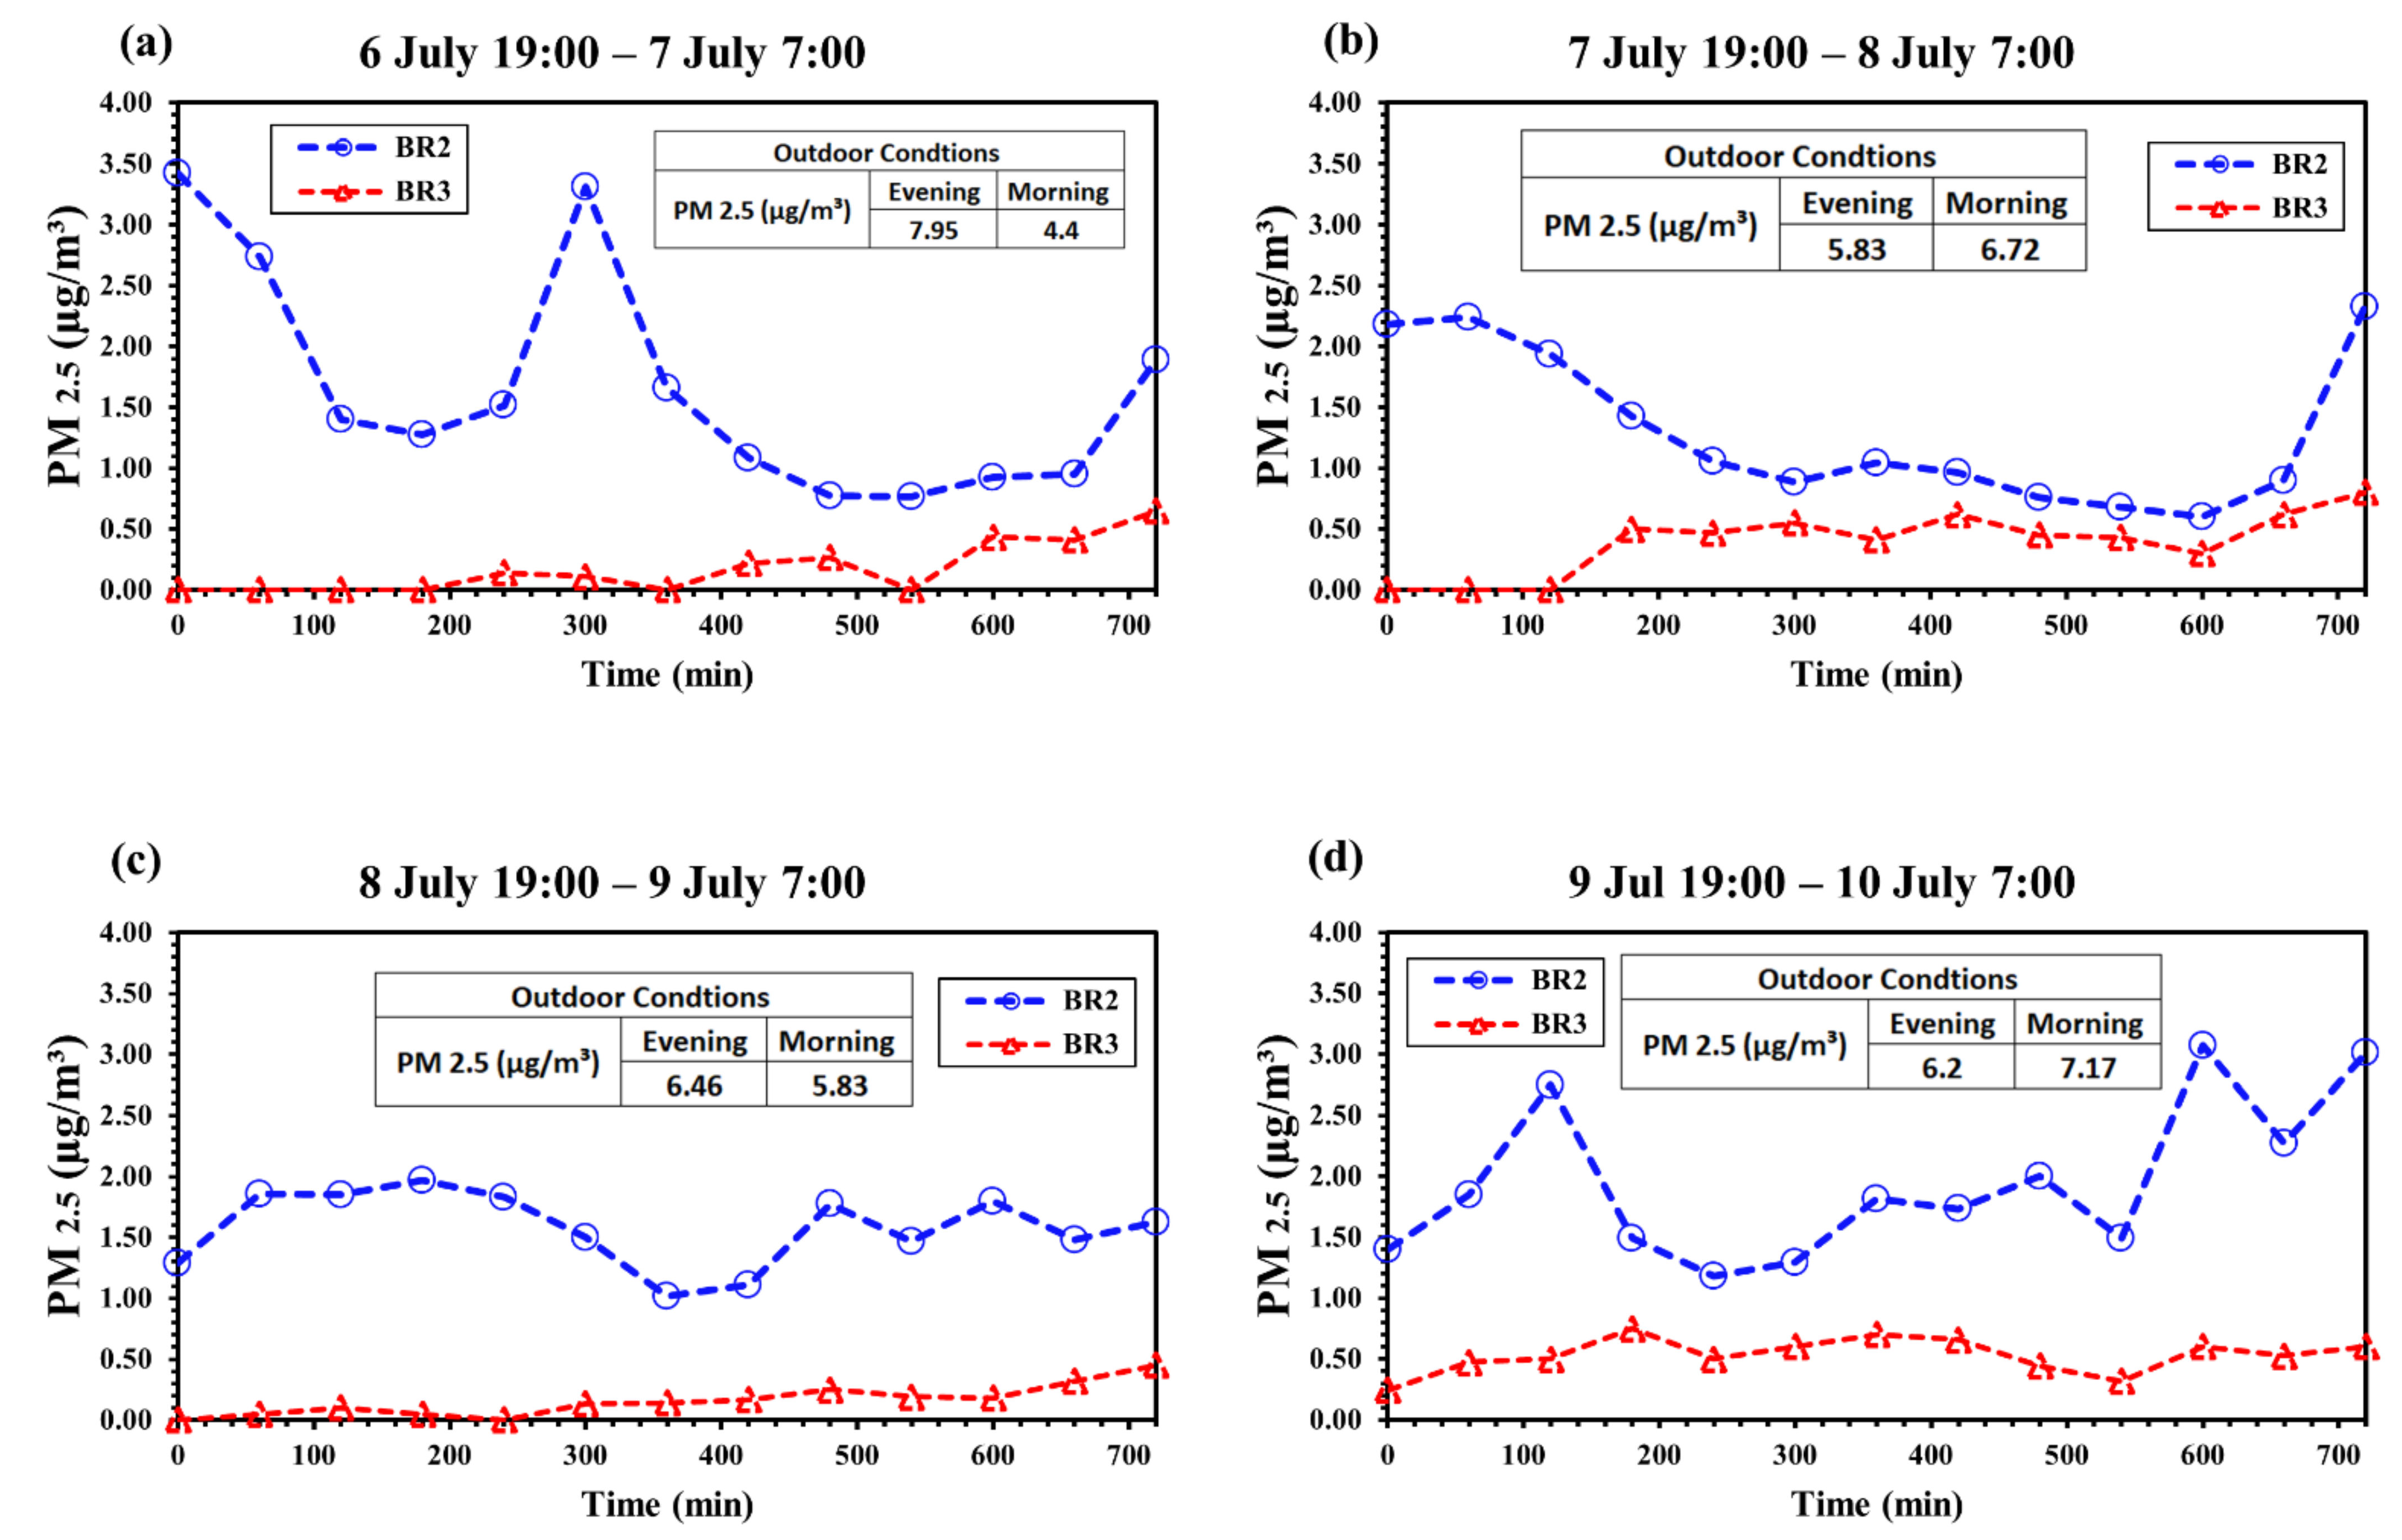
3.1. Air Image Sensor Data
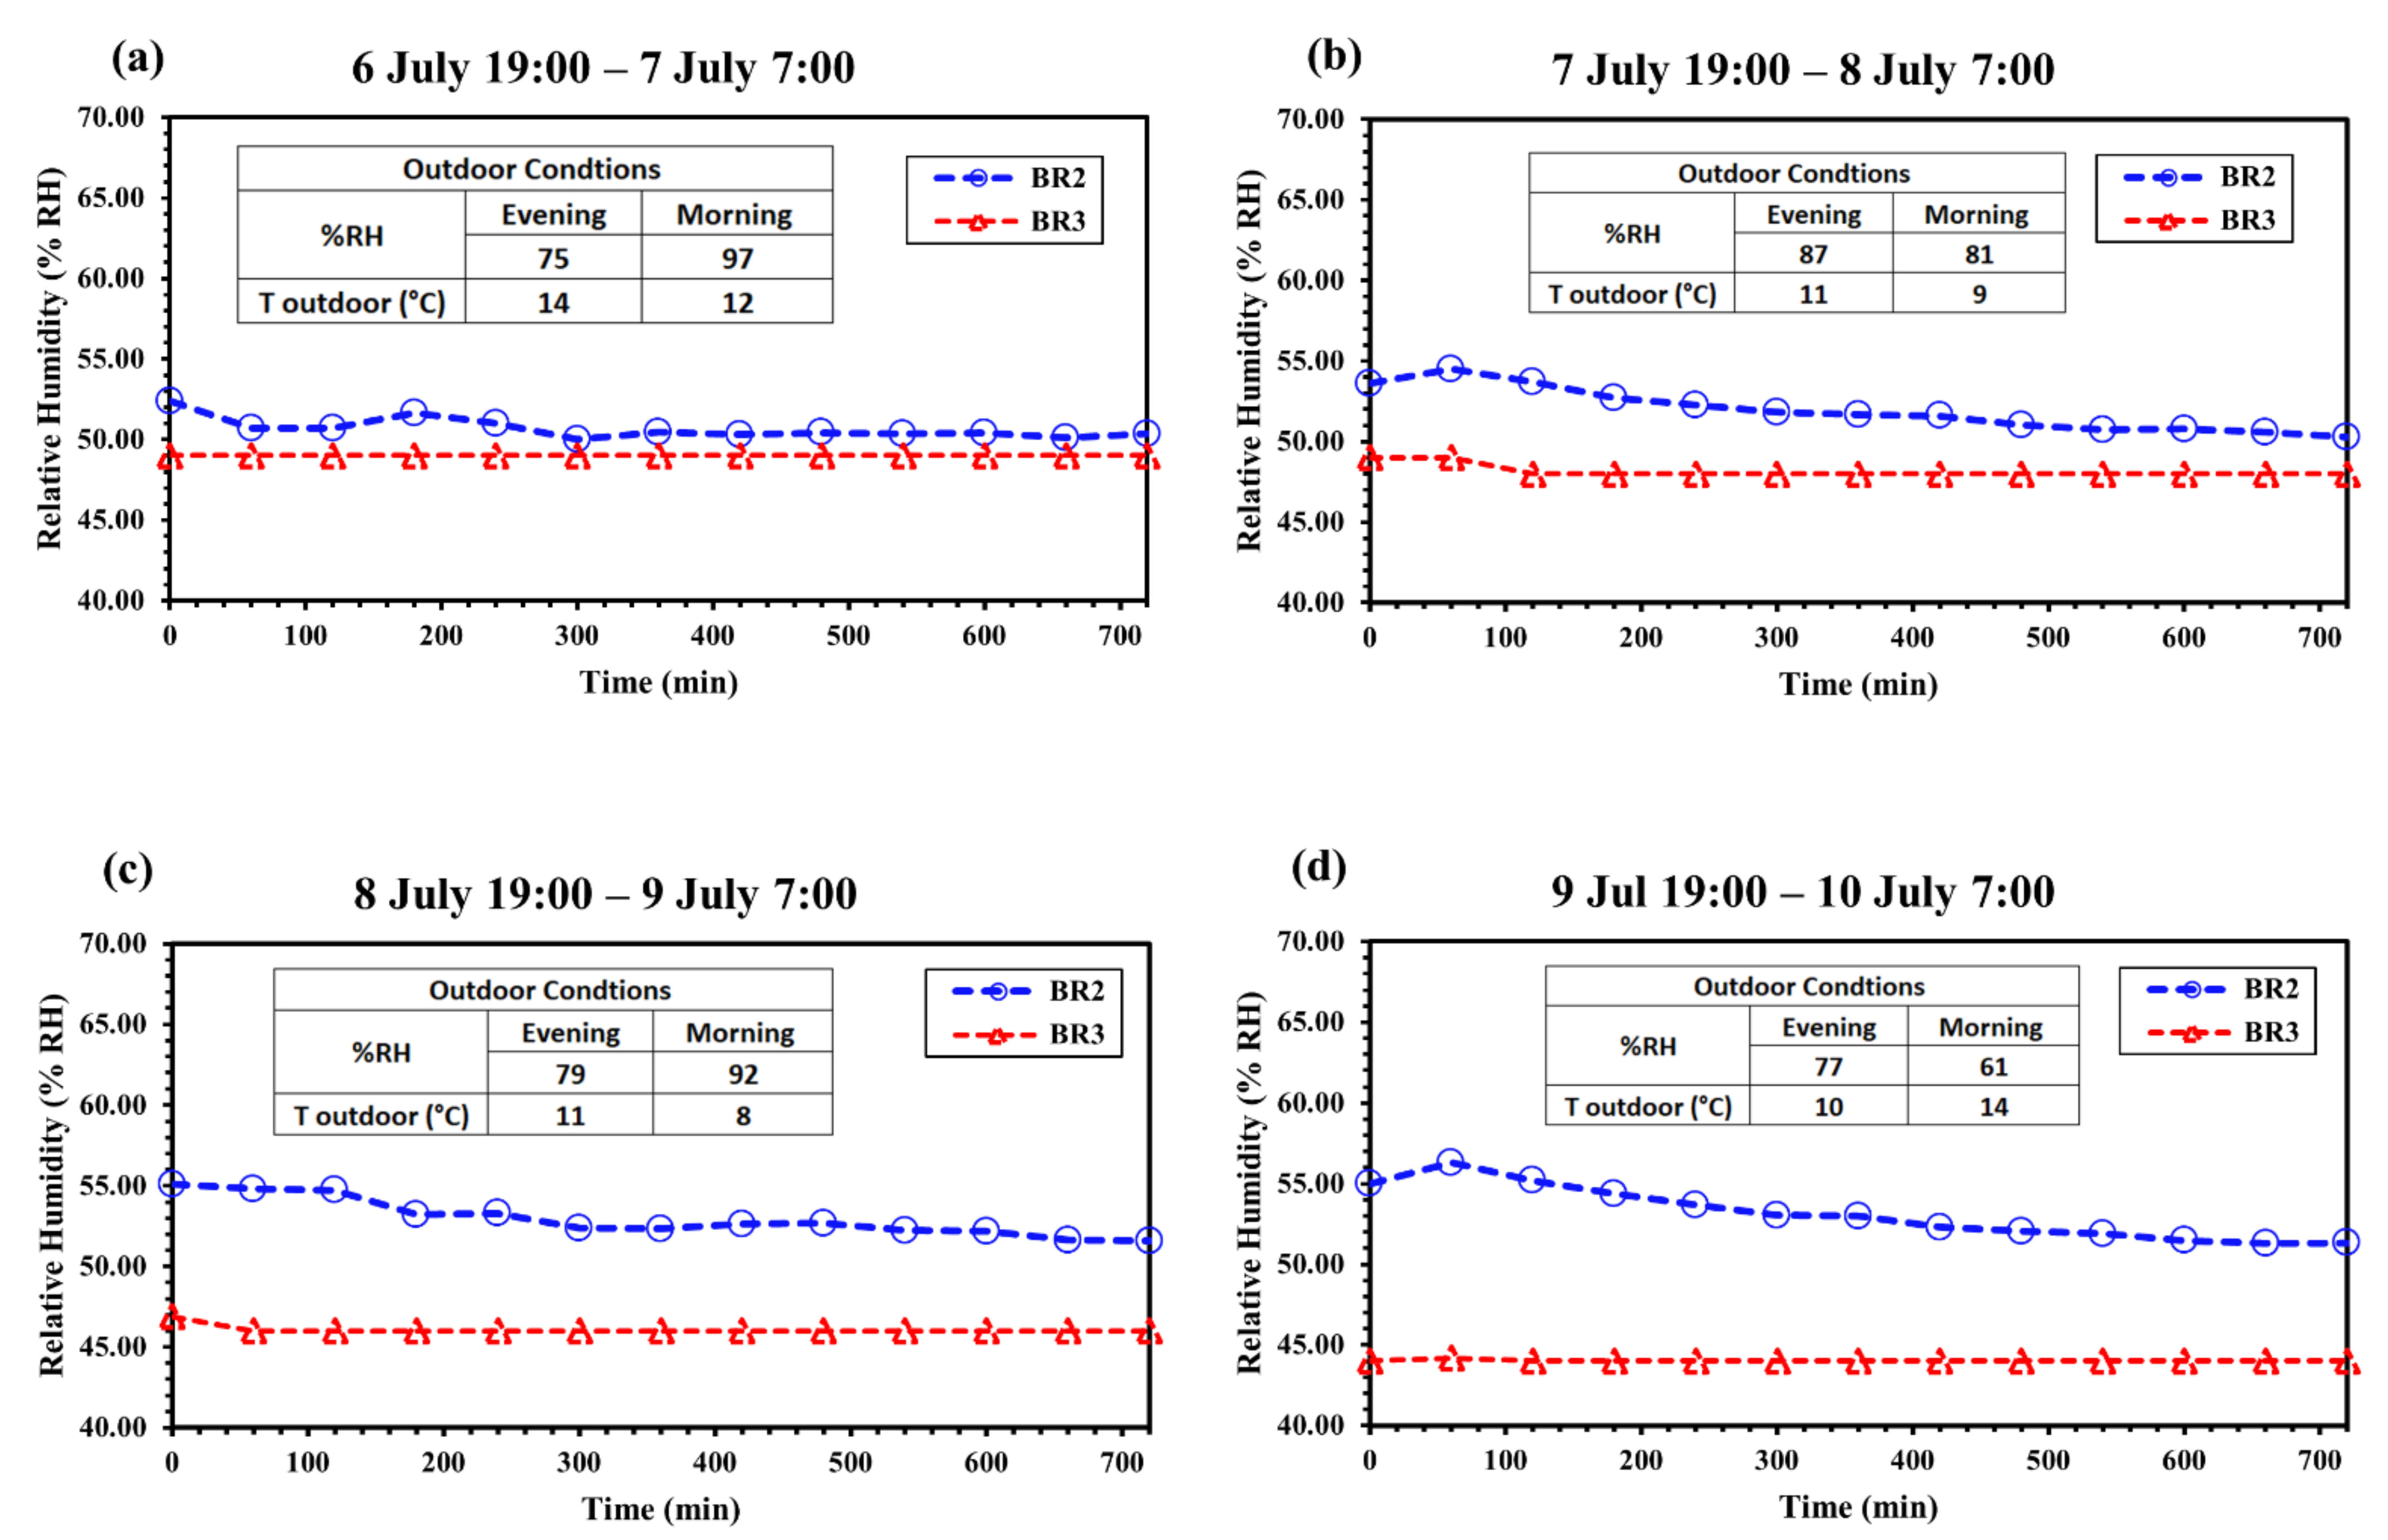
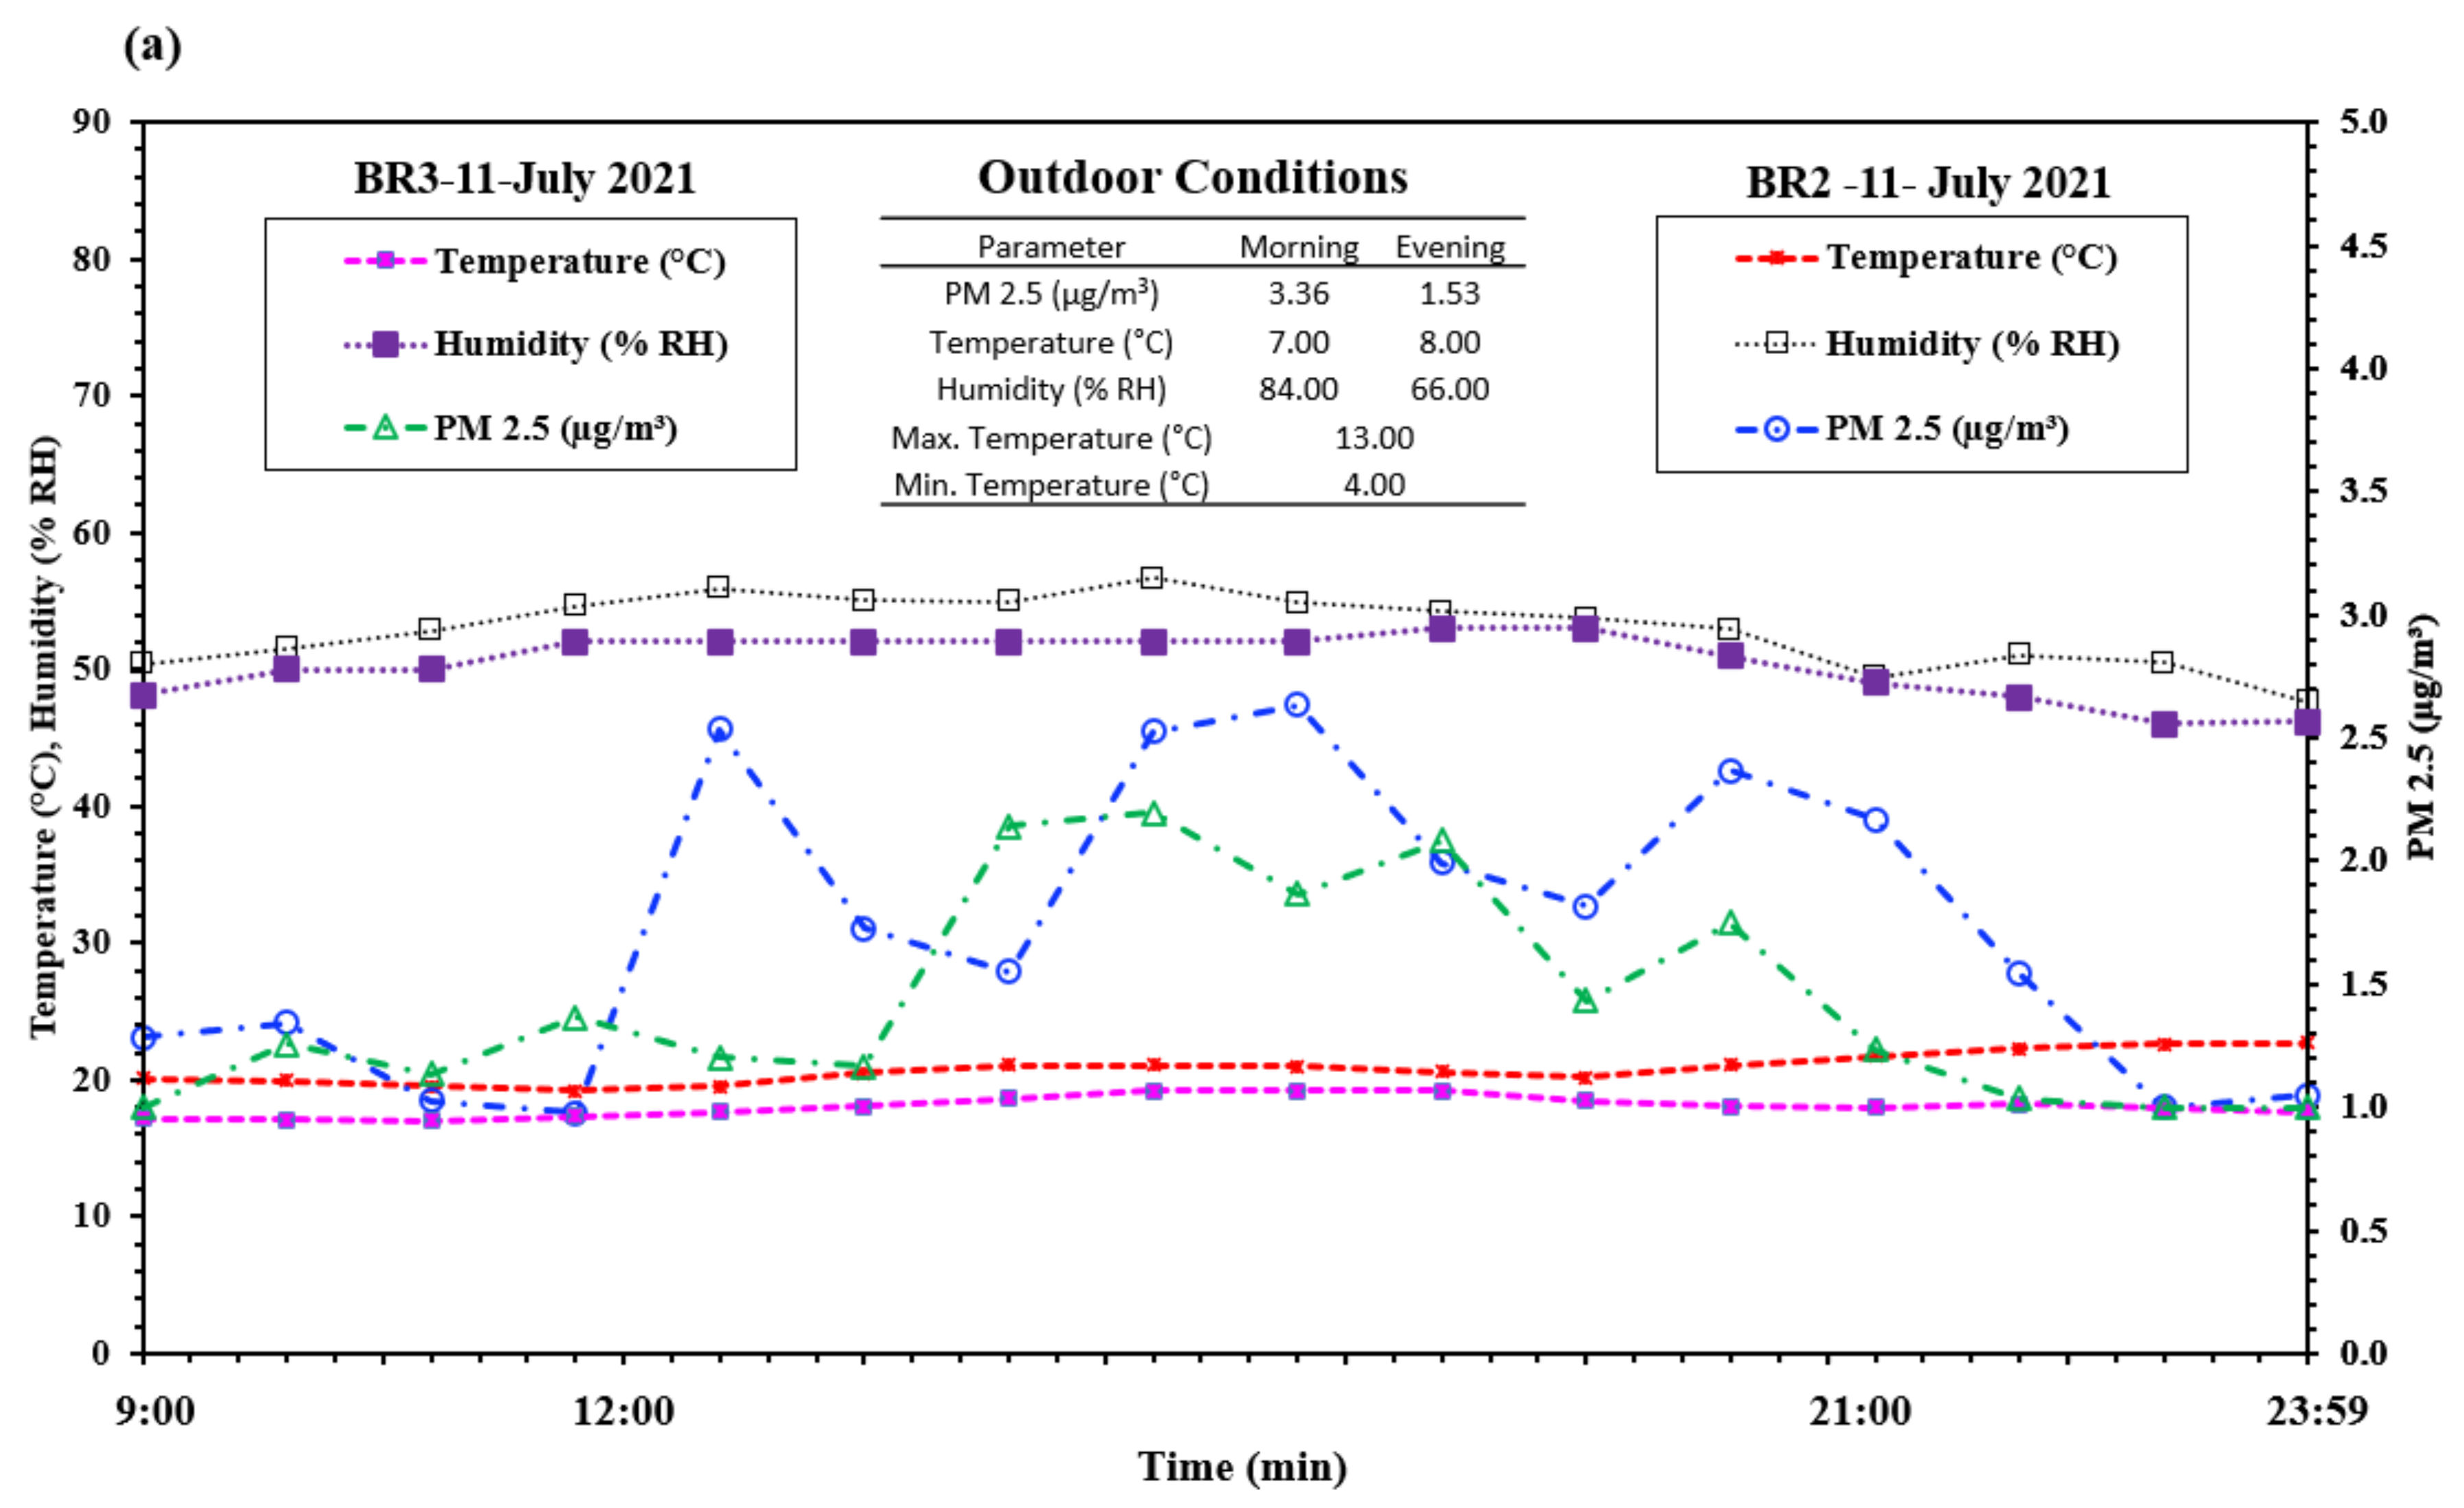
3.2. The Indoor Environmental Quality (IEQ) Data
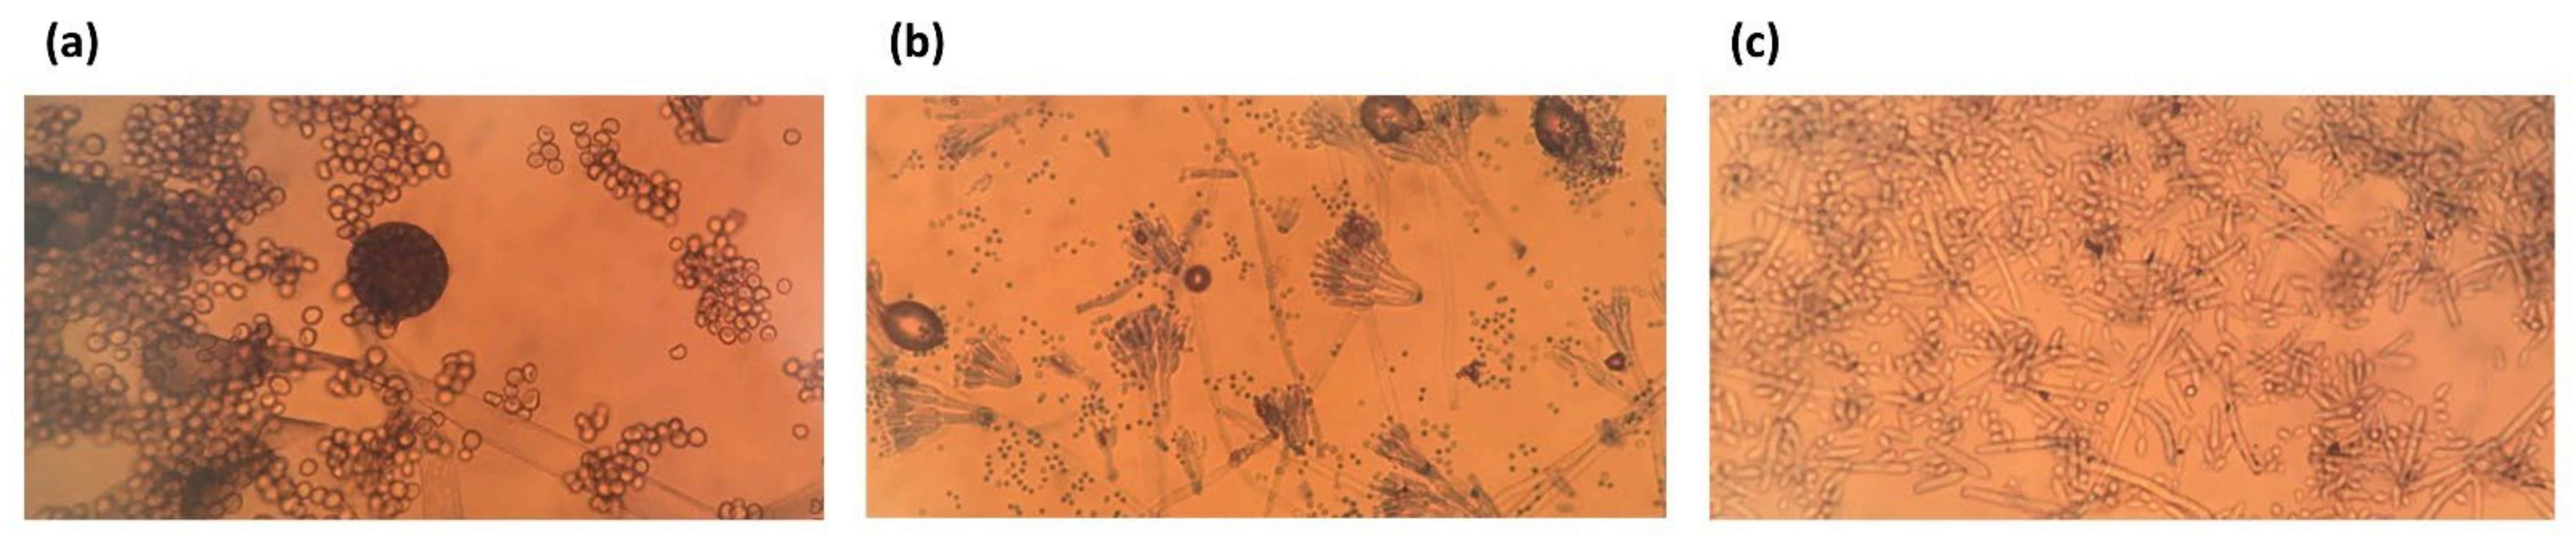
3.3. Mould Assessment
4. Conclusions
Author Contributions
Funding
Institutional Review Board Statement
Informed Consent Statement
Data Availability Statement
Acknowledgments
Conflicts of Interest
References
- Morton, S.; Lai, H.; Walker, C.; Cha, M.J.; Smith, M.A.; Marks, E.; Pillai, M.A. Keeping our Children Warm and Dry: Evidence from Growing Up in New Zealand. 2021. Available online: https://www.branz.co.nz/pubs/research-reports/er58/ (accessed on 7 October 2021).
- Miller, C. New Zealand Homes: Damp, Cold and Mouldy. 2021. Available online: https://www.nzherald.co.nz/nz/new-zealand-homes-damp-cold-and-mouldy/Y6CTOSAHKKYUODIR27LJXGHDCA (accessed on 14 September 2021).
- BRANZ. House Condition Survey 2015 #2: Maintenance and Deferred Maintenance in New Zealand Houses. 2019. Available online: https://www.branz.co.nz/pubs/research-now/hcs-2015/2-maintenance/ (accessed on 14 September 2021).
- Steinemann, A.; Wargocki, P.; Rismanchi, B. Ten questions concerning green buildings and indoor air quality. Build. Environ. 2017, 112, 351–358. [Google Scholar] [CrossRef] [Green Version]
- Diaz Lozano, E.; Siegel, J. Indoor environmental quality in social housing: A literature review. Build. Environ. 2018, 131, 231–241. [Google Scholar] [CrossRef]
- Department of Prime Minister and Cabinet. Child Poverty Related Indicators Report 2020; 2021. Available online: https://dpmc.govt.nz/publications/child-poverty-related-indicators-report-html (accessed on 14 September 2021).
- Stats NZ. Home Stats NZ. 2021. Available online: https://www.stats.govt.nz/ (accessed on 14 September 2021).
- Plagmann, M.; White, V.; McDowall, P. Indoor Climate and Mould in New Zealand Homes. 2021. Available online: https://d39d3mj7qio96p.cloudfront.net/media/documents/SR452_Indoor_climate_and_mould_in_New_Zealand_homes.pdf (accessed on 14 September 2021).
- Kempton, L.; Kokogiannakis, G.; Cooper, P. Mould risk evaluations in residential buildings via site audits and longitudinal monitoring. Build. Environ. 2021, 191, 107584. [Google Scholar] [CrossRef]
- De Robles, D.; Kramer, S. Improving Indoor Air Quality through the Use of Ultraviolet Technology in Commercial Buildings. Procedia Eng. 2017, 196, 888–894. [Google Scholar] [CrossRef]
- Yang, X.; Wang, Y. Photocatalytic effect on plasmid DNA damage under different UV irradiation time. Build. Environ. 2008, 43, 253–257. [Google Scholar] [CrossRef]
- Milonova, S.; Rudnick, S.; McDevitt, J.; Nardell, E. Occupant UV exposure measurements for upper-room ultraviolet germicidal irradiation. Photochem. Photobiol. B Biol. 2016, 159, 88–92. [Google Scholar] [CrossRef] [Green Version]
- Lee, B.; Bahnfleth, W. Effects of installation location on performance and economics of in-duct ultraviolet germicidal irradiation systems for air disinfection. Build. Environ. 2013, 67, 193–201. [Google Scholar] [CrossRef]
- Lau, J.; Bahnfleth, W.; Mistrick, R.; Kompare, D. Ultraviolet irradiance measurement and modeling for evaluating the effectiveness of in-ductultraviolet germicidal irradiation devices. HVAC R Res. 2012, 18, 626–642. [Google Scholar] [CrossRef]
- Yang, Y.; Deng, Q. Numerical Modelling to Evaluate the Disinfection Efficacy of Multiple Upper-Room Ultaviolet Germicidal Fixtures System. Procedia Eng. 2015, 121, 1657–1664. [Google Scholar] [CrossRef] [Green Version]
- Gong, J.; Chen, Y.; Huang, Y.; Tsai, M.; Yu, K. For the inactivation of mould spores by UVC irradiation, with ozone acting as a promoter, TiO2nanoparticles may act better as a “sun block” than as a photocatalytic disinfectant. Photochem. Photobiol. Sci. 2014, 13, 1305–1310. [Google Scholar] [CrossRef]
- Graziani, L.; Quagliarini, E.; Osimani, A.; Aquilanti, L.; Clementi, F.; Yéprémian, C.; D’Orazio, M. Evaluation of inhibitory effect of TiO2 nanocoatings against microalgal growth on clay brick façades under weak UV exposure conditions. Build. Environ. 2013, 64, 38–45. [Google Scholar] [CrossRef]
- Jiang, Q.; Ding, C.; Liu, Y. A type of novel glass for indoor air cleaning under visible-light. Build. Environ. 2018, 137, 226–234. [Google Scholar] [CrossRef]
- Cho, K.; Chae, C.-U.; Cho, D.; Kim, T. Changes in Fan Energy Consumption According to Filters Installed in Residential Heat Recovery Ventilators in Korea. Sustainability 2021, 13, 10119. [Google Scholar] [CrossRef]
- AL-Rawi, M.; Ikutegbe, C.; Auckaili, A.; Farid, M. Sustainable technologies to improve indoor air quality in a residential House —A case study in Waikato, New Zealand. Energy Build. 2021, 250, 111283. [Google Scholar] [CrossRef]
- Park, S.-H.; Jo, J.-H.; Kim, E.-J. Data-Driven Models for Estimating Dust Loading Levels of ERV HEPA Filters. Sustainability 2021, 13, 13643. [Google Scholar] [CrossRef]
- Chung, K.; Hsu, S. Effect of ventilation pattern on room air and contaminant distribution. Build. Environ. 2001, 36, 989–998. [Google Scholar] [CrossRef]
- Fisk, W.; Faulkner, D.; Sullivan, D.; Bauman, F. Air Change Effectiveness and Pollutant Removal Efficiency during Adverse Mixing Conditions. Indoor Air. 1997, 7, 55–63. [Google Scholar] [CrossRef]
- Novoselac, A.; Srebric, J. Comparison of air exchange efficiency and contaminant removal effectiveness as IAQ indices. ASHRAE Trans. 2003, 109, 339–349. [Google Scholar]
- Persily, A.; Dols, W.; Nabinger, S. Air Change Effectiveness Measurements in Two Modern Office Buildings. Indoor Air. 1994, 4, 40–55. [Google Scholar] [CrossRef]
- Kato, S.; Yang, J. Study on inhaled air quality in a personal air-conditioning environment using new scales of ventilation efficiency. Build. Environ. 2008, 43, 494–507. [Google Scholar] [CrossRef]
- Pereira, M.; Graudenz, G.; Tribess, A.; Morawska, L. Determination of particle concentration in the breathing zone for four different types of office ventilation systems. Build. Environ. 2009, 44, 904–911. [Google Scholar] [CrossRef] [Green Version]
- Yassin, M.; Almouqatea, S. Assessment of airborne bacteria and fungi in an indoor and outdoor environment. Int. J. Environ. Sci Technol. 2010, 7, 535–544. [Google Scholar] [CrossRef] [Green Version]
- Rim, D.; Novoselac, A. Ventilation effectiveness as an indicator of occupant exposure to particles from indoor sources. Build. Environ. 2010, 45, 1214–1224. [Google Scholar] [CrossRef]
- Guyot, G.; Sherman, M.H.; Walker, I.S. Smart ventilation energy and indoor air quality performance in residential buildings: A review. Energy Build. 2018, 165, 416–430. [Google Scholar] [CrossRef] [Green Version]
- Waikato Region-Air Quality. Land, Air, Water Aotearoa (LAWA). 2021. Available online: https://www.lawa.org.nz/explore-data/waikato-region/air-quality/ (accessed on 26 September 2021).
- Tenancy Services-Heating Assessment Tool. Tenancy Services. 2021. Available online: https://www.tenancy.govt.nz/heating-tool/ (accessed on 14 September 2021).
- Leyland, B. Power Outages: Mercury, Genesis Offering Credit after Power Cuts. 2021. Available online: https://www.nzherald.co.nz/business/power-outages-mercury-genesis-offering-credit-after-power-cuts/JFYU7OZVCQMXUMYSCM2SNHIOCI/ (accessed on 14 September 2021).
- Johnston, P.; Weir, B.; Cooper, J. Open data on fungi and bacterial plant pathogens in New Zealand. Mycology 2017, 8, 59–66. [Google Scholar] [CrossRef] [Green Version]
- Corlett, M.; Hughes, S.; Kaufert, M. New Zealand Fungi. N. Z. J. Bot. 1973, 11, 213–230. [Google Scholar] [CrossRef]
- Nunez, J. Potato Dextrose Agar (PDA). 2018. Available online: https://www.mycrobe.org/blog/2018/7/6/potato-dextrose-agar-pda (accessed on 14 September 2021).
- WA, Weather Forecast for New Zealand, Weather Atlas. Monthly Weather Forecast and Climate New Zealand. Available online: https://www.weather-atlas.com/en/new-zealand-climate (accessed on 14 September 2021).
- Ikehata, H.; Ono, T. The Mechanisms of UV Mutagenesis. J. Radiat. Res. 2011, 52, 115–125. [Google Scholar] [CrossRef] [Green Version]
- Mori, M.; Hamamoto, A.; Takahashi, A.; Nakano, M.; Wakikawa, N.; Tachibana, S.; Kinouchi, Y. Development of a new water sterilization device with 365 nm UV-LED. Med. Biol. Eng. Comput. 2007, 45, 1237–1241. [Google Scholar] [CrossRef]
- Al-Rawi, M.; Lazonby, A.; Smith, C. Prototyping a low-cost residential air quality device using ultraviolet germicidal irradiation (UVGI) light. HardwareX 2022, 11, e00251. [Google Scholar] [CrossRef]
- RNZ, New Zealand’s Cold Old Housing Stoke. 2019. Available online: https://www.rnz.co.nz/national/programmes/ninetonoon/audio/2018701043/new-zealand-s-cold-old-housing-stock (accessed on 29 March 2022).
- ASHRAE Standard 62.1-2013; Ventilation for Acceptable Indoor Air Quality. American Society of Heating, Refrigerating and Air-Conditioning Engineers. Standards for Natural and Mechanical Ventilation; ASHRAE: New York, NY, USA, 1973.
- Van Doorn, L.; Arnold, A.; Rapoport, E. In the Age of Cities: The Impact of Urbanisation on House Prices and Affordability; Nijskens, R., Lohuis, M., Hilbers, P., Heeringa, W., Eds.; Hot Property; Springer: Cham, Switzerland, 2019. [Google Scholar] [CrossRef] [Green Version]
- Johnson, A.; Howden-Chapman, P.; Eaqub, S. A Stocktake of New Zealand’s Housing. Report to the Ministry of Business, Innovation and Employment. 2018. Available online: https://www.beehive.govt.nz/sites/default/files/2018-02/A%20Stocktake%20Of%20New%20Zealand%27s%20Housing.pdf (accessed on 29 March 2022).
- Housing and Urban Development, New Zealand Government. Construction Materials Supply Chain-Risk and Management. 2021. Available online: https://www.hud.govt.nz/assets/News-and-Resources/Proactive-Releases/22.-AH-21-024-Construction-Materials-Supply-Chain-briefing-watermarked.pdf (accessed on 29 March 2022).


| Town | Year | PM10 | PM2.5 | Level | PM10 | PM2.5 | Level | Temperature and Relative Humidity °C/%RH | ||
|---|---|---|---|---|---|---|---|---|---|---|
| Annual Average | Highest Daily Average | High | Low | Average | ||||||
| Hamilton | 2018 | 32.1 | 22.9 | U | 43.2 | 30.2 | U | 16/100 | 3/45 | 11/85 |
| 2019 | 48 | 40.5 | E* | 48 | 40.5 | E* | 18/100 | 5/51 | 12/81 | |
| 2020 | 43.2 | 30.2 | E* | 32.1 | 22.9 | U | 18/98 | 2/44 | 11/81 | |
| Auckland | 2018 | 15.4 | 5.7 | U | 33.2 | 13 | U | 17/100 | 3/44 | 11/86 |
| 2019 | 16.7 | 6.8 | U | 99.4 | 64 | E* | 18/100 | 4/55 | 12/88 | |
| 2020 | 16.8 | 7.2 | U | 33.2 | 13 | U | 18/100 | 3/48 | 12/84 | |
Publisher’s Note: MDPI stays neutral with regard to jurisdictional claims in published maps and institutional affiliations. |
© 2022 by the authors. Licensee MDPI, Basel, Switzerland. This article is an open access article distributed under the terms and conditions of the Creative Commons Attribution (CC BY) license (https://creativecommons.org/licenses/by/4.0/).
Share and Cite
Al-Rawi, M.; Farid, M.M.; Jones, R.J.; Louie, K. Evaluation of a Polyester Filter and UV Light (PFUV) Dehumidifier to Improve Indoor Environmental Quality: Preliminary Results. Sustainability 2022, 14, 4504. https://doi.org/10.3390/su14084504
Al-Rawi M, Farid MM, Jones RJ, Louie K. Evaluation of a Polyester Filter and UV Light (PFUV) Dehumidifier to Improve Indoor Environmental Quality: Preliminary Results. Sustainability. 2022; 14(8):4504. https://doi.org/10.3390/su14084504
Chicago/Turabian StyleAl-Rawi, Mohammad, Mohammed M. Farid, Rhys J. Jones, and Ken Louie. 2022. "Evaluation of a Polyester Filter and UV Light (PFUV) Dehumidifier to Improve Indoor Environmental Quality: Preliminary Results" Sustainability 14, no. 8: 4504. https://doi.org/10.3390/su14084504
APA StyleAl-Rawi, M., Farid, M. M., Jones, R. J., & Louie, K. (2022). Evaluation of a Polyester Filter and UV Light (PFUV) Dehumidifier to Improve Indoor Environmental Quality: Preliminary Results. Sustainability, 14(8), 4504. https://doi.org/10.3390/su14084504