Article

Seasonal Variation of Vegetation and Its Spatiotemporal Response to Climatic Factors in the Qilian Mountains, China

1
Key Laboratory of Desert and Desertification, Northwest Institute of Eco-Environment and Resources, Chinese Academy of Sciences, Lanzhou 730050, China
2
Drylands Salinization Research Station, Northwest Institute of Eco-Environment and Resources, Chinese Academy of Sciences, Lanzhou 730050, China
3
Key Laboratory of Remote Sensing of Gansu Province, Northwest Institute of Eco-Environment and Resources, Chinese Academy of Sciences, Lanzhou 730050, China
*
Author to whom correspondence should be addressed.
Sustainability 2022, 14(9), 4926; https://doi.org/10.3390/su14094926
Submission received: 1 April 2022 / Revised: 12 April 2022 / Accepted: 18 April 2022 / Published: 20 April 2022
(This article belongs to the Section Sustainability in Geographic Science)

Abstract

:
The purpose of this study is to reveal the seasonal difference in vegetation variation and its seasonal response to climate factors in the Qilian Mountains (QM) under the background of global warming. Based on the MOD13 A2 normalized difference vegetation index (NDVI) data and meteorological data, this study analyzed the spatiotemporal dynamics and stability of vegetation in different seasons by using the mean value method, trend analysis and stability analysis method, and discussed their seasonal responses to climatic factors based on the correlation analysis method. The results show that the vegetation cover in the QM experienced a significant upward trend in the past 21 years, but there were obvious spatial differences in vegetation change in different seasons. The growth rate of vegetation in summer was the fastest, and summer vegetation provided the most significant contribution to the growing season vegetation. The order of vegetation stability in the QM among the seasons was growing season > summer > spring > autumn. The vegetation change was obviously affected by temperature in spring, while it was mainly controlled by precipitation in the growing season and summer. The response of vegetation to climatic factors was not significant in autumn. Our results can provide important data support for ecological protection in the QM and socioeconomic development in the Hexi Corridor.

1. Introduction

The relationship between global change and terrestrial ecosystems (GCTE) is a vital component of global change research [1,2]. As the most important and sensitive component of terrestrial ecosystems to climate change [3,4,5], vegetation connects the soil, hydrosphere and atmosphere and promotes material migration and energy exchange in each layer [6,7,8]. Meanwhile, vegetation plays an irreplaceable role in climate regulation, the terrestrial carbon cycle, the maintenance of biodiversity, the prevention of desertification and water conservation through related biophysical and chemical processes (i.e., photosynthesis, transpiration, etc.) [9,10,11,12]. Global and regional climate change often affects the growth of surface vegetation by changing its structure and function [13,14]. The growth status of surface vegetation can also have a positive feedback effect on corresponding climate change [2,15,16]. Vegetation dynamics and their responses to climate change have become popular topics in global change research [17,18].
Related studies show that from the early 1980s to the late 1990s, vegetation activity in the high latitudes of the Northern Hemisphere increased significantly due to global warming [19,20,21]. However, the latest studies found that in the decade after 2000, the increasing trend of vegetation cover slowed or even decreased in many areas of the Northern Hemisphere [22,23,24]. Under the background of global warming, vegetation coverage presents a trend of opposite changes. The continuously increased temperature is beneficial to vegetation growth in humid regions, but worsening drought in arid areas is not conducive to improvements in vegetation coverage [25]. Global vegetation is still facing the risk of long-term change from increases to degradation in the future.
The vegetation index is the most important indicator for studying the spatiotemporal dynamics of vegetation, especially monitoring and studying vegetation cover changes at medium and large scales. Among various vegetation indices, the NDVI has been widely used to explore the dynamic mechanism of vegetation and its response to environmental change at different temporal and spatial scales [26]. The NDVI, extracted by the difference of reflectance between near-infrared and infrared bands, has been proven to be accurate and effective in capturing and reflecting the growth information of vegetation and has been widely used in vegetation change detection. [27,28]. Meanwhile, many studies have shown that the NDVI is very sensitive to variations in vegetation physiological characteristics and could reflect the status of vegetation growth and cover [29,30]. The dynamic change in the NDVI is directly related to climate change, and this change is also an important indicator to reveal how vegetation is affected by climate change [31,32]. Currently, the most commonly used NDVI data are derived from Advanced Very High Resolution Radiometer (AVHRR), Satellite Pour I’Observation de la Terre-Vegetation (SPOT-VGT) and Moderate-resolution Imaging Spectroradiometer (MODIS) bands. There are some differences among the three NDVI products in terms of sensors, spectral response functions, correction and data processing methods, synthesis times and spatiotemporal resolutions [33]. Among them, the 15-day composite AVHRR NDVI data with 8 km resolution has been updated several times and have the longest time series. It is one of the most widely used NDVI datasets that can cover the world at present [34]. However, because its data were only updated to 2015, there were no observation records after 2015, and its spatial resolution was low; thus, it was difficult to obtain the latest and high-resolution monitoring results of vegetation change. The 10-day composite SPOT-VGT NDVI data with 1 km resolution are based on the VGT1 and VGT2 sensors carried by the SPOT-4 and SPOT-5 satellites, respectively. Different designs of infrared and near-infrared spectral bands of the two sensors lead to different spectral response functions, causing changes in reflectivity and discontinuity of the NDVI values in the two periods [35]. In comparison, the 16-day composite MODIS NDVI data with 1 km resolution has been widely used in determining global vegetation change due to their higher spatial resolution, updating frequency and lower uncertainty [36]. It has been an ideal time-series dataset for vegetation change monitoring since 2000. Therefore, MODIS NDVI data were selected as the data source to monitor the vegetation change in the Qilian Mountains (QM).
The QM is not only an important ecological functional area in Northwest China but also a source and water supply area of inland rivers, which is of great significance to the existence and evolution of the Hexi Oasis [37,38]. However, because it is located at the junction of the Qinghai-Tibet alpine region and the northwest semi-arid region, the ecological environment is extremely fragile and has been affected by severe climate change [39]. In the QM, many previous studies have been carried out on the evolution of vegetation spatial-temporal patterns, net primary productivity, vegetation dynamics and their response to climate change [40,41,42,43,44]. First, existing studies have used various data sources to analyze the vegetation distribution and change trends in the QM in different periods [40,45,46,47]. These studies have made different progress, but they all take the whole region as the research object, ignoring the influence of large non-vegetation areas such as deserts, Gobi, ice, snow and water bodies on the research results. When analyzing the spatial variation trends pixel by pixel, the changes in these regions will lead to the deviation of the trend and development direction of vegetation variation in the whole region. Second, most previous studies have focused on the analysis of the interannual variation in the annual average or the growing season average of vegetation [38,48,49,50,51], but little attention has been given to the seasonal difference in vegetation variation, and there have been few studies on the seasonal variation characteristics of vegetation in this region. Relevant studies show that there is a certain deviation or one-sidedness in simply selecting vegetation cover changes annually or in a certain season to represent vegetation time series variations, which makes it difficult to fully reflect the difference in vegetation change [52,53,54]. Some studies have shown that seasonal variation in climate is one of the key controlling factors for the formation of seasonal vegetation variation characteristics [3,55]. In addition, most studies focus on the interannual scale when discussing the relationship between vegetation dynamics and climate factors and ignore the impact of climate factors in different seasons on different vegetation growth stages [38,56,57]. Although a few studies considered the seasonal response of vegetation to climate change, they often only focus on the simultaneous impact of climate change on vegetation and do not consider the effect of climate change on vegetation growth in adjacent seasons [58,59,60,61]. In view of the problems and deficiencies in previous studies, this research analyzed the spatial distribution characteristics and spatial-temporal variation of vegetation in the growing season, spring, summer and autumn during the past 21 years, and revealed the seasonal differences and trends of vegetation in the QM. The research results comprehensively revealed the details of the seasonal differences and changing trends of vegetation in the QM. At the same time, the responses and differences between vegetation and climate factors in different seasons were discussed from the seasonal scale.
Based on the above analysis, to better understand the spatiotemporal evolution and stability of vegetation on the seasonal scale, and to reveal the controlling effect of climate change on the seasonal rhythm of vegetation growth, the following objectives were established for this study: (1) analyze the interannual variation trends of NDVI in different seasons; (2) explore the spatiotemporal variation of NDVI in different seasons; (3) conduct a stability assessment of vegetation dynamics in different seasons; and (4) determine the response difference of NDVI to climatic factors on the seasonal scale. Based on the above objectives, we will finally answer the following questions: first, what changes have taken place in the vegetation of the QM on the seasonal scale since 2000? Second, what are the spatial differences in vegetation stability in different seasons over the past 21 years? Third, what is the relationship between climatic factors and vegetation growth in different seasons in this region? The results will put forward a scientific theoretical basis for restoring and protecting vegetation and reasonable measurements in the QM to tackle climate change.

2. Materials and Methods
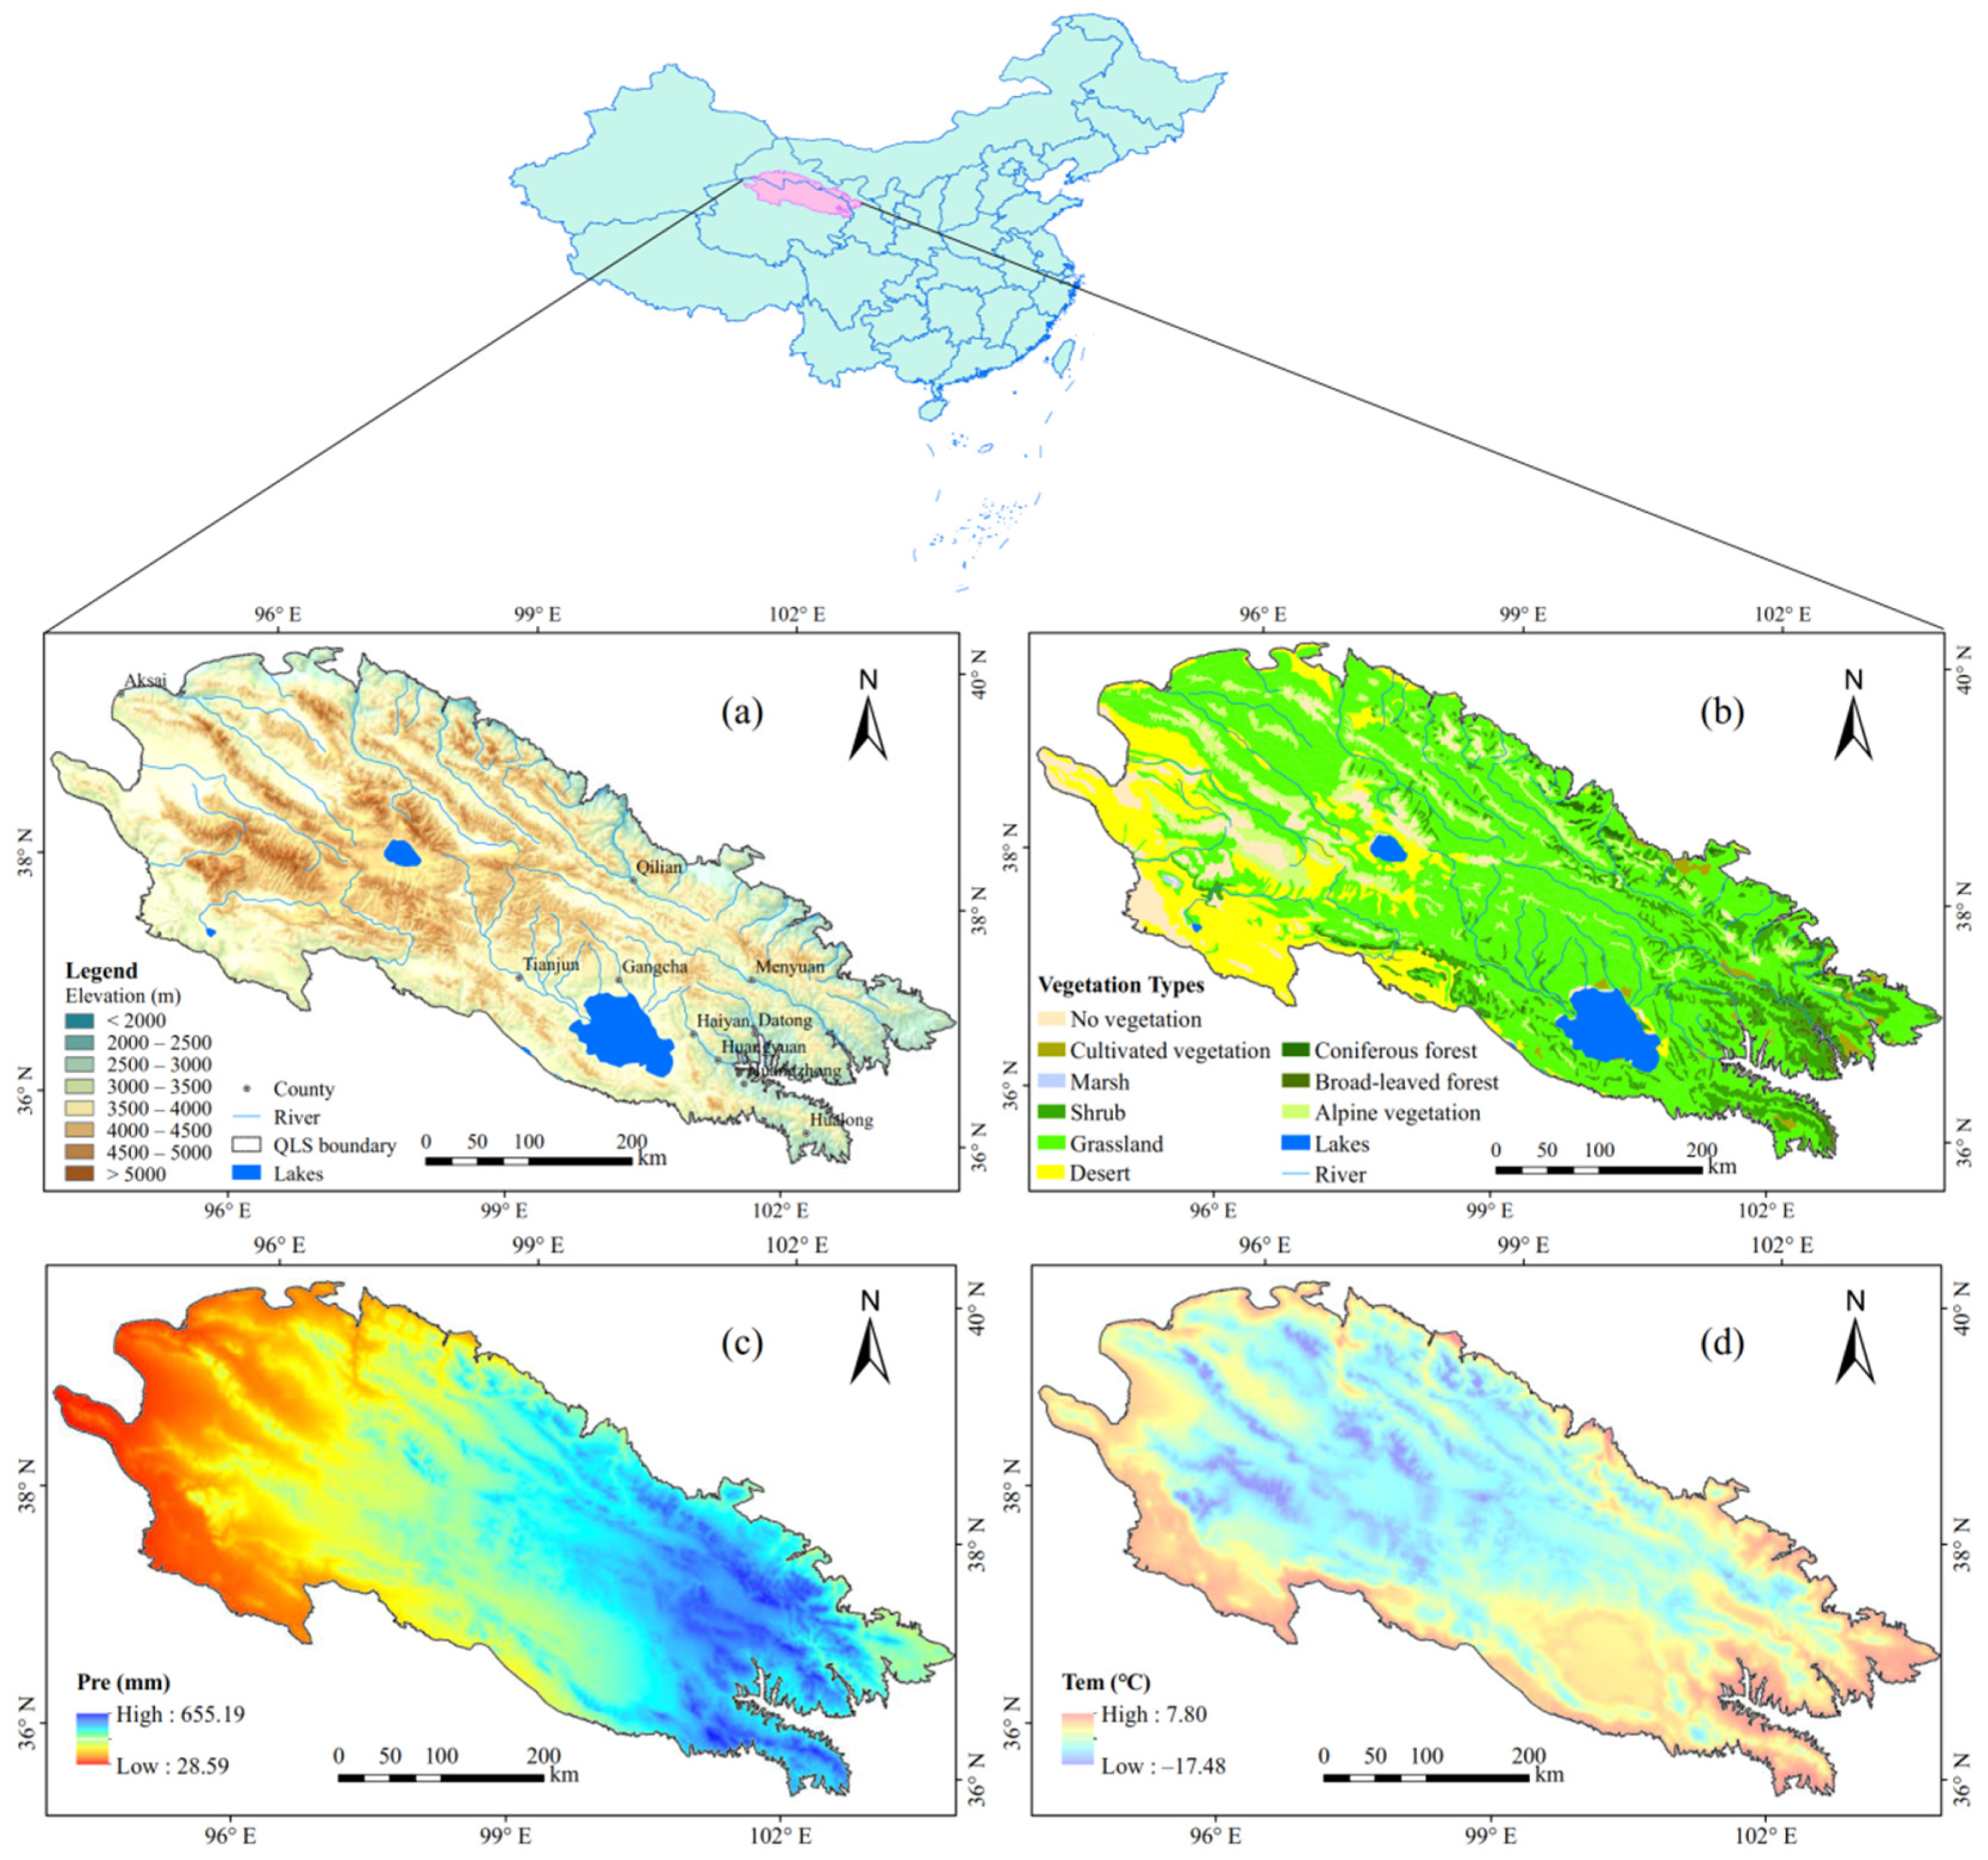
2.1. Study Area

The QM is the functional area of ecological protection and the source of many inland rivers in the Hexi Corridor, known as the “Ice Source Reservoir”. This region is located in the intersection zone of the Qinghai-Tibet Plateau, Mongolia-Xinjiang Plateau and Loess Plateau and crosses the border between western Gansu Province and northeastern Qinghai Province (Figure 1). The QM plays an important role in the division of natural climatic zones in Northwest China [40,62]. The terrain of the QM decreases from northwest to southeast. This area includes a series of northwest to southeast mountains and valleys, most of which are between 3000 and 5000 m (Figure 1a). The climate of this region is a typical alpine continental climate, with complex natural conditions and significant spatial differences in hydrothermal distributions. The precipitation in the QM presented a step-like spatial distribution pattern with more in the east and less in the west, with a varied range of 28.59–655.19 mm (Figure 1c). The annual precipitation was between 400 and 656 mm in the central and eastern regions and between 200 and 400 mm in the central and western regions. Due to the low temperatures throughout the year, approximately 15% of the annual precipitation is in the form of snow. A large number of modern glaciers are distributed in the mountain region above 3500 m. The rivers are mainly supplied by glacier meltwater and mountain precipitation and radiate around the center of the QM. The annual mean temperature ranged from −17.48 °C to 7.80 °C, and the temperature was higher at the edge of the QM but lower in the central and western mountains (Figure 1d). The annual mean temperature in the area above 4000 m was below 0 °C, and the spatial distribution of the annual mean temperature was highly consistent with the topography (altitude) in the study area. Under the combined influence of the southeast monsoon and topography, the hydrothermal conditions are redistributed, which leads to the unique vertical zonal characteristics of vegetation distribution (Figure 1b). From low to high elevations, there are desert steppes, subalpine steppes, forests, subalpine shrub meadows, alpine meadows and sparse alpine meadows [47,63].

2.2. Data Sources and Preprocessing

The MOD13A2 NDVI product was used as the data source in this study, which was obtained from the National Aeronautics and Space Administration (NASA) (https://ladsweb.modaps.eosdis.nasa.gov/search/, accessed on 1 February 2021). The time span of the data in this study is from 2000 to 2020, the time resolution is 16 days, and the spatial resolution is 1 km. According to the temporal resolution, 23 NDVI images can be obtained every year. The Modis Reprojection Tool (MRT) and ArcGIS software were used to preprocess NDVI data through mosaics, projection transformation and image clipping. The projection of the original image was converted from sinusoidal to Albers equal-area conic. To suppress the interference of noise on the accuracy of NDVI data, the Savitzky–Golay (S-G) smoothing filter method was adopted to further denoise and smooth the NDVI images [37]. Removing the residual clouds or other adverse effects in the subpixels can make the data more genuinely reflect the seasonal variation in vegetation. To avoid the influence of non-vegetation areas (desert and insufficient vegetation coverage) on the calculation results of the vegetation change in the whole region, according to relevant studies and the actual situation of the research area [15,64,65], the areas where the multiyear mean value of the growing season NDVI (GSNDVI) was less than 0.1 were defined as the non-vegetation areas for mask removal. On this basis, the NDVI time-series datasets in different seasons were reconstructed to analyze the vegetation change trends and their response to climate in different seasons.
The meteorological data (monthly precipitation and temperature) from 2000 to 2019, with a spatial resolution of 0.0083333° (approximately 1 km), were obtained from the National Earth System Science Data Center (NESSDC) (http://www.geodata.cn/, accessed on 5 January 2021). The accuracy of the dataset has been verified before use [66]. ArcGIS software was used to convert the data format and values, clip and determine the seasonal composition, and resample the original data to 1 km × 1 km. Time series datasets of precipitation and mean temperature in the annual period, growing season and other seasons were created to analyze the spatiotemporal relationship between climatic factors and vegetation change.
Digital elevation model (DEM) data came from the provincial data of the Resource and Environmental Science and Data Center (RESDC) (https://www.resdc.cn/, accessed on 28 July 2020). After collating and splicing, the 90 m DEM data of the QM was generated, and it was mainly used to create the distribution map of the elevation in the study area (Figure 1a).
The vegetation type data were derived from the “Qilian Mountain area vegetation distribution data” of the National Cryosphere Desert Data Center (NCDDC) (http://www.ncdc.ac.cn/portal/, accessed on 16 December 2020). Its format is a polygon shapefile, and the scale is 1:1,000,000. The data include 11 primary vegetation types and 54 secondary vegetation types, reflecting the distribution and zonality of different dominant vegetation communities. In the QM, there are nine primary vegetation types (Figure 1b).

2.3. Methods

2.3.1. Determination of the Growing Season

The characteristics needed for plant phenological recognition should be determined according to the law of time evolution for many years, which can improve the robustness of phenological remote sensing recognition methods [67]. Therefore, based on the NDVI time-series data reconstructed by S-G filtering, the NDVI average values of each DOY were calculated by taking the corresponding NDVI values in all years [68]. The time points corresponding to the maximum and minimum values of change rates represent the start of the growing season and the end of the growing season, respectively, and the length of the time period between them indicates the length of the growing season (Figure 2). Here, the maximum positive and negative change rates of the NDVI corresponded to the 113th and 289th days of the year, respectively. Therefore, we defined the 113th (late April)–289th (mid-October) day as the growing season in this research, and the mean value of the NDVI during this period was defined as the value of the GSNDVI.

2.3.2. Mean Value Method

To more comprehensively investigate the change characteristics of vegetation cover in different periods. The mean value method was adopted to calculate the average NDVI of the annual growing season and each season from 2000 to 2020, and the annual GSNDVI and NDVI of each season were obtained. Their calculation formula is as follows [40]:
NDVI s ¯ = ( i = m n NDVI i j ) / K
where NDVI s ¯ represents the mean NDVI in different seasons. m and n represent the GSNDVI and each season NDVI starting from the mth 16-day to the nth 16-day, respectively. NDVIij denotes the NDVI value of the ith 16-day in the jth year (min, 1 ≤ j ≤ 21). K represents the number of periods of 16-day NDVI in different seasons. In this study, the time spans of different seasons are as follows: growing season (DOY113–DOY289), spring (DOY065–DOY145), summer (DOY161–DOY241) and autumn (DOY257–DOY321).

2.3.3. Trend Analysis Method

The unary linear regression analysis method can better reflect the variation trend of NDVI with time from the pixel scale [69]. Compared with the difference method, this method eliminates the influence of occasional anomaly factors at the end of the study period and more effectively reflects the long-term trend of vegetation cover [70]. This method was adopted to simulate the interannual changing trends of the NDVI in the different seasons from 2000 to 2020. Its formula is [8]:
Θ _ s l o p e = n × i = 1 n i × NDVI i i = 1 n i × i = 1 n NDVI i n × i = 1 n i 2 ( i = 1 n i ) 2
where Θ_slope is the slope of the NDVI trend regression in the different seasons, i represents the corresponding year (1–21), and n is the span of the research period. NDVIi represents the NDVI value in the different seasons for the ith year. Θ_slope > 0 indicates an increasing trend of NDVI in each season during the research period and vice versa. The F test was adopted to evaluate the significance of NDVI trends, and the significance level was set to p < 0.05.

2.3.4. Stability Analysis

The coefficient of variation (CV) is a statistic that measures the degree to which the observed values deviate from the normal [71]. In this study, the CV was adopted to reflect the relative fluctuation of the NDVI during the past 21 years. The higher the value is, the greater the disturbance intensity and the more unstable the vegetation. The smaller the value is, the more stable the vegetation is [72]. Its formula is:
CV = NDVI σ NDVI ¯
where NDVI σ is the standard deviation of the annual NDVI and NDVI ¯ is the average value of the NDVI for multiple years. Based on the relevant research and the actual situation [73,74], the stability of the NDVI variation in the growing season and different seasons was divided into six grades by using the geometric interval classification method (Table 1).

2.3.5. Correlation Analysis Method

By analyzing the correlation between geographical elements, we can accurately explain the closeness of their relationship [75]. This study analyzed the spatial correlation between the NDVI and climatic factors in different seasons based on the correlational analysis method. Its formula is [76,77]:
R = i = 1 n [ ( X i X ¯ ) ( Y i Y ¯ ) ] i = 1 n ( X i X ¯ ) 2 i = 1 n ( Y i Y ¯ ) 2
where R represents the correlation coefficient between NDVI and climatic factors, which ranges from −1 to 1; n is the total number of years; Xi and Yi represent the NDVI and climatic factors of year i, respectively; and X ¯ and Y ¯ are the average values of Xi and Yi during the research period, respectively. R > 0 means that the correlation is positive and vice versa. The significance level (p < 0.05) of R was determined by a t test.

3. Results

3.1. Spatial Distribution and Interannual Variation of the NDVI in Different Seasons

According to the statistics of the multiyear average NDVI in different seasons from 2000 to 2020, the spatial patterns of vegetation cover in different seasons were obtained in the QM (Figure 3). As seen from the figure, the distribution of vegetation had noticeable spatial differences; that is, the vegetation cover in the east was obviously better than that in the west. The total area of vegetation cover in the QM was 14.48 × 10⁴ km2, accounting for 74.59% of the study area. Viewed from the spatial distribution of the GSNDVI (Figure 3a), the high vegetation cover region (GSNDVI > 0.5) was concentrated in the eastern mountainous area, which is mainly covered by forest, temperate and typical steppe. The vegetation coverage in the central region was slightly lower than that in the east, and the GSNDVI was mainly between 0.3 and 0.5. The vegetation types are mainly alpine vegetation and typical steppe. The vegetation cover in the western region was relatively low; the GSNDVI was mainly between 0.1 and 0.2, which is the transition zone from grassland to desert, and the vegetation types were mainly alpine steppe and alpine desert. Most of the western part of the QM is mainly unused land, such as deserts, bare rock and glaciers, and their NDVI values were all less than 0.1 in the growing season. Therefore, these regions were masked as no vegetation areas in this study. Viewed from the spatial distribution of the NDVI in each season (Figure 3a–d), the NDVI value in most areas of the QM was below 0.3 in spring, which was lower than the values of the other seasons. The NDVI value in summer was higher than that in the whole growing season, which was the most vigorous stage of vegetation growth in the QM. The NDVI value of autumn was between spring and summer, but the overall distribution of vegetation was similar to that in spring. Thus, the variation range and distribution of NDVI varied greatly in different seasons. The eastern part of the QM had more precipitation due to the southeast monsoon, while the precipitation in the central and western parts was lower, mainly due to the influence of the dry airflow from the northwest. This is the main reason why the vegetation coverage in the eastern part of the QM is higher than that in the western part.
Through the comparative analysis of the interannual variation trend and seasonal difference in vegetation growth in the last 21 years (Figure 4), we found that the vegetation increased significantly (p < 0.01) in each season, in which the growth rate of the NDVI in summer was the fastest (0.032/10yr), and the minimum (0.334), maximum (0.426) and annual mean value (0.387) of NDVI were higher than those in the other seasons. The growth rate of the NDVI in spring was the lowest (0.015/10yr), and the minimum (0.149), maximum (0.194) and annual mean values (0.167) of the NDVI were all lower than those of the other seasons. The main reason for this result is that the study area is located at a high altitude, the temperature is lower in spring, and the vegetation returns to green later. Affected by the low temperature, the fluctuation range of vegetation was small, and its value was lower than that of other seasons. The study found that the interannual fluctuation trend of the NDVI in summer was similar to that in the growing season, while the trend in autumn was different from that in the growing season and other seasons. The maximum value of the NDVI in the other seasons occurred in 2018 except in autumn. This result indicates that the contribution of vegetation to the growing season in summer was significantly higher than that in autumn. In addition, by comparing the fluctuation range of the NDVI trend line in different seasons, it was found that the fluctuation range of the NDVI in autumn was the largest, indicating that the vegetation cover in autumn was the most unstable.

3.2. Spatiotemporal Variation of the NDVI in the QM from 2000 to 2020

Although the interannual and seasonal NDVI showed an increasing trend from 2000 to 2020 in the QM, the dynamic change in the NDVI was significantly different in terms of its spatial distribution. Therefore, it was necessary to simulate and evaluate the spatial dynamic trend of the NDVI based on the changing trend of the interannual and seasonal NDVI on the time scale.

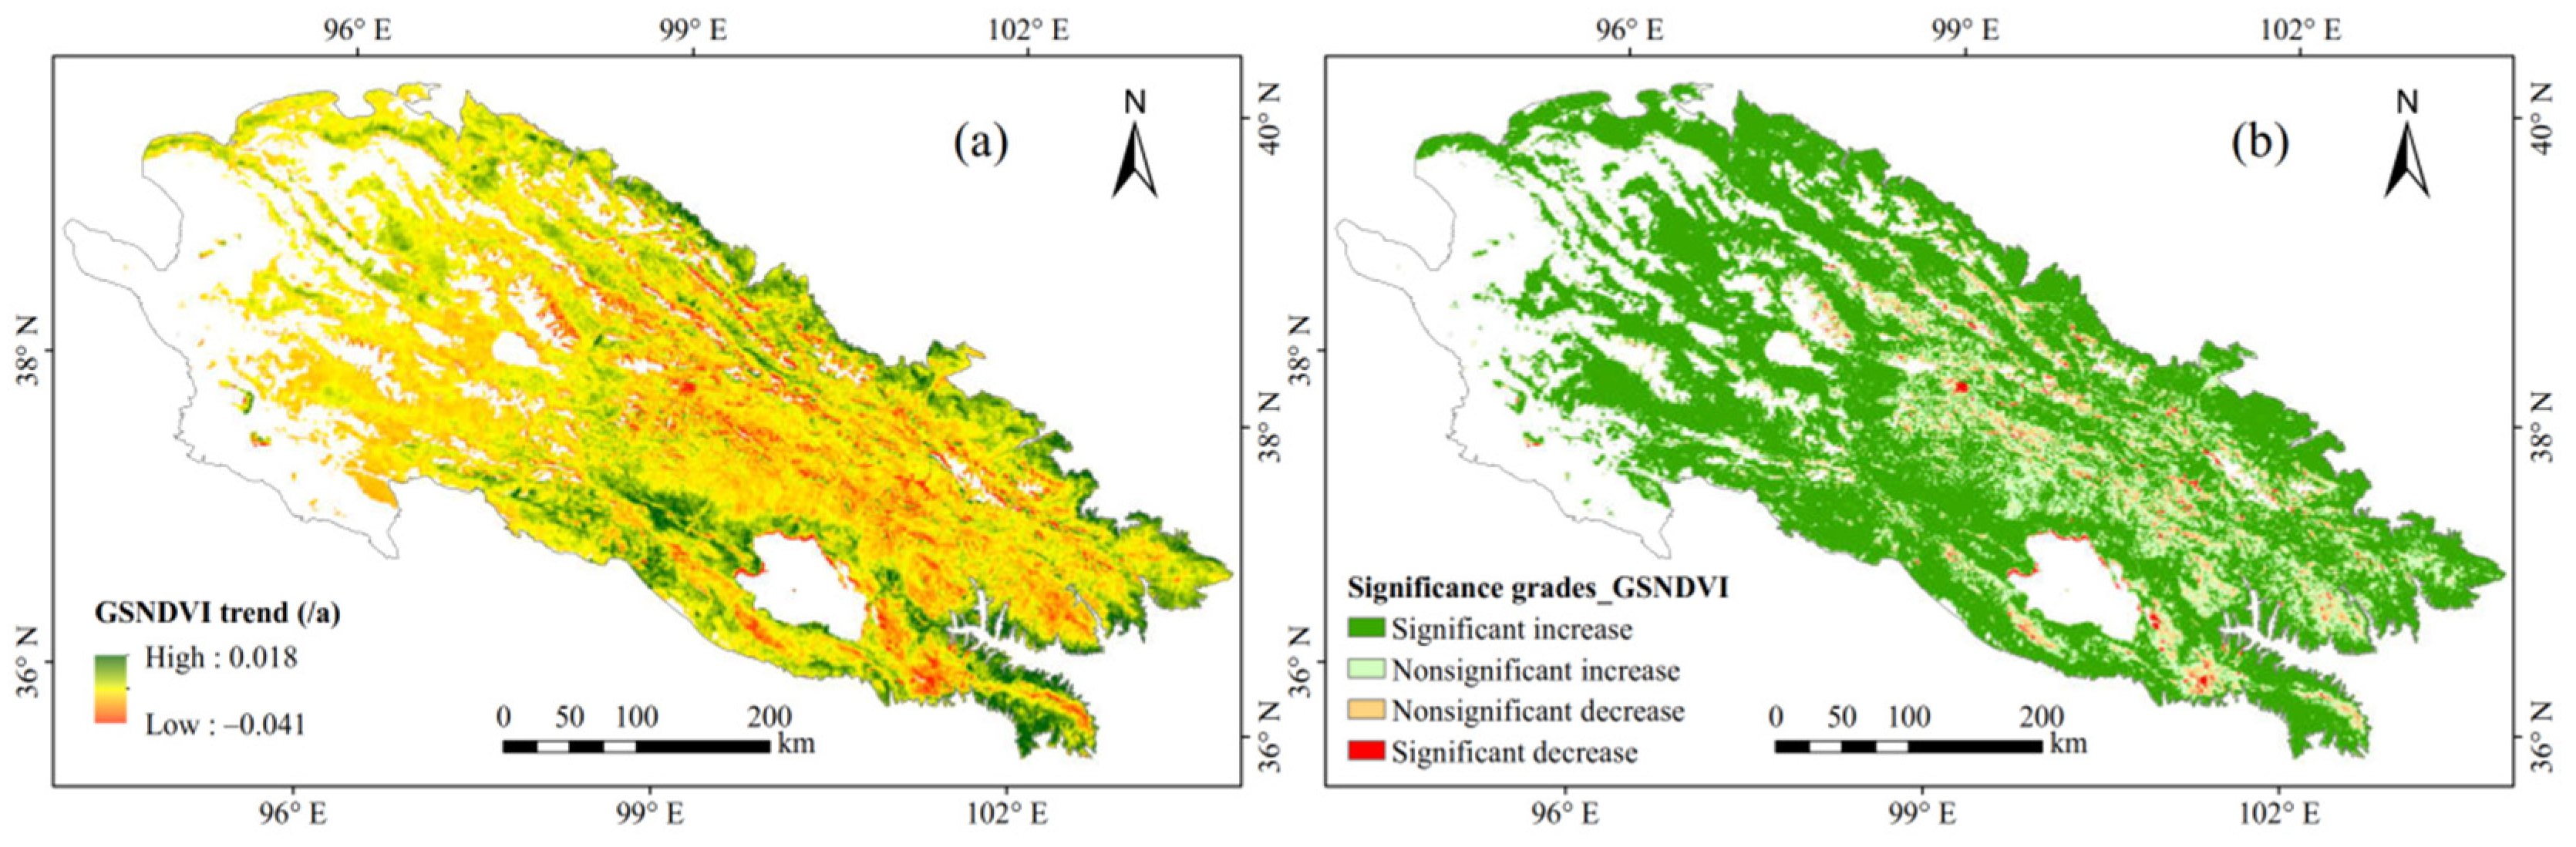
3.2.1. Spatiotemporal Variation Trend of the GSNDVI and Its Significance

The spatial variation trend of the vegetation GSNDVI was fitted by the trend analysis method in the QM from 2000 to 2020. As seen from the spatial distribution map and statistical results of the GSNDVI variation trend (Figure 5, Table 2), the overall vegetation in the QM showed an upward trend in the past 21 years, and the increased area accounted for 93.27% of the total vegetation cover region (TVCR), which was much larger than that of the vegetation reduction area. The area showing a significant increase (p < 0.05) in vegetation accounted for 75.06% of the TVCR, which was mainly distributed in the western and marginal areas of the central-eastern regions of the QM. The area of vegetation reduction accounted for 6.72% of the TVCR and was mainly concentrated in the central part of the QM and the surrounding area of Qinghai Lake, in which the significantly reduced (p < 0.05) vegetation area accounted for only 0.7% of the TVCR, dispersed in northern Guide County, northeastern Gonghe County and northeastern Tianjun County. In conclusion, the vegetation cover in most regions of the QM improved significantly from 2000 to 2020, only a few regions had vegetation degradation, and the significantly improved areas were much larger than the degraded areas.

3.2.2. Spatiotemporal Variation Trends of the NDVI in Different Seasons and Their Significance

In addition to discussing the spatial variation trend of the GSNDVI, this study also compared the spatial variation trends of the vegetation NDVI in different seasons. It can be seen from the distribution map that their trends had some similarities (Figure 6a–c), but the NDVI change rates in different seasons had obvious differences in spatial distribution. According to the change trends and significance grades (Figure 6a–f, Table 3), there were significant (p < 0.05) degradation areas in the central QM in spring, which were mainly distributed in northwestern Gangcha County, northern Tianjun County and southwestern Qilian County. The significant degradation area accounted for 1.57% of the TVCR, which was larger than that in the growing season (0.70%), summer (0.72%) and autumn (0.61%). The spatial distribution of the vegetation change trend and significance in summer was consistent with that in the growing season. The area of vegetation increased significantly (p < 0.05) in autumn, accounting for 44.17% of the TVCR, which was significantly smaller than that in spring (62.95%) and summer (72.74%). This region mainly included the southeastern and northwestern marginal zones of the QM, while the change was not obvious in most of the central regions. The vegetation degradation area in autumn was mainly distributed in northern Qinghai Lake, and the significant (p < 0.05) degradation area was distributed primarily in southwestern Menyuan Hui Autonomous County, which is a famous rape and highland barley planting base, as well as a tourist scenic area, so it was disturbed by human activities. The above analysis concluded that the area of vegetation degradation in spring was the widest, the changing trend of vegetation in summer was essentially consistent with that in the growing season, and the area of vegetation with a significant increasing trend in autumn was the smallest.

3.3. Stability of the Vegetation in Different Seasons from 2000 to 2020

The coefficient of variation method was used to calculate the CV of NDVI in the growing season and other seasons to reflect the stability of vegetation in the QM. According to the statistical results of CV classification in different seasons (Table 1), the proportions of stable vegetation regions in the growing season, spring, summer and autumn were 76.27%, 60.76%, 68.68% and 46.37%, respectively. Among the stability grades in different seasons, the proportion of low stable areas was the highest. The stable area in autumn was the smallest, and more than half of the total area was unstable. This result indicated that the fluctuation of vegetation in autumn was the largest, and the stability was also the lowest, followed by that in spring. This conclusion is consistent with that obtained from Figure 4d in Section 3.2: the proportion of highly stable regions was the smallest, and the stable regions were mainly moderate and low stability. Based on the statistical results of the unstable regions (Table 1), the proportions of moderately and highly unstable regions in autumn were 12.70% and 23.10%, respectively, which were much higher than those in other seasons, followed by those in spring. The proportions of moderate and highly unstable areas in the growing season were the smallest, indicating that the vegetation stability was the highest in the growing season. This scenario was also the main reason why we used the GSNDVI to reflect the interannual variation in vegetation in this study. According to the results of vegetation stability in each season, we found that the vegetation is relatively stable in the growing season and summer, but unstable in spring and autumn.
From the spatial distribution map of the NDVI variation coefficient and stability grades in the QM (Figure S1 and Figure 7), the vegetation variability was smaller in the eastern region and larger in the western region, and the vegetation stability in spring and autumn was lower than that in the growing season and summer. The vegetation stability in summer was basically consistent with that in the growing season. The moderate and highly stable regions were mainly distributed in the high vegetation cover regions in the eastern QM, and the moderate and highly unstable regions were sporadically distributed in the low vegetation cover areas that transition from grassland to desert in the northwest. In addition, the stability of the southern margin and northeastern corner of the QM was relatively low. The unstable area in autumn was significantly larger than that in spring, especially in the highly unstable areas. The moderate and highly unstable areas were mainly the low vegetation cover areas in the middle and western parts and most of the slope areas below the snow line in the northern part of Qinghai Lake. The moderate and highly stable areas were primarily located in eastern QM and the surrounding area of Qinghai Lake. Based on the spatial distribution and statistical results of vegetation stability in different seasons (Figure 7, Table 1), it was concluded that the order of vegetation stability was the growing season > summer > spring > autumn, and the sensitivity of vegetation in autumn and spring was the highest. Therefore, attention should be given to the changes in vegetation in spring and autumn in the QM.

3.4. Interannual and Seasonal Responses of NDVI to Climate Change

3.4.1. Interannual and Seasonal Variations in Climatic Factors

According to the variation trends of precipitation and temperature in the interannual period, the growing season and other seasons were discussed in terms of the vegetation-covered region of the QM. As shown in Figure 8a, the annual precipitation showed a significant (p < 0.05) upward trend from 2000 to 2019; the upward trend was not obvious from 2000 to 2012 but showed a sharp upward (p < 0.01) trend from 2013 to 2019. This result was generally consistent with the changing trend of the vegetation. The annual mean temperature showed a slow upward trend, but the changing trend was not obvious, with a slight fluctuation from 2000 to 2005 and a significant fluctuation from 2006 to 2019 (Figure 8f). Viewed from the variation trends of precipitation in different seasons (Figure 8a–e), the trends in the annual, growing season and summer showed significant (p < 0.05) upward trends overall, and their fluctuation trends were similar. However, the changing trend of precipitation in spring was not significant. Contrary to other seasons, autumn had a downward trend in precipitation, but the trend was not significant. Viewed from the variation trends of temperature in different seasons (Figure 8f–j), the spring temperature increased significantly (p = 0.05) and at the fastest increasing rate (slope = 0.040). The fluctuation trend was generally consistent with that of the NDVI in spring, indicating that the spring vegetation may be obviously affected by the spring temperature. The average interannual temperature, growing season, summer and autumn temperatures all showed an upward trend, but the trends were not significant. The variation trend of the summer temperature was very flat (Figure 8i). The NDVI and precipitation analysis results showed that both vegetation and precipitation increased significantly in summer. Combined with Figure 4c, it is found that the fluctuation shape of NDVI was similar to that of summer precipitation, so it can be speculated that the increase in vegetation may be related to precipitation in summer.

3.4.2. Correlation between the GSNDVI and Climatic Factors Interannually and in the Growing Season

According to the correlation distribution map (Figure 9), the distributions of the correlation between the GSNDVI and annual precipitation and growing season precipitation were generally consistent (Figure 9a,c). Their positive correlation areas were much larger than the negative correlation areas; the significant positive correlation (p < 0.05) areas accounted for 58.87% and 60.67% of the TVCR, respectively, which were primarily distributed in the central and western QM, around Qinghai Lake and northeast of Wushaoling (Figure 9 and Figure S2). The vegetation cover types in these regions were mainly steppe and desert steppe, with high temperatures and intense evaporation in the growing season, so precipitation was the dominant climatic factor controlling vegetation growth in these regions and had a strong correlation with the GSNDVI. The area with a negative correlation between the GSNDVI and annual precipitation and growing season precipitation was small, accounting for only 8.41% and 7.39% of the TVCR, respectively. Their significant negative correlation areas were less than 0.5%. They were mainly sporadically distributed in the eastern agricultural and pastoral areas (Figure 9 and Figure S2). These areas were affected by human activities, and the farmland was supplied primarily by rivers, which were less dependent on precipitation. The correlation between the GSNDVI and annual mean temperature and growing season temperature was mainly positive (Figure 9b,d). The area where the GSNDVI was significantly and positively correlated (p < 0.05) with the growing season temperature was greater than the annual mean temperature; their significant positive correlation areas accounted for 14.42% and 5.84% of the TVCR, respectively (Figure S2), while the other regions were not significantly affected by temperature. It can be concluded that the response of the GSNDVI to growing season temperature was more sensitive than to the annual mean temperature; that is, the GSNDVI was more closely related to concurrent temperature than to annual mean temperature.

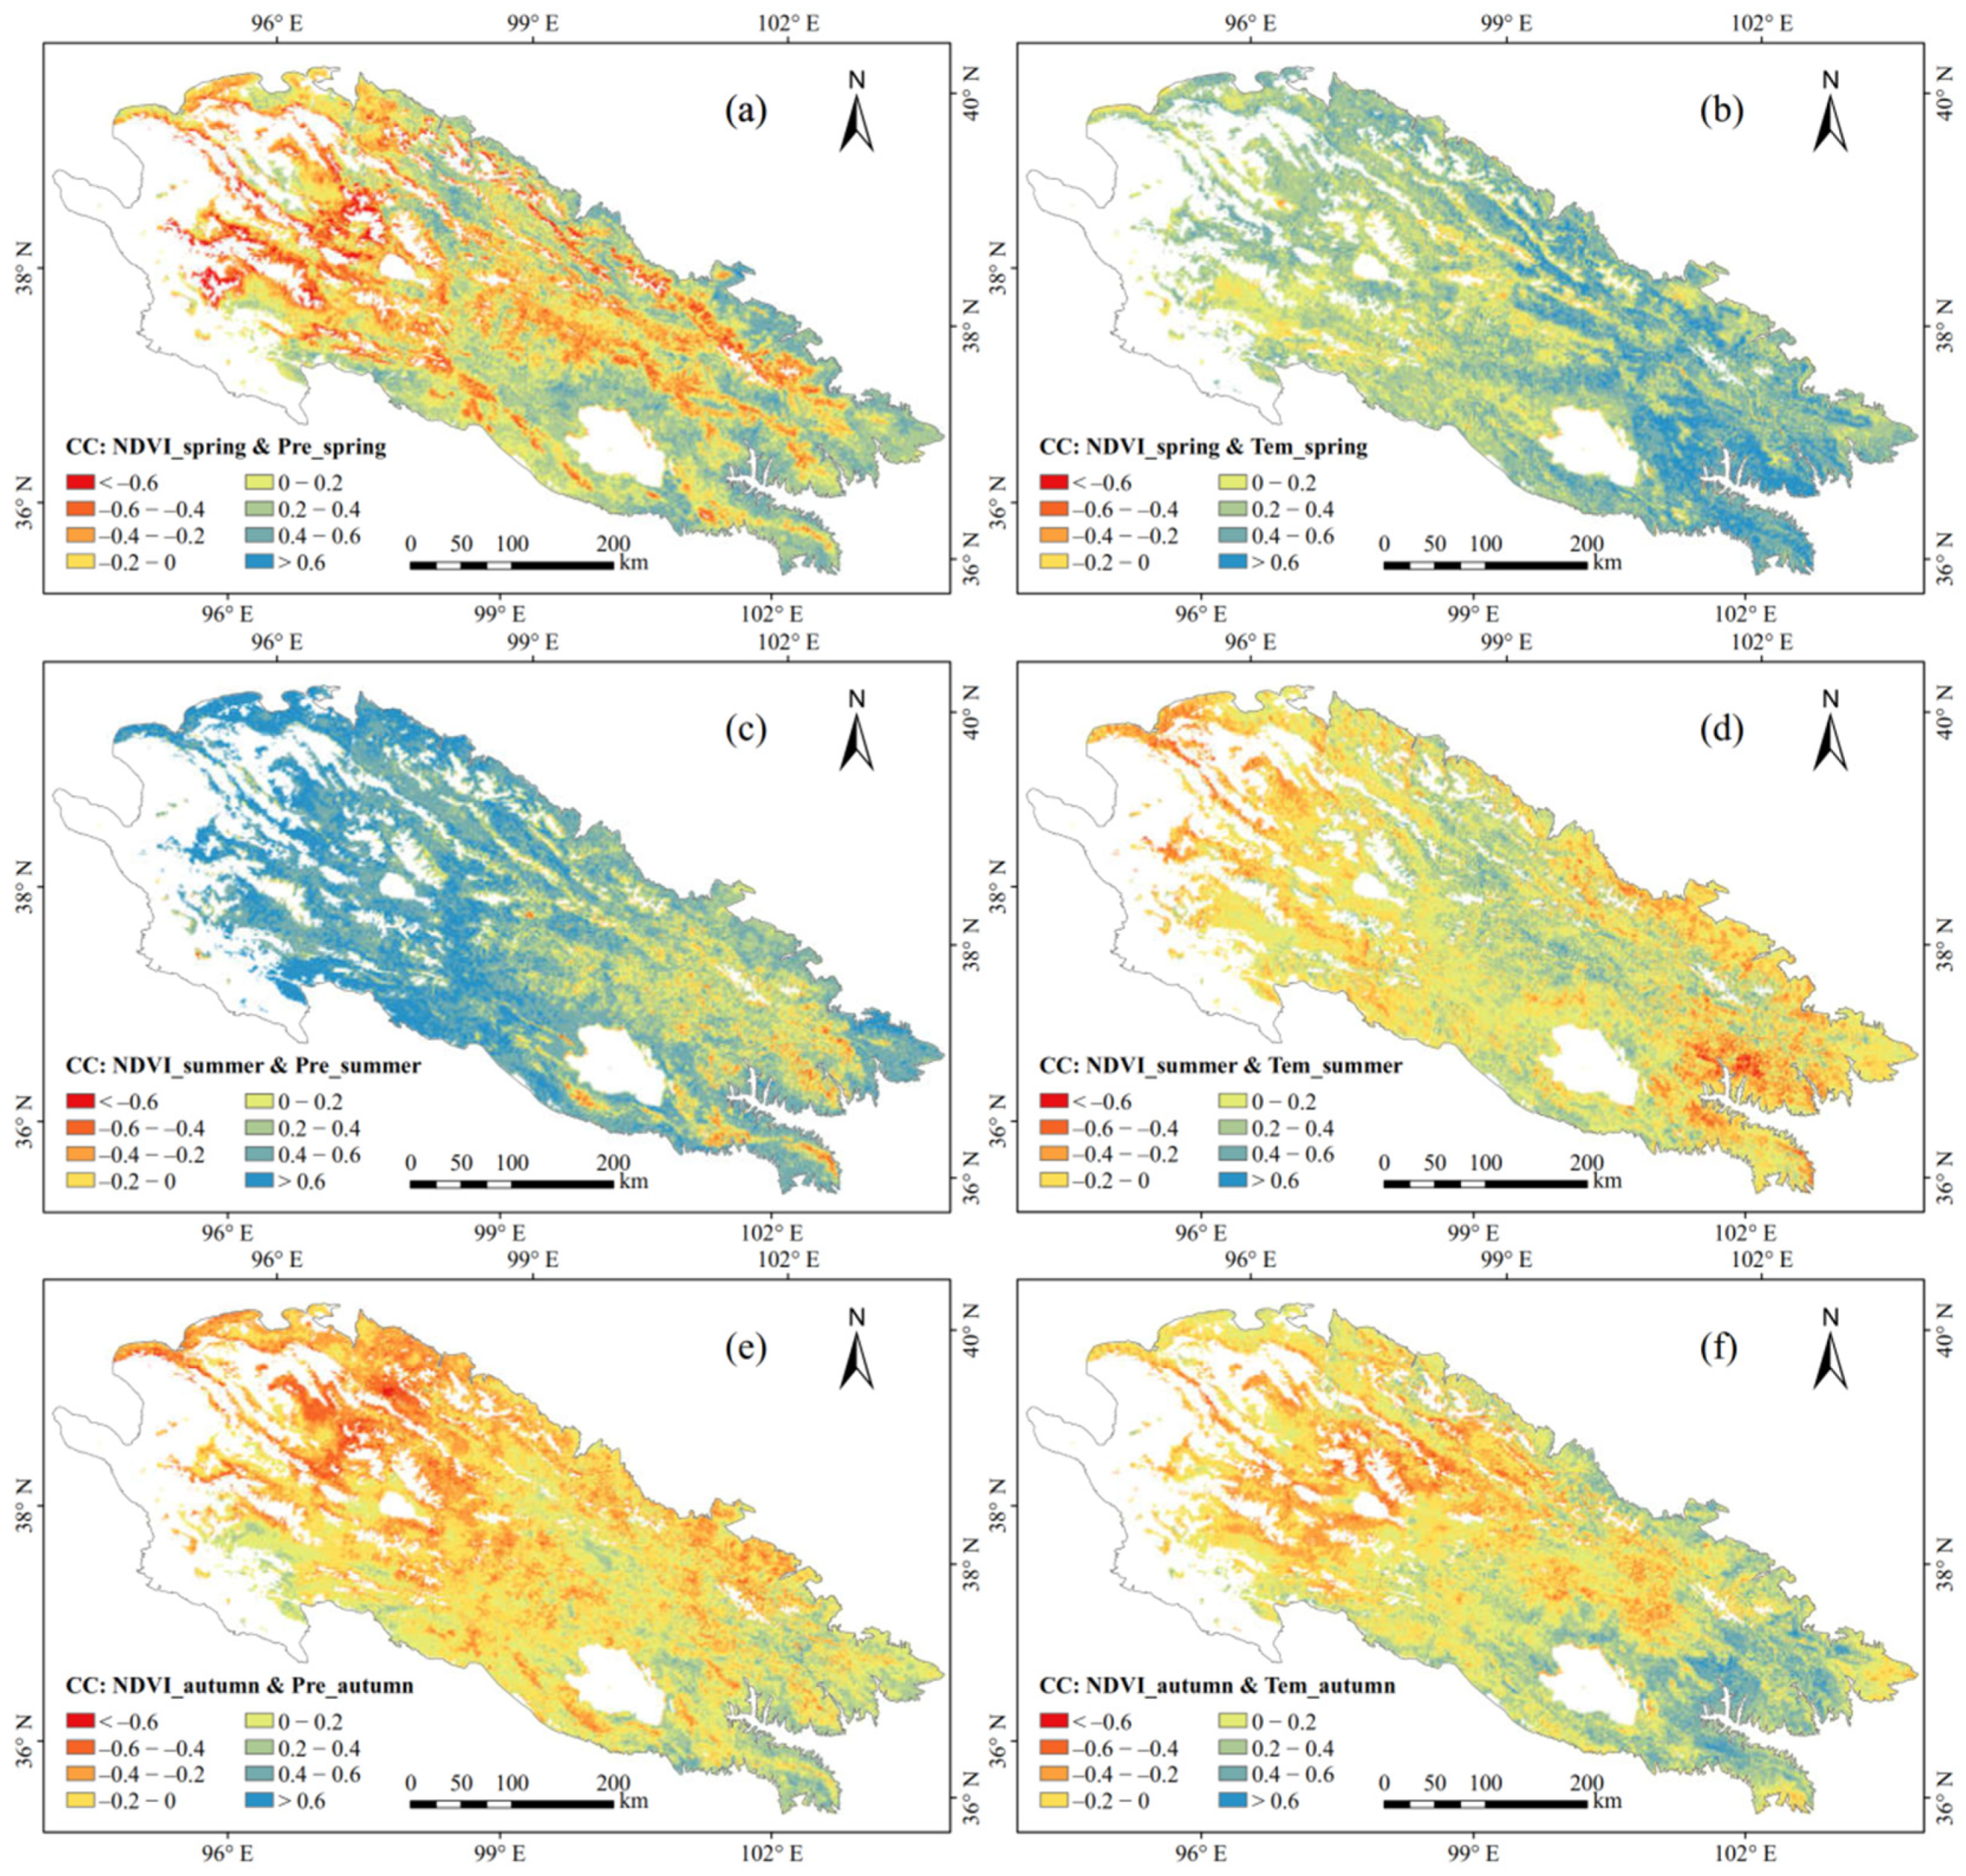
3.4.3. Spatial Response of the Seasonal NDVI to Seasonal Climatic Factors

To explore the differences in the relationship between vegetation and climate change in different seasons, the correlation coefficients between the NDVI and its corresponding climatic factors were calculated in each season (Figure 10). From the spatial distribution of the correlation coefficients in different seasons, it can be seen that the response of the NDVI to climate change has significant seasonal differences in space. In spring, NDVI was significantly (p < 0.05) and positively correlated with precipitation in 7.18% of the TVCR, which was primarily distributed in the surrounding area of Xining, east of Gonghe County and the junction of Shandan County, Yongchang County and Sunan Yugur Autonomous County in the north (Figure 10 and Figure S3). NDVI was significantly (p < 0.05) and negatively correlated with precipitation in 7.38% of the TVCR, which was mainly distributed in the western part of the study area and the Lenglongling region (Figure 10 and Figure S3). Under the control of low temperature, vegetation in these regions returned to green relatively late. The area where NDVI was significantly and negatively correlated with precipitation may be caused by the time lag effect of the NDVI response to precipitation. The correlation between the spring NDVI and spring temperature was the highest during the year, and the significant positive correlation (p < 0.05) areas were mainly concentrated in most parts of the central and eastern regions, accounting for 29.47% of the TVCR (Figure 10 and Figure S3).
The correlation between the NDVI and precipitation in summer was the highest during the year, and the proportion of significantly (p < 0.05) and positively correlated areas was 56.53%, which was primarily distributed in the central and western regions of the QM and Wushaoling (Figure 10 and Figure S3). These areas belong to arid and semi-arid regions, and the main vegetation cover types are desert steppe and alpine grassland. Under the condition of no significant change in temperature, precipitation becomes the dominant factor controlling vegetation growth. The correlation between the NDVI and temperature in summer was not obvious overall, but the NDVI in summer was negatively correlated with precipitation in some parts of the northwest (Figure 10 and Figure S3). From the previous analysis, the overall vegetation still increased despite the autumn precipitation decreasing slightly, which was closely related to the implementation of environmental protection projects in the QM. The NDVI in autumn was significantly and positively correlated with the autumn temperatures only in the eastern region of the Laji Mountains and Datong River Valley (Figure S3), indicating that the increasing temperature in these regions has a certain promotional effect on vegetation growth in autumn.

3.4.4. Time Lag Effect of the NDVI Response to Climatic Factors in Different Seasons

This study not only analyzed the correlation between NDVI and corresponding climatic factors pixel by pixel, but also conducted a statistical analysis on the correlation between seasonal NDVI and climatic factors in adjacent seasons, and discussed the time lag effect of NDVI on the seasonal response of climatic factors (Table 4). The results indicated that there was a significant correlation (p < 0.01) between the GSNDVI and summer precipitation, with a correlation coefficient as high as 0.662, followed by spring, with a correlation coefficient of 0.440 (p = 0.05). By comparing the correlation between the GSNDVI and temperature in each season, it was found that the GSNDVI had the highest correlation with spring temperature with a correlation coefficient of 0.411, but it did not pass the significance test, indicating that the GSNDVI was primarily affected by summer precipitation. The spring NDVI had little relationship with spring precipitation but had a significant (p < 0.01) correlation with spring temperature, and the correlation coefficient was as high as 0.704, indicating that the growth of vegetation in spring was susceptible to temperature variations. The summer NDVI had a strong correlation with both summer and spring precipitation, and their correlation coefficients were 0.658 (p < 0.01) and 0.491 (p < 0.05), respectively, indicating that vegetation variation in summer was not only affected by precipitation in the same period but also had a significant time lag relationship with spring precipitation. The increased rainfall in spring and summer promoted the growth of vegetation in summer, especially in the arid and semi-arid desert and desert steppe in the central and western regions, where the growth of vegetation was directly limited by precipitation. The summer NDVI was not significantly correlated with either spring or summer temperatures, indicating that the NDVI was primarily affected by precipitation in summer. The correlations between the autumn NDVI and summer precipitation and temperature were higher than those in spring and autumn, indicating that the response of autumn vegetation variation to summer precipitation and temperature had a certain time lag effect. Although the vegetation variation in autumn was influenced by summer precipitation and temperature to some extent, the effect was not significant.

4. Discussion

4.1. The Difference in Fluctuation in the Changing Trend of the NDVI

The results of this study showed that the vegetation in the QM has increased as a whole since 2000, and the improved area of vegetation is much larger than the degraded area, which is consistent with previous studies [40,61,78,79,80], even though they adopted different data sources and research methods. However, the range of interannual NDVI fluctuation was quite different in various studies. In our research, the GSNDVI was used to represent the interannual variation in vegetation, and the fluctuation range of the NDVI was mainly between 0.27 and 0.35 (Figure 4a). Dai et al. [49] analyzed the spatiotemporal variation of vegetation in the QM from 1999 to 2007 by using the annual average NDVI. The results showed that the vegetation had an increasing trend since 1999, and the fluctuation range of the annual average NDVI was mainly distributed at approximately 0.15. The main reason for the difference in NDVI fluctuation ranges is that the non-vegetation region was not masked in Dai’s study, which leads to the low annual average NDVI value. Even in the eastern region with high vegetation cover, the NDVI fluctuates only from 0.25 to 0.3. Xu et al. [60] used the annual maximum NDVI to study the spatiotemporal changes of vegetation and its influencing factors in the QM from 2000 to 2010. The results showed that the annual maximum NDVI increased at a rate of 0.024/10yr, and the fluctuation of NDVI ranged from 0.48 to 0.57, which was closest to the results of our study (0.026/10yr). However, in Xu’s study, the fluctuation range of the interannual NDVI was significantly larger than that of Dai and our results. This was mainly because Xu’s research not only masked the non-vegetation region but also adopted the annual maximum NDVI. Even in the western desert steppe, the NDVI ranged from 0.3 to 0.4. The disadvantage of this method is that it is likely to be disturbed by extreme months in calculating the maximum NDVI, thus inflating the result. Therefore, it is necessary not only to remove the influence of non-vegetation areas to avoid low results but also to avoid high results caused by extreme values. Based on the results of our study, we suggest that it is more reasonable to remove non-vegetation areas and use the average NDVI in the growing season to monitor the spatiotemporal change in vegetation.
One of the most obvious differences between our study and previous studies is the definition of the growing season. A large number of studies have defined May–September as the growing season [40,48,81,82], and others have used April to October as the growing season [44,59,83]. Most studies in the QM used May to September as the growing season [56,58,79,84]. These studies all defined the growing season on a monthly scale. Meanwhile, some studies used the methods of remote sensing phenology to conduct more detailed research on the growing season and refine the beginning and end of the growing season to the scale of days [85,86,87]. However, because it is difficult to obtain NDVI and its corresponding climate grid data covering the whole region on the day scale, few studies use NDVI daily data to synthesize the GSNDVI and seasonal NDVI based on the phenological calculation results. Therefore, based on remote sensing products, this study took 16 days as the starting point combined with the phenological calculation method to determine the growing season based on the 16-day time scale. The length of the growing season is also the main reason for the different fluctuation ranges and variation trends of the GSNDVI. In addition, based on 16-day NDVI data, this paper also determined the time span of other seasons which is the first attempt in this region.

4.2. Differences in the Seasonal Response of the NDVI to Climate Factors

There are few seasonal studies on vegetation change and its response to climatic factors in this region, and there are still differences between them. Wu et al. [88] showed that the area of vegetation improvement in the QM in summer was the largest in the last 13 years, which was consistent with the results of our study. This study indicated that the improvement rate of vegetation in spring was the most obvious, which was inconsistent with our results. There may be two reasons: first, the different monitoring periods lead to the difference in the interannual change rate of NDVI. The second possibility is that the study did not mask the non-vegetation area. Song et al. [89] found that the vegetation improved significantly in all seasons except spring, especially in summer, and the NDVI in the growing season and summer was significantly correlated with precipitation. Our research was consistent with this conclusion. Qiu et al. [61] and Wu et al. [88] carried out detailed studies on vegetation changes and their influencing factors in this region. They discussed the correlation between NDVI and climatic factors in different seasons. Through comparative analysis with our research, it is found that the spatial distributions of the correlation between seasonal NDVI and concurrent climatic factors are basically consistent in other seasons except autumn. Different from our research, these two studies only analyzed the simultaneous response of seasonal NDVI and climatic factors but did not consider the relationship with other seasonal climatic factors and lacked a comparison with the growing season. Based on the problems existing in previous studies, we specifically discussed the seasonal response of vegetation change to climatic factors.

4.3. Limitations of the Study

Vegetation growth is affected by many factors, including not only precipitation and temperature but also humidity, solar radiation, altitude, soil, hydrology, human activities and other factors. Considering the importance of impact factors and the availability of data, this study only selected the two most critical climatic factors (temperature and precipitation) for related research, focusing on the response of vegetation change to the two main control factors. In addition, because the focus of this study is to explore vegetation dynamics and their response to climate change on a seasonal scale, their response and time lag effect to climate change on monthly and 16-day scales were not considered.

5. Conclusions

Combined with remote sensing and climate reanalysis data, this study investigated the spatial distribution, variation trend and stability characteristics of vegetation in the QM from multiple time scales and revealed the seasonal responses of vegetation to climatic factors. The main conclusions are as follows:
(1) The vegetation cover in the east was noticeably higher than that in the west. The interannual and seasonal variations in NDVI showed an increasing trend in the QM from 2000 to 2020. The significantly improved areas were much larger than the degraded areas. The growth rate of NDVI was the fastest in summer (0.032/10yr) and the slowest in spring (0.015/10yr). Vegetation in summer had the most prominent contribution to the vegetation variation in the growing season, while vegetation in autumn had little contribution. The decreasing range of vegetation greenness was the widest in spring.
(2) The vegetation was relatively stable in the growing season and summer but unstable in spring and autumn. The stable area was mainly distributed in the eastern high vegetation cover area. The unstable area was mainly distributed in the low vegetation cover area that forms the transition from grassland to desert in the northwest.
(3) The vegetation response to climatic factors has significant spatiotemporal heterogeneity. The effect of precipitation on vegetation was more significant in arid and semi-arid regions of the central and western parts. The spring NDVI was obviously affected by spring temperatures (p < 0.01), while the growing season and summer NDVI were most closely related to summer precipitation (p < 0.01) and were also affected by the lag in spring precipitation (p < 0.05). This result indicates that the climatic factors affecting vegetation change were also different in different seasons.

Supplementary Materials

The following supporting information can be downloaded at: https://www.mdpi.com/article/10.3390/su14094926/s1, Figure S1: Coefficients of variation of the NDVI in the different seasons in the Qilian Mountains during 2000–2020, Figure S2: Spatial distribution of the significance grades of correlation coefficient between the GSNDVI and climatic factors in the interannual and growing season from 2000 to 2019, Figure S3: Spatial distribution of the significance grades of correlation coefficient between the seasonal NDVI and corresponding climatic factors from 2000 to 2019.

Author Contributions

Conceptualization, H.D.; Methodology, H.D. and W.K.; Software, J.Z.; Validation, H.D. and X.J.; Formal analysis, H.D.; Investigation, H.D. and X.J.; Resources, W.K.; Writing –original draft, H.D.; writing—review and editing, Y.Q. and W.K.; Visualization, H.D.; Supervision, Y.Q.; Project administration, H.W.; Funding acquisition, Y.Q. All authors have read and agreed to the published version of the manuscript.

Funding

This research was funded by the Strategic Priority Research Program of the Chinese Academy of Sciences, grant number XDA20100101; the Second Tibetan Plateau Scientific Expedition and Research Program, grant number 2019QZKK0305; and the National Key Research and Development Program of China, grant number 2019YFC0507405.

Institutional Review Board Statement

Not applicable.

Informed Consent Statement

Not applicable.

Data Availability Statement

The data presented in this study are available from the corresponding author upon reasonable request.

Acknowledgments

The authors thank the relevant data platforms described in this paper for providing free data sources for this study, and also thank editors and anonymous reviewers for their valuable comments on the manuscript.

Conflicts of Interest

The authors declare no conflict of interest.

References

  1. Du, J.M.; Bao, G.; Tong, S.Q.; Huang, X.J.; Wendurina; Meili; Bao, Y.H. Variations in vegetation cover and its relationship with climate change and human activities in Mongolia during the period 1982–2015. Acta Prataculturae Sin. 2021, 30, 1–13. [Google Scholar]
  2. Zhou, W.; Gang, C.C.; Chen, Y.Z.; Mu, S.J.; Sun, Z.G.; Li, J.L. Grassland coverage inter-annual variation and its coupling relation with hydrothermal factors in China during 1982–2010. J. Geogr. Sci 2014, 24, 593–611. [Google Scholar] [CrossRef] [Green Version]
  3. Zhao, W.J.; Qua, X.Y.; Jing, R.; Xiong, K. Spatio-temporal variation of vegetation coverage and its response to climate change in North China plain in the last 33 years. Int. J. Appl. Earth Obs. 2016, 53, 103–117. [Google Scholar]
  4. Liu, P.X.; Zhang, K.X. Climate characteristic of seasonal variation and its influence on annual growth period of populus euphratica Oliv in Hexi Corridor in recent 55 years. Acta Ecol. Sin. 2011, 31, 0882–0888. [Google Scholar]
  5. Zhang, H.; Xue, L.Q.; Wei, G.H.; Dong, Z.C.; Meng, X.Y. Assessing Vegetation Dynamics and Landscape Ecological Risk on the Mainstream of Tarim River, China. Water 2020, 12, 2156. [Google Scholar] [CrossRef]
  6. Liu, Z.J.; Liu, Y.S.; Li, Y.R. Anthropogenic contributions dominate trends of vegetation cover change over the farming-pastoral ecotone of northern China. Ecol. Indic. 2018, 95, 370–378. [Google Scholar] [CrossRef]
  7. Peng, J.; Liu, Z.H.; Liu, Y.H.; Wu, J.S.; Han, Y.A. Trend analysis of vegetation dynamics in Qinghai-Tibet Plateau using Hurst Exponent. Ecol. Indic. 2012, 14, 28–39. [Google Scholar] [CrossRef]
  8. Zhu, L.J.; Meng, J.J.; Zhu, L.K. Applying Geodetector to disentangle the contributions of natural and anthropogenic factors to NDVI variations in the middle reaches of the Heihe River Basin. Ecol. Indic. 2020, 117, 106545. [Google Scholar] [CrossRef]
  9. Guan, Q.Y.; Yang, L.Q.; Guan, W.Q.; Wang, F.F.; Liu, Z.Y.; Xu, C.Q. Assessing vegetation response to climatic variations and human activities: Spatiotemporal NDVI variations in the Hexi Corridor and surrounding areas from 2000 to 2010. Appl. Climatol. 2019, 135, 1179–1193. [Google Scholar] [CrossRef]
  10. Wang, X.H.; Piao, S.L.; Ciais, P.; Li, J.S.; Friedlingstein, P.; Koven, C.; Chen, A.P. Spring temperature change and its implication in the change of vegetation growth in North America from 1982 to 2006. Proc. Natl. Acad. Sci. USA 2011, 108, 1240–1245. [Google Scholar] [CrossRef] [Green Version]
  11. Wen, Z.F.; Wu, S.J.; Chen, J.L.; Lu, M.Q. NDVI indicated long-term interannual changes in vegetation activities and their responses to climatic and anthropogenic factors in the Three Gorges Reservoir Region, China. Sci. Total Environ. 2017, 574, 947–959. [Google Scholar] [CrossRef] [PubMed]
  12. Chen, S.T.; Guo, B.; Zhang, R.; Zang, W.Q.; Wei, C.X.; Wu, H.W.; Yang, X.; Zhen, X.Y.; Li, X.; Zhang, D.F.; et al. Quantitatively determine the dominant driving factors of the spatial-temporal changes of vegetation NPP in the Hengduan Mountain area during 2000–2015. J. Mt. Sci. 2021, 18, 427–445. [Google Scholar] [CrossRef]
  13. Guo, B.; Wei, C.X.; Yu, Y.; Liu, Y.F.; Li, J.L.; Meng, C.; Cai, Y.M. The dominant influencing factors of desertification changes in the source region of Yellow River: Climate change or human activity? Sci. Total Environ. 2022, 813, 152512. [Google Scholar] [CrossRef] [PubMed]
  14. Wu, H.W.; Guo, B.; Fan, J.F.; Yang, F.; Han, B.M.; Wei, C.X.; Lu, Y.F.; Zang, W.Q.; Zhen, X.Y.; Meng, C. A novel remote sensing ecological vulnerability index on large scale: A case study of the China-Pakistan Economic Corridor region. Ecol. Indic. 2021, 129, 107955. [Google Scholar] [CrossRef]
  15. Chen, J.H.; Yan, F.; Lu, Q. Spatiotemporal Variation of Vegetation on the Qinghai-Tibet Plateau and the Influence of Climatic Factors and Human Activities on Vegetation Trend (2000–2019). Remote Sens. 2020, 12, 3150. [Google Scholar] [CrossRef]
  16. Zhou, Y.K.; Fan, J.F.; Wang, X.Y. Assessment of varying changes of vegetation and the response to climatic factors using GIMMS NDVI3g on the Tibetan Plateau. PLoS ONE 2020, 15, e0234848. [Google Scholar] [CrossRef]
  17. Jia, L.; Li, Z.B.; Xu, G.C.; Ren, Z.P.; Li, P.; Cheng, Y.T.; Zhang, Y.X.; Wang, B.; Zhang, J.X.; Yu, S. Dynamic change of vegetation and its response to climate and topographic factors in the Xijiang River basin, China. Environ. Sci. Pollut. Res. 2020, 27, 11637–11648. [Google Scholar] [CrossRef]
  18. Roerink, G.J.; Menenti, M.; Soepboer, W.; Su, Z. Assessment of climate impact on vegetation dynamics by using remote sensing. Phys. Chem. Earth 2003, 28, 103–109. [Google Scholar] [CrossRef]
  19. Nemani, R.R.; Keeling, C.D.; Hashimoto, H.; Jolly, W.M.; Piper, S.C.; Tucker, C.J.; Myneni, R.B.; Running, S.W. Climate-driven increases in global terrestrial net primary production from 1982 to 1999. Science 2003, 300, 1560–1563. [Google Scholar] [CrossRef] [Green Version]
  20. Xu, L.; Myneni, R.B.; Chapin, F.S.; Callaghan, T.V.; Pinzon, J.E.; Tucker, C.J.; Zhu, Z.; Bi, J.; Ciais, P.; Tommervik, H.; et al. Temperature and vegetation seasonality diminishment over northern lands. Nat. Clim. Change 2013, 3, 581–586. [Google Scholar] [CrossRef] [Green Version]
  21. Zhou, L.M.; Tucker, C.J.; Kaufmann, R.K.; Slayback, D.; Shabanov, N.V.; Myneni, R.B. Variations in northern vegetation activity inferred from satellite data of vegetation index during 1981 to 1999. J. Geophys. Res.-Atmos 2001, 106, 20069–20083. [Google Scholar] [CrossRef]
  22. Xu, X.K.; Chen, H.; Levy, J.K. Spatiotemporal vegetation cover variations in the Qinghai-Tibet Plateau under global climate change. Chin. Sci. Bull. 2008, 53, 915–922. [Google Scholar] [CrossRef] [Green Version]
  23. Zhang, X.Z.; Dai, J.H.; Ge, Q.S. Variation in vegetation greenness in spring across eastern China during 1982–2006. J. Geogr. Sci. 2013, 23, 45–56. [Google Scholar] [CrossRef]
  24. Zhao, M.S.; Running, S.W. Drought-Induced Reduction in Global Terrestrial Net Primary Production from 2000 Through 2009. Science 2010, 329, 940–943. [Google Scholar] [CrossRef] [Green Version]
  25. Pan, N.Q.; Feng, X.M.; Fu, B.J.; Wang, S.; Ji, F.; Pan, S.F. Increasing global vegetation browning hidden in overall vegetation greening: Insights from time-varying trends. Remote Sens. Environ. 2018, 214, 59–72. [Google Scholar] [CrossRef]
  26. Djebou, D.C.S.; Singh, V.P.; Frauenfeld, O.W. Vegetation response to precipitation across the aridity gradient of the southwestern United states. J. Arid Environ. 2015, 115, 35–43. [Google Scholar] [CrossRef]
  27. Li, L.H.; Zhang, Y.L.; Wu, J.S.; Li, S.C.; Zhang, B.H.; Zu, J.X.; Zhang, H.M.; Ding, M.J.; Paudel, B. Increasing sensitivity of alpine grasslands to climate variability along an elevational gradient on the Qinghai-Tibet Plateau. Sci. Total Environ. 2019, 678, 21–29. [Google Scholar] [CrossRef]
  28. Piao, S.L.; Mohammat, A.; Fang, J.Y.; Cai, Q.; Feng, J.M. NDVI-based increase in growth of temperate grasslands and its responses to climate changes in China. Glob. Environ. Change 2006, 16, 340–348. [Google Scholar] [CrossRef]
  29. Du, J.Q.; Quan, Z.J.; Fang, S.F.; Liu, C.C.; Wu, J.H.; Fu, Q. Spatiotemporal changes in vegetation coverage and its causes in China since the Chinese economic reform. Environ. Sci. Pollut. Res. 2020, 27, 1144–1159. [Google Scholar] [CrossRef]
  30. Sun, Y.L.; Yang, Y.L.; Zhang, L.; Wang, Z.L. The relative roles of climate variations and human activities invegetation change in North China. Phys. Chem. Earth 2015, 87–88, 67–78. [Google Scholar] [CrossRef]
  31. Ghebrezgabher, M.G.; Yang, T.B.; Yang, X.M.; Sereke, T.E. Assessment of NDVI variations in responses to climate change in the Horn of Africa. Egypt. J. Remote Sens. Space Sci. 2020, 23, 249–261. [Google Scholar] [CrossRef]
  32. Kalisa, W.; Igbawua, T.; Henchiri, M.; Ali, S.; Zhang, S.; Bai, Y.; Zhang, J.H. Assessment of climate impact on vegetation dynamics over East Africa from 1982 to 2015. Sci. Rep. 2019, 9, 16865. [Google Scholar] [CrossRef] [Green Version]
  33. Fensholt, R.; Proud, S.R. Evaluation of Earth Observation based global long term vegetation trends—Comparing GIMMS and MODIS global NDVI time series. Remote Sens. Environ. 2012, 119, 131–147. [Google Scholar] [CrossRef]
  34. Tucker, C.J.; Pinzon, J.E.; Brown, M.E.; Slayback, D.A.; Pak, E.W.; Mahoney, R.; Vermote, E.F.; El Saleous, N. An extended AVHRR 8-km NDVI dataset compatible with MODIS and SPOT vegetation NDVI data. Int. J. Remote Sens. 2005, 26, 4485–4498. [Google Scholar] [CrossRef]
  35. Fensholt, R.; Rasmussen, K.; Nielsen, T.T.; Mbow, C. Evaluation of earth observation based long term vegetation trends—Intercomparing NDVI time series trend analysis consistency of Sahel from AVHRR GIMMS, Terra MODIS and SPOT VGT data. Remote Sens. Environ. 2009, 113, 1886–1898. [Google Scholar] [CrossRef]
  36. Lunetta, R.S.; Knight, J.F.; Ediriwickrema, J.; Lyon, J.G.; Worthy, L.D. Land-cover change detection using multi-temporal MODIS NDVI data. Remote Sens. Environ. 2006, 105, 142–154. [Google Scholar] [CrossRef]
  37. Geng, L.Y.; Che, T.; Wang, X.F.; Wang, H.B. Detecting Spatiotemporal Changes in Vegetation with the BFAST Model in the Qilian Mountain Region during 2000–2017. Remote Sens. 2019, 11, 103. [Google Scholar] [CrossRef] [Green Version]
  38. Jiang, Y.Y.; Du, W.T.; Huang, J.; Zhao, H.Z.; Wang, C.F. Analysis of vegetation changes in the Qilian Mountains during 2000–2015. J. Glaciol. Geocryol. 2017, 39, 1130. [Google Scholar]
  39. Zhou, J.J.; Xue, D.X.; Lei, L.; Wang, L.Y.; Zhong, G.S.; Liu, C.F.; Xiang, J.; Huang, M.H.; Feng, W.; Li, Q.Q.; et al. Impacts of Climate and Land Cover on Soil Organic Carbon in the Eastern Qilian Mountains, China. Sustainability 2019, 11, 5790. [Google Scholar] [CrossRef] [Green Version]
  40. Chen, J.H.; Jia, W.X.; Zhao, Z.J.; Zhang, Y.S.; Liu, Y.R. Research on temporal and spatial variation characteristics of vegetation cover of Qilian Mountains from 1982 to 2006. Adv. Earth Sci. 2015, 30, 834–845. [Google Scholar]
  41. Liu, Y.; Jia, W.; Huang, M.; Li, Y.; Wu, Z.; Zhang, Y.; Li, Y. Response of Vegetation Net Primary Productivity to Climate Change in the Qilian Mountains since Recent 51 Years. Acta Bot. Boreali-Occident. Sin. 2015, 35, 601–607. [Google Scholar]
  42. Sun, L.; Zhang, B.; Hou, C.; Chi, X.; He, H. The Spatial Variation of Vegetation Net Primary Productivity in Qilian Mountains. Remote Sens. Technol. Appl. 2015, 30, 592–598. [Google Scholar]
  43. Wang, X.M.; He, B.B.; Xing, M.F.; Liu, X.Z.; Gao, S.X. Spatiotemporal Pattern Simulation of Fractional Vegetation Coverage in the South Qilian Mountains Based on Bp Neural Network. In Proceedings of the IGARSS 2019—2019 IEEE International Geoscience and Remote Sensing Symposium, Yokohama, Japan, 28 July–2 August 2019; pp. 6475–6478. [Google Scholar] [CrossRef]
  44. Zeng, P.; Zhang, F.; Feng, Q.; Wei, Y.; Huang, L.; Li, L. Estimation of the carbon sequestration value and spatial and temporal evolution of different vegetation ecosystems in Qilian Mountains. J. Glaciol. Geocryol. 2019, 41, 1348–1358. [Google Scholar]
  45. Cheng, Y.H.; Xu, D.X.; Guo, X.L. Analysis on the Vegetation Change in the Qilian Mountains since Recent 22 Years. Arid Zone Res. 2008, 25, 772–777. [Google Scholar]
  46. Dai, S.; Zhang, B.; Wang, H.; Wang, Y.; Li, D.; Wang, X. Analysis on the Spatio-temporal Variation of Grassland Cover Using SPOT NDVI in Qilian Mountains. Prog. Geogr. 2010, 29, 1075–1080. [Google Scholar]
  47. Yang, L.S.; Feng, Q.; Adamowski, J.F.; Alizadeh, M.R.; Yin, Z.L.; Wen, X.H.; Zhu, M. The role of climate change and vegetation greening on the variation of terrestrial evapotranspiration in northwest China’s Qilian Mountains. Sci. Total Environ. 2021, 759, 143532. [Google Scholar] [CrossRef]
  48. Chen, Z.R.; Cao, G.C.; Chen, K.L.; Cao, S.K.; Cui, H.; Jiang, G.; Chen, Z. Temporal and Spatial Dynamics of Normalized Difference Vegetation Index on the Southern Slope of Qilian Mountains from 2000 to 2015. IOP Conf. Ser. Earth Environ. Sci. 2019, 237, 032051. [Google Scholar] [CrossRef]
  49. Dai, S.; Zhang, B.; Wang, H.; Wang, Y.; Li, D.; Wang, X. Spatiotemporal Variation of Vegetation NDVI in the Qilian Mountains during the Period from 1999 to 2007. Arid Zone Res. 2010, 27, 585–591. [Google Scholar]
  50. Wu, Z.; Jia, W.; Liu, Y.; Zhang, Y. Change of Vegetation Coverage in the Qilian Mountains in Recent 10 Years. Arid Zone Res. 2014, 31, 80–87. [Google Scholar]
  51. Zhang, Y.; Jia, W.; Zhao, Y.; Liu, Y.; Zhao, Z.; Chen, J. Spatial-temporal Variations of Net Primary Productivity of Qilian Mountains Vegetation Based on CASA Model. Acta Bot. Boreali-Occident. Sin. 2014, 34, 2085–2091. [Google Scholar]
  52. Wang, J.; Meng, J.J.; Cai, Y.L. Assessing vegetation dynamics impacted by climate change in the southwestern karst region of China with AVHRR NDVI and AVHRR NPP time-series. Environ. Geol. 2008, 6, 1185–1195. [Google Scholar] [CrossRef]
  53. Yu, W.T.; Li, J.; Liu, Q.H.; Zhao, J.; Dong, Y.D.; Zhu, X.R.; Lin, S.R.; Zhang, H.; Zhang, Z.X. Gap Filling for Historical Landsat NDVI Time Series by Integrating Climate Data. Remote Sens. 2021, 13, 484. [Google Scholar] [CrossRef]
  54. Zhu, L.; Xie, S.; Yang, H.; Ma, M. Seasonal variation of vegetation coverage based on modis-evi data in chongqing during 2000–2015. Resour. Environ. Yangtze Basin 2017, 26, 2146–2155. [Google Scholar]
  55. Wang, L.L.; Liu, P.X.; Wang, Y. Spatial and temporal variations of NDVI and its influencing factors in Qaidam Basin in the last 14 years. Chin. J. Ecol. 2015, 34, 1713–1722. [Google Scholar]
  56. Jia, W.; Chen, J. Variations of NDVI and Its Response to Climate Change in the Growing Season of Vegetation in Qilianshan Mountains from 1982 to 2014. Res. Soil Water Conserv. 2018, 25, 264–268. [Google Scholar]
  57. Wang, L.; Song, W.; Zhang, J.; Ma, X.; Zhao, H.; Huang, X. Spatio-temporal evolution of vegetation net primary productivity in Qilian Mountain National Park and its driving factors. Pratacultural. Sci. 2020, 37, 1458–1474. [Google Scholar]
  58. Fu, J.X.; Cao, G.C.; Guo, W.J. Changes of growing season NDVI at different elevations, slopes, slope aspects and its relationship with meteorological factors in the southern slope of the Qilian Mountains, China from 1998 to 2017. J. Appl. Ecol. 2020, 31, 1203–1212. [Google Scholar]
  59. Tong, S.; Cao, G.; Cao, S. Study on the Relationship Between Vegetation Cover Change and Meteorological Factors in the Southern slope of Qilian Mountains in the Past 34 years. Resour. Environ. Yangtze Basin 2020, 29, 2655–2664. [Google Scholar]
  60. Xu, H.; Yang, T.; Zeng, B. Spatial—temporal changes of vegetation in Qilian Mountains from 2000 to 2010 based on MODIS NDVI data and its affecting factors. J. Arid. Land Resour. Environ. 2012, 26, 87–91. [Google Scholar]
  61. Qiu, L.S.; Zhang, L.F.; He, Y.; Diao, Z.Y.; Chen, Y.D. Remote Sensing Monitoring on Vegetation Dynamic Change in Qilian Mountain from 2000 to 2017. Remote Sens. 2019, 34, 97–107. [Google Scholar]
  62. Qiao, C.C.; Shen, S.; Cheng, C.X.; Wu, J.X.; Jia, D.; Song, C.Q. Vegetation Phenology in the Qilian Mountains and Its Response to Temperature from 1982 to 2014. Remote Sens. 2021, 13, 286. [Google Scholar] [CrossRef]
  63. Wan, Q.Z.; Zhu, G.F.; Guo, H.W.; Zhang, Y.; Pan, H.X.; Yong, L.L.; Ma, H.Y. Influence of Vegetation Coverage and Climate Environment on Soil Organic Carbon in the Qilian Mountains. Sci. Rep. 2019, 9, 1762. [Google Scholar] [CrossRef]
  64. Li, L.H.; Zhang, Y.L.; Liu, L.S.; Wu, J.S.; Wang, Z.F.; Li, S.C.; Zhang, H.M.; Zu, J.X.; Ding, M.J.; Paudel, B. Spatiotemporal Patterns of Vegetation Greenness Change and Associated Climatic and Anthropogenic Drivers on the Tibetan Plateau during 2000-2015. Remote Sens. 2018, 10, 1525. [Google Scholar] [CrossRef] [Green Version]
  65. Piao, S.L.; Wang, X.H.; Ciais, P.; Zhu, B.; Wang, T.; Liu, J. Changes in satellite-derived vegetation growth trend in temperate and boreal Eurasia from 1982 to 2006. Glob. Change Biol. 2011, 17, 3228–3239. [Google Scholar] [CrossRef]
  66. Peng, S.Z.; Ding, Y.X.; Liu, W.Z.; Li, Z. 1 km monthly temperature and precipitation dataset for China from 1901 to 2017. Earth Syst. Sci. Data 2019, 11, 1931–1946. [Google Scholar] [CrossRef] [Green Version]
  67. Deng, C.H.; Bai, H.Y.; Ma, X.P.; Huang, X.Y.; Zhao, T. Variation characteristics and its north-south differences of the vegetation phenology by remote sensing monitoring in the Qinling Mountains during 2000-2017. Acta Ecol. Sin. 2021, 41, 1068–1080. [Google Scholar]
  68. Piao, S.L.; Fang, J.Y.; He, J.S. Variations in vegetation net primary production in the Qinghai-Xizang Plateau, China, from 1982 to 1999. Clim. Change 2006, 74, 253–267. [Google Scholar] [CrossRef]
  69. Stow, D.; Daeschner, S.; Hope, A.; Douglas, D.; Petersen, A.; Myneni, R.; Zhou, L.; Oechel, W. Variability of the seasonally integrated normalized difference vegetation index across the north slope of Alaska in the 1990s. Int. J. Remote Sens. 2003, 24, 1111–1117. [Google Scholar] [CrossRef]
  70. Hou, X.H.; Ying, L.L.; Gao, M.; Bi, X.L.; Lu, X.; Zhu, M.M. Character of Vegetation Cover Change in China’s Eastern Coastal Areas 1998–2008. Sci. Geogr. Sin. 2010, 30, 735–741. [Google Scholar]
  71. Wang, J.B.; Zhao, J.; Li, C.H.; Zhu, Y.; Kang, C.Y.; Gao, C. The spatial-temporal patterns of the impact of human activities on vegetation coverage in China from 2001 to 2015. Acta Geogr. Sin. 2019, 74, 504–519. [Google Scholar]
  72. Sun, R.; Chen, S.H.; Su, H.B. Climate Dynamics of the Spatiotemporal Changes of Vegetation NDVI in Northern China from 1982 to 2015. Remote Sens. 2021, 13, 187. [Google Scholar] [CrossRef]
  73. Li, F.; Xu, W.X. Spatial and Temporal Variation of NDVI in Different Functional Areas of Qinghai from 2000 to 2015. Acta Agrestia Sin. 2017, 25, 701–710. [Google Scholar]
  74. Qin, G.X.; Lu, Q.; Meng, Z.Y.; Li, Z.; Chen, H.Y.; Kong, J.; Ji, Z.X.; Qin, A.N. Spatial-temporal Dynamics of Grassland NDVI and Its Response to Climate Change in Northern China from 1982 to 2015. Res. Soil Water Conserv. 2021, 28, 101–117. [Google Scholar]
  75. Guo, W.; Ni, X.N.; Jing, D.Y.; Li, S.H. Spatial-temporal patterns of vegetation dynamics and their relationships to climate variations in Qinghai Lake Basin using MODIS time-series data. J. Geogr. Sci. 2014, 24, 1009–1021. [Google Scholar] [CrossRef]
  76. Nzabarinda, V.; Bao, A.M.; Xu, W.Q.; Uwamahoro, S.; Jiang, L.L.; Duan, Y.C.; Nahayo, L.; Yu, T.; Wang, T.; Long, G. Assessment and Evaluation of the Response of Vegetation Dynamics to Climate Variability in Africa. Sustainability 2021, 13, 1234. [Google Scholar] [CrossRef]
  77. Guo, B.; Zang, W.Q.; Yang, F.; Han, B.M.; Chen, S.T.; Liu, Y.; Yang, X.; He, T.L.; Chen, X.; Liu, C.T.; et al. Spatial and temporal change patterns of net primary productivity and its response to climate change in the Qinghai-Tibet Plateau of China from 2000 to 2015. J. Arid Land 2020, 12, 1–17. [Google Scholar] [CrossRef] [Green Version]
  78. Gao, X.; Huang, X.X.; Lo, K.; Dang, Q.W.; Wen, R.Y. Vegetation responses to climate change in the Qilian Mountain Nature Reserve, Northwest China. Glob. Ecol. Conserv. 2021, 28, e01698. [Google Scholar] [CrossRef]
  79. Liu, J.R.; Zhao, J.; Wang, J.B. Response of vegetation cover to drought in the Qilian Mountains Region from 2001 to 2016. Pratacultural. Sci. 2021, 38, 419–431. [Google Scholar]
  80. Qin, X.; Liu, W.B.; Mao, R.C.; Song, J.X.; Chen, Y.N.; Ma, C.; Li, M.Y. Quantitative assessment of driving factors affecting human appropriation of net primary production (HANPP) in the Qilian Mountains, China. Ecol. Indic. 2021, 121, 106997. [Google Scholar] [CrossRef]
  81. Li, Y.; Tang, L. Correlation between Precipitation and NDVI in Vegetation Growing Season in a Typical Desert in North China. Arid. Zone Res. 2019, 36, 1229–1237. [Google Scholar]
  82. Xu, J.; Fang, S.; Zhang, T.; Zhu, Y.; Wu, D.; Yi, G. NDVI changes and its correlation with climate factors of the Three River-Headwater region in growing seasons during 2000–2016. Remote Sens. Land Resour. 2020, 32, 237–246. [Google Scholar]
  83. Dai, S.W.; Shulski, M.D.; Hubbard, K.G.; Takle, E.S. A spatiotemporal analysis of Midwest US temperature and precipitation trends during the growing season from 1980 to 2013. Int. J. Clim. 2016, 36, 517–525. [Google Scholar] [CrossRef] [Green Version]
  84. Yuan, J.; Cao, G.C.; Yang, X.D.; Cao, S.K.; Diao, E.L.; Zhao, M.L. Temporal and spatial variation characteristics and influencing factors of vegetation NDVI in Heihe source region of Qilian Mountains. Ecol. Sci. 2021, 40, 172–182. [Google Scholar]
  85. Li, G.; Li, X.; Zhao, G.; Zhang, Z.; Li, Y. Characteristics of spatial and temporal phenology under the dynamic variation of grassland in the Qinghai Lake watershed. Acta Ecol. Sin. 2014, 34, 3038–3047. [Google Scholar]
  86. Panidi, E.; Rykin, I.; Tsepelev, V. Satellite-based estimation of growing season framing dates, weather instability aspect. Arab. J. Geosci. 2020, 13. [Google Scholar] [CrossRef]
  87. Wu, B.; Jiang, D.; Wang, X. Changes in the Growing Season Across China during 1961–2018. Chin. J. Atmos. Sci. 2021, 45, 424–434. [Google Scholar]
  88. Wu, Z.; Jia, W.; Zhao, Z.; Zhang, Y.; Liu, Y.; Chen, J. Spatial-temporal variations of vegetation and its correlation with climatic factors in Qilian Mountains from 2000 to 2012. Arid. Land Geogr. 2015, 38, 1241–1252. [Google Scholar]
  89. Song, W.; Wang, L.; Zhang, J. Temporal and spatial changes in response to climate in grasslands of the Qilian Mountain National Nature Reserve. Pratacultural. Sci. 2019, 36, 2233–2249. [Google Scholar]
Figure 1. Geography and location of the Qilian Mountains (QM) in China: (a) spatial distribution of elevation; (b) spatial distribution of vegetation types; (c) spatial distribution of annual precipitation; (d) spatial distribution of annual mean temperature.
Sustainability 14 04926 g001
Figure 2. Determination of the vital phenological characteristics of vegetation in the QM. SGS, EGS and LGS indicate the start, end and length of the growing season, respectively. The blue curve represents the annual trend of the NDVI, and the orange curve represents the change rate of the NDVI.
Sustainability 14 04926 g002
Figure 3. Spatial distribution of the NDVI in different seasons: (a) the GSNDVI, (b) the spring NDVI, (c) the summer NDVI, and (d) the autumn NDVI.
Sustainability 14 04926 g003
Figure 4. Interannual variation of seasonal NDVI in the QM: (a) GSNDVI; (b) spring NDVI; (c) summer NDVI; and (d) autumn NDVI.
Sustainability 14 04926 g004
Figure 5. Spatiotemporal variation trend of the GSNDVI (a) and its significance grades (b) in the QM from 2000 to 2020.
Sustainability 14 04926 g005
Figure 6. Spatial distribution of the NDVI change trends in different seasons (ac) and their corresponding significance grades (df) from 2000 to 2020.
Sustainability 14 04926 g006
Figure 7. Stability grades of the NDVI in the different seasons in the QM during 2000–2020. (a) Stability grades of the CV in the growing season; (b) stability grades of the CV in spring; (c) stability grades of the CV in summer; (d) stability grades of the CV in autumn.
Sustainability 14 04926 g007
Figure 8. Interannual variations and trends of seasonal precipitation and temperature. (a,f) Annual variation, (b,g) variation in the growing season, (c,h) variation in spring, (d,i) variation in summer, and (e,j) variation in autumn. The red dashed lines indicate the linear regression lines of temperature and precipitation at different stages from 2000 to 2019. Slope < 0 and p ≤ 0.05 are marked in red.
Sustainability 14 04926 g008
Figure 9. Distribution of the correlation grades between the GSNDVI and climatic factors in the interannual and growing seasons from 2000 to 2019. (a) The GSNDVI and annual precipitation (AP), (b) the GSNDVI and annual mean temperature (AMT), (c) the GSNDVI and growing season precipitation (GSP), and (d) the GSNDVI and growing season temperature (GST). CC: correlation coefficient.
Sustainability 14 04926 g009
Figure 10. Distribution of the correlation grades between the seasonal NDVI and corresponding climatic factors from 2000 to 2019. (a) NDVI and precipitation in spring, (b) NDVI and temperature in spring, (c) NDVI and precipitation in summer, (d) NDVI and temperature in summer, (e) NDVI and precipitation in autumn, and (f) NDVI and temperature in autumn.
Sustainability 14 04926 g010
Table 1. Area proportion of vegetation stability grades in different seasons in the QM.
CVStability GradesGrowing Season (%)Spring (%)Summer (%)Autumn (%)
0–0.05Highly stable16.870.6817.000.46
0.05–0.10Moderately stable25.5028.1525.1119.73
0.10–0.15Low stable33.9031.9326.5726.18
0.15–0.20Low unstable17.2715.7621.2717.84
0.20–0.25Moderately unstable4.207.477.0212.70
>0.25Highly unstable2.2716.023.0423.10
Table 2. Statistical results of the variation trends and significance grades of the GSNDVI in the QM from 2000 to 2020.
Variation TrendsSignificance GradesArea (km2)Area Percentage (%)
Increasing
(GSNDVI_slope > 0)
Significant increase
(p < 0.05)
108,67375.06
Nonsignificant increase
(p > 0.05)
26,37218.21
Decreasing
(GSNDVI_slope < 0)
Nonsignificant decrease
(p > 0.05)
87206.02
Significant decrease
(p < 0.05)
10170.70
Table 3. Statistical results of the variation grades of the NDVI in the different seasons in the QM from 2000 to 2020.
Variation GradesSpringSummerAutumn
Area (km2)Percentage (%)Area (km2)Percentage (%)Area (km2)Percentage (%)
Significant increase
(NDVI_slope > 0, p < 0.05)
91,13862.95105,31472.7463,95544.17
Nonsignificant increase
(NDVI_slope > 0, p > 0.05)
32,81622.6729,14220.1360,84742.03
Nonsignificant decrease
(NDVI_slope < 0, p > 0.05)
18,55512.8292956.4219,09613.19
Significant decrease
(NDVI_slope < 0, p < 0.05)
22721.5710300.728800.61
Table 4. Correlation coefficient matrix between NDVI and climatic factors in different seasons.
NDVI in Different SeasonsPrecipitationTemperature
SpringSummerAutumnSpringSummerAutumn
GSNDVI0.4400.662 **−0.1450.4110.0640.018
NDVI_spring0.0430.704 **
NDVI_summer0.491 *0.658 **0.3660.023
NDVI_autumn0.2980.408−0.1950.1060.3860.145
* indicates p < 0.05; ** indicates p < 0.01.
Publisher’s Note: MDPI stays neutral with regard to jurisdictional claims in published maps and institutional affiliations.

