Abstract
Improving public transport (PT) services is critical to maintaining resilient and sustainable transportation. While the investment in PT (i.e., buses) has not been able to shift private vehicle users, especially motorcyclists, to buses, the emergence of motorcycle-based ride-sourcing (MBRS) has become a popular travel mode that threatens the existing bus demand. Due to this, this study aimed to investigate the factors affecting the choice of buses over private motorcycles and MBRS among high school and university students in Yogyakarta, Indonesia, through the hybrid choice model. The explored variables include sociodemographic characteristics, travel time, travel cost, and latent variables of travel mode perceptions. By involving 527 respondents, the analysis showed that travel time, travel cost, and sociodemographic factors, including education level, income, and motorcycle ownership, significantly impacted travel mode choices. The findings also revealed that convenience causes buses to be the chosen transport means among students, while lifestyle generates students to choose MBRS services. Based on findings, this study proposed some policies to increase bus demand, especially related to the identified convenience factors and travel time.
1. Introduction
In many cities worldwide, public transportation is heavily relied upon to take people to work, study, or other activities, especially for low-income households [1], students [2], the elderly [3], and disabled people [4]. Public transportation is beneficial because it uses road space much more efficiently than private transport modes [5]. Thus, public transport is a pivotal tool to overcome the dependence on cars, urban congestion problems, and poor air quality [6]. As traffic congestion is getting worse in urban areas, more cities are becoming aware that public transportation investments, such as subways, bus rapid transit, or buses, should be one of the top priorities [7].
Amid the efforts of many cities to promote the sharing of urban public transport and reduce the use of private transport, the use of online transportation is increasing. The emergence of online transportation brings major changes in the usage patterns of transportation modes. In the United States, the emergence of two online transportation services, namely Uber and Lyft, has replaced the role of public transportation in urban areas [8]. Online transportation services have—unavoidably—changed the preference of some public transportation passengers [9]. Approximately half of the trips using ride-sourcing (online taxis) have replaced the preference for using conventional taxis or public transportation, going on foot, cycling, and driving a private car [10]. Moreover, Uber pool can replace urban public transportation between neighborhoods that require transfer [11]. Another study investigated transportation services, and discovered that ride-sharing could complement public transportation by improving access to long-distance transportation [12].
Online transport in Indonesian cities is also rapidly growing, where its transport means consist of taxis (car-based ride-sourcing) and motorcycle taxis (motorcycle-based ride-sourcing [MBRS] [13]. One of the Indonesian cities with many online transportation modes operating on the highway is Yogyakarta [14]. Studies show that students in Yogyakarta have a high dependency on MBRS services [15], and the presence of MBRS services has threatened the existing bus (i.e., Trans-Jogja bus) demand [16]. It is clear that public transport, such as buses, is a sustainable transportation mode, and, with the decrease in bus users, there is a potential threat to the current sustainable transportation mode which needs to be addressed. Nations worldwide have also underlined the necessity of sustainable transportation to accomplish sustainable development goals [17], including Indonesia [18]. Moreover, the challenges encountered by the Trans-Jogja bus in Yogyakarta are not only due to the presence of online transportation, but also the habits of private vehicle use, especially motorcycles. A study in Yogyakarta reveals that students use motorized vehicles rather than cycling on school commutes due to motorized vehicle use habit [19].
Due to this, this study aims to investigate which factors affect the high school and university students’ choice to use buses over private motorcycles and MBRS. This study focuses more on motorcycles rather than cars, since motorcycles are the main modes for students in Yogyakarta to accomplish their daily travel [20]. Sociodemographic variables, travel time, travel cost, and perceived performance variables of transportation modes, including flexibility, security and safety, convenience and comfort, pro-environment, and image/lifestyle were included to obtain representative influence factors. The hybrid choice model (HCM) was applied, considering that this method could facilitate the use of perceived performances of transport mode as latent variables (LVs) into the choice model.
The paper is organized as follows: first, the background to the study was presented above, and will be followed by the literature review below. Subsequently, the materials and methods are presented. Fourth, the research findings are presented and discussed. Finally, the conclusion is presented and recommendations are provided.
2. Literature Review
2.1. Factors Affecting the Use of Motorcycles, MBRS, and City Buses
Motorcycles are pivotal for people’s daily mobility [21]. Motorcycles dominate the streets in many cities worldwide, and motorcycle sales reached 60.1 million units in 2019 [22]. Several factors contribute to the great use of motorcycles, such as the offer of cheap, safe, comfortable, and point-to-point travel [23]. In low and middle-income countries, motorcycles have become the main mode of transport because it is affordable, and public transport is of poor quality [24]. Motorcycles in Iran, especially in big cities such as Tehran, are widely used for multiple reasons, such as low maintenance cost, high maneuverability, and the possibility of entering congestion zones without paying the toll fee [25]. Another study in Yogyakarta showed that most people living far from the city center preferred a motorcycle to other transportation modes [26].
Meanwhile, both online and conventional motorcycle taxis are popular transportation modes in many southeast Asian and sub-Saharan African countries due to cheap tariffs. In sub-Saharan Africa, 75% of the traffic on low-volume rural roads comprises motorcycles and motorcycle taxis [27]. Although motorcycle taxis are not environmentally friendly, they can increase mobility [28]. In addition, a study also shows that motorcycle taxis have become a crucial mode of transport because they provide fast, flexible, and inexpensive services [29]. Moreover, consumers of MBRS benefit from the improved transport services and low prices offered by motorcycle taxis [13]. Good services which fulfill customer expectations are the reasons why people prefer using MBRS in Yogyakarta, Indonesia [30].
Instead of motorcycles and MBRS, some people use buses as a chosen form of urban public transportation. One of the city buses used is the bus rapid transit (BRT), which is a concept established in the 1970s, and has been successfully developed in many developing countries due to the benefits it offers, such as requiring small investments, its increased flexibility, its ability to be established rapidly, and its offer of a larger capacity compared to traditional bus services [31]. A study in Multan, Pakistan, showed that approximately 54% of passengers were very satisfied and selected the BRT due to its convenience [32]. Furthermore, BRT-like (without separate bus lanes) transport modes in Yogyakarta consist of three LVs that most significantly affect the selection of bus services over MBRS services, namely being forced to use buses, the quality of bus services, and the benefits of using buses. These three variables have a more significant effect than the potential cost of and time saving offered when using MBRS. Additionally, the decision to use the BRT-like in Yogyakarta is also significantly influenced by users’ age and income [16].
2.2. Methods Used in Determining Mode Choice Decision
Previous studies concluded that there are three main factors that affect transport mode choices [33]. The first is the characteristics of travelers, such as their background, household structures and income, vehicle ownership, and the availability of transport mode options. The second is the characteristics of the trip, such as the trip’s purpose, travel time, and travel distance. The third is the characteristics of transportation facilities, such as travel time, cost, service quality, and availability of a parking lot.
However, previous studies applied different methods in exploring the factors affecting mode choice decisions. The binary and multinomial logit model is the most frequently used model in exploring the factors influencing mode choice decisions [34,35,36,37,38]. For example, a study involving 450 university students and 450 employees implemented a binary logit model in analyzing the choice between motorcycles and buses in Ho Chi Minh City, Vietnam [34]. A study in the Greater Toronto and Hamilton areas in Canada expanded the model by combining independent availability logit and constrained multinomial logit model formulation to explore the demand for ride-sourcing (e.g., Uber) services [39]. Meanwhile, Si et al. integrated the binary logit model with structural equation modeling to investigate the factors influencing the choice decision between regular taxis and online taxis in China [40]. Another study also attempted to integrate the nested logit model with structural equation modeling in the case of travel mode choice between bicycle, bus, and online taxi in Jinan City, China [41]. Additionally, Aguilera-Garca et al. used a generalized structural equation model (GSEM) to examine ride-sharing usage and personal choices between conventional taxi and ride-sharing services in Spain [42].
Out of all of these methods, the latest development related to the mode choice model is the inclusion of LVs. The integrated choice and latent variable (ICLV) models, also referred to as the HCM, was initially proposed by McFadden in 1986, and further developed by Ben-Akiva et al. in 2002 [43]. The ICLV model involves, simultaneously, survey theory, econometric theory, logical psychology theory, and economic theory. Furthermore, it involves and integrates various dimensions. Integrating LVs improves the understanding of transport mode options. To illustrate, a study discovered that the LVs enrich the model of discrete choices, outperforming the model of traditional discrete options [44]. Another study shows that the LVs impact the behavior of transport mode choice, and the integrated model of structural equation modeling—the discrete choice model—has higher accuracy and a better explanation of the variables [45]. Other studies have also involved LVs, for example, a study investigating 8284 respondents and discovering that a lack of of comfort and convenience in the public transport system was the main factor causing people to avoid using public transport [46]. The use of the ICLV increased the value of McFadden’s R2 from the MNL condition by 7% to 11.5% [47]. The goodness of the ICLV fit model was 0.201 higher than the traditional logit, demonstrating that the LVs impacted transport mode choice [45]. A study of transport mode choice for going to work found that the prediction level of transport mode choice models involving LVs increased by 7.48%, as compared to the models not involving any LVs [48].
To date, investigations of the LVs of mode choices have only focused on one mode [16,47]. By involving the LVs for all travel mode options (bus, MBRS, and private motorcycle), it is expected that this study could address a gap in previous studies. By this, the study could explore the contribution of each LV for every travel mode, which is hypothesized to have different impacts in each mode of travel. However, we note that recently there have been new developments in modeling choice decisions, such as the use of the deep neural network (DNN), a machine learning method. For example, a study in Seoul, Korea, analyzed travel mode choice by applying an interpretable machine learning approach [49]. Zheng et al. stated that DNN, a machine learning method, can produce lower prediction bias than the conventional discrete choice model [50]. However, for our study, it was challenging to integrate latent psychological construct into a DNN based model. Therefore, the present study utilized the HCM, an integrated latent variable model, to determine which factors affect the choice of transport modes among high school and university students in Yogyakarta, Indonesia. It should be noted that HCM has been applied in a significant amount of transportation literature, for example, in the field of electric vehicle choice [51,52,53], autonomous vehicle [54,55], bike-sharing [56], mobility as a service [57], toll and residential choice [58,59], MBRS use [60], and BRT and motorcycle taxi choice [61].
3. Materials and Methods
3.1. Study Variables
This study discussed the travel choices between a private motorcycle, MBRS, and buses. The study used revealed preference data, namely measurement based on actual market behavior [62]. The involved variables included sociodemographic characteristics [63], trip characteristics, and LVs. The sociodemographic variables included gender, age, level of education, income, vehicle ownership, and driving license ownership. The trip characteristics comprised travel time and cost of any transport mode. This study used an approach based on the respondents’ perceptions of the services of a transportation mode [64]. This study focused on the students’ trip to their school/college. The target group was only high school and university students, and not all Yogyakarta city residents, because bus passengers and MBRS consumers in Yogyakarta are dominated by high school and university students [14,65]. Table 1 presents the questions related to the respondents’ sociodemographic variables.

Table 1.
The study variables and measurement strategies.
3.2. Survey Instrument
The respondents also answered questions related to their perceptions of three travel modes: private motorcycle, MBRS, and city bus. Each transport mode had 5 LVs, and 16 indicators. These 16 indicators were answered on a 5-point Likert scale ranging from 1 = strongly disagree to 5 = strongly agree. The 16 indicators can be categorized into five LV groups: flexibility [66,67,68,69], security and safety [70,71,72,73,74] convenience/comfort [70,75,76], pro-environment [67,75,77], and images/lifestyles [48,78]. These chosen variables were based on prior literature. To illustrate, transportation research has widely examined the variables of flexibility, security, and safety. The pro-environment variable was included because transportation contributes to deteriorating environmental conditions, such as global warming [79]. Meanwhile, the images or lifestyles variable was included because young people or students usually prefer to follow ongoing trends. Table 2 shows the questions regarding perceptions of transport modes.
Table 2.
Questions of the latent variable indicators for each transport mode.
The survey was conducted online using the probability sampling method distributed via a WhatsApp group. This type of survey was conducted for two reasons. First, since the COVID-19 pandemic was still ongoing, it was not possible to conduct the survey through face-to-face interviews. Second, the online survey method was more cost- and time-efficient. Although the survey was conducted during the COVID-19 pandemic, the respondents were asked about their travel behavior before the pandemic.
3.3. Sample and Data Collection
The sample included senior high school and university students in Yogyakarta. The inclusion criteria were students who had lived in Yogyakarta for at least one year. This aimed to ensure that they understood the condition of the three transportation modes. This study also required that the respondents lived in a place where the distance to the bus stop was no more than 400 m. It considers that people’s ability to walk to the bus stop is about 400 m [80], and therefore, respondents have an opportunity to use bus mode instead of MBRS and private motorcycle. Furthermore, it should be noted that even though we acknowledge that there is another method to collect data using big data provided by a navigation service provider, such as Baidu Maps in the China case [81], the present study incorporates latent psychological construct which can not be collected using navigation service provider app. Therefore, the questionnaire survey keeps used for this study.
The respondents were randomly obtained from WhatsApp groups to obtain a random sample. Since the research subjects were school and college students, WhatsApp groups in which the members were predominantly students were selected to maximize the response rates. However, public WhatsApp groups could still receive the online survey forms if the number of WhatsApp group members who were students could be identified. In addition, each of the group members were not allowed to send the Google Form to other groups, making it possible to identify the response rate. To ensure the respondents’ seriousness in completing the online form, the survey used experimental control sentences; these sentences contained questions that could easily be answered. When the respondents gave an incorrect answer in an experimental control sentence, the form could not be included in the following analysis phase.
Data were collected in November and December 2020. Overall, 1250 respondents completed the survey. However, only 603 respondents passed the initial stage of the survey; 23 respondents answered the experimental control questions incorrectly, and 622 respondents did not meet the criteria because the distance of their houses to the Trans Jogja bus stop was more than 400 m.
Then, the survey results of the 603 respondents who passed the initial stage were analyzed, particularly concerning to questions related to travel time and cost when using motorcycles, MBRS, and Trans Jogja buses. Unfortunately, 76 respondents answered with illogical data. For example, they mentioned that the travel time using the Trans Jogja bus was much faster than riding a private motorcycle. In addition, some respondents answered that it took less than 10 min to reach a destination when using the Trans Jogja bus, including the time they needed to walk to the bus stop. All the forms containing illogical data were excluded from the following stage of analysis. Thus, there were only 527 respondents for which the data were used for the next stage of analysis. These 527 respondents met the minimum requirement of 400 [84] or 500 people [43,85].
Table 3 shows the survey results for respondents’ socio-economic characteristics, travel time, and cost of each transport mode. It shows that most of the respondents (62.3%) were female, and were aged 15 to 24 years old. The higher number of females is similar to previous studies, where bus passengers and MBRS customers in Yogyakarta are dominated by females, accounting for 61.3% and 57.56%, respectively [14,65]. A total of 50% of them were above 23 years old. More than 50% of the participants had an income of IDR 500,000 or more. A total of 62% of them had a driving license, and only 16% did not have a private motorcycle.
Table 3.
Respondents’ sociodemographic and transportation characteristics.
Furthermore, the relationship between sociodemographic conditions of the respondents and the use of transportation modes is presented in Figure 1. It shows that the proportion of male and female users of motorcycles, MBRS, and buses was relatively balanced. Most motorcycle riders were aged 25 years old and above, while 100% of MBRS users were 15 years old. The proportion of the use of motorcycles increased, along with a decrease in the use of MBRS and buses when the education level was higher. Regarding income, the proportion of the use of motorcycles, MBRS, and buses fluctuated, although the proportion of motorcycle use in various income levels was always above 50%. The proportion of the use of motorcycles was lower among college students who did not have a private motorcycle. Moreover, the proportion of the use of transport modes (motorcycle, MBRS, and buses) was relatively evenly divided among the college students who did not have a private motorcycle.
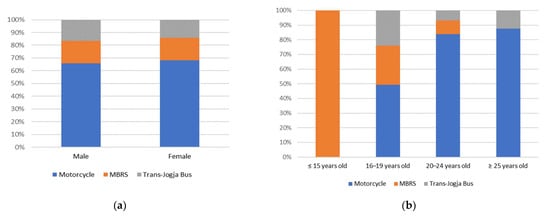
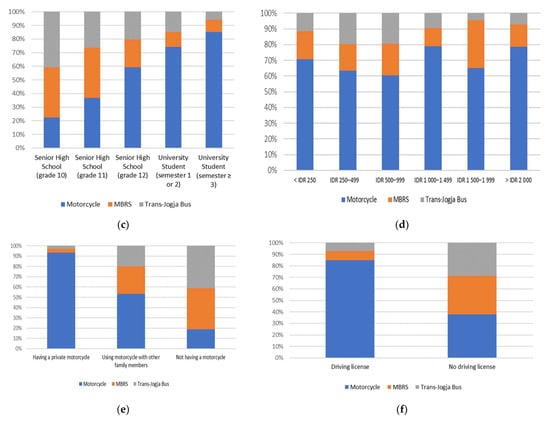
Figure 1.
Sociodemographic and selected modes of transportation: (a) gender and mode choices, (b) age and mode choices, (c) education and mode choices, (d) income (in thousand IDR) and mode choices, (e) vehicle ownership and mode choices, (f) driving license ownership and mode choices.
3.4. Perception Variables
The reliability of the perception variables constructing the LVs was tested to investigate the consistency of the respondents’ answers. The results of the reliability test are presented in Table 4. It shows that all of the variables had a Cronbach’s Alpha greater than 0.6. This figure indicates that the consistency of the respondents’ answers met the criteria.
Table 4.
The reliability of the latent variables of respondents’ perceptions.
Then, the validity test was conducted to determine the level of accuracy of the respondents’ answers. The corrected item-total correlation showed that the r-count was comparable with the significance level. All of the answers were valid because the r-count was greater than the r-table (0.085). Meanwhile, the details of the results of respondents’ perceptions of the five LVs for each transport mode is presented in Table 5 below. Based on Table 5, the highest LV assessment of each transport mode is on the flexibility of motorbikes/MBRS and the pro-environment factor for the Trans-Jogja bus. The lowest rating is on the pro-environment for motorbikes/MBRS and the flexibility of the Trans-Jogja bus.
Table 5.
The mean and standard deviation of the indicators of the latent variables of respondents’ perceptions.
3.5. Hybrid Choice Model
The HCM or integrated choice and latent variable model is an extension of a discrete choice model that involves LVs of psychological constructs. To estimate the parameter in the HCM, this study used Biogeme, an open source Python software, to maximize the likelihood estimation [86]. However, given that it takes a long time to run the Biogeme program, LVs that significantly affect the mode choice of the five LVs for each transportation mode were initially selected. By using principal component analysis, the results showed that LV2 (security and safety) and LV5 (image/lifestyles) did not significantly influence the choice of motorcycle. Meanwhile, LV1 (flexibility), LV3 (convenience/ comfort), and LV4 (Pro-environment) did not significantly influence the choice of MBRS and LV1 (flexibility), LV2 (security and safety), and LV4 (pro-environment) did not significantly influence the choice of bus mode. Thus, these insignificant LVs were excluded from the HCM. The remaining LVs, together with the sociodemographic variables, travel time, and travel costs, were then examined to find the significant parameter influencing transport mode choice. Figure 2 shows the proposed modeling framework in this study.
Figure 2.
Proposed framework for this study.
There are two equations in the HCM. The first is a structural equation exploring the effect of respondents’ sociodemographic characteristics on the LVs. For example, the structural equation exploring the effect of respondents’ sociodemographic characteristics on the LV of flexibility (LV1) is formulated in Equation (1) below.
where n = 1 for motorcycles, n = 2 for MBRS, and n = 3 for bus. The notation of λ1.1.n to λ6.1.n is the estimated parameter for gender, age, education, income, vehicle ownership, and driving license, respectively. The notation of ζ1.n is the intercept, and ε1.n is the error terms, which is normally distributed with a zero mean and a standard deviation of σ. A similar equation was also applied to the structural equation for other LVs (LV2 to LV5)
The second equation is a measurement equation, which expresses the relationship between the LVs and their indicators (observed variables). The measurement equation for the LV of flexibility for motorcycles (LV1.1) is shown in Equations (2)–(4).
In the equation, I1.1 shows an observed indicator (i.e., being able to go anytime) for the LV of flexibility for motorcycles (LV1.1). The notation of δ1.1 and η1.1 is the intercept and error term for the observed variable of being able to go anytime, respectively. The error term is normally distributed with a zero mean and a standard deviation of σ. A similar explanation also occurs for I2.1 (an observed indicator of being able to go anywhere) and I3.1 (an observed indicator for not requiring a transfer).
Since the indicators were observed using a five-point Likert scale, we defined four parameters of τi. By considering the symmetric indicators, the two positive parameters (ξm.n.1 and ξm.n.2) are defined as follows: τ1 = −ξm.n.1 − ξm.n.2, τ2 = −ξm.n.1, τ3 = ξm.n.1, and τ4 = ξm.n.1 + ξm.n.2.
Furthermore, the formulation of the utility (U) of the HCM in each transport mode is written according to Equation (5) for motorcycle, Equation (6) for the MBRS, and Equation (7) for city bus.
In the equation, α1 and α2 are the parameter of preference for travel time and cost, while βm.n is the parameter of the LVs. Meanwhile, ω is the intercept of each mode, and ν is the error factor.
The likelihood function in this model is assumed by the components of errors (υ, ε). Meanwhile, f1 and f2 are the indicators and LVs. The likelihood function is defined by Equation (8) as follows:
where P(yi) is the probability of choosing mode I, f2(I) is the function of indicator I, and f1 (LV) is the function of the LV. The coefficient was calculated simultaneously using the Biogeme software.
4. Results and Discussion
Table 6, Table 7, Table 8, Table 9, Table 10, Table 11 and Table 12 show the model results. There were three models in this study. The first was a measurement model explaining the relationship between latent and observed variables constructing the LVs. The second was a structural model revealing the relationship between sociodemographic characteristics and LVs. The last model was the HCM, showing the factors influencing transport mode choices, consisting of LVs, travel time, and travel cost. Each of the models consisted of three transport mode choices: MBRS, motorcycle, and bus. Table 6, Table 7 and Table 8 shows the measurement model for motorcycle, MBRS, and bus, respectively.
Table 6.
Results of the measurement model for motorcycles.
Table 7.
Results of the measurement model for motorcycle-based ride-sourcing (MBRS).
Table 8.
Results of the measurement model for buses.
Table 9.
Results of the structural model for motorcycles.
Table 10.
Results of the structural model for MBRS.
Table 11.
Results of the structural model for buses.
Table 12.
Results of the hybrid choice model.
Based on the Table 6, Table 7 and Table 8 of the measurement model, the parameter estimation related to the LV was positive, as expected. When an LV is positive, an increase in the values of the LV increases the possibility for respondents to “strongly agree” with the questions containing the indicators of the LV.
Furthermore, Table 9, Table 10 and Table 11 shows the structural model for motorcycles, MBRS, and buses, respectively. Table 9 denotes that the sociodemographic conditions affecting the LV of motorcycles were income and vehicle ownership. The higher the respondents’ income, the higher the perceived flexibility of motorcycles. Comparatively, the higher the income, the lower the perceived pro-environment factor and convenience of motorcycles. When the respondents did not have full ownership of a motorcycle, the flexibility, pro-environment factor, and convenience of a motorcycle decreased.
Meanwhile, Table 10 shows that only age had a significant correlation with the lifestyle and security and safety variables of MBRS. That is, the older the student, the lower the lifestyle and perceived safety of MBRS.
Additionally, Table 11 shows that the LVs of perceived travel mode performances were influenced by education, vehicle ownership, and driving license ownership. A previous study in Bandung, Indonesia, also revealed that sociodemograhic factors, including age, gender, education, and income, significantly influenced the perceived performance of travel mode [60]. Meanwhile, this study finding shows that the higher the education, the lower the lifestyle and convenience. Similarly, when the respondents had full ownership of a motorcycle, they perceived lower flexibility, pro-environment, and convenience of buses. Meanwhile, when the respondents did not have full ownership of a driving license, they perceived a lower lifestyle and convenience of buses.
Finally, Table 12 shows the model result of the HCM. When the value of the r-square is 0.502, it means that the considered variables can explain 50.2% of the factors influencing transport mode choices. As expected, travel time and travel cost were negative, meaning that the longer the travel time or the more expensive the travel cost, the lower the utility of the transport mode. The travel time variable with a coefficient of −0.523 was more important than the travel cost variable (coefficient of −0.0619), because the coefficient was greater. That is, the respondents preferred a shorter travel time to more affordable travel costs regarding the trip from home to school or college.
The three LVs included as independent variables in the HCM were also significant and positive, meaning that the higher the assessment of the LVs, the higher the probability of the transport mode to be selected. These three LVs had a greater coefficient/parameter than the coefficient of travel time or cost. This means that the LVs had a more significant effect on transport mode choices than travel time and cost. This finding is consistent with another study focused only on the competition between public transport and MBRS in Yogyakarta [16].
Of the three LVs, the highest coefficient was obtained by the convenience of motorcycles, at 14.4, meaning that motorcycles had a much greater convenience/comfort than buses (2.74). The LV of lifestyle became the determinant for the transportation mode choice of MBRS with a coefficient of 5.73. This suggests that, for students, lifestyles are an important variable to consider, because they must maintain their prestige by following the trend according to the era. A study on MBRS in Yogyakarta also shows a similar result, where feeling in touch with modernity becomes a reason why millennials in that city use MBRS services [14].
5. Conclusions and Policy Recommendations
The purpose of this study was to investigate the travel mode choice for high school and university students in Yogyakarta by including sociodemographic characteristics, travel mode characteristics, and the LV of travel modes’ performances. By applying an HCM and involving 527 respondents, this study produced three important findings. Those findings could be used as a reference in determining the appropriate policies, especially to increase public transport demand in Yogyakarta. First, out of the considered variables, the LV of travel modes’ performances had the highest effect on students’ decisions in using a travel mode. In this case, the LV of perceived convenience influenced the use of buses, and the LV of lifestyle affected the use of MBRS services. Meanwhile, LV of perceived convenience also significantly influenced the choice of private motorcycles. Second, both travel time and cost significantly affected the choice of buses, MBRS services, and private motorcycles, in which the travel times more affected the travel mode decision rather than travel costs. Third, sociodemographic characteristics influenced the LV of transport means’ performances, except for gender. The model results revealed that gender was not correlated with the LVs of all transport means. The variable of age affected the LV of lifestyle in using MBRS. However, the age factor did not affect the perceived convenience of city bus use. Meanwhile, education, income, and vehicle ownership significantly affected the LV of lifestyle in using MBRS, as well as the LV of perceived convenience in using city buses and private motorcycles. Additionally, the factor of driving license ownership also affected the LV of convenience for bus use and the LV of lifestyle for MBRS use, but did not affect the convenience LV of motorcycle use.
Based on the findings, some policy recommendations are proposed to the government to increase passengers’ preference of using city buses in Yogyakarta. First, decreasing the travel time by decreasing the waiting time, decreasing the distance from home to a bus stop, and decreasing in-vehicle travel time should be implemented. The waiting time can be reduced in two ways: developing a real-time bus arrival information system with intelligent transportation systems [87], and adding to the number of buses. Decreasing the distance from home to a bus stop can be achieved by expanding the coverage of bus services in urban areas. In addition, creating a convenient pedestrian pavement to reach the bus stop is also necessary. Meanwhile, decreasing in-vehicle travel time can be achieved by building a bus priority section in intersections or building a special lane for buses. However, choosing which strategies should be prioritized to reduce the travel time of city buses should be determined by conducting a more in-depth study.
Second, competitive prices for city buses should be created to not burden school or college students. At the time when this study was conducted, the ticket price of the Trans Jogja bus was IDR 3500 for a single trip, while the subscription ticket price was IDR 2700 for a single trip for non-students and IDR 1800 for students. These prices are still quite competitive for passengers. The ticket prices of new buses can be raised if passengers gain other new advantages which exceed the extra money they spend on the ticket. The advantages can be in the form of significant reduction of travel time. However, further studies regarding reduced travel time that is worth a price increase should be conducted.
Third, it is important to maintain the convenience of city buses, so passengers do not choose other transport modes. The convenience variable in this study was defined using three indicators, namely big seats, comfortable suspension, and a chance to relax during the trip. Big seats are maintained by focusing on the load factor [88], so the Trans Jogja buses will not be overloaded. Comfortable suspension is ensured by periodical bus maintenance. In addition, bus passengers should be able to relax and perform other activities during the trip, such as using a smartphone. Fourth, since MBRS has become a part of students’ lifestyles, the government needs to ensure the safety of MBRS, such as by creating a safety campaign. Furthermore, for MBRS to contribute to the use of public transport, they should act as a feeder service for city buses if the travel distance is far enough. If the travel distance is higher, the cost of MBRS increase exponentially; therefore, it is better to act as a feeder for long-distance travel. Last, based on the survey results, most motorcycle users did not have a driving license. Therefore, it is crucial to create a campaign for driving license ownership among students. In addition, controlling the number of motorcycle users can lower the rate of accidents and air pollution. These objectives can be achieved by strictly regulating driver’s license tests and creating a cycling campaign. Strictly regulating driving license tests will ensure students’ ability to drive and ride safely on the highways, thus reducing the rate of traffic accidents.
This study has several limitations that need to be considered and followed up for future studies. First, this study used the revealed preference approach; thus, it cannot be used as a simulation of various scenarios. Therefore, future studies should be conducted which use the stated preference approach by providing various scenarios for travel time and cost. Second, we realized that our two-mode alternatives in this study, motorcycle and MBRS, might not be safe, and lead to high vulnerability on the road. Therefore, future studies might also consider the safety aspect, especially considering health care costs, as discussed in Corazza et al. [89]. Third, this study needs to be carried out in other Indonesian cities, since each city has specific characteristics resulting in different travel behavior and travel mode decisions, as discussed and compared by Nugroho et al. [13]. Although this study had several limitations, overall, this study’s results offer important insights as an initial step to improving public transportation in the future, and can guide future research on the topic.
Author Contributions
Conceptualization, R., A.M., M.Z.I. and M.F.; Methodology, R. and M.Z.I. and P.F.B.; Formal analysis, R., A.M. and M.Z.I.; Investigation, R.; Writing—original draft, R. and M.Z.I.; Writing—review and editing, M.Z.I. All authors have read and agreed to the published version of the manuscript.
Funding
This study was self-funded by Universitas Janabadra.
Institutional Review Board Statement
The study was conducted according to the guidelines of the Declaration of Helsinki, and approved by the Institutional Review Board (or Ethics Committee) of Universitas Islam Indonesia.
Informed Consent Statement
Informed consent was obtained from all subjects involved in the study.
Data Availability Statement
Not applicable.
Conflicts of Interest
The authors declare no conflict of interest.
References
- Sanchez, T.W. Poverty, Policy, and Public Transportation. Transp. Res. Part A Policy Pract. 2008, 42, 833–841. [Google Scholar] [CrossRef]
- Irawan, M.Z.; Bastarianto, F.F.; Rizki, M.; Belgiawan, P.F.; Joewono, T.B. Exploring the Frequency of Public Transport Use among Adolescents: A Study in Yogyakarta, Indonesia. Int. J. Sustain. Transp. 2021, 1–11. [Google Scholar] [CrossRef]
- Shrestha, B.P.; Millonig, A.; Hounsell, N.B.; McDonald, M. Review of Public Transport Needs of Older People in European Context. J. Popul. Ageing 2017, 10, 343–361. [Google Scholar] [CrossRef] [PubMed]
- Wahyuni, E.S.; Murti, B.; Joebagio, H. Public Transport Accessibility for People with Disabilities. J. Health Policy Manag. 2016, 1, 1–7. [Google Scholar] [CrossRef]
- de Ortuzar, J.D.; Willumsen, L.G. Modelling Transport, 4th ed.; John Wiley & Sons: West Sussex, UK, 2011; ISBN 9781119993315. [Google Scholar]
- Currie, G.; Wallis, I. Effective Ways to Grow Urban Bus Markets—A Synthesis of Evidence. J. Transp. Geogr. 2008, 16, 419–429. [Google Scholar] [CrossRef]
- Ke, F. What Makes People Use Public Transport? Available online: https://www.weforum.org/agenda/2015/03/what-makes-people-use-public-transport/ (accessed on 24 April 2020).
- Sadowsky, N.; Nelson, E. The Impact of Ride-Hailing Services on Public Transportation Use: A Discontinuity Regression Analysis; Economics Department Working Paper Series; Bowdoin Digital Commons: Brunswick, ME, USA, 2017; Available online: https://digitalcommons.bowdoin.edu/cgi/viewcontent.cgi?article=1012&context=econpapers (accessed on 13 April 2022).
- Circella, G.; Alemi, F. Transport Policy in the Era of Ridehailing and Other Disruptive Transportation Technologies, 1st ed.; Elsevier Inc.: Amsterdam, The Netherlands, 2018; Volume 1. [Google Scholar]
- Rayle, L.; Dai, D.; Chan, N.; Cervero, R.; Shaheen, S. Just a Better Taxi? A Survey-Based Comparison of Taxis, Transit, and Ridesourcing Services in San Francisco. Transp. Policy 2016, 45, 168–178. [Google Scholar] [CrossRef]
- Schwieterman, J.; Smith, C.S. Sharing the Ride: A Paired-Trip Analysis of Uber Pool and Chicago Transit Authority Services in Chicago, Illinois. Res. Transp. Econ. 2018, 71, 9–16. [Google Scholar] [CrossRef]
- Yan, X.; Levine, J.; Zhao, X. Integrating Ridesourcing Services with Public Transit: An Evaluation of Traveler Responses Combining Revealed and Stated Preference Data. Transp. Res. Part C Emerg. Technol. 2018, 105, 683–696. [Google Scholar] [CrossRef]
- Nugroho, S.B.; Zusman, E.; Nakano, R. Explaining the Spread of Online Taxi Services in Semarang, Bogor and Bandung, Indonesia; a Discrete Choice Analysis. Travel Behav. Soc. 2020, 20, 358–369. [Google Scholar] [CrossRef]
- Irawan, M.Z.; Rizki, M.; Chalermpong, S.; Kato, H. Mapping the Motorcycle-Based Ride-Hailing Users in Yogyakarta: An Analysis of Socio-Economic Factors and Preferences. Asian Transp. Stud. 2022, 8, 100073. [Google Scholar] [CrossRef]
- Irawan, M.Z.; Bastarianto, F.F.; Dewanti; Sugiarto, S.; Rizka Fahmi Amrozi, M. Measuring the Perceived Need for Motorcycle-Based Ride-Hailing Services on Trip Characteristics among University Students in Yogyakarta, Indonesia. Travel Behav. Soc. 2021, 24, 303–312. [Google Scholar] [CrossRef]
- Irawan, M.Z.; Belgiawan, P.F.; Joewono, T.B.; Simanjuntak, N.I.M. Do Motorcycle-Based Ride-Hailing Apps Threaten Bus Ridership? A Hybrid Choice Modeling Approach with Latent Variables. Public Transp. 2019, 12, 207–231. [Google Scholar] [CrossRef]
- Stankov, I.; Garcia, L.M.T.; Mascolli, M.A.; Montes, F.; Meisel, J.D.; Gouveia, N.; Sarmiento, O.L.; Rodriguez, D.A.; Hammond, R.A.; Caiaffa, W.T.; et al. A Systematic Review of Empirical and Simulation Studies Evaluating the Health Impact of Transportation Interventions. Environ. Res. 2020, 186, 109519. [Google Scholar] [CrossRef] [PubMed]
- Khaerunnisa, S.H. The Route and Bus Stop Plan of Agglomeration Transportation on Educational Facility in Yogyakarta Urban Agglomeration Area. J. Civ. Eng. Forum 2020, 7, 23–36. [Google Scholar] [CrossRef]
- Irawan, M.Z. Perceived Disadvantages or Motorized Vehicle Use Habit? Investigating Obstacles in Bicycle Use among Adolescents in Yogyakarta, Indonesia. Transp. Res. Interdiscip. Perspect. 2022, 14, 100595. [Google Scholar] [CrossRef]
- Irawan, M.Z.; Sumi, T. Motorcycle-Based Adolescents’ Travel Behaviour during the School Morning Commute and the Effect of Intra-Household Interaction on Departure Time and Mode Choice. Transp. Plan. Technol. 2012, 35, 263–279. [Google Scholar] [CrossRef]
- Marquet, O.; Miralles-Guasch, C. City of Motorcycles. on How Objective and Subjective Factors Are behind the Rise of Two-Wheeled Mobility in Barcelona. Transp. Policy 2016, 52, 37–45. [Google Scholar] [CrossRef]
- Wheelen, D. Global Motorcycle Sales Growth Stumbled in 2019. Available online: https://www.rideapart.com/news/402593/global-motorcycle-sales-growth-stunted-2019/ (accessed on 5 November 2021).
- Guerra, E. Electric Vehicles, Air Pollution, and the Motorcycle City: A Stated Preference Survey of Consumers’ Willingness to Adopt Electric Motorcycles in Solo, Indonesia. Transp. Res. Part D Transp. Environ. 2019, 68, 52–64. [Google Scholar] [CrossRef]
- Tosi, J.D.; Poó, F.M.; Ledesma, R.D.; Firsenko, E. Safety of Child Passengers Who Ride to School on a Motorcycle: An Observational Study in Two Argentine Cities. IATSS Res. 2021, 45, 176–181. [Google Scholar] [CrossRef]
- Mirbaha, B.; Mohajeri, F. Investigating the Strategies for Reducing Motorcycle Mode Choice in Urban Trips: Case Study of Tehran City. Transp. Res. Rec. 2019, 2673, 58–69. [Google Scholar] [CrossRef]
- Fevriera, S.; de Groot, H.L.F.; Mulder, P. Does Urban Form Affect Motorcycle Use? Evidence from Yogyakarta, Indonesia; Taylor & Francis: Oxfordshire, UK, 2021; Volume 57, ISBN 0000000295789. [Google Scholar]
- Transaid. An Introductory Webinar on the Topic of Motorcycle Taxis in the Rural Context of Sub-Saharan Africa and South Asia; Transaid: London, UK, 2017; pp. 1–57. [Google Scholar]
- Suatmadi, A.Y.; Creutzig, F.; Otto, I.M. On-Demand Motorcycle Taxis Improve Mobility, Not Sustainability. Case Stud. Transp. Policy 2019, 7, 218–229. [Google Scholar] [CrossRef]
- Truong, L.T.; Nguyen, H.T.T. Mobile Phone Related Crashes among Motorcycle Taxi Drivers. Accid. Anal. Prev. 2019, 132, 1–7. [Google Scholar] [CrossRef] [PubMed]
- Risdiyanto; Munawar, A.; Irawan, M.Z.; Nugraha, A.A. Model Selection of Online Motorcycle Taxi and Motorcycle Modes on Work Trips. In Proceedings of the IOP Conference Series: Materials Science and Engineering, Jakarta, Indonesia, 3–4 August 2020; Volume 1007, pp. 4–10. [Google Scholar]
- Nguyen, M.H. Evaluating the Service Quality of the First Bus Rapid Transit Corridor in Hanoi City and Policy Implications; Springer: Cham, Switzerland, 2021; Volume 108, ISBN 9783030602697. [Google Scholar]
- Nadeem, M.; Azam, M.; Asim, M.; Al-Rashid, M.A.; Puan, O.C.; Campisi, T. Does Bus Rapid Transit System (Brts) Meet the Citizens’ Mobility Needs? Evaluating Performance for the Case of Multan, Pakistan. Sustainability 2021, 13, 7314. [Google Scholar] [CrossRef]
- de Dios Ortúzar, J. Future Transportation: Sustainability, Complexity and Individualization of Choices. Commun. Transp. Res. 2021, 1, 100010. [Google Scholar] [CrossRef]
- Le, T.P.L.; Trinh, T.A. Encouraging Public Transport Use to Reduce Traffic Congestion and Air Pollutant: A Case Study of Ho Chi Minh City, Vietnam. Procedia Eng. 2016, 142, 236–243. [Google Scholar] [CrossRef]
- Baidoo, I.K.; Nyarko, E. Stated Preference Modeling for a Preferred Transportation Mode. Methodology 2015, 5, 134–140. [Google Scholar]
- Zhang, Y.; Guo, H.; Li, C.; Wang, W.; Jiang, X.; Liu, Y. Which One Is More Attractive to Traveler, Taxi or Tailored Taxi? An Empirical Study in China. Procedia Eng. 2016, 137, 867–875. [Google Scholar] [CrossRef]
- Anwar, A.H.M.M.; Yang, J. Examining the Effects of Transport Policy on Modal Shift from Private Car to Public Bus. Procedia Eng. 2017, 180, 1413–1422. [Google Scholar] [CrossRef]
- Laloma, A.; Rompis, S.Y.R.; Jefferson, L. Pengaruh Angkutan Online Terhadap Pemilihan Moda Transportasi Publik Di Kota Manado (Studi Kasus: Trayek Malalayang—Pusat Kota). J. Sipil Statik 2018, 6, 541–552. [Google Scholar]
- Habib, K.N. Mode Choice Modelling for Hailable Rides: An Investigation of the Competition of Uber with Other Modes by Using an Integrated Non-Compensatory Choice Model with Probabilistic Choice Set Formation. Transp. Res. Part A Policy Pract. 2019, 129, 205–216. [Google Scholar] [CrossRef]
- Si, Y.; Guan, H.; Cui, Y. Research on The Choice Behavior of Taxis and Express Services Based on The SEM-Logit Model. Sustainability 2019, 11, 2974. [Google Scholar] [CrossRef]
- Han, Y.; Li, W.; Wei, S.; Zhang, T. Research on Passenger’s Travel Mode Choice Behavior Waiting at Bus Station Based on SEM-Logit Integration Model. Sustainability 2018, 10, 1996. [Google Scholar] [CrossRef]
- Aguilera-García, Á.; Manuel Vassallo, J. Ridesourcing vs. Traditional Taxi Services: Understanding Users’ Choices and Preferences in Spain. Transp. Res. Part A Policy Pract. 2022, 155, 161–178. [Google Scholar] [CrossRef]
- Bouscasse, H. Integrated Choice and Latent Variable Models: A Integrated Choice and Latent Variable; Grenoble Applied Economics Laboratory: Grenoble, France, 2018. [Google Scholar]
- Johansson, M.V.; Heldt, T. The Effects of Attitudes and Personality Traits on Mode Choice. Transp. Res. Part A 2006, 40, 507–525. [Google Scholar] [CrossRef]
- Chen, J.; Li, S. Mode Choice Model for Public Transport with Categorized Latent Variables. Math. Probl. Eng. 2017, 2017, 7861945. [Google Scholar] [CrossRef]
- Masoumi, H.E. A Discrete Choice Analysis of Transport Mode Choice Causality and Perceived Barriers of Sustainable Mobility in the MENA Region. Transp. Policy 2019, 79, 37–53. [Google Scholar] [CrossRef]
- Temme, D.; Paulssen, M.; Dannewald, T. Incorporating Latent Variables in to Discrete Choice Models—A Simultaneous Estimation Approach Using SEM Software. Bus. Res. 2008, 1, 220–237. [Google Scholar] [CrossRef]
- Plavara Alex, A.; Vasudevan Saraswathy, M.; Palampoikayil Isaac, K. Latent Variable Enriched Mode Choice Model for Work Activity in Multi Modal Condition Prevalent in India. Int. J. Traffic Transp. Eng. 2016, 6, 378–389. [Google Scholar] [CrossRef]
- Kim, E.J. Analysis of Travel Mode Choice in Seoul Using an Interpretable Machine Learning Approach. J. Adv. Transp. 2021, 2021, 6685004. [Google Scholar] [CrossRef]
- Zheng, Y.; Wang, S.; Zhao, J. Equality of Opportunity in Travel Behavior Prediction with Deep Neural Networks and Discrete Choice Models. Transp. Res. Part C Emerg. Technol. 2021, 132, 103410. [Google Scholar] [CrossRef]
- Bahamonde-Birke, F.J.; Hanappi, T. The Potential of Electromobility in Austria: Evidence from Hybrid Choice Models under the Presence of Unreported Information. Transp. Res. Part A Policy Pract. 2016, 83, 30–41. [Google Scholar] [CrossRef]
- Kim, J.; Rasouli, S.; Timmermans, H. Expanding Scope of Hybrid Choice Models Allowing for Mixture of Social Influences and Latent Attitudes: Application to Intended Purchase of Electric Cars. Transp. Res. Part A Policy Pract. 2014, 69, 71–85. [Google Scholar] [CrossRef]
- Valeri, E.; Cherchi, E. Does Habitual Behavior Affect the Choice of Alternative Fuel Vehicles? Int. J. Sustain. Transp. 2016, 10, 825–835. [Google Scholar] [CrossRef]
- Etzioni, S.; Daziano, R.A.; Ben-Elia, E.; Shiftan, Y. Preferences for Shared Automated Vehicles: A Hybrid Latent Class Modeling Approach. Transp. Res. Part C Emerg. Technol. 2021, 125, 103013. [Google Scholar] [CrossRef]
- Kolarova, V.; Cherchi, E. Impact of Trust and Travel Experiences on the Value of Travel Time Savings for Autonomous Driving. Transp. Res. Part C Emerg. Technol. 2021, 131, 103354. [Google Scholar] [CrossRef]
- Manca, F.; Sivakumar, A.; Polak, J.W. Capturing the Effect of Multiple Social Influence Sources on the Adoption of New Transport Technologies and Services. J. Choice Model. 2022, 42, 100344. [Google Scholar] [CrossRef]
- Kim, S.; Rasouli, S. The Influence of Latent Lifestyle on Acceptance of Mobility-as-a-Service (MaaS): A Hierarchical Latent Variable and Latent Class Approach. Policy Pract. 2022, 159, 304–319. [Google Scholar] [CrossRef]
- Andani, I.G.A.; La Paix Puello, L.; Geurs, K. Modelling Effects of Changes in Travel Time and Costs of Toll Road Usage on Choices for Residential Location, Route and Travel Mode across Population Segments in the Jakarta-Bandung Region, Indonesia. Transp. Res. Part A Policy Pract. 2021, 145, 81–102. [Google Scholar] [CrossRef]
- Schmid, B.; Axhausen, K.W. In-Store or Online Shopping of Search and Experience Goods: A Hybrid Choice Approach. J. Choice Model. 2019, 31, 156–180. [Google Scholar] [CrossRef]
- Belgiawan, P.F.; Joewono, T.B.; Irawan, M.Z. Determinant Factors of Ride-Sourcing Usage: A Case Study of Ride-Sourcing in Bandung, Indonesia. Case Stud. Transp. Policy 2022. [Google Scholar] [CrossRef]
- Márquez, L.; Pico, R.; Cantillo, V. Understanding Captive User Behavior in the Competition between BRT and Motorcycle Taxis. Transp. Policy 2018, 61, 1–9. [Google Scholar] [CrossRef]
- Morikawa, T.; Ben-Akiva, M.; McFadden, D. Discrete Choice Models Incorporating Revealed Preferences and Psychometric Data. Adv. Econom. 2002, 16, 29–55. [Google Scholar] [CrossRef]
- Tao, S.; Corcoran, J.; Mateo-Babiano, I. Modelling Loyalty and Behavioural Change Intentions of Busway Passengers: A Case Study of Brisbane, Australia. IATSS Res. 2017, 41, 113–122. [Google Scholar] [CrossRef]
- Henser, D.A.; Rose, J.M.; Greene, W.H. Applied Choice Analysis, 1st ed.; Cambridge University Press: New York, NY, USA, 2005. [Google Scholar]
- Irawan, M.Z. Exploring the Performance of TransJogja Bus and the Behavior of Its Passengers. In Proceedings of the 5th International Conference on Science and Technology, Yogyakarta, Indonesia, 30–31 July 2019; Volume 1, pp. 1–6. [Google Scholar] [CrossRef]
- Ghani, M.N.N.; Ahmad, M.Z.; Tan, S. Transportation mode choice: Are latent factors important? Proc. East. Asia Soc. Transp. Stud. 2007, 6, 894–904. [Google Scholar]
- Bilge, A.; Glerum, A.; Bierlaire, M. Mode Choice with Attitudinal Latent Class: A Swiss Case Study. In Proceedings of the Second International Choice Modeling Conference, Leeds, UK, 4–6 July 2011; pp. 1–16. [Google Scholar]
- Nikitas, A.; Karlsson, M. A Worldwide State-of-the-Art Analysis for Bus Rapid Transit: Looking for the Success Formula. J. Public Transp. 2015, 18, 1–33. [Google Scholar] [CrossRef]
- Cheng, G.; Zhao, S.; Li, J. The Effects of Latent Attitudinal Variables and Sociodemographic Differences on Travel Behavior in Two Small, Underdeveloped Cities in China. Sustainability 2019, 11, 1306. [Google Scholar] [CrossRef]
- Van Lierop, D.; Badami, M.G.; El-Geneidy, A.M. What Influences Satisfaction and Loyalty in Public Transport? A Review of the Literature. Transp. Rev. 2018, 38, 52–72. [Google Scholar] [CrossRef]
- Daziano, R.A.; Rizzi, L.I. Analyzing the Impact of a Fatality Index on a Discrete, Interurban Mode Choice Model with Latent Safety, Security, and Comfort. Saf. Sci. 2015, 78, 11–19. [Google Scholar] [CrossRef]
- Currie, G.; Delbosc, A. Spiral Plot Analysis of Variation in Perceptions of Urban Public Transport Performance between International Cities. Transp. Res. Rec. J. Transp. Res. Board 2015, 2538, 54–64. [Google Scholar] [CrossRef]
- Chaudhry, B.; El-amine, S.; Shakshuki, E. Passenger Safety in Ride-Sharing Services. Procedia Comput. Sci. 2018, 130, 1044–1050. [Google Scholar] [CrossRef]
- Li, J.; Chen, X.; Li, X.; Guo, X. Evaluation of Public Transportation Operation Based on Data Envelopment Analysis. Procedia-Soc. Behav. Sci. 2013, 96, 148–155. [Google Scholar] [CrossRef]
- Beirão, G.; Sarsfield Cabral, J.A. Understanding Attitudes towards Public Transport and Private Car: A Qualitative Study. Transp. Policy 2007, 14, 478–489. [Google Scholar] [CrossRef]
- Prasad, P.; Maitra, B. Identifying Areas of Interventions for Improvement of Shared Modes for School Trips. Transp. Res. Part A Policy Pract. 2019, 121, 122–135. [Google Scholar] [CrossRef]
- Miller, P.; de Barros, A.G.; Kattan, L.; Wirasinghe, S.C. Analyzing the Sustainability Performance of Public Transit. Transp. Res. Part D Transp. Environ. 2016, 44, 177–198. [Google Scholar] [CrossRef]
- Lai, W.T.; Chen, C.F. Behavioral Intentions of Public Transit Passengers-The Roles of Service Quality, Perceived Value, Satisfaction and Involvement. Transp. Policy 2011, 18, 318–325. [Google Scholar] [CrossRef]
- Aminzadegan, S.; Shahriari, M.; Mehranfar, F.; Abramović, B. Factors Affecting the Emission of Pollutants in Different Types of Transportation: A Literature Review. Energy Rep. 2022, 8, 2508–2529. [Google Scholar] [CrossRef]
- Acharjee, A.; Pratim Sarkar, P.; Pal, J. Effect of Socioeconomic and Latent Variables in Vehicle Ownership: A Case Study of Agartala City, India. Int. J. Eng. Technol. 2017, 7, 472. [Google Scholar] [CrossRef][Green Version]
- Kurniawan, D.A. Mengapa Kendaraan Pribadi Terus Bertumbuh? Available online: https://pustral.ugm.ac.id/2017/10/05/mengapa-kendaraan-pribadi-terus-bertumbuh/ (accessed on 13 July 2020).
- Chicago Transit Authority CTA Board Approves New Service Standards. Available online: https://www.transitchicago.com/cta-board-approves-new-service-standards/ (accessed on 13 April 2022).
- Liu, Y.; Lyu, C.; Liu, Z.; Cao, J. Exploring a Large-Scale Multi-Modal Transportation Recommendation System. Transp. Res. Part C Emerg. Technol. 2021, 126, 103070. [Google Scholar] [CrossRef]
- Israel, G.D. Determining Sample Size; University of Florida Cooperative Extension Service, Institute of Food and Agriculture Sciences, EDIS: Gainesville, FL, USA, 1992; Volume 10. [Google Scholar]
- Koppelman, F.S.; Chu, C. Effect of Sample Size on Disaggregate Choice Model Estimation and Prediction; Transportation Research Record; The National Academies of Sciences, Engineering, and Medicine: Washington, DC, USA, 1983; pp. 60–69. [Google Scholar]
- Ben-akiva, M.; McFadden, D.; Train, K.; Walker, J.; Bhat, C.; Bierlaire, M.; Bolduc, D.; Boersch-Supan, A.; Brownstone, D.; Bunch, D.S.; et al. Hybrid Choice Models: Progress and Challenges. Mark. Lett. 2002, 13, 163–175. [Google Scholar] [CrossRef]
- Zhou, X.M.; Yang, X.G. Study of Dispatching at Minimum Waiting Time of Public Transportation Transfer under the Condition of ITS. Zhongguo Gonglu Xuebao/China J. Highw. Transp. 2004, 17, 82. [Google Scholar]
- Shen, X.; Feng, S.; Li, Z.; Hu, B. Analysis of Bus Passenger Comfort Perception Based on Passenger Load Factor and In-Vehicle Time. Springerplus 2016, 5, 1–10. [Google Scholar] [CrossRef] [PubMed]
- Corazza, M.V.; Musso, A.; Finikopoulos, K.; Sgarra, V. A Methodology for the Evaluation of Road Accidents Health Care Costs for Powered Two-Wheelers: The Rome Case Study. Case Stud. Transp. Policy 2017, 5, 417–424. [Google Scholar] [CrossRef]


Publisher’s Note: MDPI stays neutral with regard to jurisdictional claims in published maps and institutional affiliations. |
© 2022 by the authors. Licensee MDPI, Basel, Switzerland. This article is an open access article distributed under the terms and conditions of the Creative Commons Attribution (CC BY) license (https://creativecommons.org/licenses/by/4.0/).