Article

Predicting the Effects of Land Use Land Cover and Climate Change on Munneru River Basin Using CA-Markov and Soil and Water Assessment Tool

by
Kotapati Narayana Loukika
1,
Venkata Reddy Keesara
1,
Eswar Sai Buri
1 and
Venkataramana Sridhar
2,*
1
Department of Civil Engineering, National Institute of Technology, Warangal 506004, India
2
Department of Biological Systems Engineering, Virginia Polytechnic Institute and State University, Blacksburg, VA 24061, USA
*
Author to whom correspondence should be addressed.
Sustainability 2022, 14(9), 5000; https://doi.org/10.3390/su14095000
Submission received: 25 February 2022 / Revised: 31 March 2022 / Accepted: 19 April 2022 / Published: 21 April 2022
(This article belongs to the Section Sustainable Water Management)

Abstract

:
It is important to understand how changing climate and Land Use Land Cover (LULC) will impact future spatio-temporal water availability across the Munneru river basin as it aids in effective water management and adaptation strategies. The Munneru river basin is one of the important sub-basins of the Krishna River in India. In this paper, the combined impact of LULC and Climate Change (CC) on Munneru water resources using the Soil and Water Assessment Tool (SWAT) is presented. The SWAT model is calibrated and validated for the period 1983–2017 in SWAT-CUP using the SUFI2 algorithm. The correlation coefficient between observed and simulated streamflow is calculated to be 0.92. The top five ranked Regional Climate Models (RCMs) are ensembled at each grid using the Reliable Ensemble Averaging (REA) approach. Predicted LULC maps for the years 2030, 2050 and 2080 using the CA-Markov model revealed increases in built-up and kharif crop areas and decreases in barren lands. The average monthly streamflows are simulated for the baseline period (1983–2005) and for three future periods, namely the near future (2021–2039), mid future (2040–2069) and far future (2070–2099) under Representation Concentration Pathway (RCP) 4.5 and 8.5 climate change scenarios. Streamflows increase in three future periods when only CC and the combined effect of CC and LULC are considered under RCP 4.5 and RCP 8.5 scenarios. When compared to the CC impact in the RCP 4.5 scenario, the percentage increase in average monthly mean streamflow (July–November) with the combined impact of CC and LULC is 33.9% (near future), 35.8% (mid future), and 45.3% (far future). Similarly, RCP 8.5 increases streamflow by 33.8% (near future), 36.5% (mid future), and 38.8% (far future) when compared to the combined impact of CC and LULC with only CC. When the combined impact of CC and LULC is considered, water balance components such as surface runoff and evapotranspiration increase while aquifer recharge decreases in both scenarios over the three future periods. The findings of this study can be used to plan and develop integrated water management strategies for the basin with projected LULC under climate change scenarios. This methodology can be applied to other basins in similar physiographic regions.

1. Introduction

Increased greenhouse gas (GHG) emissions alter hydrological conditions such as global temperature, triggering a chain of events that impact streamflow, evapotranspiration, precipitation patterns, runoff, soil moisture, flood and drought severity. Climate change, in addition to global warming, may place further strain on water resources. It is certain that climate change and land use change will have a substantial impact on a basin’s hydrology, and the relationship between them is complex in nature [1,2]. Runoff, infiltration of groundwater, evaporation and demand for water are all affected by Land Use and Land Cover (LULC). These factors influence surface and groundwater yields, and consequently the amount of available water for the functioning of ecosystem and human use. Land use and climate change, as well as rising water demand, are all having an impact on water and energy budgets and water supplies [3]. As a result, one of the most difficult tasks in hydrological research is determining the effects of changing LULC and climate on hydrological processes [4]. Furthermore, in many river basins, LULC and climate change (both anthropogenic and natural) are altering the hydrological cycle and the water supply [5,6,7,8].
The effects of LULC and climate change on watershed hydrology have been studied extensively [5,9,10,11,12]. However, the majority of the studies focused solely on climate change [13,14,15,16] found that there exists an imbalance between water supply and demand which has been increasing under climate and LULC change in recent years and has attracted attention from both the relevant authorities and the general public to water resource planning and management programs. To manage the surplus runoff in order to meet the demands in the crucial months for the Kharif crop, rainwater collection techniques must be employed [17].
Hydrological models are being used more to predict and understand hydrological processes [18,19]. These models are frequently developed for a variety of reasons, including water demand estimation, understanding of hydrological processes, assessing flood risk, and so on, as well as for distinct geographic regions. The Soil and Water Assessment Tool (SWAT) model has been widely used to examine the effects of climate change on water resources [16,20,21,22,23,24,25].
Future streamflow projections in various climate change scenarios have been studied [26]. A case study on the Goodwater Creek experiment watershed in Missouri was conducted to estimate the long-term impact of climate change using ensemble models of gridded downscaled precipitation and temperature data sets [27]. The results show that increased surface runoff, spring precipitation, and water yield have caused a shift in the peak value of evapotranspiration in the future period one month earlier. The analysis of water balance components and streamflow in the Bharalu (urban) and Basistha (rural) basins near the Brahmaputra River in India found that streamflow, water yield, surface runoff, and actual evapotranspiration increased in the Bharalu basin in the 2050 and 2090 decades, while they decreased in the Basistha basin [15]. The impact of climate change on streamflow in Nepal’s Bheri river basin was studied, with annual streamflow estimated to rise by 6–12.5% when compared to historical data. On a monthly basis, however, runoff will decrease by up to 20% in July and August and increase by up to 70% during the dry season, which is beneficial to water users [14].
Several researchers have investigated at the combined impact of LULC change and climate change on the quantity and quality of water resources [9,10,28]. The sensitivity of ecologically relevant flows to the effects of LULC and climate change, as well as individual impacts, was investigated in the rapidly urbanizing Alabama watershed, USA [11], the Snake River basin, Idaho [29] and the Tungabhadra basin [30]. The results showed that more frequent floods [31], droughts [32,33], landslides [34], and shifts in annual extreme streamflow are predicted to occur in the future, which will have a negative impact on aquatic species. To manage water resources, an integrated basin-scale hydrologic model that takes both changes into account is a good option.
This paper presented an analysis of streamflow in the Munneru river basin, one of the most vulnerable sub-basins of the Krishna River basin in India due to LULC and climate change. For this study, a SWAT model with observed streamflow for the period is used (1980–2017). An integrated strategy is employed to project future streamflows considering both LULC and climate change influences for three future periods with the help of Multi-Model Ensemble (MME) outputs of precipitation and temperature data and predicted LULC maps using the CA-Markov model. For future scenarios, a spatio-temporal analysis of projected streamflows for the combined effects of LULC and climate change has been performed.

2. Study Area

The Krishna River is the second-largest eastward-flowing interstate river in peninsular India. The Munneru River is a major left-bank tributary of the Krishna River. The total catchment area of the basin is 9854 km2. The basin is situated between eastern longitudes 79.2° to 80.8° and northern latitudes 16.6° to 18.1° in the states of Telangana and Andhra Pradesh. The basin’s dominant soils are red soils followed by black soils. Rice, cotton, and maize are the dominant crops in this basin. The Central Water Commission (CWC) maintains two gauge stations in Keesara and Madhira villages to measure gauge, discharge, sedimentation, and qualitative aspects of the water (http://www.cwc.gov.in/kgbo (accessed on 10 April 2022)). The river network in the study area is shown in Figure 1. As part of the BRICS collaborative project between Brazil, India, and South Africa, this basin is being studied from the Indian side in order to develop an integrated water resources management model under anthropogenic and climate change scenarios.

3. Data Used

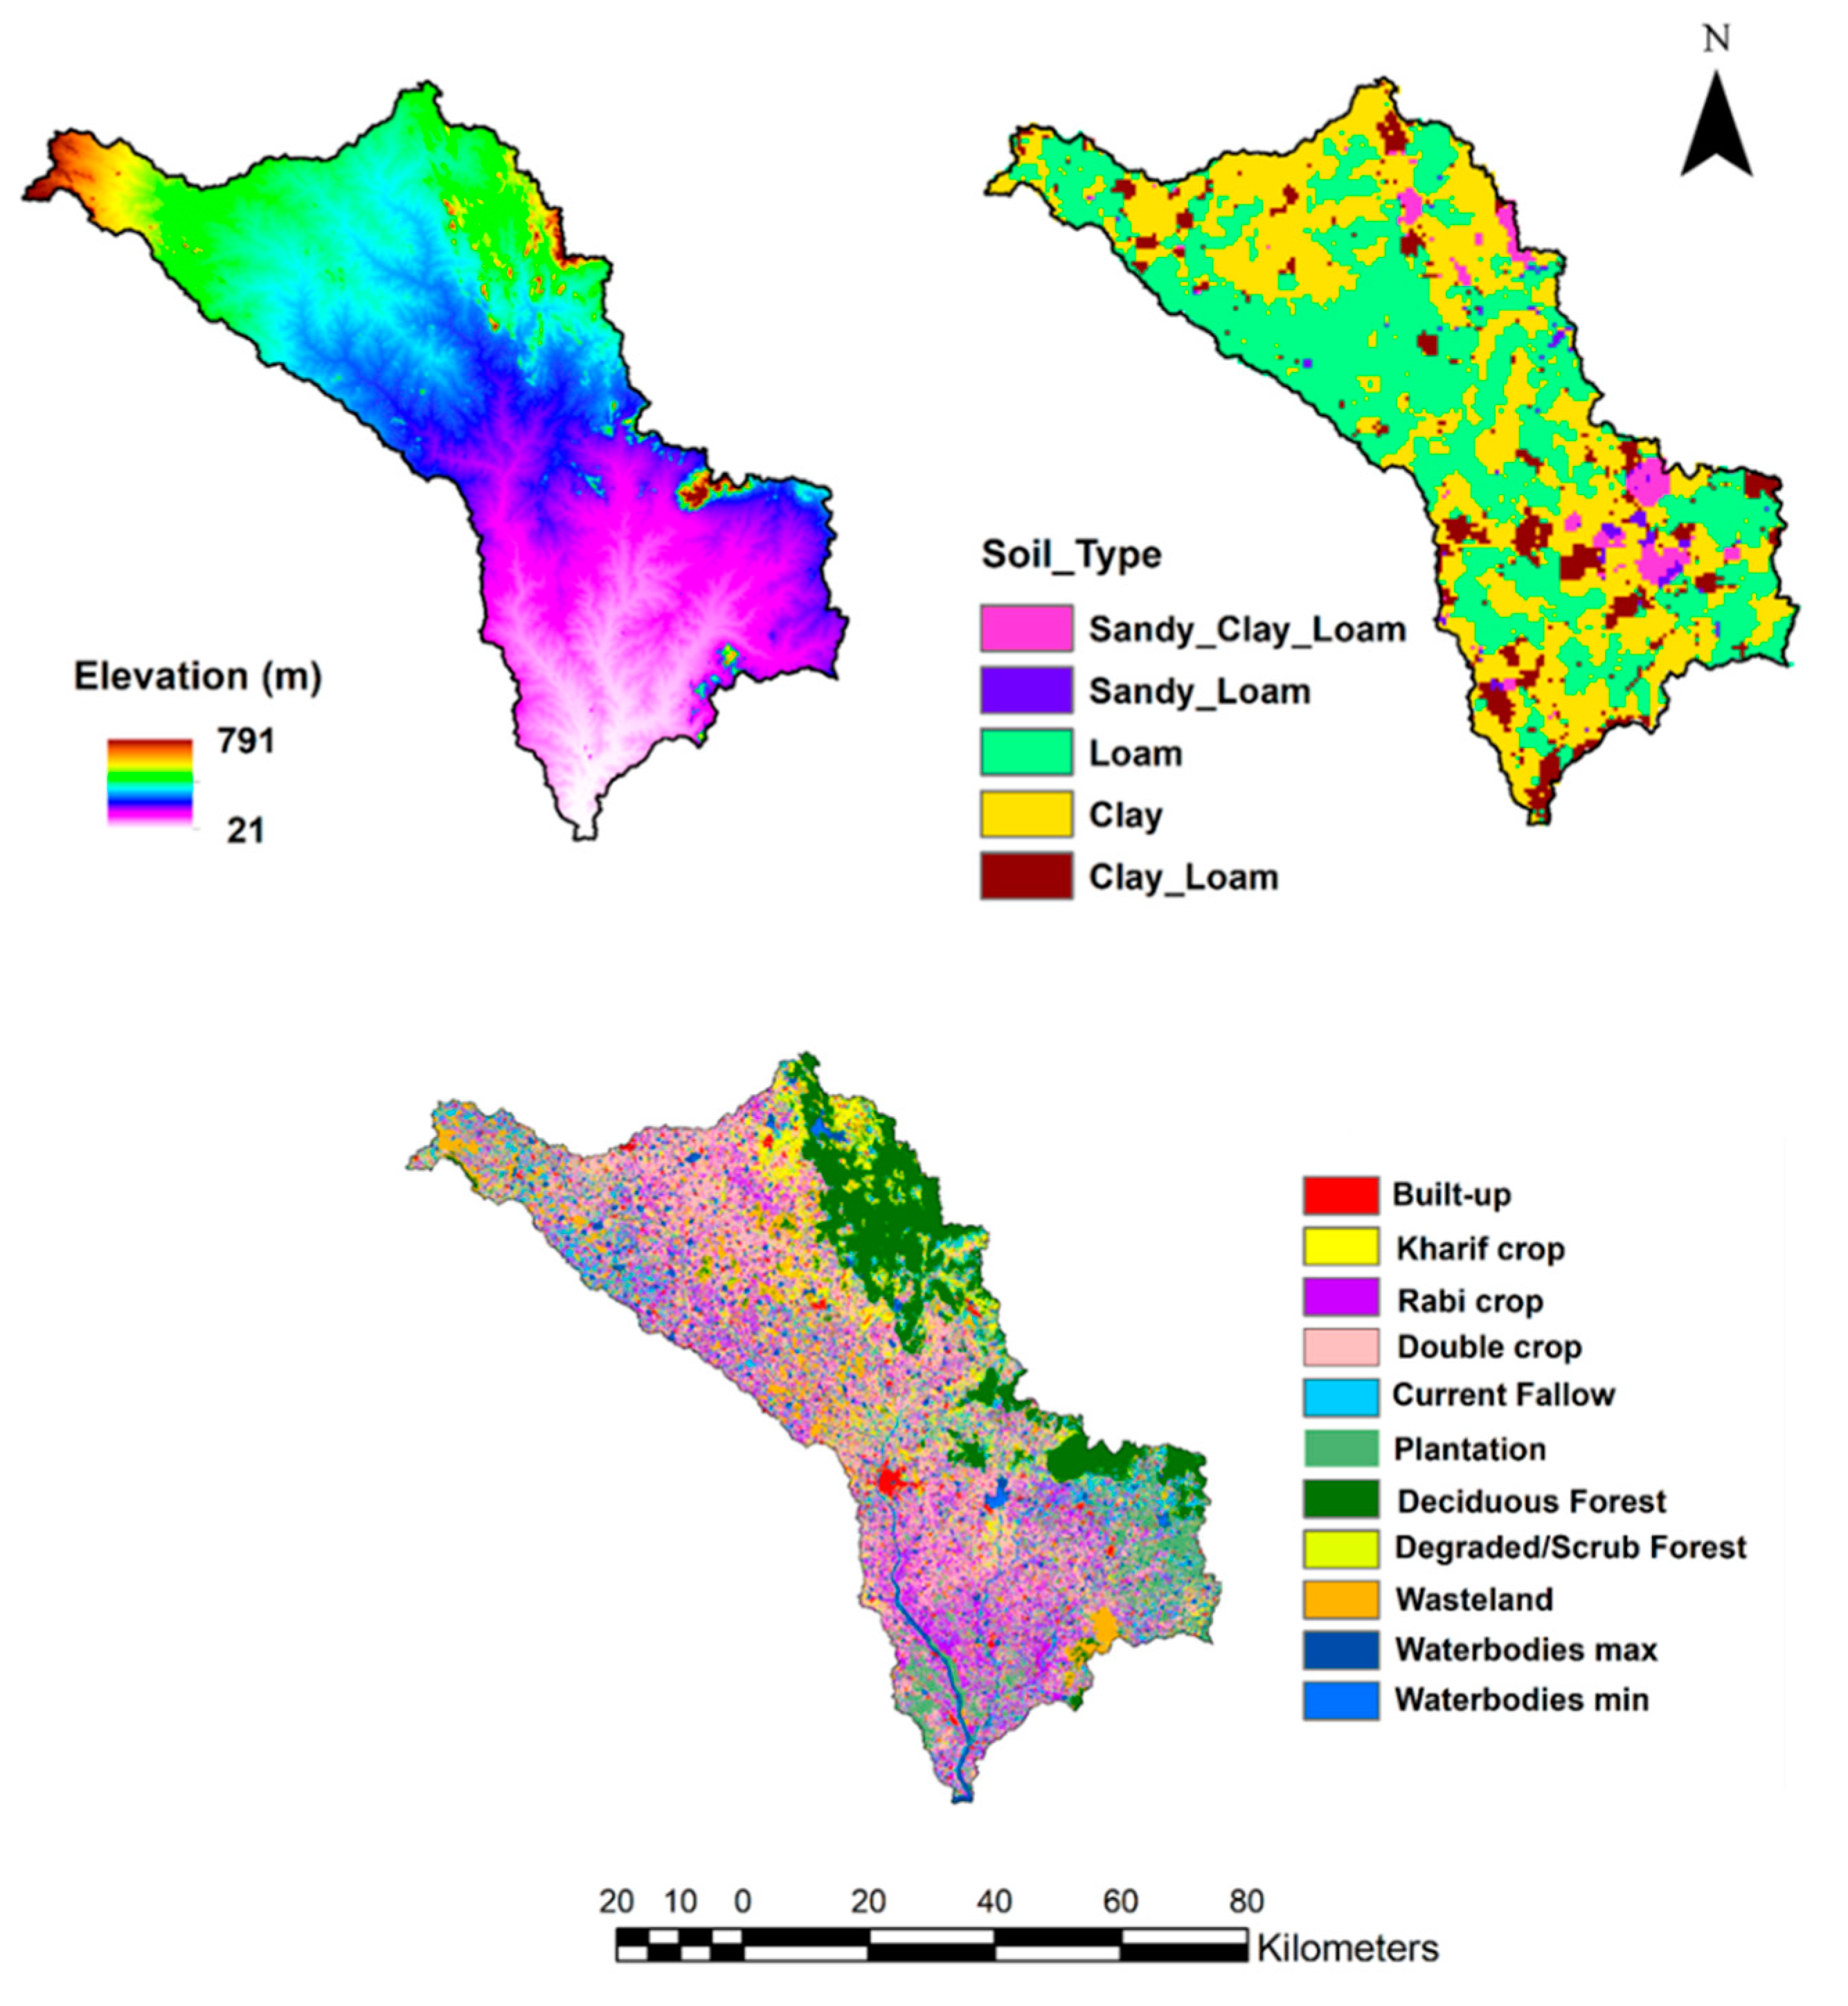
The observed daily precipitation (1901–2020), maximum and minimum temperature (1951–2020), were collected from the Indian Meteorological Department (IMD) in Pune, India. The NEX–GDDP climate datasets, derived from the Coupled Model Intercomparison Project Phase 5 (CMIP5), include downscaled, bias-corrected projections for RCP 4.5 and RCP 8.5 scenarios for 21 different RCMs. Climate model projections include daily precipitation, maximum and minimum temperature data for the baseline (1950–2005) and future periods (2006–2099) with a spatial resolution of 0.25 degrees (25 km × 25 km). The top five ranked Regional Climate Models (RCMs) were ensembled at each grid level using the Reliable Ensemble Averaging (REA) method (Buri et al., 2022). In this study, a digital elevation model (DEM) prepared from CARTOSAT satellite data of 30 m resolution is used. The LULC map obtained from The National Remote Sensing Center (NRSC) provided a 1:250,000 scale map. The soil map was obtained from the International Soil Reference and Information Centre (ISRIC) and has a resolution of 1 km. DEM, Soil and LULC maps were shown in the Figure 2. Data on gauge, discharge, sediment, and water quality from 1965 to 2017 were obtained from the Central Water Commission (CWC) at the basin’s Keesara gauge point. The driving forces used to predict LULC maps, such as the road and stream network, were extracted from Open Street Maps (OSM). The Munneru basin LULC maps obtained from NRSC were used to predict future LULC maps. Table 1 displays the LULC classes in the basin.

4. Methodology

The methodology of the present study involves predicting LULC maps for future periods using available historic maps. The analyses of streamflow and other major water balance components were carried out in the context of both climate and LULC change. Figure 3 depicts the methodology flowchart. The detailed methodology is discussed in the following sections.

4.1. Prediction of LULC Using CA-Markov Model

The Markov chain model for LULC projection is a stochastic model that uses knowledge on the evolution of a particular land-use class from time step t − 1 to step t to project the LULC corresponding to the time step t + 1. Transition probabilities for changes in land-use classes from the past (t − 1)th step to the current tth step are used to detect changes to each of the land-use classes considered. The CA-MARKOV model is a combined cellular automaton, Markov chain, multi-criteria evaluation, multi-objective land allocation LULC prediction procedure that adds spatial contiguity and knowledge of the likely spatial distribution of transitions to Markov chain analysis. In the application of CA, each pixel (cellular entity) varies its state independently based on its previous state and that of its immediate neighbors (pixels) based on a specified set of user-defined rules [35]. The rules aid in spatially associating an extent to the land-use change. Because of the benefits of the CA-Markov approach, the CA-Markov module included with IDRISI: version 18.31, J. Ronald Eastman, Clark University-Worcester, USA [36] was used in the present study to predict LULC. The projected LULC image for 2015 was derived by combining 2005 and 2010. The Kappa coefficient (K) was used to assess the simulation of spatial distribution accuracy, and it was calculated using the IDRISI’s VALIDATE module. When the Kappa coefficient is 0.81–1.00, it is considered efficient, outstanding, and viable [37]. Distance from roads, elevation, and stream network maps are provided as additional inputs for future LULC map generation. The combined effects of LULC and climate change on streamflow and water balance components were investigated by changing LULC maps in each of three future periods under both RCP 4.5 and RCP 8.5 scenarios and comparing them to the baseline period. To project streamflow and water balance components, the predicted 2030 LULC map is used for the near-future period, 2050 LULC map for the mid-future period, and 2080 LULC map for the far-future period, respectively.

4.2. Hydrological Modelling

SWAT is a basin-scale, semi-distributed, physically based, open-source software that is widely used around the world to investigate the impact of sediment transport, fertilizer load and various water management strategies (http://swat.tamu.edu/docs/ (accessed on 4 April 2022)). QSWAT, a QGIS-interfaced version of SWAT, can be used to run a continuous simulation of a catchment model at different time increments and spatial scales. The watershed area was divided into 17 sub-basins based on LULC and soil maps. Sub-basins were further divided into hydrologic response units (HRUs) which are a unique combination of land use, soil type and slope.
The SWAT model was initially configured with 2005 LULC for observed period climate data (1983–2017). The SWAT model was calibrated and validated using SWAT-CUP (SWAT-Calibration Uncertainty Program). The model was calibrated using monthly observed streamflow data from 1983 to 2002, and was validated using data from 2003 to 2017. To reduce the uncertainty associated with model predictions, the SUFI-2 method in the SWAT-CUP with 1000 different parameter combinations was used to calibrate and validate the model based on observed streamflow data. Sensitivity analysis was performed to identify the sensitive parameters that influence the model output. The sensitivity of 12 parameters were examined in SWAT CUP. The t-stat values were used to assess the sensitive parameters, which became more sensitive as the absolute t-stat values increased. p-values are used to determine the significance of the sensitivity, with p-values close to 0 indicating that the parameter is significant. The lower the p-value and greater the absolute t-stat value, the higher the sensitivity. New parameter ranges were also created, which can be used to re-calibrate the model in the next iteration until the best parameter ranges were found. These optimal parameter ranges were then used to validate the monthly streamflow. Furthermore, the R2 was used to assess collinearity between simulated and observed streamflow, with values ranging from −1 to 1 (ideal). The SWAT model’s performance can be described as good and satisfactory, with NSE values ranging from 0.65–0.75 and 0.5–0.65, respectively [38].
After calibration and validation with observed streamflow data (1983–2017) from the gauge station, the best fit parameters were updated in the SWAT model. The model was run for baseline and future periods with updated parameters using MME outputs of meteorological data sets with predicted LULC maps for three periods, namely the near future (2021–2039), mid future (2039–2040) and far future (2070–2099) for both RCP 4.5 and 8.5 scenarios. Precipitation, streamflow and other water balance components were assessed for future periods.

5. Results and Discussions

5.1. Changes in LULC

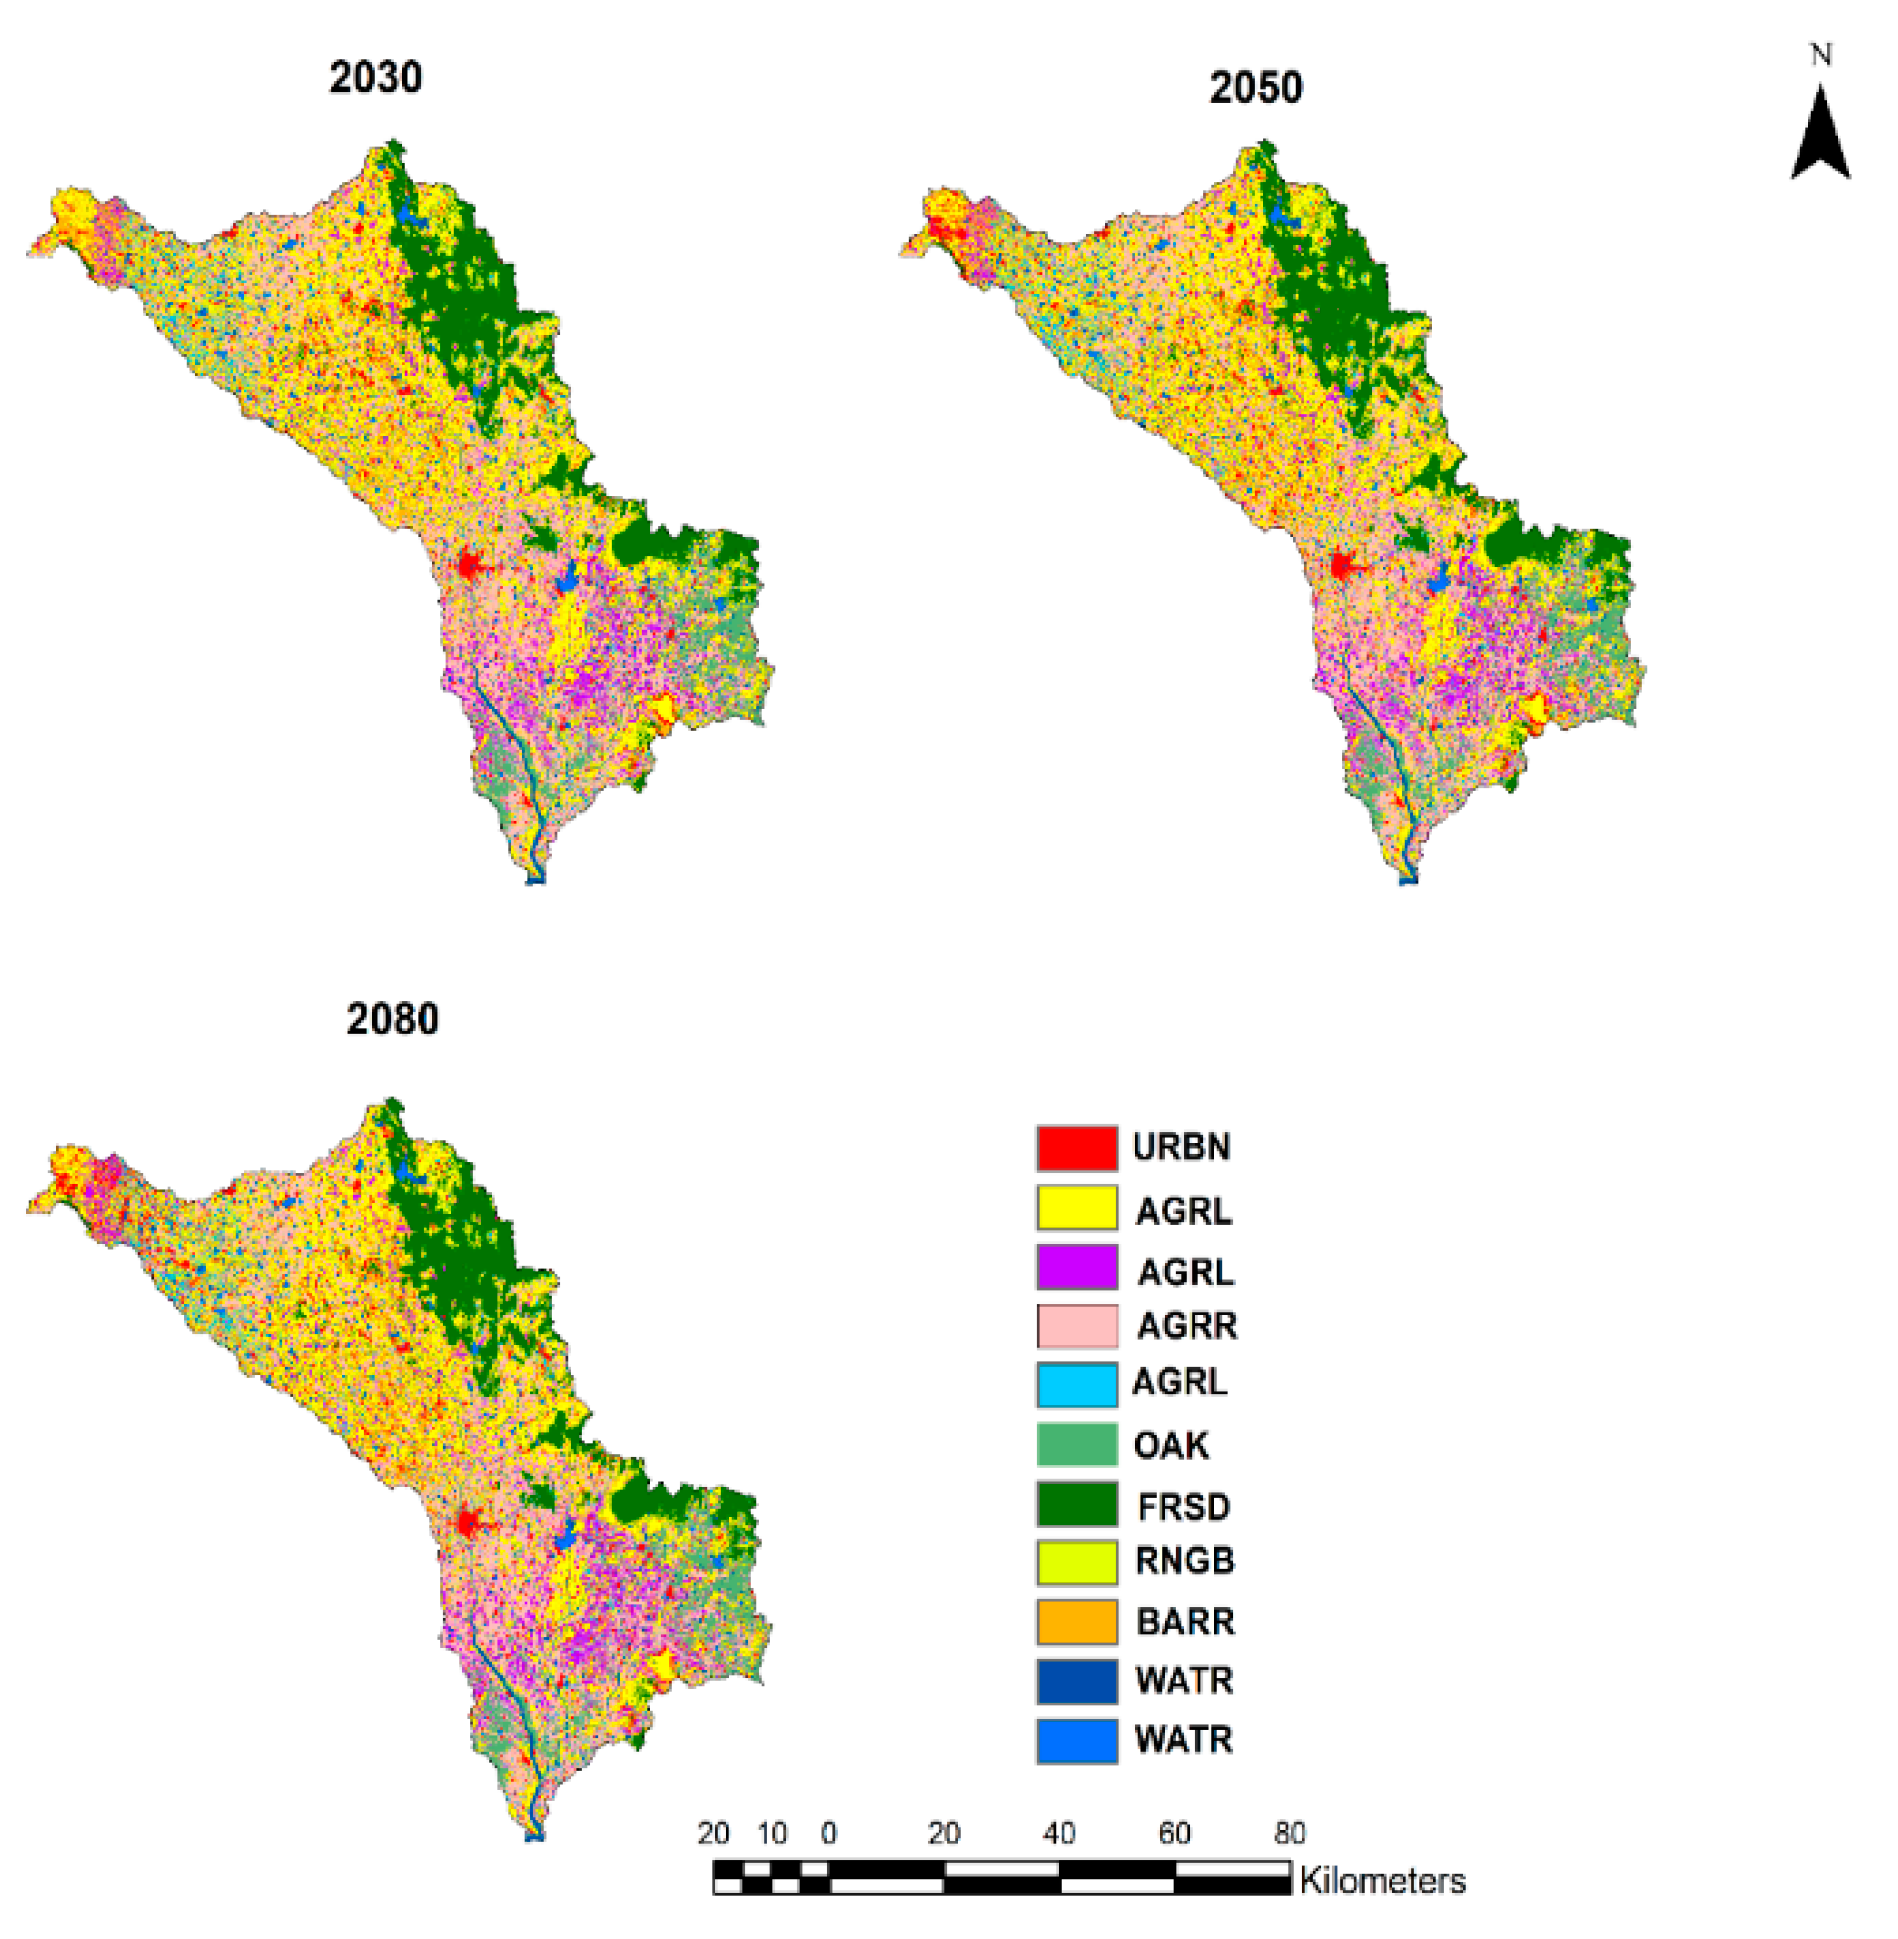
The 2015 LULC map was predicted using the study basin’s LULC maps from 2005 and 2010, as well as the CA-Markov model and a transition probability area matrix. The predicted 2015 LULC was validated using the available map and obtained a kappa coefficient of 0.87. A similar procedure was used to predict future LULC maps. The available and simulated LULC maps for the observed periods were shown in Figure 4. The LULC maps were generated for the years 2030, 2050 and 2080 with the CA-Markov model using variables such as elevation, distance from roads, slope and stream network. The predicted LULC maps for the years 2030, 2050 and 2080 are shown in Figure 5. The percentage variation of various LULC classes was shown in Table 2. The kharif crop cultivation area has been extended by 23.04%, 23.24% and 23.32% in 2030, 2050 and 2090 respectively compared to 2005. Built-up land had also increased at a rate of 2.21%, 3.21% and 4.02% in 2030, 2050 and 2080 respectively. Wasteland, rabi and zaid crops declined by 4.08 %, 7.87 % and 4.79% respectively in 2030. Similar results were observed for the Krishna River basin i.e., built-up land was increased and the barren land was decreased [1]. Forest cover has decreased and is converted to built-up in the Upper Cahaba River watershed [11]. Barren land and residential areas have increased and rangeland has decreased in Marboreh watershed [12]. There are decreases of 4.47% in wasteland, 7.82% in rabi crop and 4.73% in zaid crop is observed in the year 2050. Decreases of 5.86% in wasteland, 7.78% in rabi crops, 4.61% in zaid crops are expected in the year 2080.

5.2. Analysis of Streamflow Using SWAT

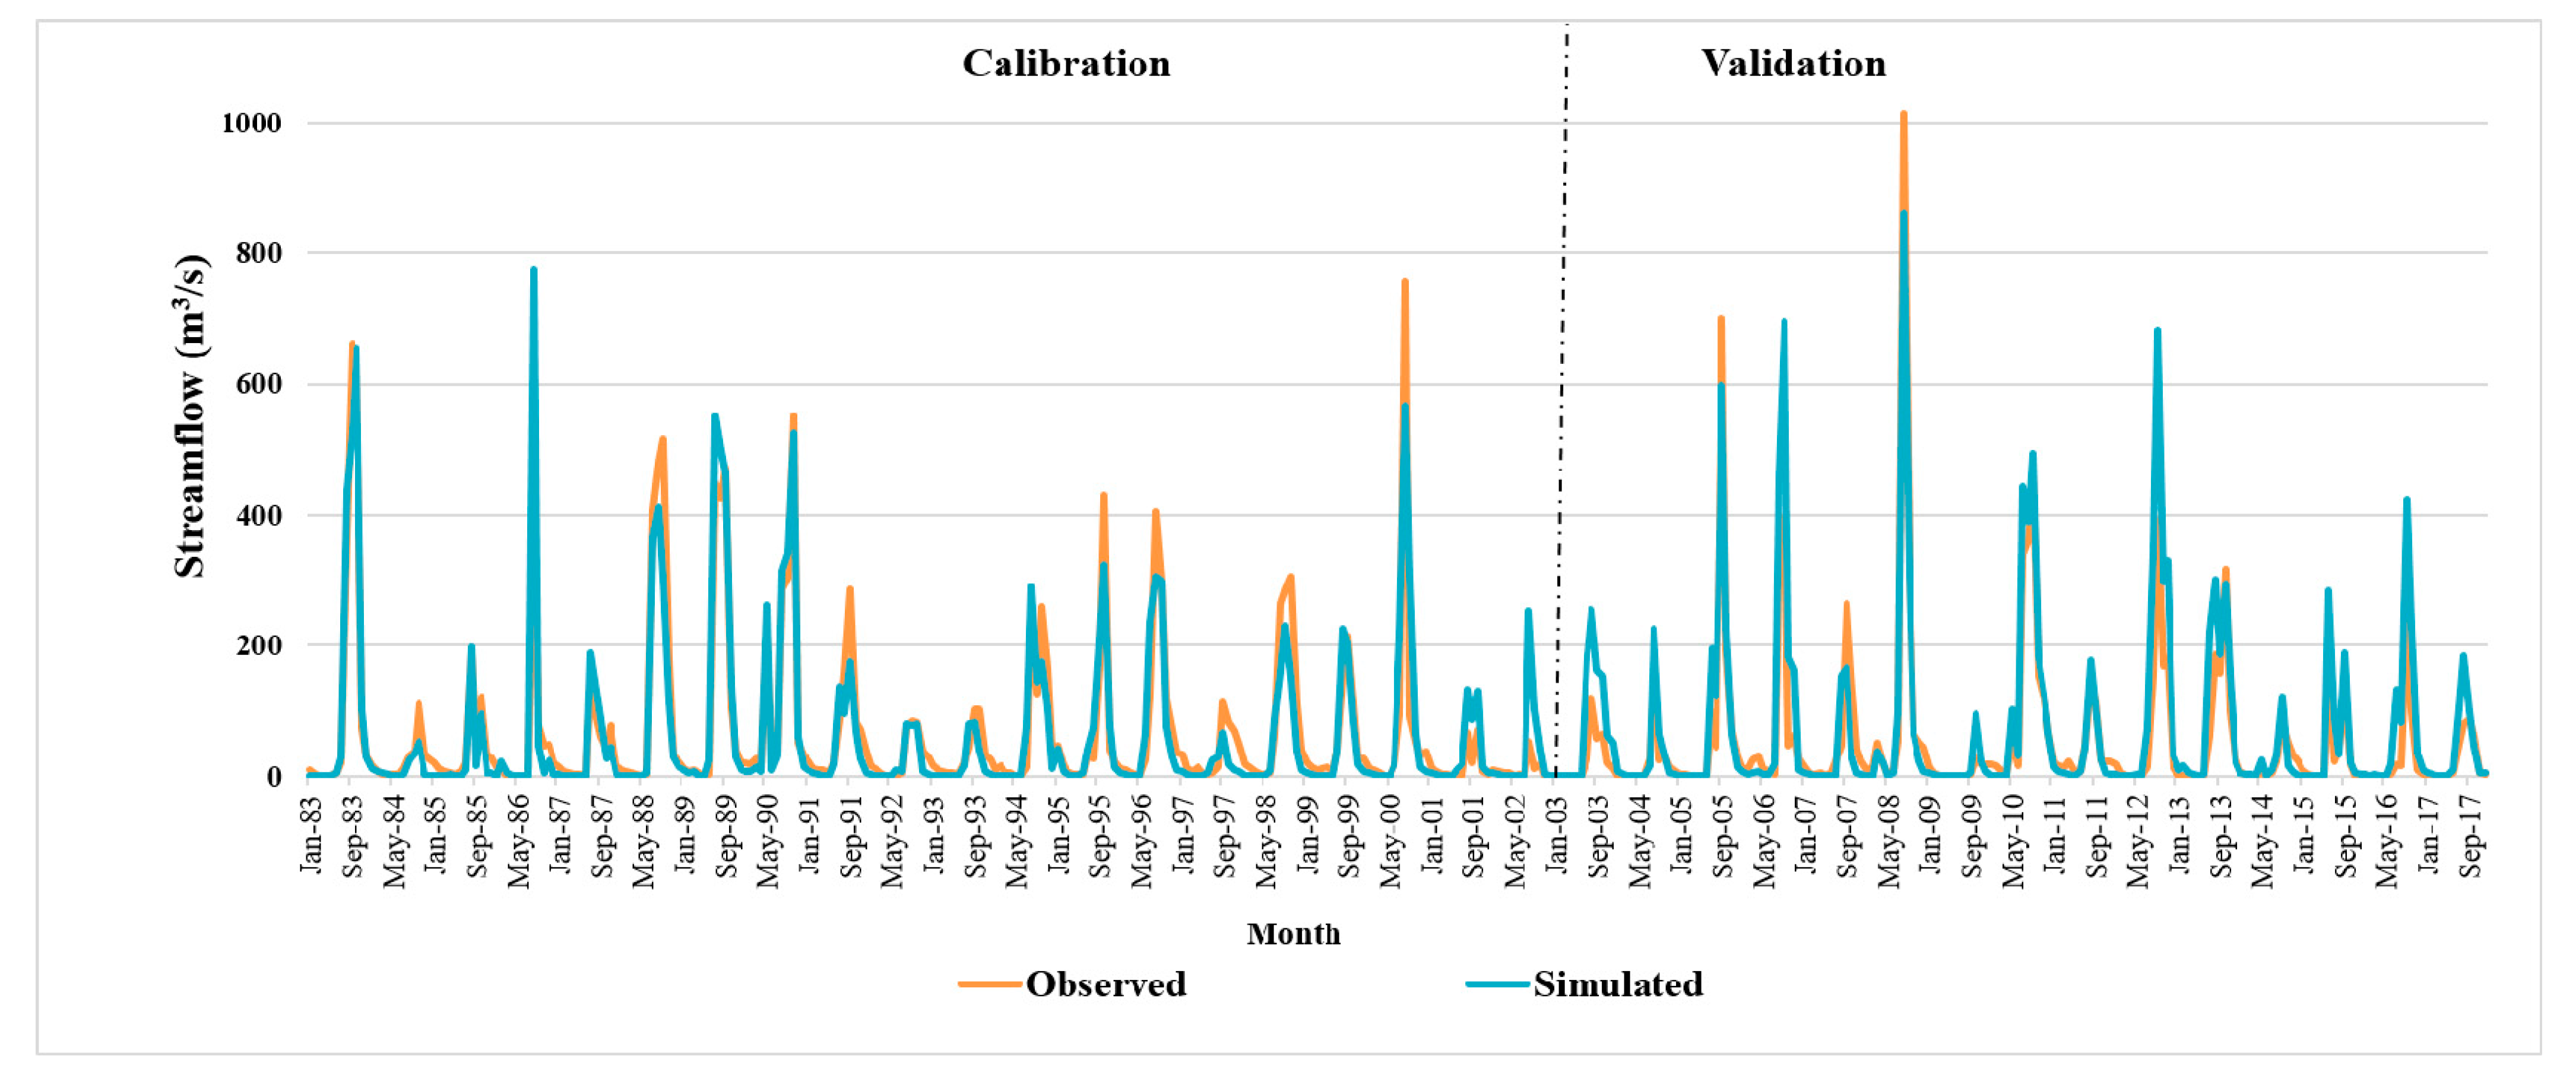
From 1983 to 2017, discharge data from the CWC gauge station at Keesara were used for model calibration and validation. Prior to model calibration, sensitivity analysis was used to estimate the most important parameters for streamflow simulation. For calibration and validation, a total of twelve parameters were used. Out of the twelve parameters, eleven parameters (CN2, GW_REVAP, ALPHA_BF, GW_DELAY, GWQMN, ALPHA_BF_D, SOL_AWC, EPCO, ESCO, SLSUBBSN, SURLAG) were the most sensitive from the sensitivity analysis. Table 3 shows the maximum and minimum ranges of the parameters, as well as the best-fitted values after sensitivity analysis. During the validation period, the calibrated SWAT model parameters were used to simulate monthly streamflow. The model was calibrated using monthly observed streamflow data from 1983 to 2002, and was validated using data from 2003 to 2017. After thousands of simulations, the performance level of the SWAT model was determined using two objective functions such as coefficient of determination (R2) and the Nash–Sutcliffe efficiency parameter (NSE) for both calibration and validation. The R2 and NSE values for the calibration period were 0.89 and 0.87, respectively, while the values for the validation period were 0.86 and 0.84. The R2 values in the calibration period were in the range of 0.77–0.93 for Gangjiang and Hanjiang basins [16]. In calibration period, for the entire Krishna basin at Vijayawada gauge station R2 was found to be 0.63 [1]. These values were sufficient to move forward with further simulations for this basin [39]. For both the calibration and validation periods, the percent bias values are less than 10.
After obtaining the best fit parameters, manual updating of parameters was carried out for the previously run SWAT model. Figure 6 depicts the average monthly observed and simulated streamflow (m3/s) for the entire period (1983–2017). The SWAT model captured the majority of the peak discharges, but not all of them. Peak discharges were observed in greater numbers between 2000 and 2009. In three months, on average, 3/4 of the flow was contributed, namely August, September, and October. The average monthly streamflows in August, September, and October were 207.03, 211.10, and 142.23 m3/s, respectively. For the entire period of observation, the maximum value of average monthly streamflow (1013.44 m3/s) was observed in August 2008. In the period 1983–2017, the occurrence of average monthly observed streamflow values greater than 100 m3/s was 70 times, while the streamflow crossed the magnitude of 300 m3/s 25 times. For the entire period, the peak values of annual average monthly streamflow were over-simulated 13 times and under-simulated 12 times.
Figure 7 shows the variation in monthly precipitation (mm) and average monthly streamflow (m3/s) values for simulated and modeled datasets from 1983 to 2005. Simulated flow was generated from IMD datasets in this case, while modeled data was generated from Multi-Model Ensemble (MME) datasets. Because of the uncertainties in the RCM models, the correlation coefficient between average monthly observed and modeled precipitation was found to be 0.83, while the correlation coefficient between average monthly simulated and modeled streamflow was found to be 0.61. The average monthly maximum precipitation in July and August was 248.75 mm and 212.19 mm, respectively. From July to October, the percentage bias in stream flow simulations using observed climate data and historic climate model data is 6.77%.

5.3. Impact of Climate Change on Streamflow and Water Balance Components

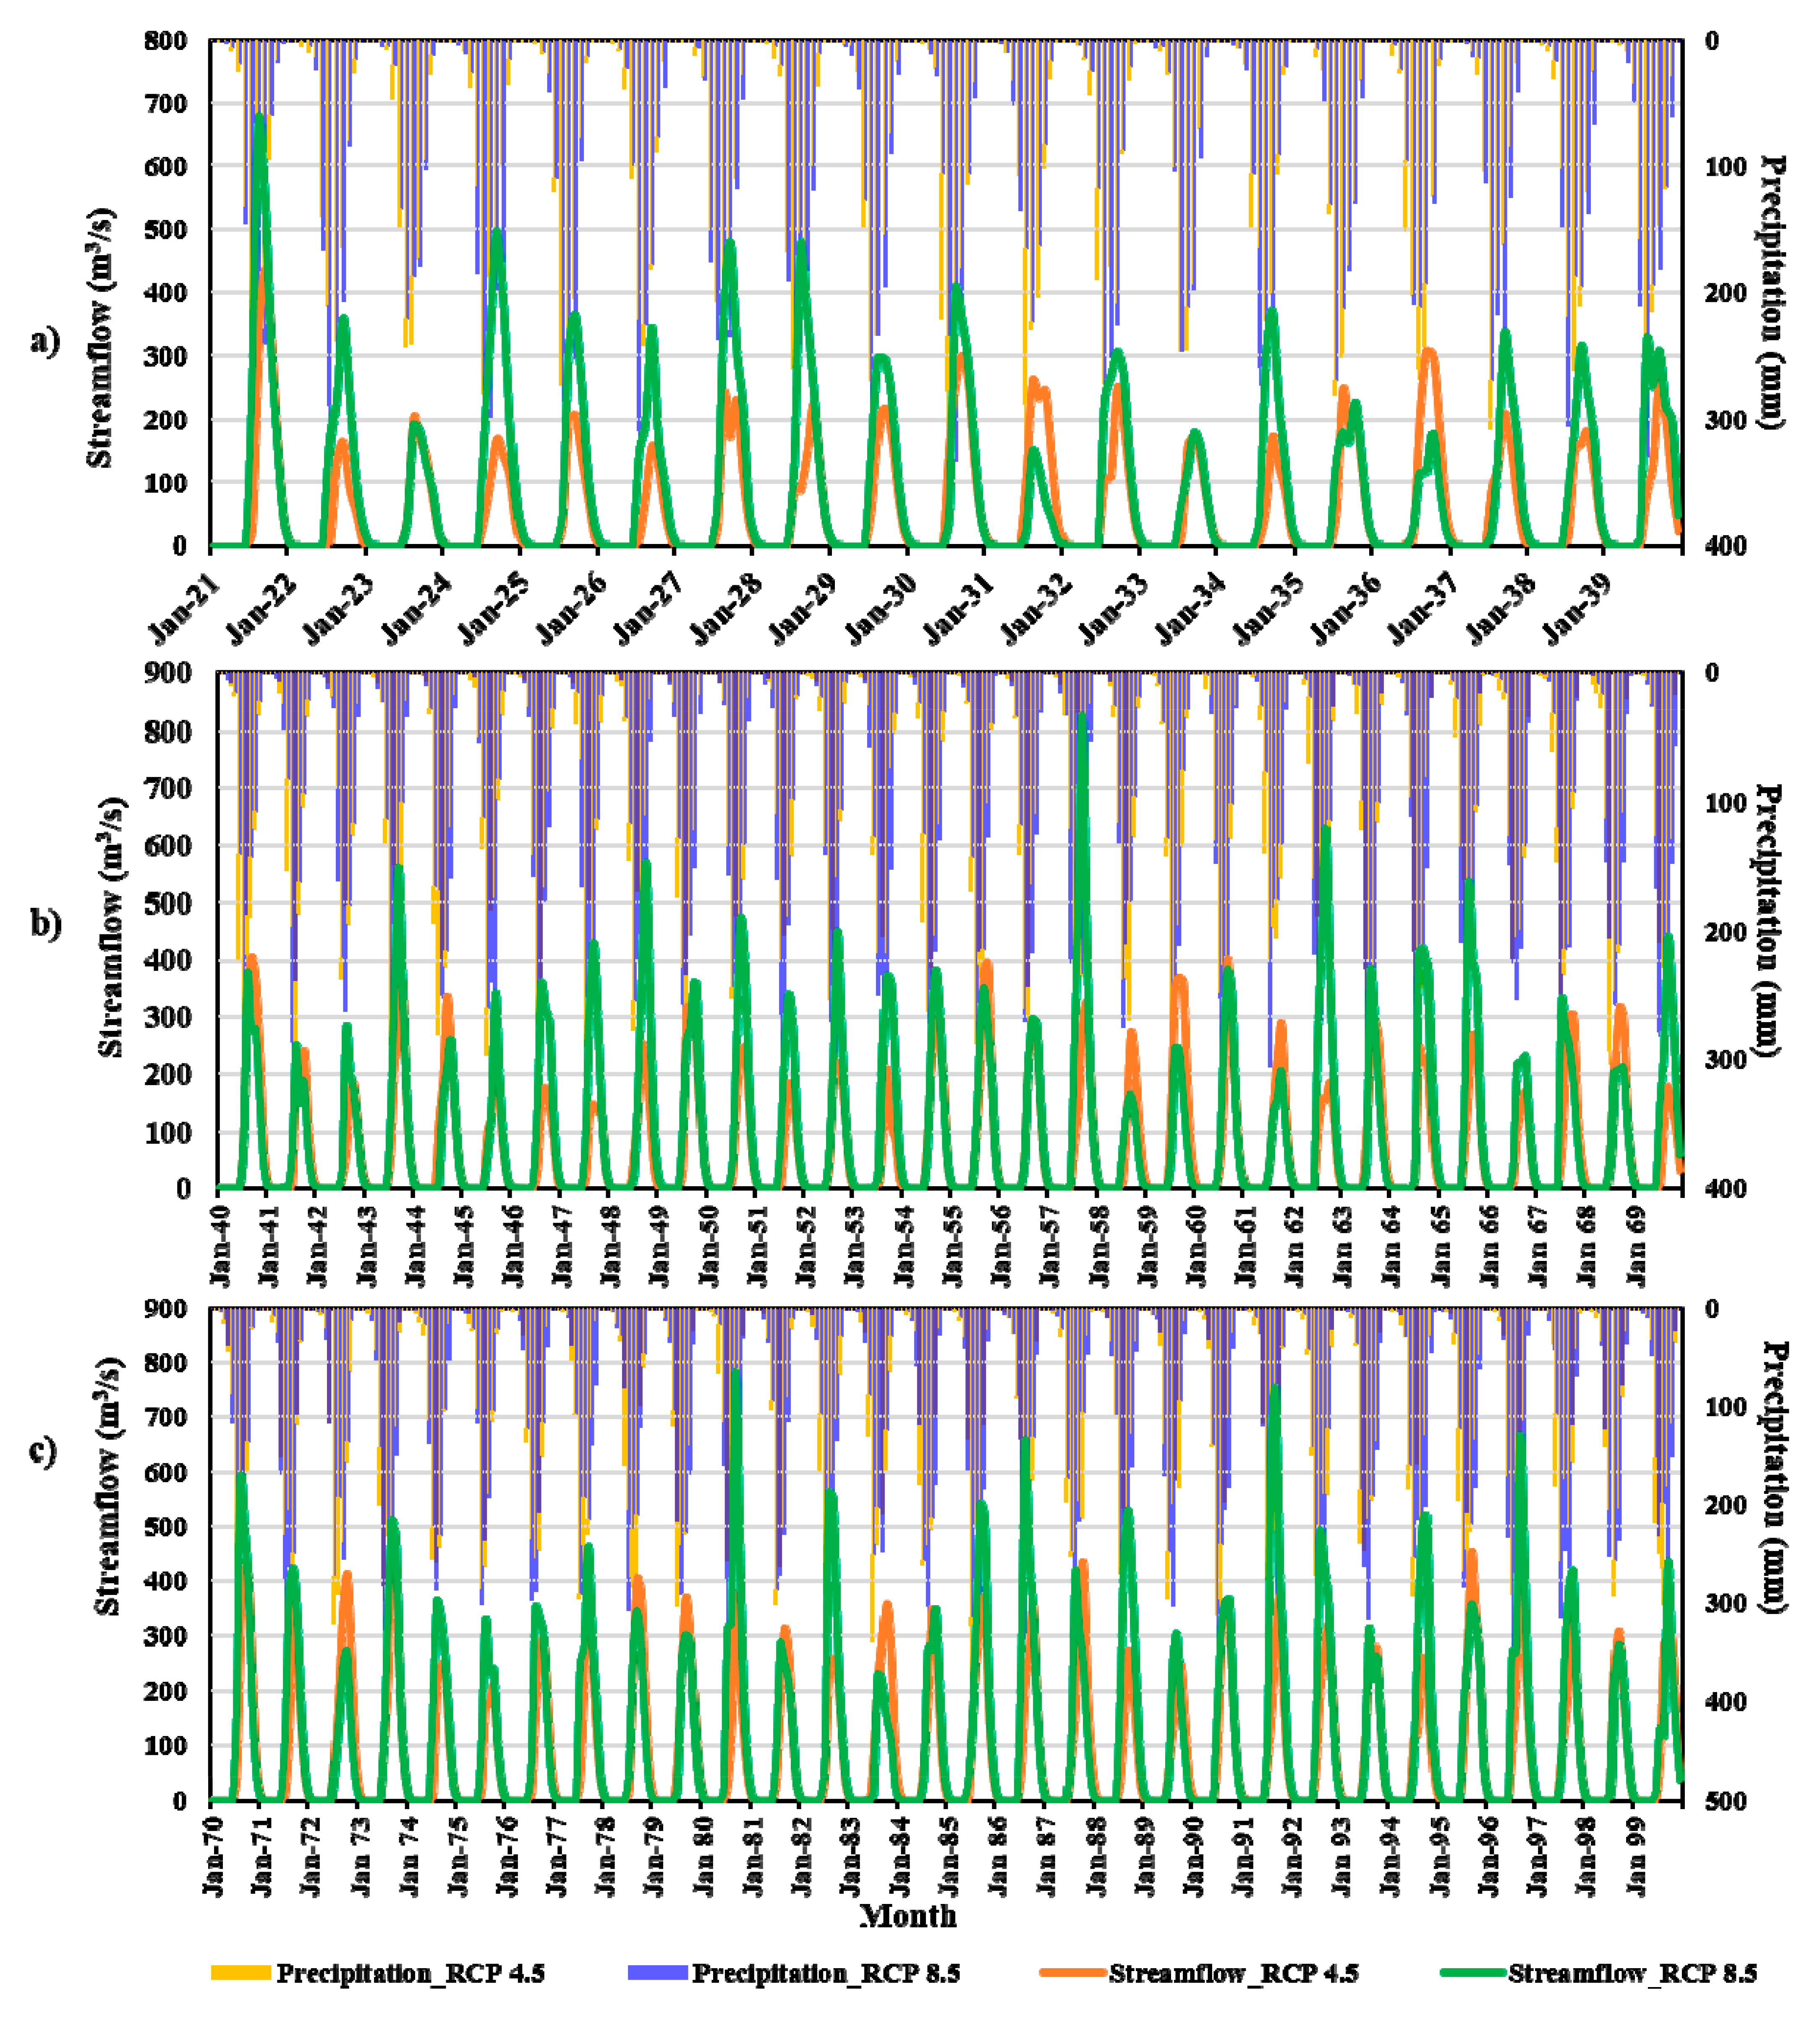
The impact of climate change on streamflow and water balance components is examined for three future periods under both scenarios, using the 2005 LULC map as a constant. Future period simulations are compared to the baseline period (1983-2005). More importantly, the statistical efficiency of the SWAT model has been used to assess its applicability in simulating stream flow dynamics in the Munneru basin. As a result of the model simulation results, the model can be used to examine the hydrologic response analysis with minimal bias due to the Munneru basin’s geographical and temporal variability. Figure 8 depicts the variations in average monthly streamflow and precipitation in the near future (2021–2039), mid future (2040–2069), and far future (2070–2099) scenarios under RCP 4.5 and RCP 8.5. When compared to modeled precipitation, an increasing trend pattern is observed in all three future periods for annual average precipitation under both RCP 4.5 and RCP 8.5 scenarios [40]. Increased precipitation has caused increased streamflow, and average monthly maximum streamflows were observed in August and September in both RCP 4.5 and 8.5 scenarios for all three future periods. Mishra et al. (2018) [14] also investigated that the increase in streamflow by considering the ensemble outputs of GCM’s in future periods for the Bheri River basin, Nepal.
In the near future, maximum and minimum peak streamflows of 436.3 m3/s and 157.9 m3/s were observed in the months of September 2021 and September 2026, respectively, under the RCP 4.5 scenario. Similarly, the maximum peak streamflow of 666.7 m3/s in August 2021 and the minimum peak streamflow of 147.8 m3/s in August 2031 were observed under the RCP 8.5 scenario for the near-future period. In the mid-future period, maximum and minimum peak streamflows of 404.9 m3/s and 148 m3/s were observed in the months of September, 2040 and September, 2047, respectively, under the RCP 4.5 scenario. Under the RCP 8.5 scenario for the mid-future period, maximum peak streamflow of 826.4 m3/s was observed in September 2057 and minimum peak streamflow of 163.6 m3/s in September 2058.
Under the RCP 4.5 scenario, the maximum and minimum peak streamflows of 456.7 m3/s and 207 m3/s were observed in the months of September, 2073 and October, 2075, respectively. Similarly, under the RCP 8.5 scenario for the far future period, a maximum peak streamflow of 780.9 m3/s was observed in September 2080 and a minimum peak streamflow of 228.1 m3/s in August 2083. Under the RCP 4.5 scenario, monthly streamflow greater than 100 m3/s is observed 28.51 percent of the time in the near future, 32.50 percent of the time in the mid future, and 34.44 percent of the time in the far future. Similarly, under RCP 8.5, a streamflow greater than 100 m3/s is observed 34.65% of the time (near future), 33.89% of the time (mid future), and 37.22% of the time (far future). There were 4 (near future), 17 (mid future), and 31 (far future) instances with magnitudes greater than 300 m3/s in the RCP 4.5 scenario, and 23 (near future), 41 (mid future), and 56 (far future) instances in the RCP 8.5 scenario
Figure 9 depicts the variation of monthly streamflow (July–November) for all three future periods under two scenarios. Maximum streamflow values were observed in August and September in all three future periods. Under RCP 4.5, the average streamflow values for each period in September were 215.82 m3/s (near future), 252.95 m3/s (mid future), and 321.11 m3/s (far future). Similarly, under RCP 8.5, 316.19 m3/s (near future), 348.68 m3/s (mid-future), and 408.58 m3/s (far future) were observed.
Surface runoff, on the other hand, has shown an increasing trend pattern. Table 4 depicts the key water balance components under climate change scenarios. It is observed that streamflow, surface runoff, and aquifer recharge have increased significantly in comparison to the baseline period, which is attributed to an increasing trend of rainfall in future periods. However, there is no significant increase in evapotranspiration in the future. Surface runoff increases by 11.55%, 32.66%, 57.81% in the near, mid- and far futures under RCP 4.5, 78.49%, 97.02% and 145.6% in all three future periods under RCP 8.5. For all three periods, evapotranspiration increases by 1.33%, 4.7%, 6.53% in the RCP 4.5 scenario and 1.63%, 4.85%, 11.02% in the RCP 8.5 scenario. The increase in evapotranspiration is high in the far future period under the RCP 8.5 scenario due to the high rise in temperature, which contributed to an increase in both evaporation and transpiration rates. When the impact of climate change is considered, evapotranspiration increases in the Armur watershed in the Godavari River basin [13]. The total aquifer recharge also increased by 2.05%, 13.32%, 28.57% in the RCP 4.5 scenario and 16.94%, 23.12%, 32.94% in the RCP 8.5 scenario for all three periods.
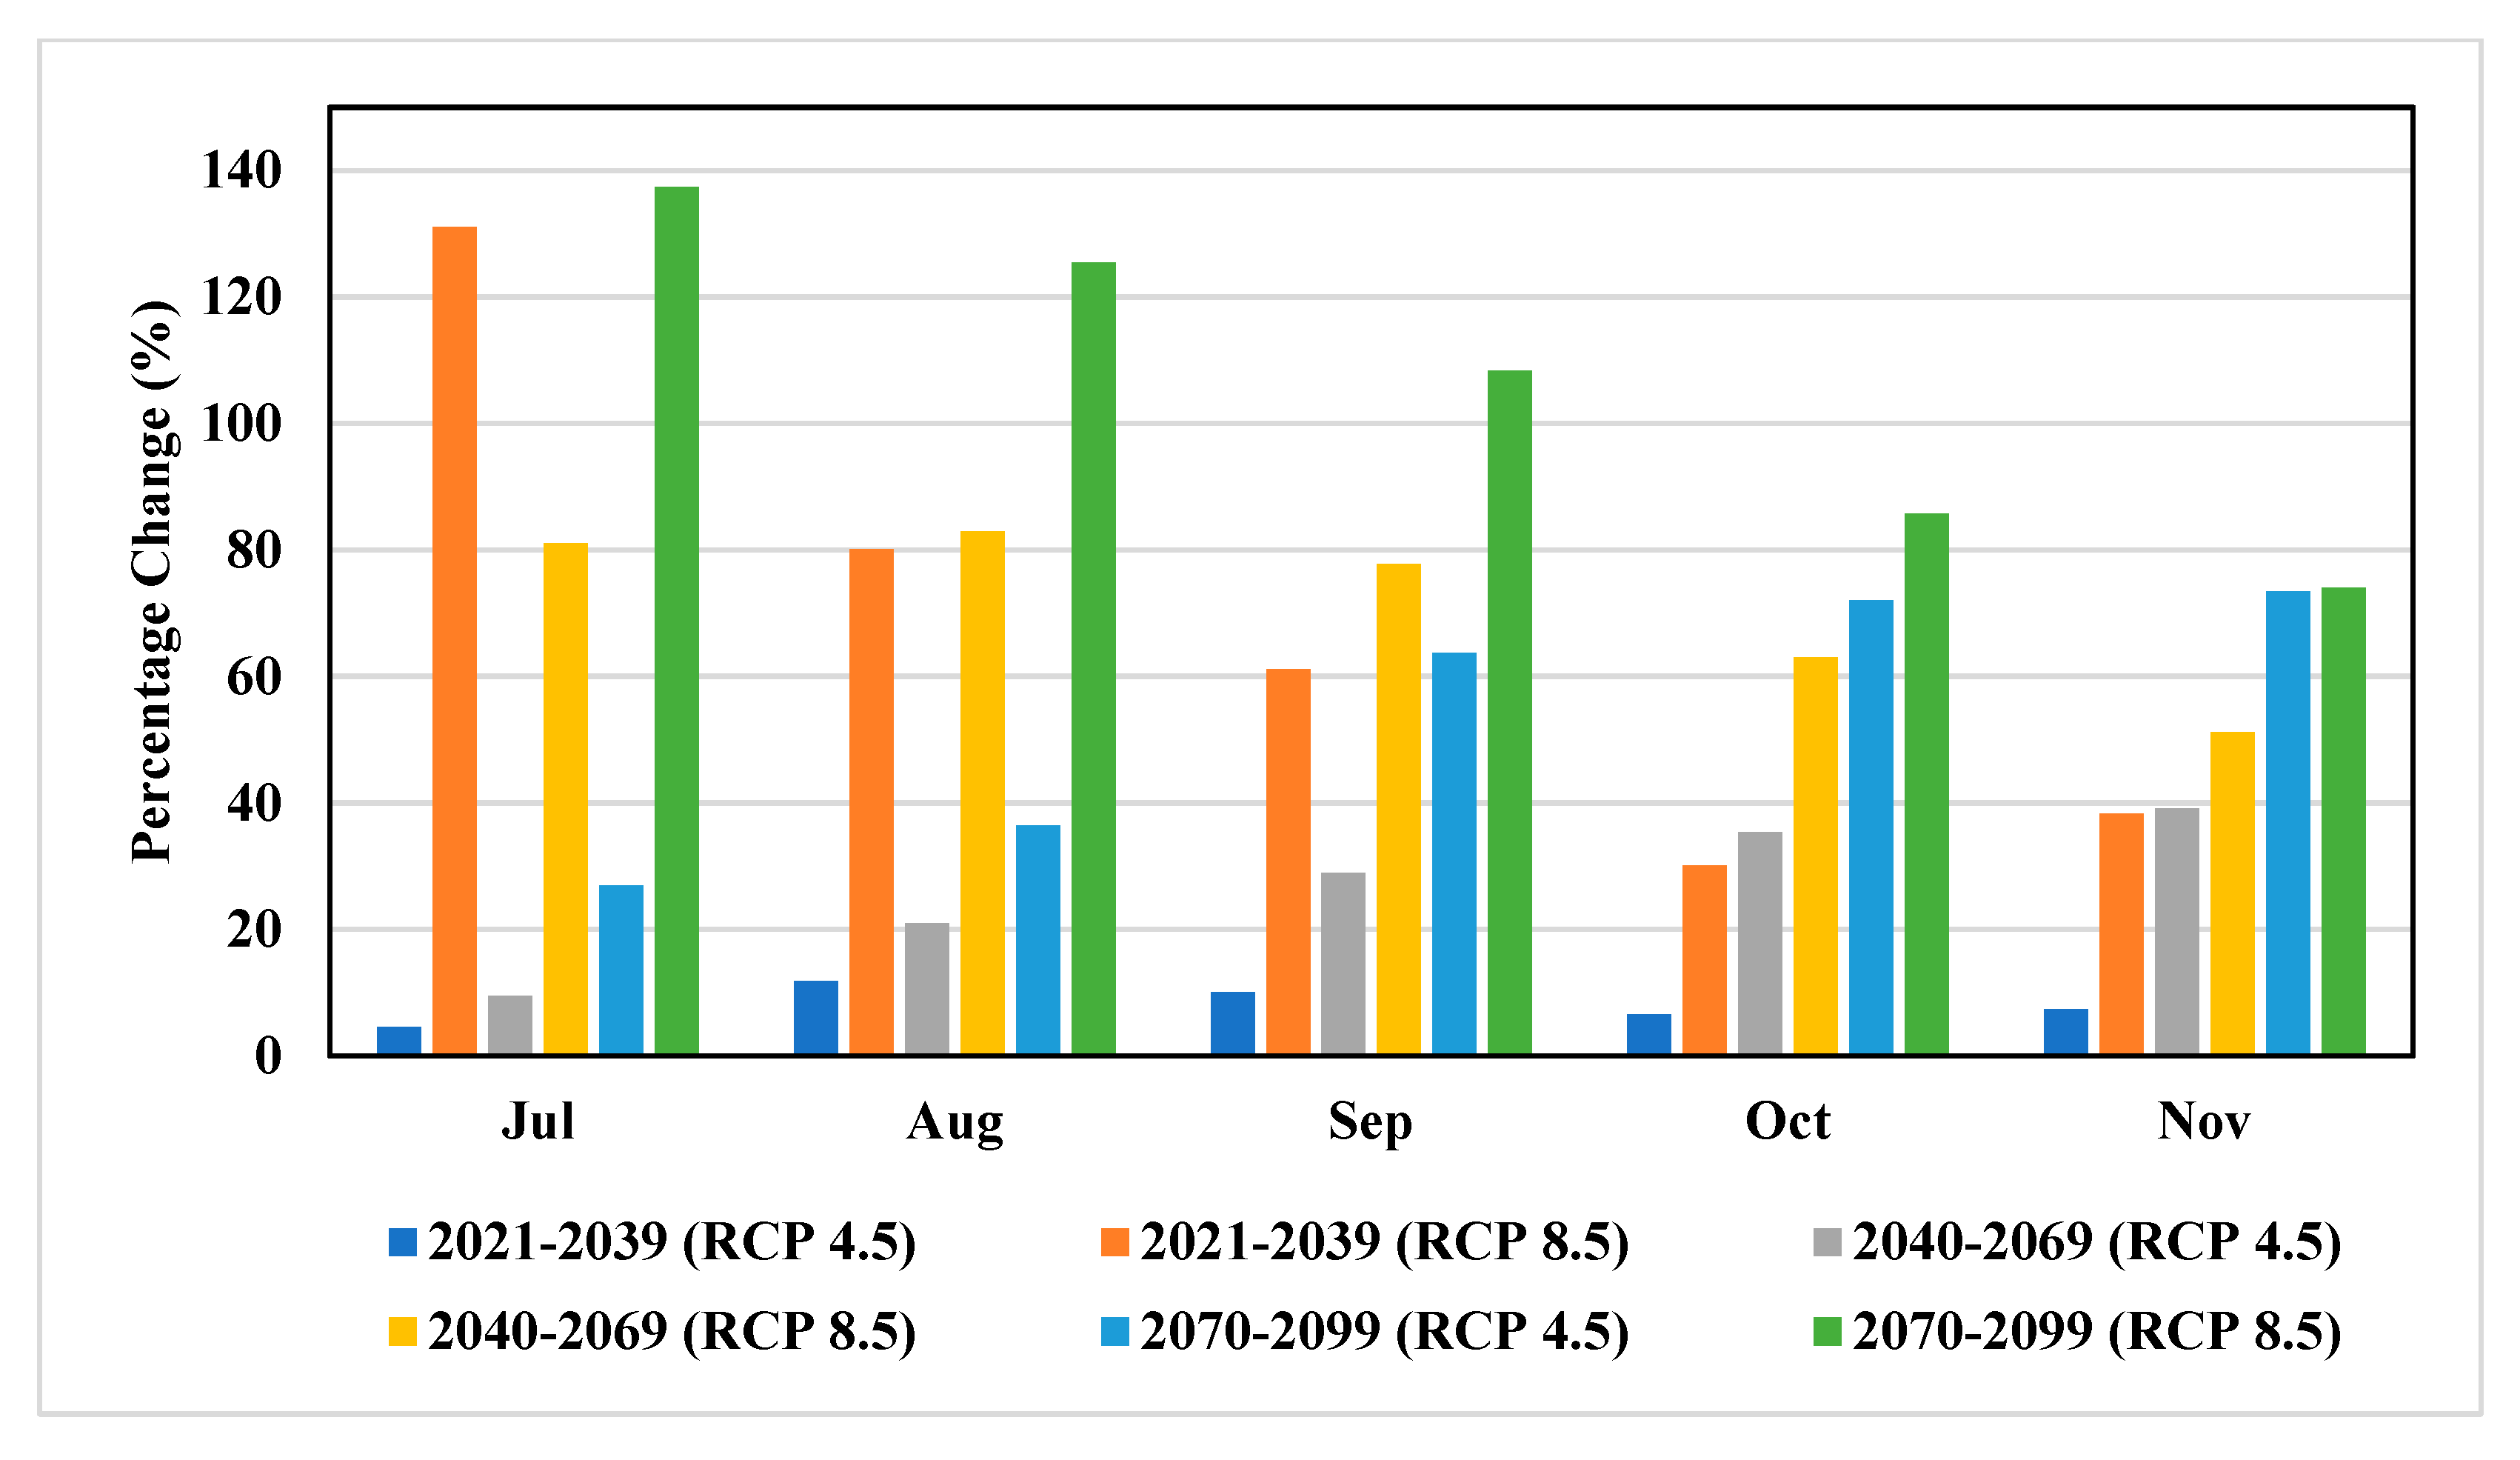
Figure 10 depicts the percentage change in average monthly streamflow (July–November) with respect to the baseline period when only the impact of climate change is considered under both scenarios for future periods. The figure shows that there is no significant increase in streamflow when compared to the baseline period for all months in the near future period under RCP 4.5. Under both scenarios, the percentage change in streamflow with respect to the baseline period is greater in July and August. The highest percentage increase was 137.33% in the month of July in the far future period under RCP 8.5.

5.4. Combined Impact of LULC and Climate Change on Streamflow and Water Balance Components

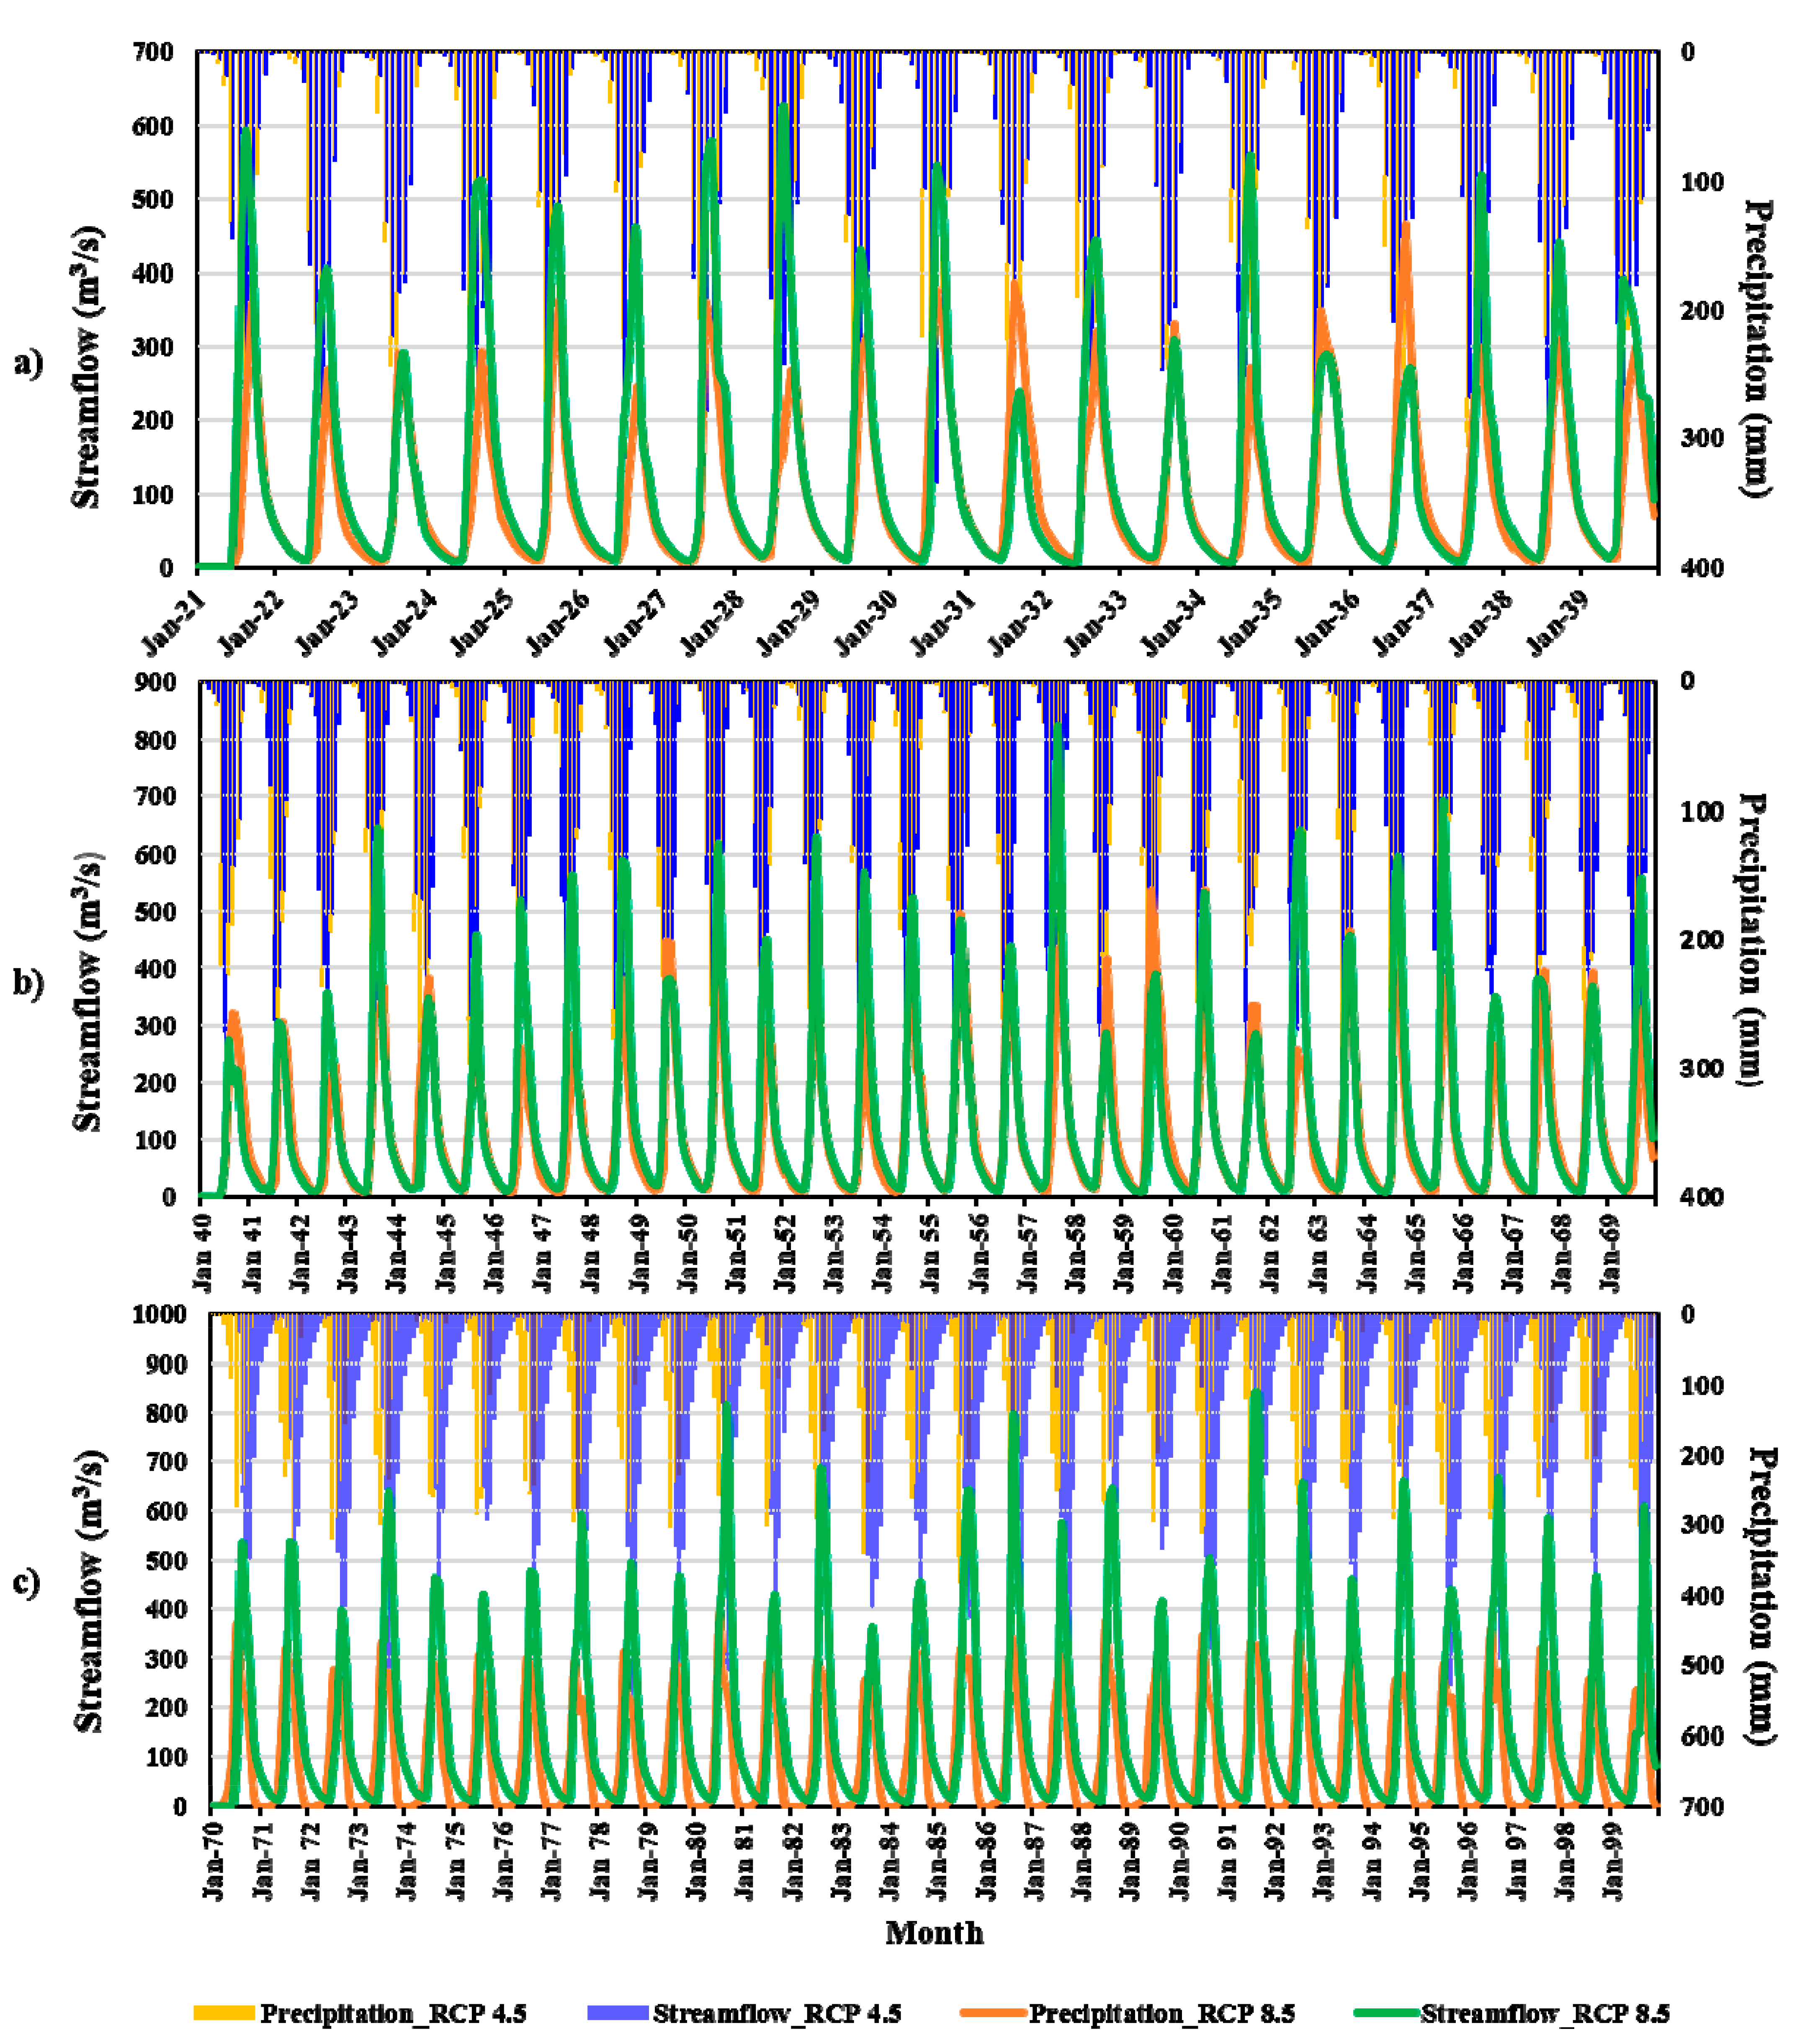
Figure 11 depicts the variations in average monthly precipitation and streamflow in two scenarios for the near future (2021–2039), mid-future (2040–2069), and far future (2070–2099). When compared to the baseline period, the average annual streamflow increases for all periods. Under the RCP 4.5 scenario, annual average streamflow increased by 46.48% in the near future, 75.43% in the mid-future, and 110.19% in the far future compared to the baseline period. Similarly, under RCP 8.5, streamflow increased by 100.51%, 121.74%, and 170.96% over three periods. The projected increase in urbanization contributes to the increased impervious surface area of the basin, while the decrease in agricultural area results in reduced evapotranspiration, both of which contribute to higher streamflow. Similar results were observed for the entire Krishna River basin in future periods as precipitation increased [1,17]. Temperature and precipitation changes have outperformed LULC changes (increasing area under cultivation), and increased precipitation, as well as increased soil moisture from flood irrigation for paddy fields, have resulted in an overall rise in streamflow in the Nagavali River basin [10]. Under the climate change scenarios, streamflow in the Brahmaputra River basin, India increases in the future [41]. The occurrence of average monthly streamflow values greater than 100 m3/s in the near, mid- and long term was 77,130, and 152 times under RCP 4.5, and 85,134, and 148 times under RCP 8.5. The magnitude of average monthly streamflows greater than 300 m3/s was observed 15, 40, and 70 times under RCP 4.5, but only 28, 62, and 77 times under RCP 8.5. Maximum and minimum peak streamflows of 465.4 m3/s and 245.4 m3/s were observed in the months of September, 2036 and September, 2026, respectively, under the RCP 4.5 scenario in the near future. Similarly, the maximum peak streamflow of 620.7 m3/s in August 2028 and the minimum peak streamflow of 236.9 m3/s in September 2031 were observed under the RCP 8.5 scenario for the near future period. In the mid-future period, the maximum and minimum peak streamflows were 537.8 m3/s and 258.5 m3/s, respectively, under the RCP 4.5 scenario. Similarly, under the RCP 8.5 scenario for the mid-future period, a maximum peak streamflow of 813.5 m3/s was observed in September 2057 and a minimum peak streamflow of 270 m3/s in August 2040.
In the far future, maximum and minimum peak streamflows of 579.9 m3/s and 292.7 m3/s were observed in September 2071 and September 2075, respectively, under the RCP 4.5 scenario. Similarly, under the RCP 8.5 scenario for the far future period, a maximum peak streamflow of 842.4 m3/s was observed in September 2091 and a minimum peak streamflow of 363.5 m3/s in September 2083. Under the RCP 4.5 scenario, monthly stream flow greater than 100 m3/s was observed 33.77% of the time in the near future, 36.11% of the time in the mid future, and 42.22% of the time in the far future. Similarly, under RCP 8.5, streamflow greater than 100 m3/s was observed 37.28 percent of the time (near future), 37.22% of the time (mid future), and 47.11% of the time (far future). There were 15 (near future), 40 (mid future), and 70 (far future) instances with magnitudes greater than 300 m3/s in the RCP 4.5 scenario, and 28 (near future), 62 (mid future), and 77 (far future) instances in the RCP 8.5 scenario.
Figure 12 depicts the variation in monthly streamflow (July–November) for all three future periods under two scenarios. Maximum streamflow values were observed in August and September in all three future periods. Under RCP 4.5, the average streamflow values for each period in September were 312.36 m3/s (near future), 360.30 m3/s (mid-future), and 437.72 m3/s (far future). Similarly, under RCP 8.5, values of 413.84 m3/s (near future), 464.47 m3/s (mid-future), and 527.25 m3/s (far future) were observed.
Table 5 shows the important water balance components obtained from the SWAT model for three future periods due to the combined effect of LULC and climate change in two scenarios. In both RCP 4.5 and 8.5 scenarios, surface runoff and evapotranspiration increased. In the baseline period, 9.2% of total precipitation was accounted for as surface runoff, and 15.26%, 16.86%, and 14.47% were converted to surface runoff in three future periods under the RCP 4.5 scenario. Under the RCP 8.5 scenario, 20.41%, 21.36%, and 23.89% of the water was converted to surface runoff, respectively. Under RCP 4.5, evapotranspiration was 67.96%, 65.42%, and 60.23% of total precipitation in the near future, mid-future, and far future, respectively. In the RCP 8.5 scenario, the evapotranspiration values are 61.79%, 60.89%, and 58.84% for three future periods. Under both scenarios, there is a significant decrease in aquifer recharge in the near and mid-future periods, but a slight increase of 6.89% was observed in the far future under RCP 4.5 compared to the baseline period.
When compared to the baseline period, aquifer recharge was reduced by 45.01%, 37% in the near and mid-term under RCP 4.5, and 35.75%, 31.67%, and 26.9% in the long-term under RCP 8.5. It was discovered that evapotranspiration rates would decrease in the far future under RCP 4.5 due to CO2 emissions and humidity, which would counteract the temperature effect on evapotranspiration increase. Chanapathi et al. (2020) [1] observed a similar result in the Krishna River basin for future periods. The aquifer recharge values were lower when the combined impacts of both LULC and CC were compared to only the CC impact because there was an increase in built-up areas, which reduce the imperviousness of the land.
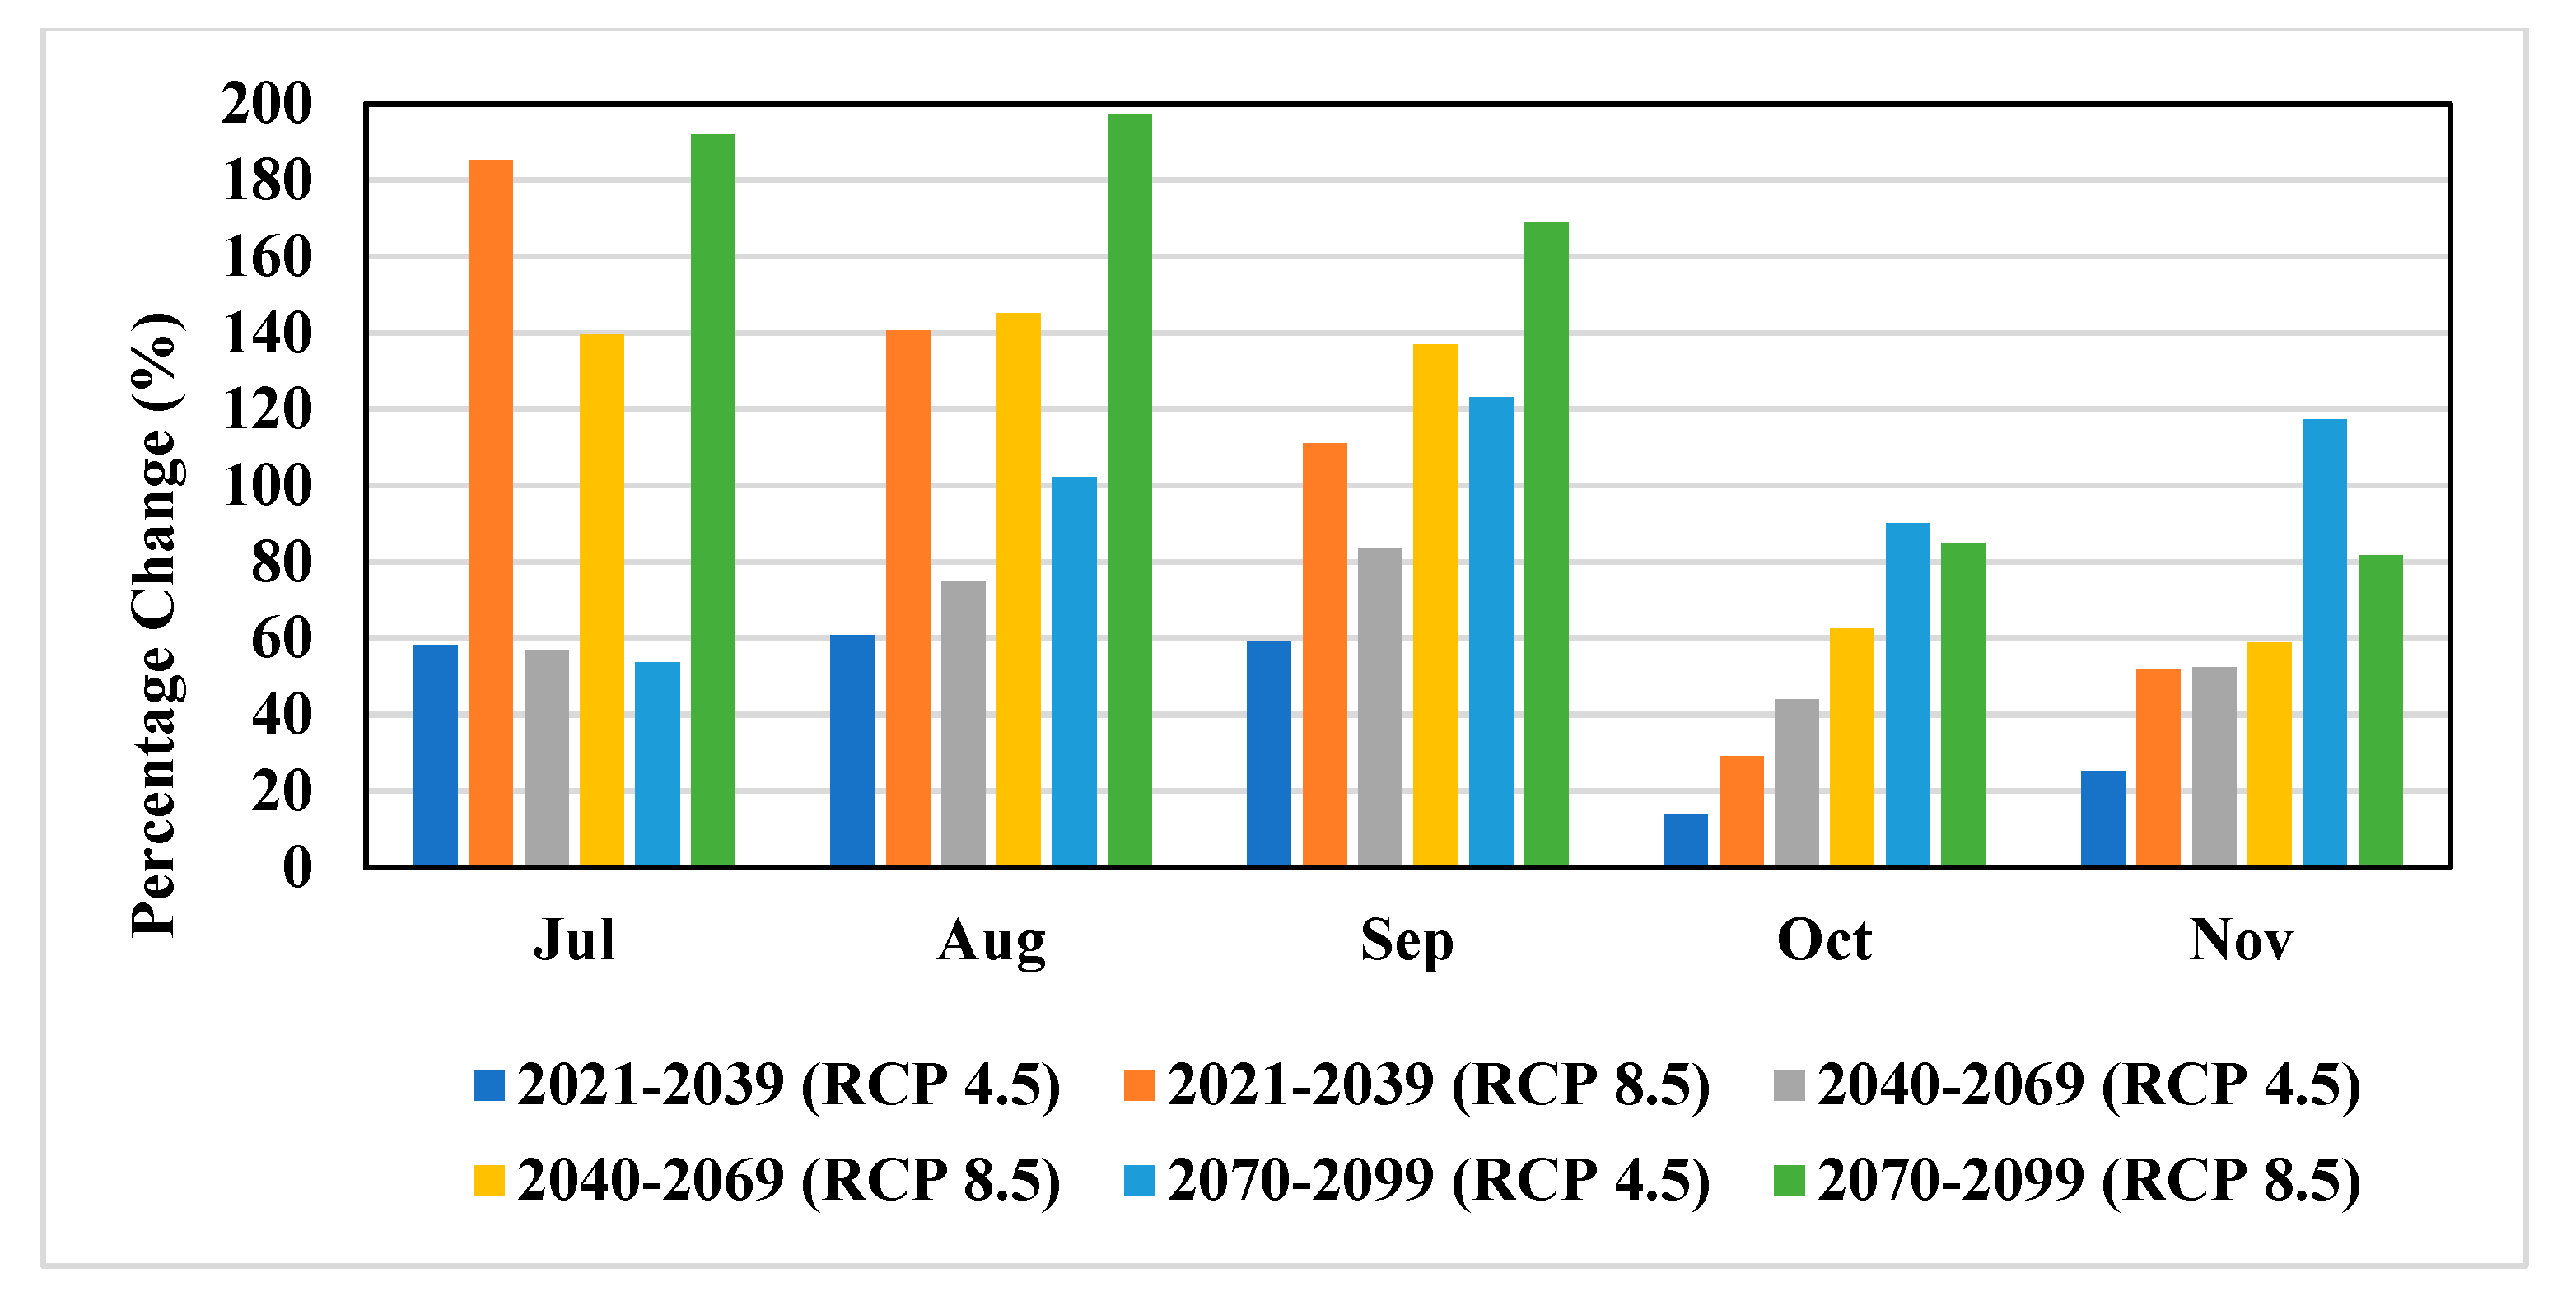
Figure 13 depicts the percentage change in average monthly streamflow (July–November) with respect to the baseline period when the effects of LULC and climate change are combined under both scenarios. When comparing the streamflow to the baseline period, it was discovered that there is a positive change in streamflow for all months under both scenarios. The percentage change in July and August was 191.97% and 197.19%, respectively, compared to the baseline period in the far future period under the RCP 8.5 scenario. In the near future period, the lowest percentage change of 14.06% was observed in the month of October under the RCP 4.5 scenario.
The occurrence of average monthly modeled streamflow values greater than 100 m3/s occurred 65 times during the baseline period, while the streamflow crossed the magnitude of 300 m3/s four times. The number of occurrences of streamflows greater than 100 m3/s increased in the three subsequent periods compared to the baseline period. When compared to the CC impact in the RCP 4.5 scenario, there were 12, 13, and 28 times more streamflows of magnitude greater than 100 m3/s observed with the combined impact of CC and LULC. Similarly, 6, 12, and 14 times more streamflow of magnitude greater than 100 m3/s were observed with the combined impact of CC and LULC when compared to just the impact of CC in RCP 8.5 scenario. It was discovered that the combined impact of CC and LULC increased the maximum and minimum peak flows more than the impact of CC alone. The magnitude of maximum and minimum peak flows in the near-future period were 6.6% and 55.4% higher with the combined impact of CC and LULC under RCP 4.5 scenario. Maximum peak flow was reduced by −6.89% in the RCP 8.5 scenario, while minimum peak flow was increased by 74.6%. The maximum and minimum peak flows in the mid-future period were 32.8% and 74.6% higher, respectively, with the combined impact of CC and LULC than with only the CC impact under RCP 4.5. Maximum peak flow was reduced by −1.5% in the RCP 8.5 scenario, while minimum peak flow was increased by 65.03%. Maximum and minimum peak flows in the far future period were 26.9% higher with the combined impact of CC and LULC than with only CC impact under RCP 4.5 scenario. Maximum and minimum peak flows were increased by 7.8% and 59.3%, respectively, for the far future period in the RCP 8.5 scenario.

6. Conclusions

The impacts of LULC and climate change on streamflow, surface runoff, evapotranspiration, and total aquifer recharge in the Munneru River basin have been assessed in three future periods in this study. The LULC maps for future periods were predicted using the CA-Markov model, and it was discovered that the conversion of barren land into built-up land was relatively consistent, with little variation in agricultural land. Streamflow and other components of the water balance were influenced by the two major factors of climate and land use, particularly in the Munneru River basin. With respect to the baseline period, annual average precipitation increased by 233.15 mm and 287.47 mm, respectively, for the period 2021–2099 under RCP 4.5 and RCP 8.5 scenarios. In both scenarios, the annual average mean temperature rises by 1.8 °C and 2.21 °C, respectively. The combined impact of CC and LULC on average monthly mean streamflow (July–November) was 38.31%, which was 36.37% higher than the impact of CC in RCP 4.5 and RCP 8.5 scenarios. In comparison to the baseline period, there was an increasing trend in surface runoff and evapotranspiration in all three future periods. When only the CC impact was considered, the aquifer recharge showed an increasing trend pattern in the future periods, but a decreasing trend pattern was observed when both the LULC and the CC impacts were considered. Because of the increase in temperature, evapotranspiration was slightly increased in all three future periods under the impact of climate change. When compared to only CC impact in the far future period under RCP 8.5 scenario, the percentage change in streamflow was 54.64%, 71.84% more in the months of July and August with the combined impact of CC and LULC. As the built-up area grows in the basin, so does the imbalance between water supply and demand increases. In order to plan and manage water resources in a sustainable manner, it is necessary to adapt water management practices in the basin in light of future expected climatic changes. These findings may provide a solid foundation for the development of more effective climatic adaptation methods and integrated water resource management models for river basins in similar physiographic regions.

Author Contributions

K.N.L.: Data curation, Formal analysis, Investigation, Methodology, Software, Visualization, Writing—original draft, Writing—review & editing. V.R.K.: Conceptualization, Data curation, Funding acquisition, Investigation, Methodology, Project administration, Resources, Software, Validation, Visualization, Writing—original draft, Writing—review & editing. E.S.B.: Data curation, Formal analysis, Investigation, Methodology, Software, Visualization, Writing—original draft, Writing—review & editing. V.S.: Conceptualization, Investigation, Software, Supervision, Validation, Writing—review & editing. All authors have read and agreed to the published version of the manuscript.

Funding

This work is funded by the Department of Science and Technology (DST), Government of India, under BRICS—DST project with Grant No: DST/IMRCD/BRICS/PilotCall2/IWMM-BIS/2018 (G).

Institutional Review Board Statement

Not applicable.

Informed Consent Statement

Informed consent was obtained from all subjects involved in the study.

Data Availability Statement

Data available on request from the authors.

Acknowledgments

The corresponding author acknowledges the support by the Virginia Agricultural Experiment Station (Blacksburg) and the Hatch Program of the National Institute of Food and Agriculture, U.S. Department of Agriculture (Washington, DC, USA).

Conflicts of Interest

The authors declare no conflict of interest.

References

  1. Chanapathi, T.; Thatikonda, S.; Keesara, V.R.; Ponguru, N.S. Assessment of water resources and crop yield under future climate scenarios: A case study in a Warangal district of Telangana, India. J. Earth Syst. Sci. 2020, 129, 1–17. [Google Scholar] [CrossRef]
  2. Sharafati, A.; Pezeshki, E. A strategy to assess the uncertainty of a climate change impact on extreme hydrological events in the semi-arid Dehbar catchment in Iran. Theor. Appl. Climatol. 2020, 139, 389–402. [Google Scholar] [CrossRef]
  3. Sridhar, V.; Wedin, D.A. Hydrological behavior of Grasslands of the Sandhills: Water and Energy Balance Assessment from Measurements, Treatments and Modeling. Ecohydrology 2009, 2, 195–212. [Google Scholar] [CrossRef]
  4. Loukika, K.N.; Keesara, V.R.; Sridhar, V. Analysis of Land Use and Land Cover Using Machine Learning Algorithms on Google Earth Engine over the Munneru River Basin, India. Sustainability 2021, 13, 13758. [Google Scholar] [CrossRef]
  5. Sayasane, R.; Kawasaki, A.; Shrestha, S.; Takamatsu, M. Assessment of potential impacts of climate and land use changes on stream flow: A case study of the Nam Xong watershed in Lao PDR. J. Water Clim. Chang. 2016, 7, 184–197. [Google Scholar] [CrossRef]
  6. Sujatha, E.R.; Sridhar, V. Spatial Prediction of Erosion Risk of a small mountainous watershed using RUSLE: A case-study of the Palar sub-watershed in Kodaikanal, South India. Water 2018, 10, 1608. [Google Scholar] [CrossRef] [Green Version]
  7. Gong, X.; Bian, J.; Wang, Y.; Jia, Z.; Wan, H. Evaluating and Predicting the Effects of Land Use Changes on Water Quality Using SWAT and CA–Markov Models. Water Resour. Manag. 2019, 33, 4923–4938. [Google Scholar] [CrossRef]
  8. Sridhar, V.; Kang, H.; Ali, S.A. Human-induced alterations to land use and climate and their responses on hydrology and water management in the Mekong River basin. Water. 2019, 11, 1307. [Google Scholar] [CrossRef] [Green Version]
  9. Shang, X.; Jiang, X.; Jia, R.; Wei, C. Land use and climate change effects on surface runoff variations in the upper Heihe River basin. Water 2019, 11, 344. [Google Scholar] [CrossRef] [Green Version]
  10. Setti, S.; Maheswaran, R.; Radha, D.; Sridhar, V.; Barik, K.K.; Narasimham, M.L. Attribution of hydrologic changes in a tropical river basin to climate and land use change: A case study from India. ASCE J. Hydrol. Eng. 2020, 258, 5020015. [Google Scholar] [CrossRef]
  11. Dosdogru, F.; Kalin, L.; Wang, R.; Yen, H. Potential impacts of land use/cover and climate changes on ecologically relevant flows. J. Hydrol. 2020, 584, 124654. [Google Scholar] [CrossRef]
  12. Haghighi, A.T.; Darabi, H.; Shahedi, K.; Solaimani, K.; Kløve, B. A scenario-based approach for assessing the hydrological impacts of land use and climate change in the Marboreh Watershed, Iran. Environ. Modeling Assess. 2020, 25, 41–57. [Google Scholar] [CrossRef] [Green Version]
  13. Pandey, B.K.; Gosain, A.K.; Paul, G.; Khare, D. Climate change impact assessment on hydrology of a small watershed using semi-distributed model. Appl. Water Sci. 2017, 7, 2029–2041. [Google Scholar] [CrossRef] [Green Version]
  14. Mishra, Y.; Nakamura, T.; Babel, M.S.; Ninsawat, S.; Ochi, S. Impact of climate change on water resources of the Bheri River Basin, Nepal. Water 2018, 10, 220. [Google Scholar] [CrossRef] [Green Version]
  15. Saharia, A.M.; Sarma, A.K. Future climate change impact evaluation on hydrologic processes in the Bharalu and Basistha basins using SWAT model. Nat. Hazards 2018, 92, 1463–1488. [Google Scholar] [CrossRef]
  16. Guo, S.; Wang, J.; Xiong, L.; Ying, A.; Li, D. A macro-scale and semi-distributed monthly water balance model to predict climate change impacts in China. J. Hydrol. 2002, 268, 1–15. [Google Scholar] [CrossRef]
  17. Chanapathi, T.; Thatikonda, S.; Raghavan, S. Analysis of rainfall extremes and water yield of Krishna river basin under future climate scenarios. J. Hydrol. Reg. Stud. 2018, 19, 287–306. [Google Scholar] [CrossRef]
  18. Sridhar, V.; Jin, X.; Jaksa, W.T. Explaining the hydroclimatic variability and change in the Salmon River basin. Clim. Dyn. 2013, 40, 1921–1937. [Google Scholar] [CrossRef] [Green Version]
  19. Sridhar, V. Tracking the influence of irrigation on land surface fluxes and boundary layer climatology. J. Contemp. Water Res. Educ. 2013, 152, 79–93. [Google Scholar] [CrossRef]
  20. Devkota, L.; Gyawali, D.R. Impacts of climate change on hydrological regime and water resources management of the Koshi River Basin, Nepal. J. Hydrol. Reg. Stud. 2015, 4, 502–515. [Google Scholar] [CrossRef] [Green Version]
  21. Iskender, I.; Sajikumar, N. Evaluation of surface runoff estimation in ungauged watersheds using SWAT and GIUH. Procedia Technol. 2016, 24, 109–115. [Google Scholar] [CrossRef] [Green Version]
  22. Yang, J.; Reichert, P.; Abbaspour, K.C.; Xia, J.; Yang, H. Comparing uncertainty analysis techniques for a SWAT application to the Chaohe Basin in China. J. Hydrol. 2008, 358, 1–23. [Google Scholar] [CrossRef]
  23. Zhang, G.H.; Nearing, M.A.; Liu, B.Y. Potential effects of climate change on rainfall erosivity in the Yellow River basin of China. Trans. ASAE 2005, 48, 511–517. [Google Scholar] [CrossRef] [Green Version]
  24. Zhang, D.; Chen, X.; Yao, H.; Lin, B. Improved calibration scheme of SWAT by separating wet and dry seasons. Ecol. Model. 2015, 301, 54–61. [Google Scholar] [CrossRef] [Green Version]
  25. Zierl, B.; Bugmann, H. Global change impacts on hydrological processes in Alpine catchments. Water Resour. Res. 2005, 41. [Google Scholar] [CrossRef]
  26. Seong, C.; Sridhar, V.; Billah, M. Implications of potential evapotranspiration methods for streamflow estimation in a changing climate. Int. J. Climatol. 2018, 38, 896–914. [Google Scholar] [CrossRef]
  27. Gautam, S.; Costello, C.; Baffaut, C.; Thompson, A.; Svoma, B.M.; Phung, Q.A.; Sadler, E.J. Assessing long-term hydrological impact of climate change using an ensemble approach and comparison with global gridded model-a case study on goodwater creek experimental watershed. Water 2018, 10, 564. [Google Scholar] [CrossRef] [Green Version]
  28. Sridhar, V.; Anderson, K.A. Human-induced modifications to boundary layer fluxes and their water management implications in a changing climate. Agric. For. Meteorol. 2017, 234, 66–79. [Google Scholar] [CrossRef] [Green Version]
  29. Jaksa, W.T.A.; Sridhar, V. Effect of irrigation in simulating long-term evapotranspiration climatology in a human-dominated river basin system. Agric. For. Meteorol. 2015, 200, 109–118. [Google Scholar] [CrossRef]
  30. Bejagam, V.; Keesara, V.R.; Sridhar, V. Impacts of climate change on water provisional services in the Tungabhadra basin using InVEST model. River Res. Appl. 2021, 37, 9. [Google Scholar] [CrossRef]
  31. Sridhar, V.; Modi, P.; Billah, M.M.; Valayamkunnath, P.; Goodall, J.L. Precipitation Extremes and Flood Frequency in a Changing Climate in Southeastern Virginia. J. Am. Water Resour. Assoc. 2019, 55, 780–799. [Google Scholar] [CrossRef]
  32. Kang, H.; Sridhar, V. Assessment of future drought conditions in the Chesapeake Bay watershed. J. Am. Water Resour. Assoc. 2017, 54, 160–183. [Google Scholar] [CrossRef]
  33. Sehgal, V.; Sridhar, V. Effect of hydroclimatological teleconnections on watershed-scale drought predictability in Southeastern U.S. Int. J. Climatol. 2018, 38, e1139–e1157. [Google Scholar] [CrossRef]
  34. Sujatha, E.R.; Sridhar, V. Mapping using Weighted Linear Combination model: A case study of hill sub-watershed in Kodaikkanal, Western Ghats, South India. Remote Sens. Appl. Soc. Environ. 2019, 14, 34–45. [Google Scholar] [CrossRef]
  35. Eastman, J.R.; Idrisi, A. Guide to GIS and Image Processing; Clark Laboratory Clark University: Worcester, MA, USA, 2006. [Google Scholar]
  36. Eastman, J.R. Idrisi Selva Tutorial; IDRISI Production, Clark Labs-Clark University: Worcester, MA, USA, 2012. [Google Scholar]
  37. Fleiss, J.L.; Cohen, J. The equivalence of weighted kappa and the intraclass correlation coefficient as measures of reliability. Educ. Psychol. Meas. 1973, 33, 613–619. [Google Scholar] [CrossRef]
  38. Moriasi, D.N.; Arnold, J.G.; Van Liew, M.W.; Bingner, R.L.; Harmel, R.D.; Veith, T.L. Model evaluation guidelines for systematic quantification of accuracy in watershed simulations. Trans. ASABE 2007, 50, 885–900. [Google Scholar] [CrossRef]
  39. Tan, M.L.; Gassman, P.W.; Srinivasan, R.; Arnold, J.G.; Yang, X. A Review of SWAT Studies in Southeast Asia: Applications, Challenges and Future Directions. Water 2019, 11, 914. [Google Scholar] [CrossRef] [Green Version]
  40. Buri, E.S.; Keesara, V.R.; Loukika, K.N.; Sridhar, V. Spatio-Temporal Analysis of Climatic Variables in the Munneru River Basin, India, Using NEX-GDDP Data and the REA Approach. Sustainability 2022, 14, 1715. [Google Scholar] [CrossRef]
  41. Alam, S.; Ali, M.M.; Islam, Z. Future streamflow of Brahmaputra River basin under synthetic climate change scenarios. J. Hydrol. Eng. 2016, 21, 5016027. [Google Scholar] [CrossRef]
Figure 1. The location map of Munneru basin.
Sustainability 14 05000 g001
Figure 2. DEM, Soil and LULC map of the Munneru basin.
Sustainability 14 05000 g002
Figure 3. Methodology flowchart for the present study.
Sustainability 14 05000 g003
Figure 4. LULC maps of 2005 (NRSC), 2010 (NRSC) and 2015 (NRSC & CA Markov simulated).
Sustainability 14 05000 g004
Figure 5. Future projected LULC maps for the Munneru basin using CA-Markov Model.
Sustainability 14 05000 g005
Figure 6. Observed and SWAT simulated average monthly streamflow over the Munneru basin (1983–2017).
Sustainability 14 05000 g006
Figure 7. Variation of streamflow for simulated and RCM modeled data (1983–2005).
Sustainability 14 05000 g007
Figure 8. Monthly streamflow and precipitation variations under climate change scenarios (a) 2021–2039 (b) 2040–2069 (c) 2070–2099.
Sustainability 14 05000 g008
Figure 9. Monthly streamflow variation (July–November) under climate change scenarios (a) 2021–2039 (b) 2040–2069 (c) 2070–2099.
Sustainability 14 05000 g009
Figure 10. Variation in the percentage change in future streamflow (July–November) compared to the baseline period under climate change scenarios.
Sustainability 14 05000 g010
Figure 11. Variations in average monthly streamflow and precipitation caused by LULC and climate change scenarios (a) 2021–2039 (b) 2040–2069 (c) 2070–2099.
Sustainability 14 05000 g011
Figure 12. Variation in monthly streamflow (July–November) under both climate change and LULC scenarios under RCP 4. 5 and RCP 8.5, (a) 2021–2039 (b) 2040–2069 (c) 2070–2099.
Sustainability 14 05000 g012
Figure 13. Variation of percentage change in streamflow (July–November) with respect to the baseline period with combined effect of LULC and climate change.
Sustainability 14 05000 g013
Table 1. Description of the types of LULCs present in the study area and their corresponding SWAT codes.
S.No.Land Use Terminology (NRSC)SWAT Land Use NameSWAT Code
1Built-upUrban LandURBN
2Kharif cropAgricultural Land-GenericAGRL
3Rabi cropAgricultural Land-GenericAGRL
4Double/Triple cropAgricultural Land-Row CropsAGRR
5Current FallowAgricultural Land-GenericAGRL
6PlantationTreesOAK
7Deciduous ForestDeciduous ForestFRSD
8Degraded or Scrub ForestRange Scrub landRNGB
9WastelandBarren Land BARR
10Waterbodies MaximumWater BodiesWATR
11Waterbodies MinimumWater BodiesWATR
Table 2. Percentages of different LULC types in different years.
Land Use/Year2005 (%)2010 (%)2015 (%)2015 Simulated (%)2030 (%)2050 (%)2080 (%)
FRSD12.5712.5712.5212.5412.4112.3812.21
AGRL39.131.8335.4136.446.1445.0445.76
URBN3.033.583.633.895.246.247.05
RNGB0.930.930.940.930.920.890.81
AGRR24.0831.7930.2728.5419.2919.3519.47
WATR5.395.395.195.155.025.065.39
BARR9.478.486.587.065.395.393.61
OAK5.435.435.455.485.535.585.7
Table 3. Calibrated parameters and their ranges used in SWAT CUP.
S. No.ParameterFile ExtensionMethodMinimum ValueMaximum ValueFitted Value
1CN2 .mgtr_Relative−0.10.10.0284
2GW_REVAP.gwv_Replace0.020.20.125
3ALPHA_BF .gwv_Replace010.632
4GW_DELAY .gwa_Absolute−306017.880
5GWQMN .gwa_Absolute−10001000−148.5
6RCHRG_DP .gwa_Absolute−0.050.050.022
7ALPHA_BF_D .gwv_Replace010.663
8SOL_AWC .solr_Relative−0.10.10.148
9EPCO.hruv_Replace010.994
10ESCO .hruv_Replace010.206
11SLSUBBSN.hrur_Relative−0.20.2−0.131
12SURLAG .bsnr_Relative−0.20.2−0.098
Note: CN2: SCS curve number; GW_REVAP: groundwater “revap” coefficient; ALPHA_BF: base flow alpha factor; GW_DELAY: groundwater delay; GWQMN: threshold depth of water in the shallow aquifer required for return flow to occur; RCHRG_DP: deep aquifer percolation fraction; ALPHA_BF_D: alpha factor for groundwater recession curve of the deep aquifer; SOL_AWC: available water capacity of the soil layer; EPCO: plant uptake compensation factor; ESCO: soil evaporation compensation factor; SLSUBBSN: average slope length; SURLAG: surface runoff lag time.
Table 4. Important water balance components in baseline and future periods under the impact of climate change.
Period/1983–20052021–20392040–20692070–2099
ComponentBaseline RCP 4.5RCP 8.5RCP 4.5RCP 8.5RCP 4.5RCP 8.5
Precipitation (mm/year)938962.51062.21030.31111.41101.21214.4
Surface Runoff (mm/year)86.2396.19 153.91 114.39 169.89 136.08 211.78
Evapotranspiration (mm/year)600608 609.8628.2 629.1 639.2666.1
Total Aquifer Recharge (mm/year)244.39249.41 285.78276.95 300.89 314.22 324.9
Table 5. Important water balance components in baseline and future periods under climate change and combined effects of LULC and climate change.
Period/1983–20052021–20392040–20692070–2099
ComponentBaseline RCP 4.5RCP 8.5RCP 4.5RCP 8.5RCP 4.5RCP 8.5
Precipitation (mm)938962.51062.21030.31111.41101.21214.4
Surface Runoff (mm)86.23146.89 216.76 173.7 237.35 159.31 290.18
Evapotranspiration (mm)600654.1 656.3674 676.7 663.2714.5
Total Aquifer Recharge (mm)244.39134.38 157153.96 167 261.24 178.64
Publisher’s Note: MDPI stays neutral with regard to jurisdictional claims in published maps and institutional affiliations.