2.2.2. Flood Conditioning Factors
Flood conditioning factors are the topographical, hydrological, or socio-economic variables that influence the occurrence or magnitude of flooding incidents. Each factor acts independently and in unison to form a flood incident. Existing literature on flood modelling was considered [
38,
39,
40,
41,
42]. In addition to consulting previous literature, the selection of the final set of conditioning factors was based on conducting surveys on the factors that had a significant impact on the local territory of Nigeria.
The selection of flood conditioning factors is commonly chosen based on past research and expert opinions. However, because each region comprises diverse natural and anthropogenic components [
43], it is vital to acquire geographical knowledge about the study area and its surroundings in flood modelling. As a result, the criteria for selecting the conditioning factors for this study are discussed in the following sections. The flood conditioning factors in this study are categorised into two groups, namely, natural and anthropogenic factors. The natural factors include the topographic, hydrographic, and climatic components of the study area, while the anthropogenic factors are the components influenced by human activities, including road network and land use. A digital elevation model (DEM) with a 30-m spatial resolution produced by the USGS Earthexplorer was used to derive other related parameters. Afterwards, aspect ratio (
Figure 4F), slope (
Figure 4E), curvature (
Figure 4G), SPI (
Figure 4C), and TWI (
Figure 4B) were derived from the elevation data. Finally, the QGIS and SAGA GIS software was used to produce the final maps of the slope, aspect, TWI, SPI, and curvature.
New research [
44,
45] found that the topography of a place has a vital role in determining the severity of floods and identifying flood-prone locations. The elevation is selected as a conditioning factor due to its importance in the occurrence of floods because previous literature shows that locations with a high elevation increase runoff, whereas flat areas are more prone to flooding owing to high water discharge [
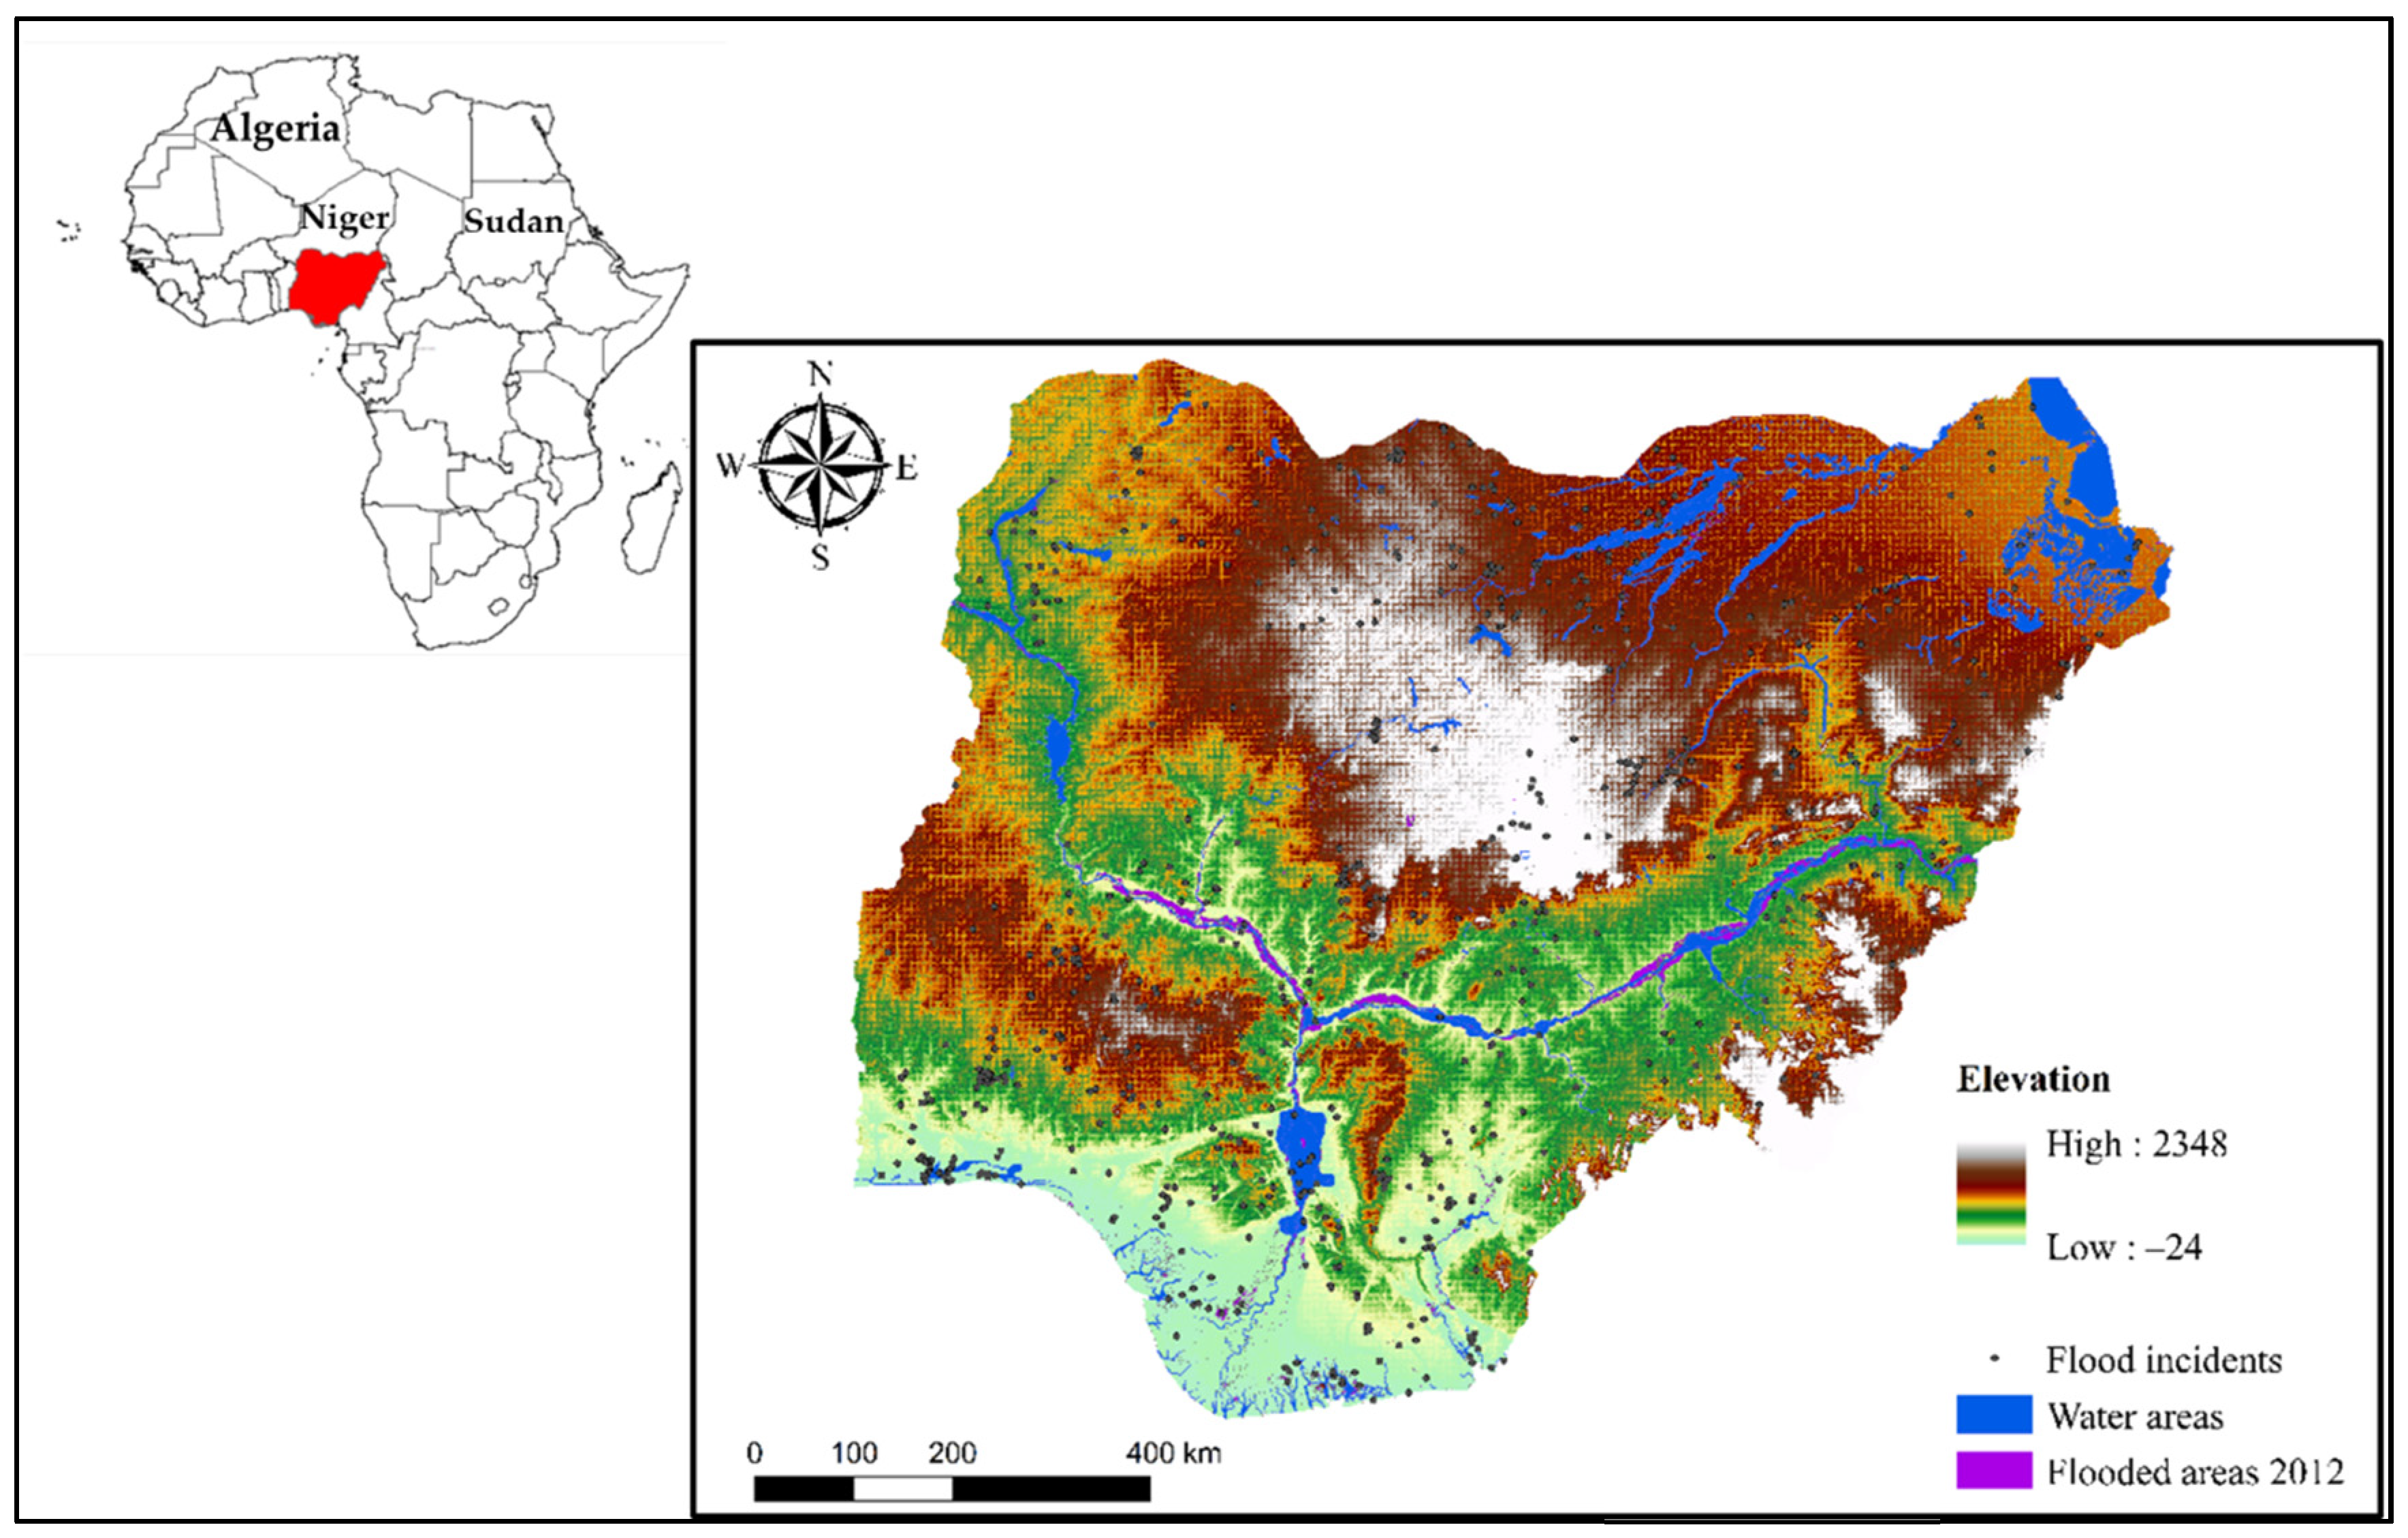
46]. In the case of Nigeria, the southern regions close to the major rivers and the Atlantic Ocean have very low elevations, which makes an excellent factor for flood susceptibility mapping. Similarly, as water travels from higher to lower elevations, the degree of slope affects surface runoff and water infiltration rate [
47]. Therefore, low degree slope areas are prone to flooding, which makes slope as a conditioning factor becoming vital in flood conditioning factors selection [
48].
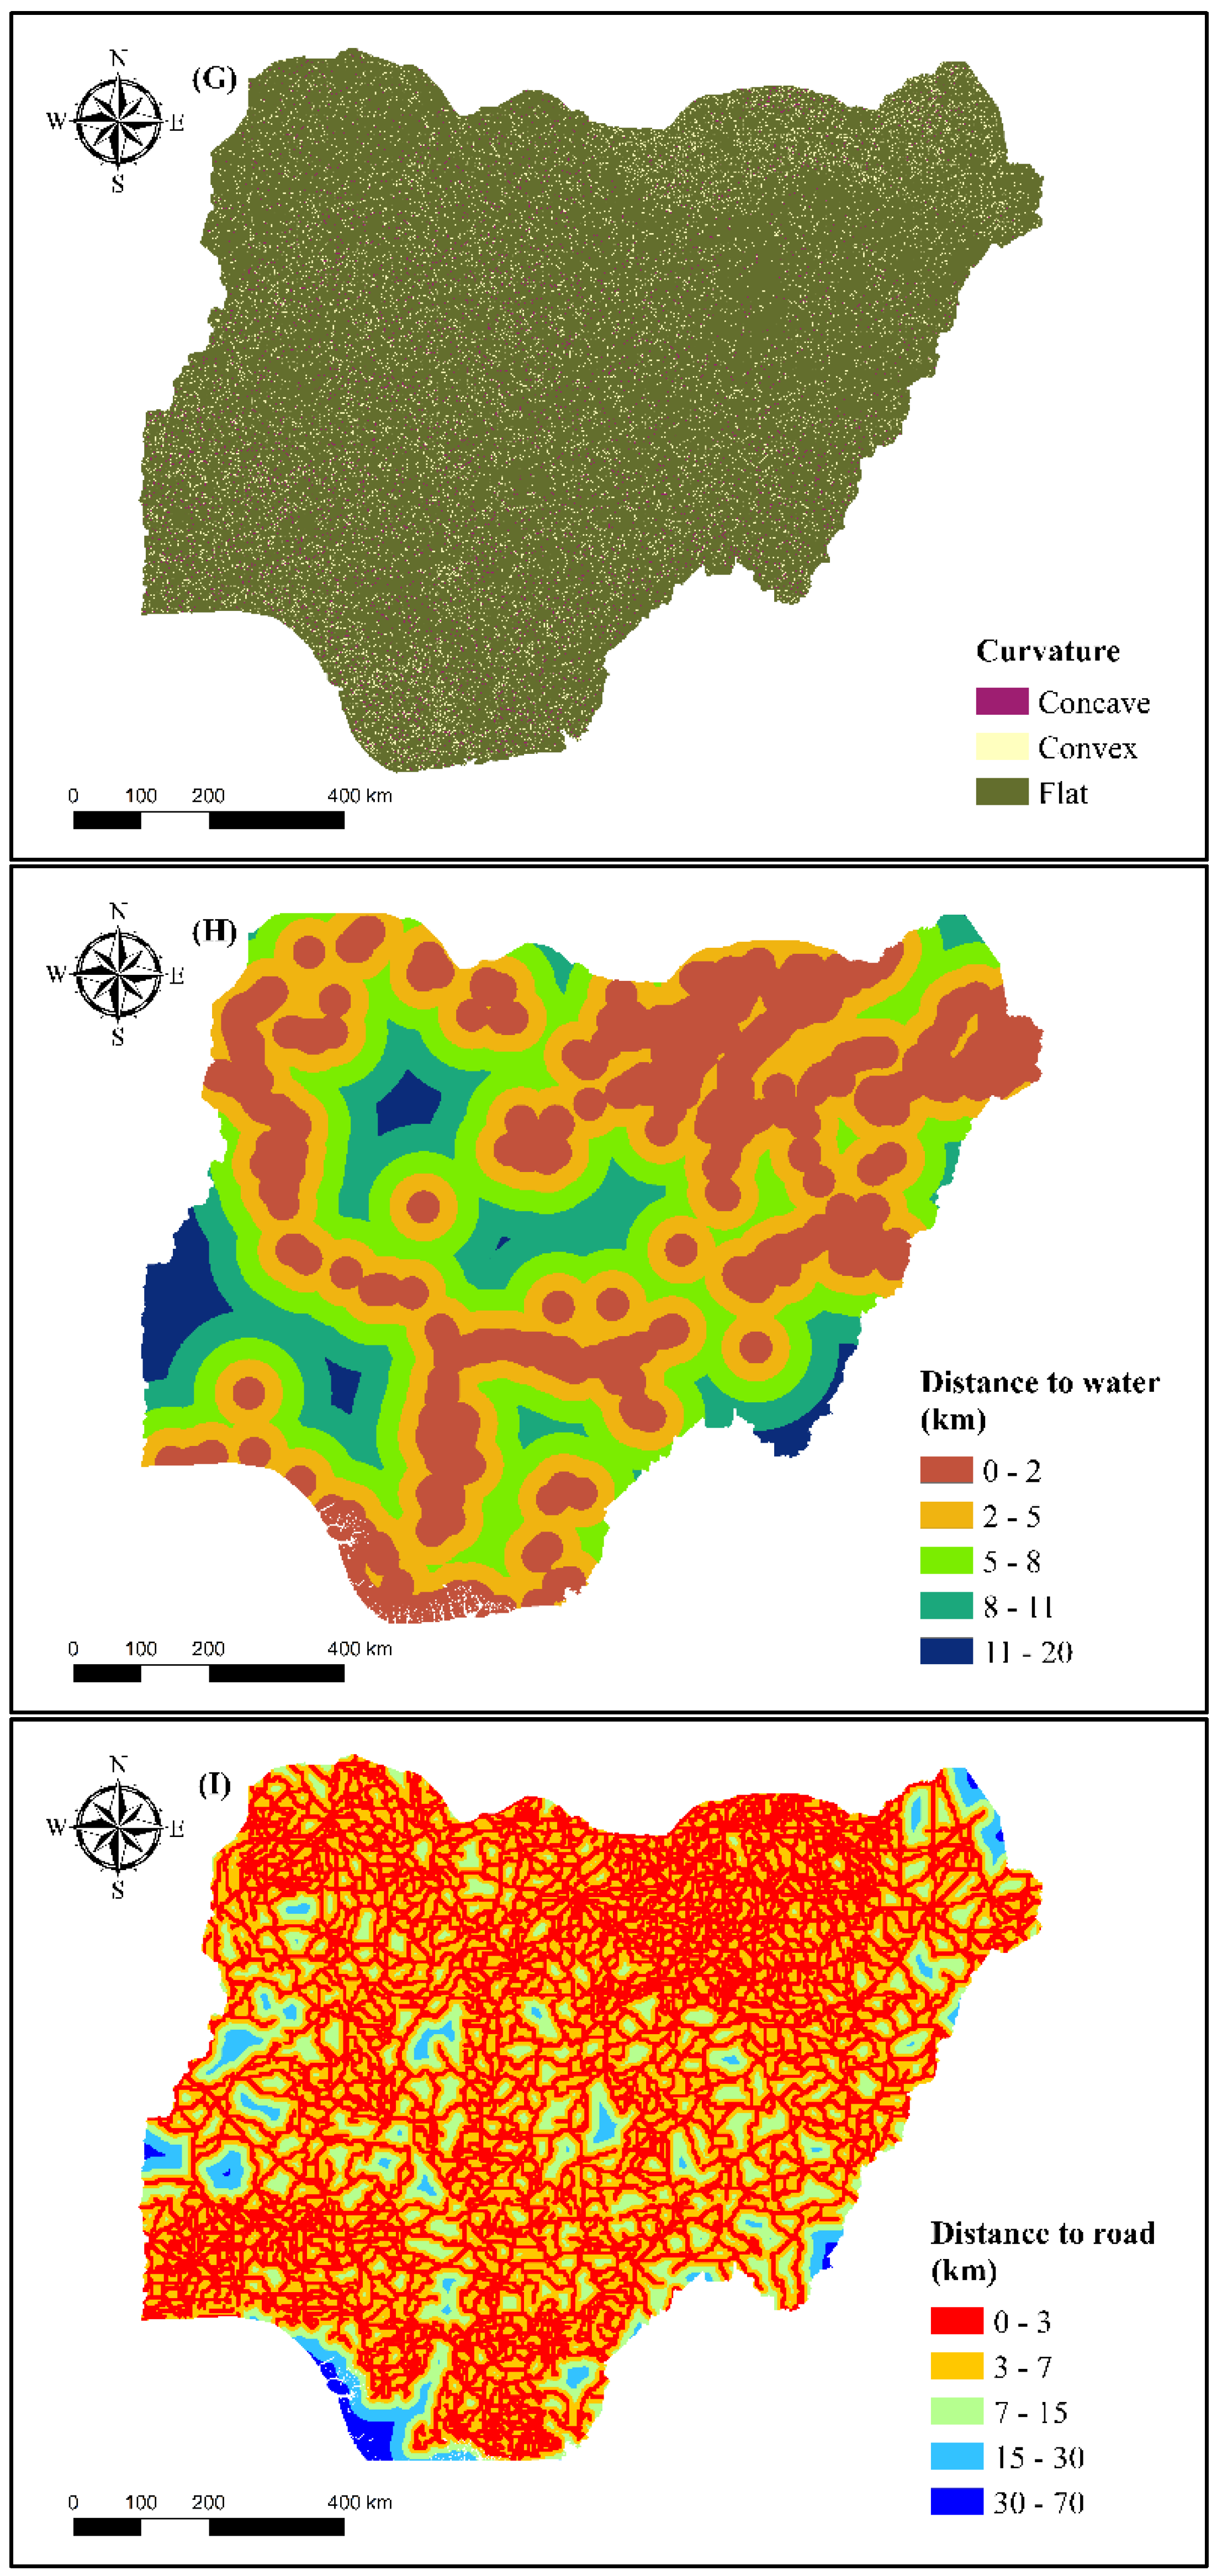
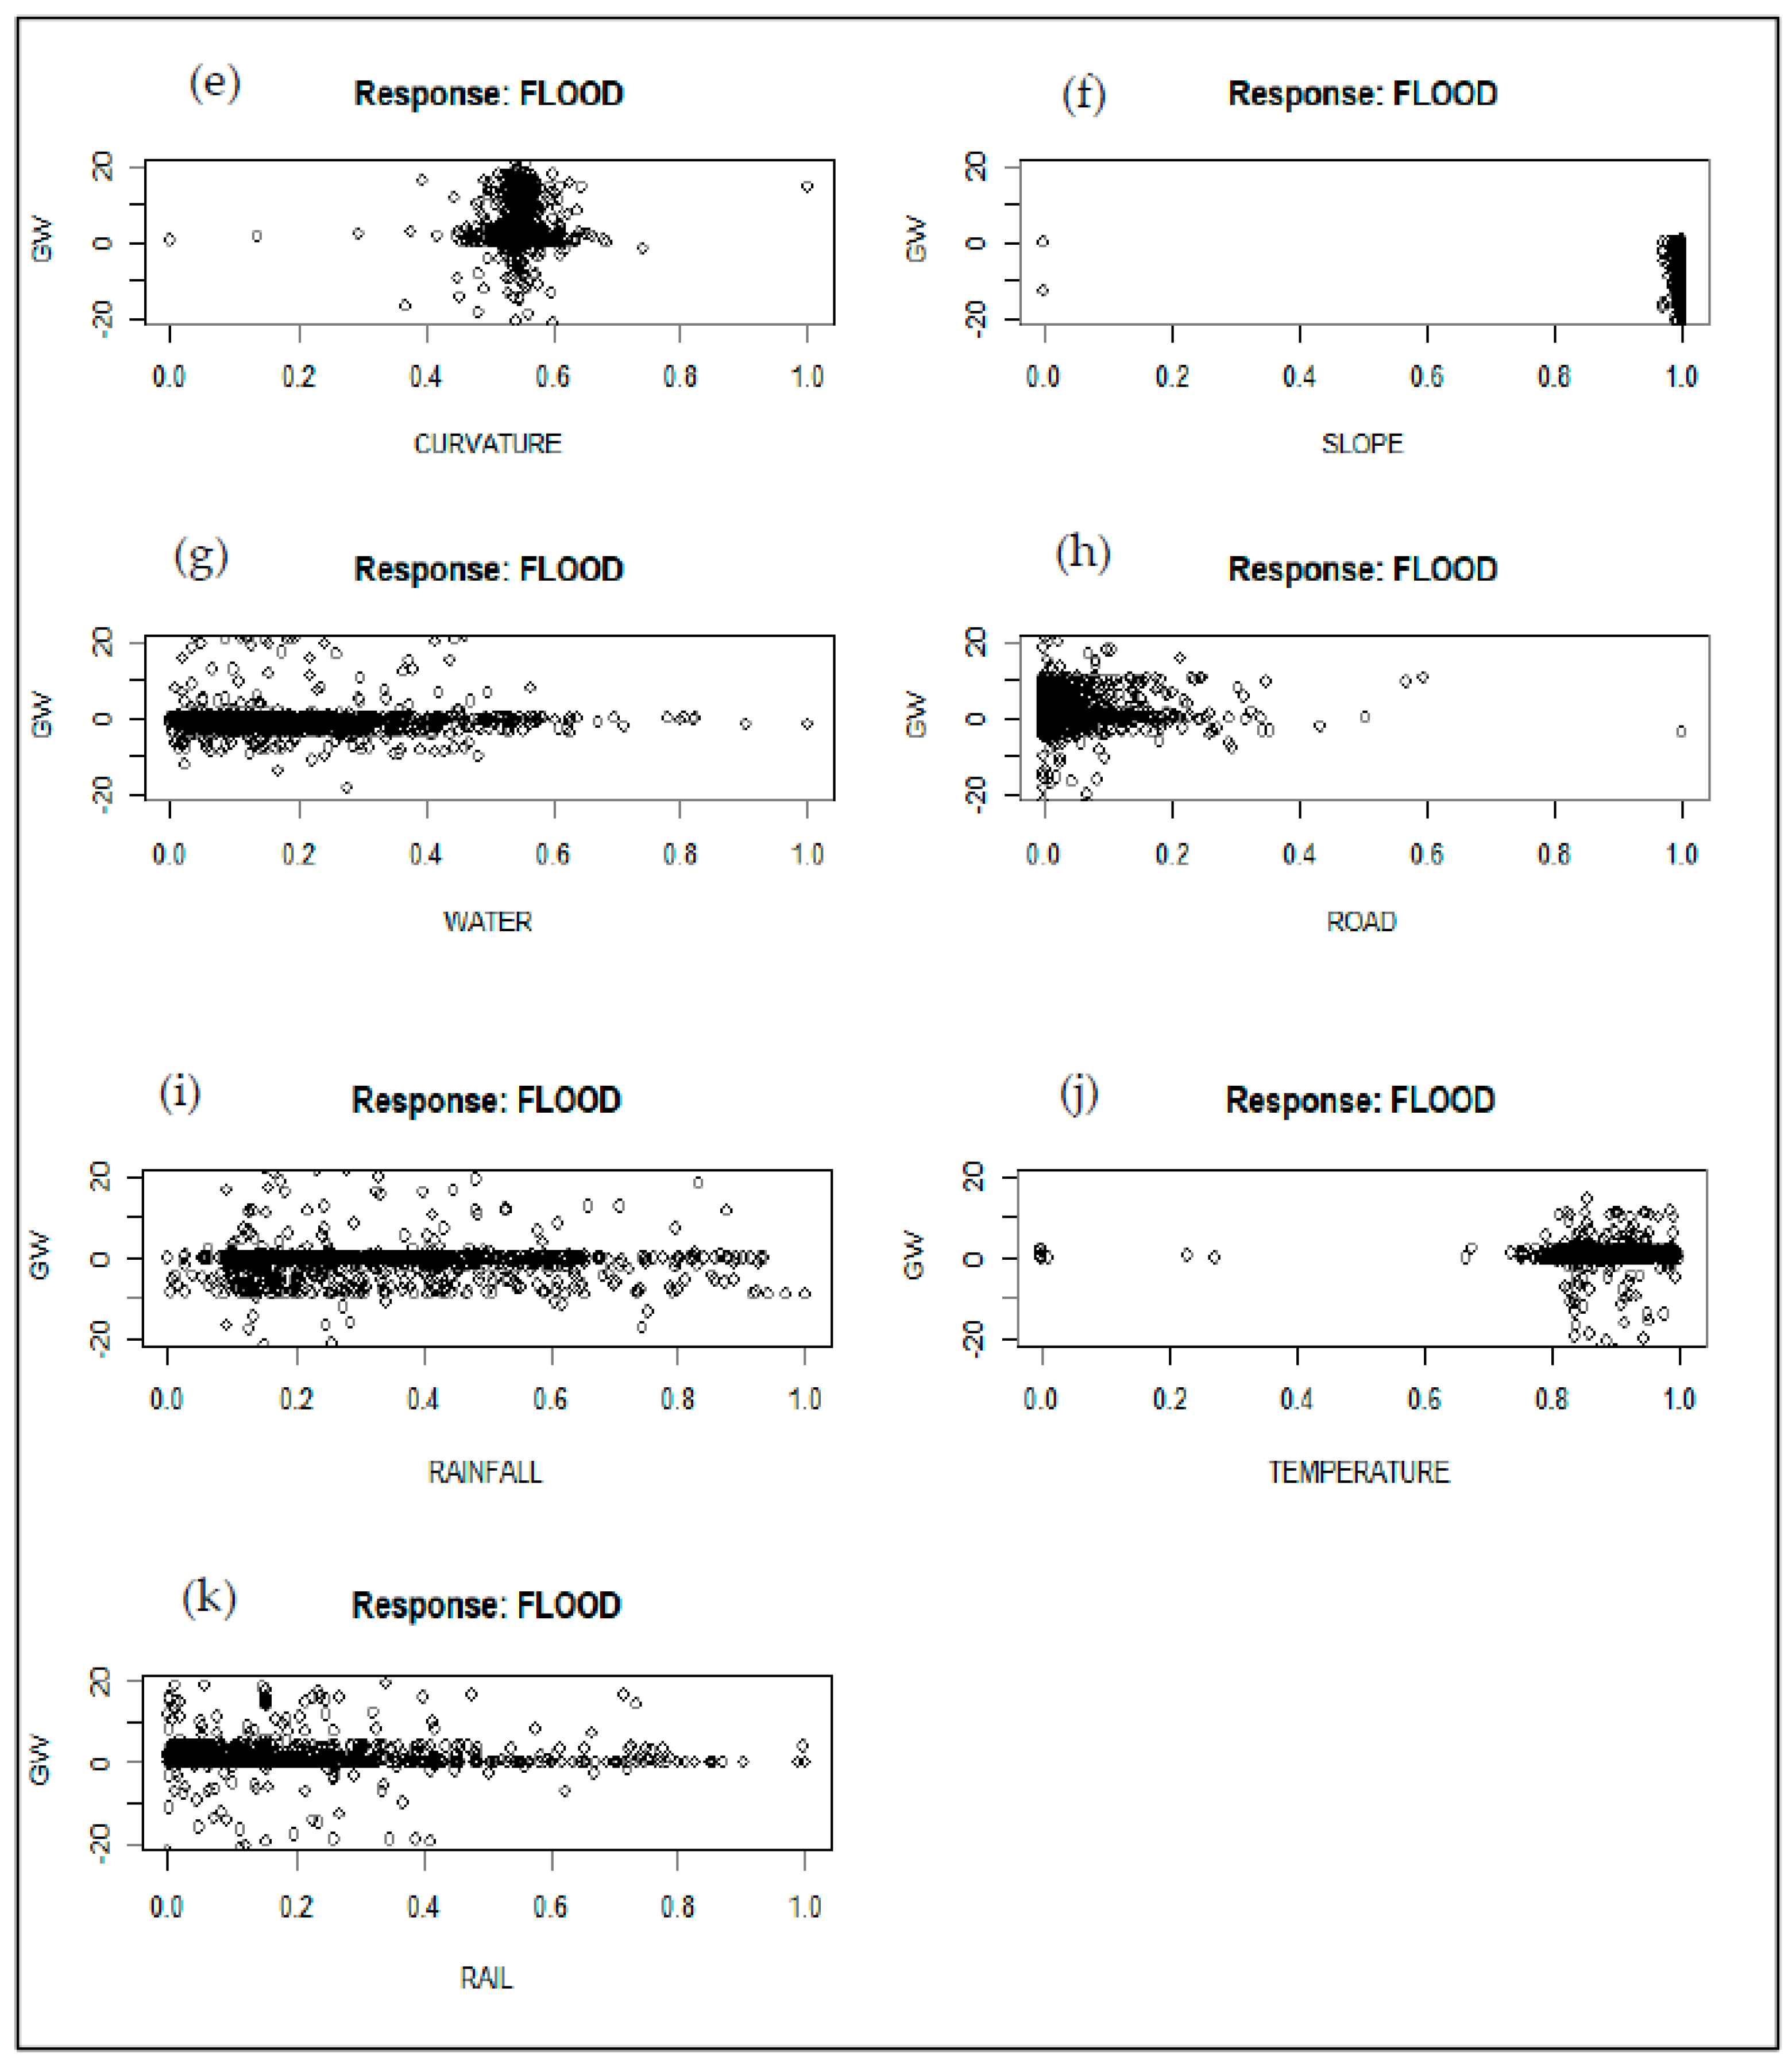
Curvature is a morphometric feature that impacts the occurrence of floods by identifying the divergent and convergent runoff zones. Curvature can either be flat (zero curvature), convex (positive curvature), or concave (negative curvature). Flooding is more likely to occur in flat and concave areas [
49], as these areas tend to hold water longer than those with convex shapes [
50]. The aspect of the topographic surface is the horizontal direction in which a slope face. It considers weathering consequences because of the quantity of rainfall, making it an essential factor in flood analysis [
51].
Furthermore, the hydrological factors stream power index (SPI) and topographic wetness index (TWI) were also considered conditioning factors in the study. The SPI is one of the most essential and extensively utilised parameters in most flood modelling studies, as it measures the erosive strength of runoff [
52]. It also indicates the erosive power and concentration of surface runoffs, which plays a vital role in terrain stability. As a result, it helps determine where soil conservation measures might help prevent erosion from surface runoff. The TWI defines the flow and accumulation of water at a given place within a watershed due to gravitational force. The TWI detects flood-prone locations within a watershed because steeper slopes have a lower filtration rate than level terrains [
53]. As a result, TWI reveals the infiltration capacity in a region and flood-prone zones. Roughness deals with variations in surface changes and irregularities. These elements, such as trees, shrubs, and logs, can be found on the topographical surface. Modelling the floodplain’s hydrology requires mapping the geographical distribution of these roughness characteristics at various scales [
54] and how they contribute to flooding incidents. As such, the roughness was considered a conditioning factor in this study.
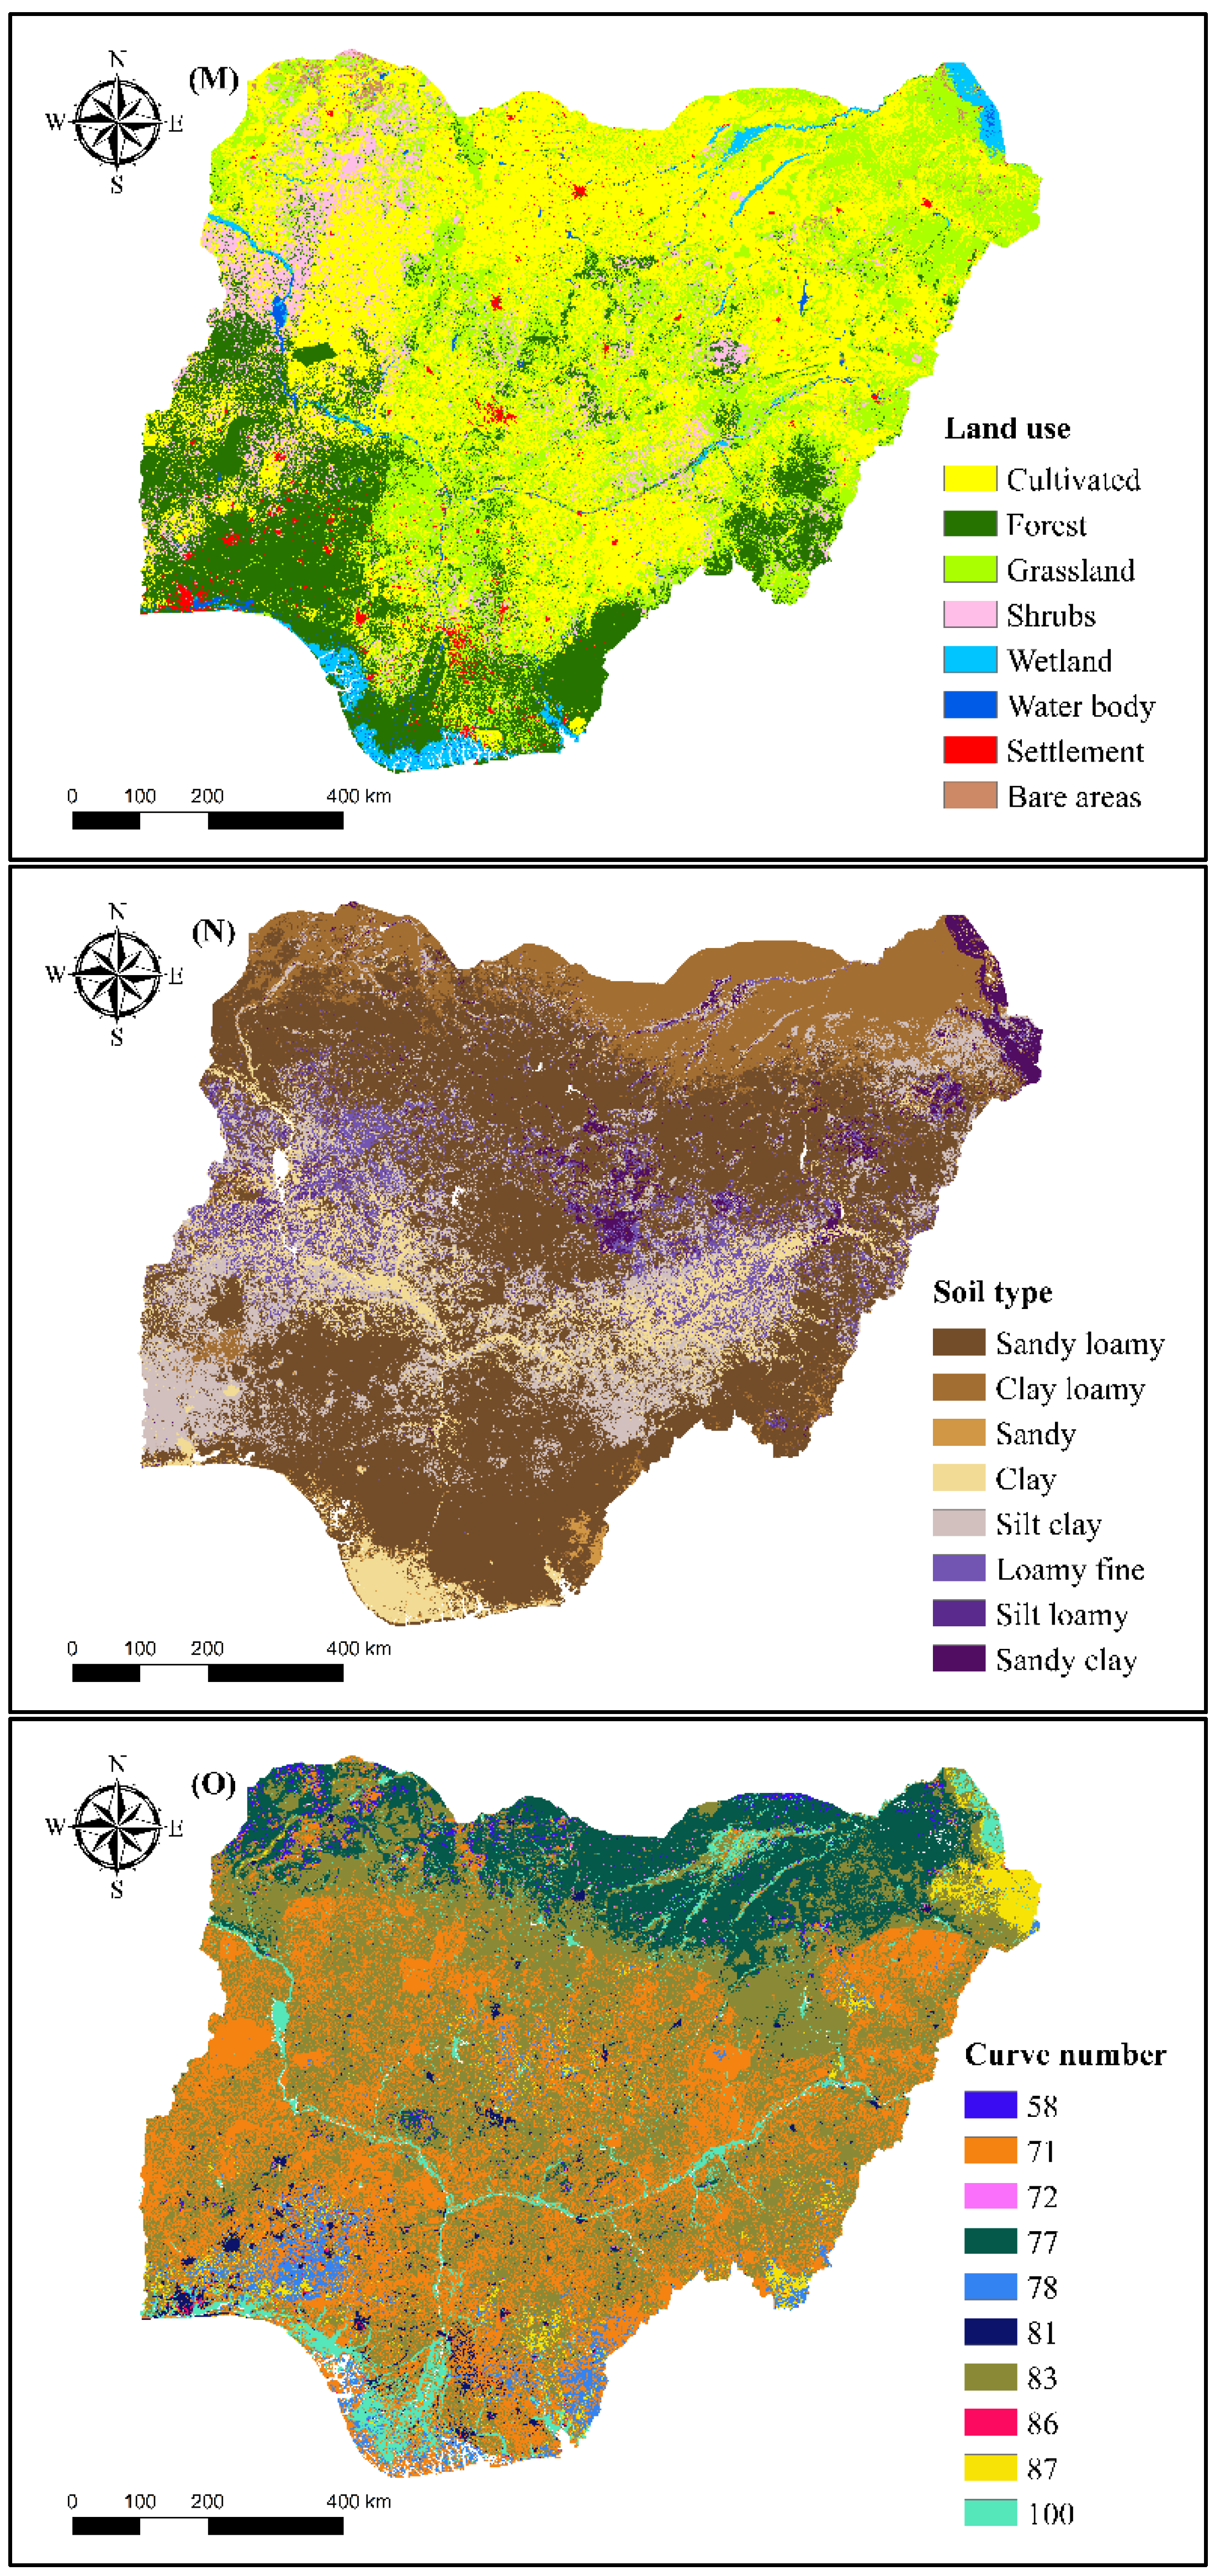
Soil properties vary by area due to differences in particle composition, which impacts the amount of water filtration. The amount and pace of water infiltration and runoff determine the soil’s texture, type, and structure. Soil types were selected as a conditioning factor because Nigeria possesses multiple soil characteristics which can shed light on the nature and cause of flooding across its region. The curve number (CN) was chosen as the key index for runoff circumstances. The curve number (CN) is an empirical metric for calculating direct runoff or infiltration from excess rainfall in hydrology.
In addition, land use plays an essential part in flood occurrence; urban areas are more prone to flooding owing to the presence of imperviousness surfaces such as roads and building structures, whereas vegetated regions are less likely to trigger flooding incidents, especially in areas with higher vegetative cover such as forests. As a result, land use is selected as a flood conditioning factor, as it can highlight the link between land utilisation and the probability of flooding.
In most flood studies, rainfall has been identified as an essential factor in flood occurrence [
55]. Rainfall has a substantial impact on flood occurrence due to its geographical and temporal patterns; as a result, an increase in rainfall leads to a considerable rise in the likelihood of flooding [
56,
57,
58]. Climate change has the potential to affect flood risk and water resource management. Mitigation planning should be able to forecast changes in floods and their occurrence. Recorded temperature correlations inform changes in hydrologic extremes, ranging from basic proportional change techniques to conditioning stochastic rainfall production based on observed temperatures. As temperature changes can potentially alter the amount of precipitation/rainfall at a given location, affecting the probability of flooding incidents. The temperature was considered a conditioning factor, as Wasko [
59] highlighted the sensitivities between temperature changes, precipitation, and increase in flow volume at the peak of flooding incidents [
59]. In Nigeria’s case, the considerable variation in temperature distribution across the geographical region is a cause for integration and further investigation into the factors that affect flood occurrence.
Studies show that flooding is influenced by the distance from the river, which can determine the extent and size of the flood [
60]. A river floods when the volume of water surpasses the capacity of the river network [
61]. In Nigeria, most flooding incidents occur when the riverbanks overflow into settlement and agricultural land areas within proximity to existing rivers. As a result, the river’s distance must be considered an influencing element.
Distances from road and rail networks can influence flooding. Road and other artificial surfaces increase water inundation due to their imperviousness and create a conduit for water flow. Hence, lowering the infiltration rate, resulting in a higher runoff rate [
62]. Similarly, human settlements are likely to be situated close to roads, which exposes them to a higher probability of flooding. As a result, the distance to the road was selected as a flood conditioning factor.
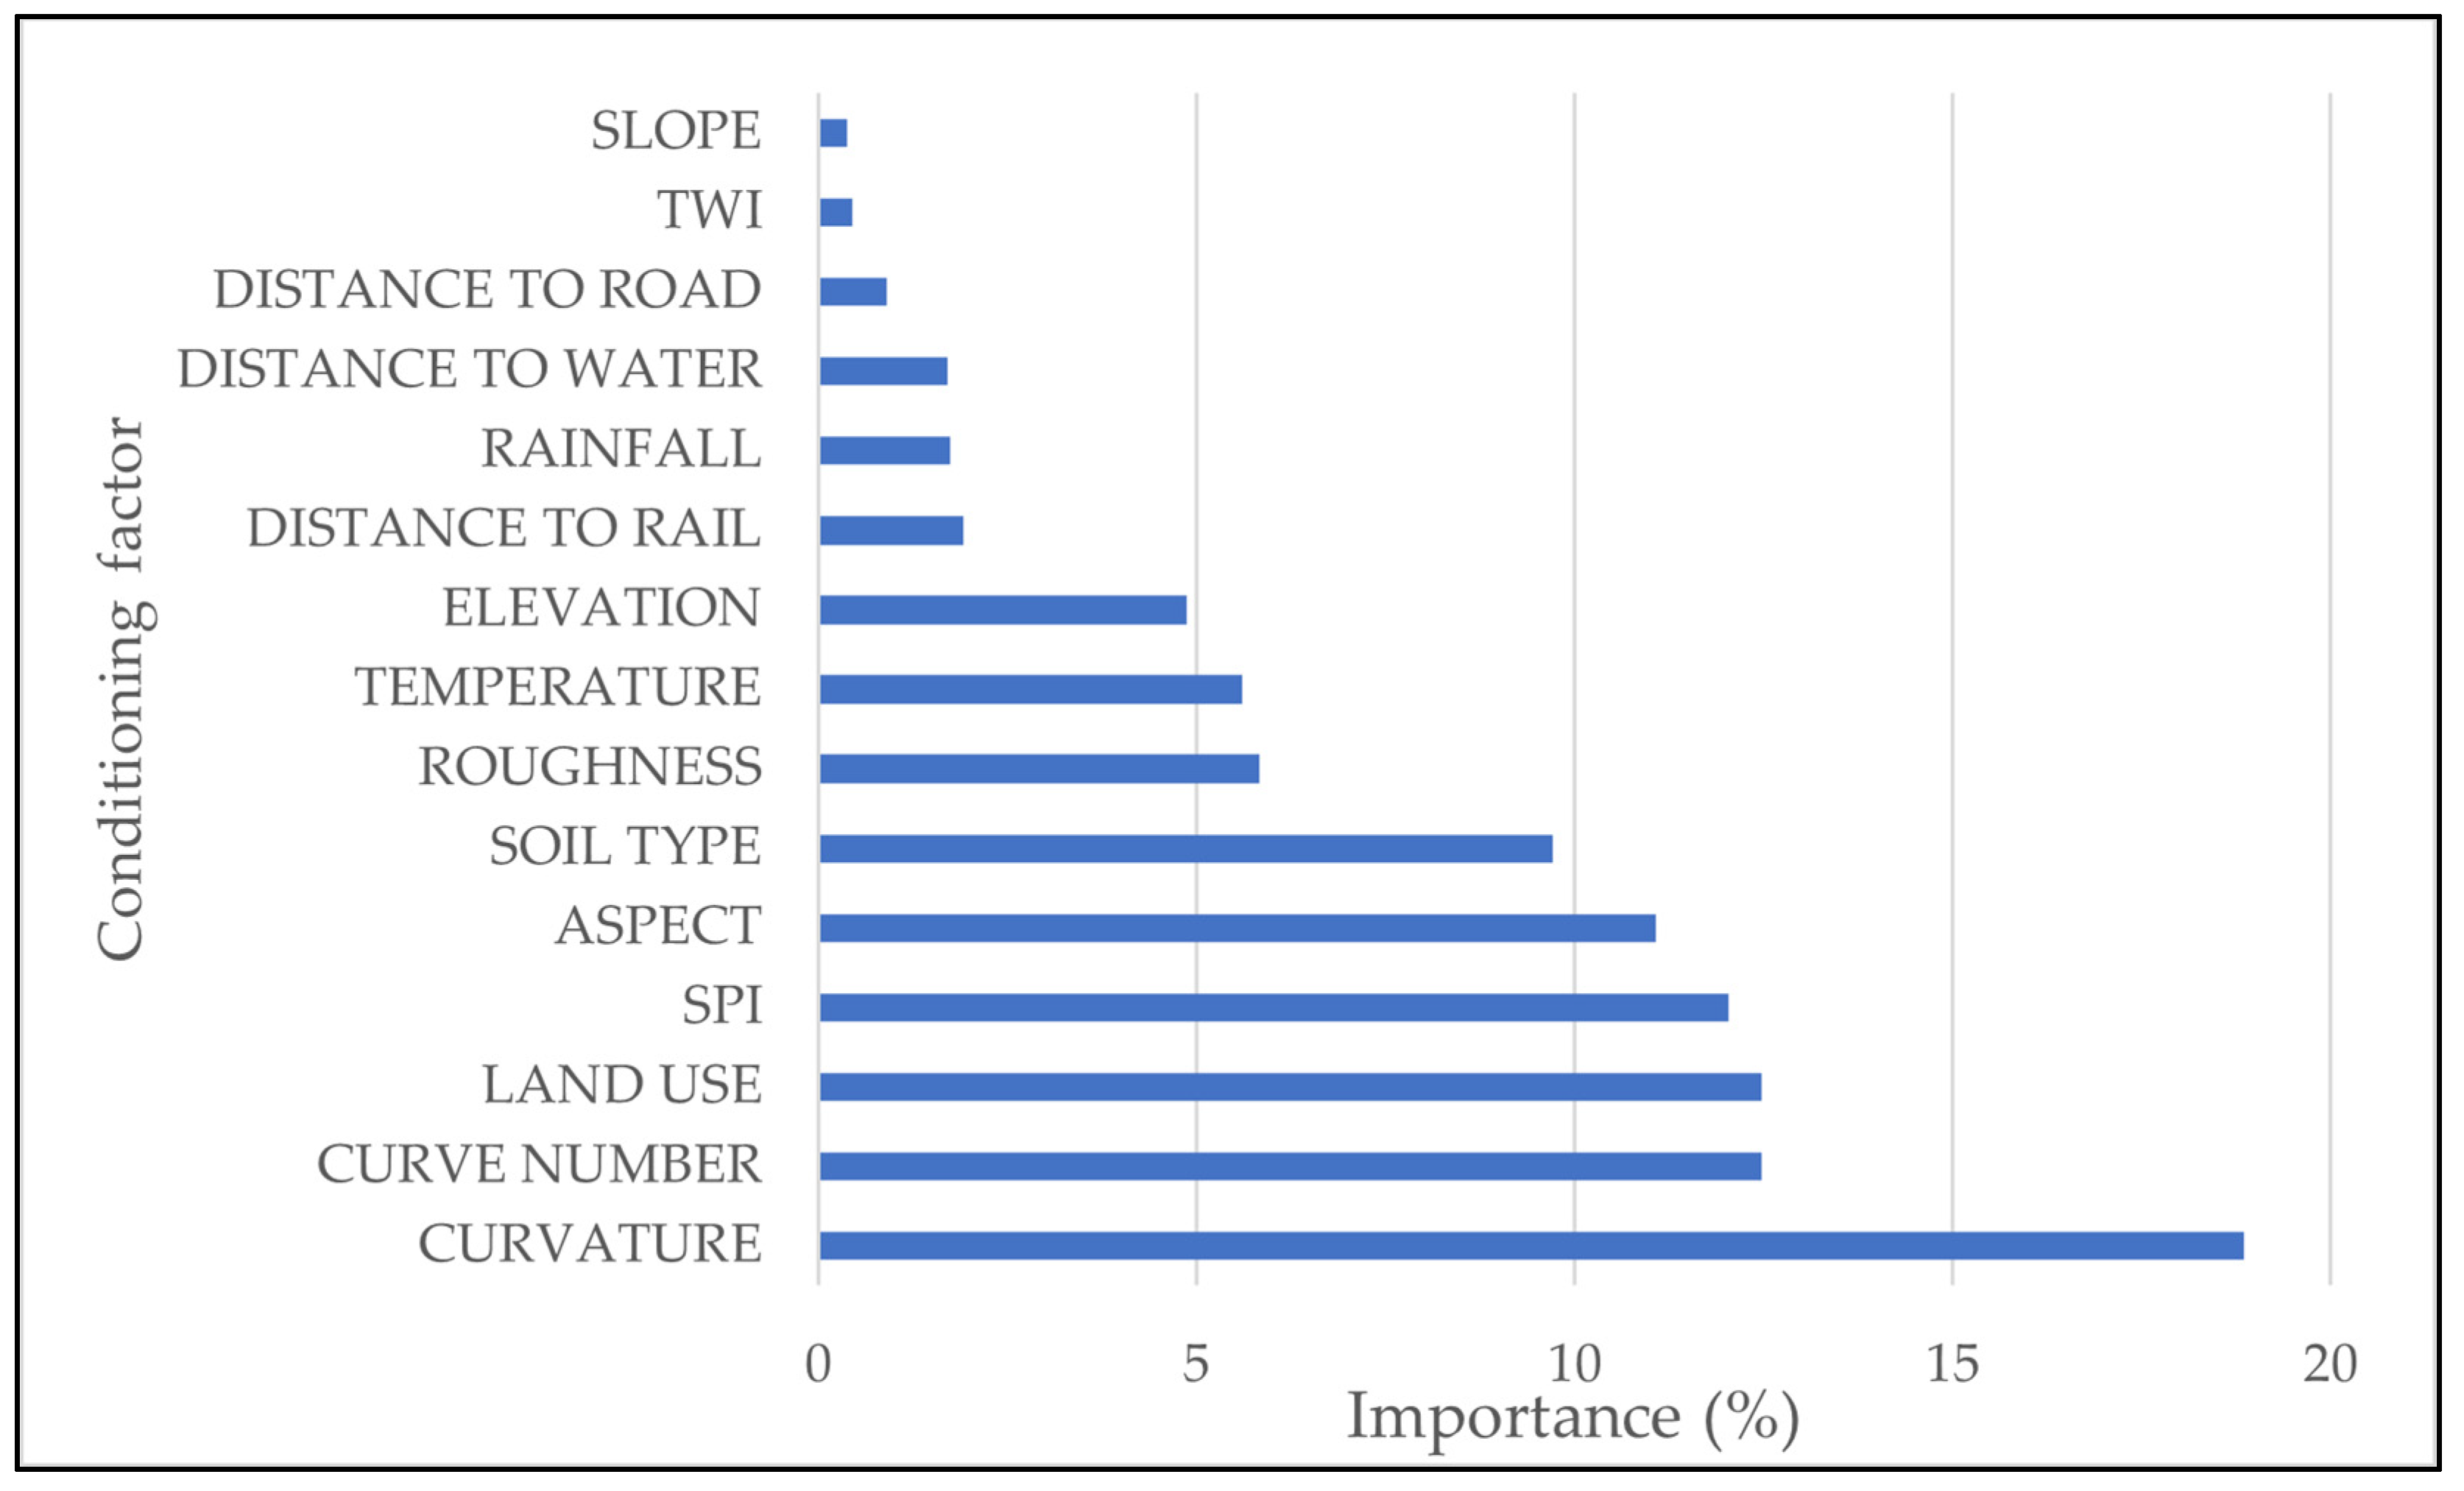
Overall, the study used a total of fifteen (15) variables: elevation, roughness, slope, curvature, curve number, stream power index (SPI), rainfall, topographic wetness index (TWI), aspect ratio, soil type, land cover, distances to the road, water, and rail, and temperature to predict flood susceptible areas in Nigeria. (
Table 2,
Figure 4A–O). Further details on each conditioning factor are found in the subsections that follow.
To ensure uniformity of the raster datasets with different resolutions in the modelling process, we utilised the resample function in ArcGIS to derive a standard resolution and projection at 30-m. Here, we selected the bilinear interpolation method to calculate the pixel value, which uses the distance-weighted values of the nearest pixel, a relatively efficient approach for reducing errors.
Topographic elements (slope, aspect, altitude, curvature, roughness, SPI, and TWI) are frequently utilised as conditioning variables in flood modelling because floods have a high correlation with a location’s current topography (
Figure 4A–G) [
63]. Previous flood modelling literature indicates that floods often occur in flat and low-lying locations, influencing the study’s selection as a conditioning element [
64,
65]. Aspect and curvature are related to the union, direction of flow, and contour of the ground surface contour, which influences the likelihood of flooding. TWI, SPI, and roughness are secondary parameters generated from the elevation, which provide information about the hydrological environment.
The elevation is a critical component in flood vulnerability studies. Areas with lower elevation values, particularly coastal areas, are more prone to floods than areas with higher elevations, usually prone to landslides [
66,
67]. We developed the topographic conditioning factors using a 30-m resolution digital elevation model (DEM) retrieved from NASA Earth explorer.
The topographic wetness index (TWI) measures the amount of water accumulated at a specific site and the likelihood of water flowing downward due to gravity. The higher the TWI number, the greater the risk of floods. The TWI is expressed as
where:
is the local upslope area draining through a certain point per unit contour length, and
denotes the local slope in radians.
The stream power index (SPI) measures the erosive power of flowing water at a given point on a topographic surface. The SPI is expressed as
where:
is the local upslope area draining through a certain point per unit contour length and
denotes the local slope in radians.
Roughness measures the degree of change on a topographic surface. It also represents the resistance to flooding flows within a channel and floodplain.
In flood susceptibility mapping and hydrological investigations, the slope is one of the most often utilised conditioning variables. Since this study involves estimating flood susceptible areas, the slope was selected as there is a close relationship between the direction of the slope and the infiltration of rainfall on the topographical surface. The slope values ranged between 0 and 90 degrees.
Aspect represents the direction of the maximum slope. It is also a measure of the steepness of the topographical surface. The aspect has nine (9) categories at 45-degree intervals.
Curvature is another component that influences flood studies. It denotes the topography’s morphology. It is either flat, convex or concave.
Proximity factors: distances to water, road and railway, were also considered. The distance to water is necessary when estimating the factors that influence flood probability due to flooding typically resulting from an overflow of neighbouring water surfaces [
68,
69]. Similarly, the distance to infrastructural services such as road and railway were also estimated. The distance to the road and railway is an influencing element because artificial surfaces adjacent to bodies of water have a substantial effect on the soils’ hydraulic conductivity. As urbanisation continues, areas with a lower hydraulic conductivity due to infrastructure development are likely to be flooded [
70]. The generation of the distances to water, road and railway map is in the SAGA GIS and QGIS 3.14 software (
Figure 4I,J).
Rainfall and temperature (
Figure 4K,L) are essential variables, especially for Nigeria, as the massive climate variations between regions play a vital role in determining flood probability. At this point, we took historical precipitation data (1975–2017) from 28 rainfall stations across Nigeria and interpolated the annual rainfall map using the inverse distance weighted (IDW) method. The IDW interpolation method was selected as it allows for the estimation of unknown values within a specified distance, based on the mathematical assumption that the closer values are more related than other values (
Figure 4K). In addition, the mean annual temperature data were collected and analysed from the Worldclim for this study.
Land use and soil cover information were used as conditioning factors to help understand how human activities and the existing landscape modifications impact flood probability. The land use maps comprise eight (8) categories: forest, shrubs, cultivated, water, wetland, grassland, settlement, and bare areas. Land use maps were from Globeland 30 and soil information from the Harmonised world soil database v1.
The curve number (CN), used in many hydrological studies that assess runoff or infiltration from excess rainfall, was selected as one of the conditioning factors. The Curve Number estimates were derived using global hydrological soil groups (HYSOGs) data at 250 m spatial resolution [
71] and land cover data for 2020 for Nigeria.
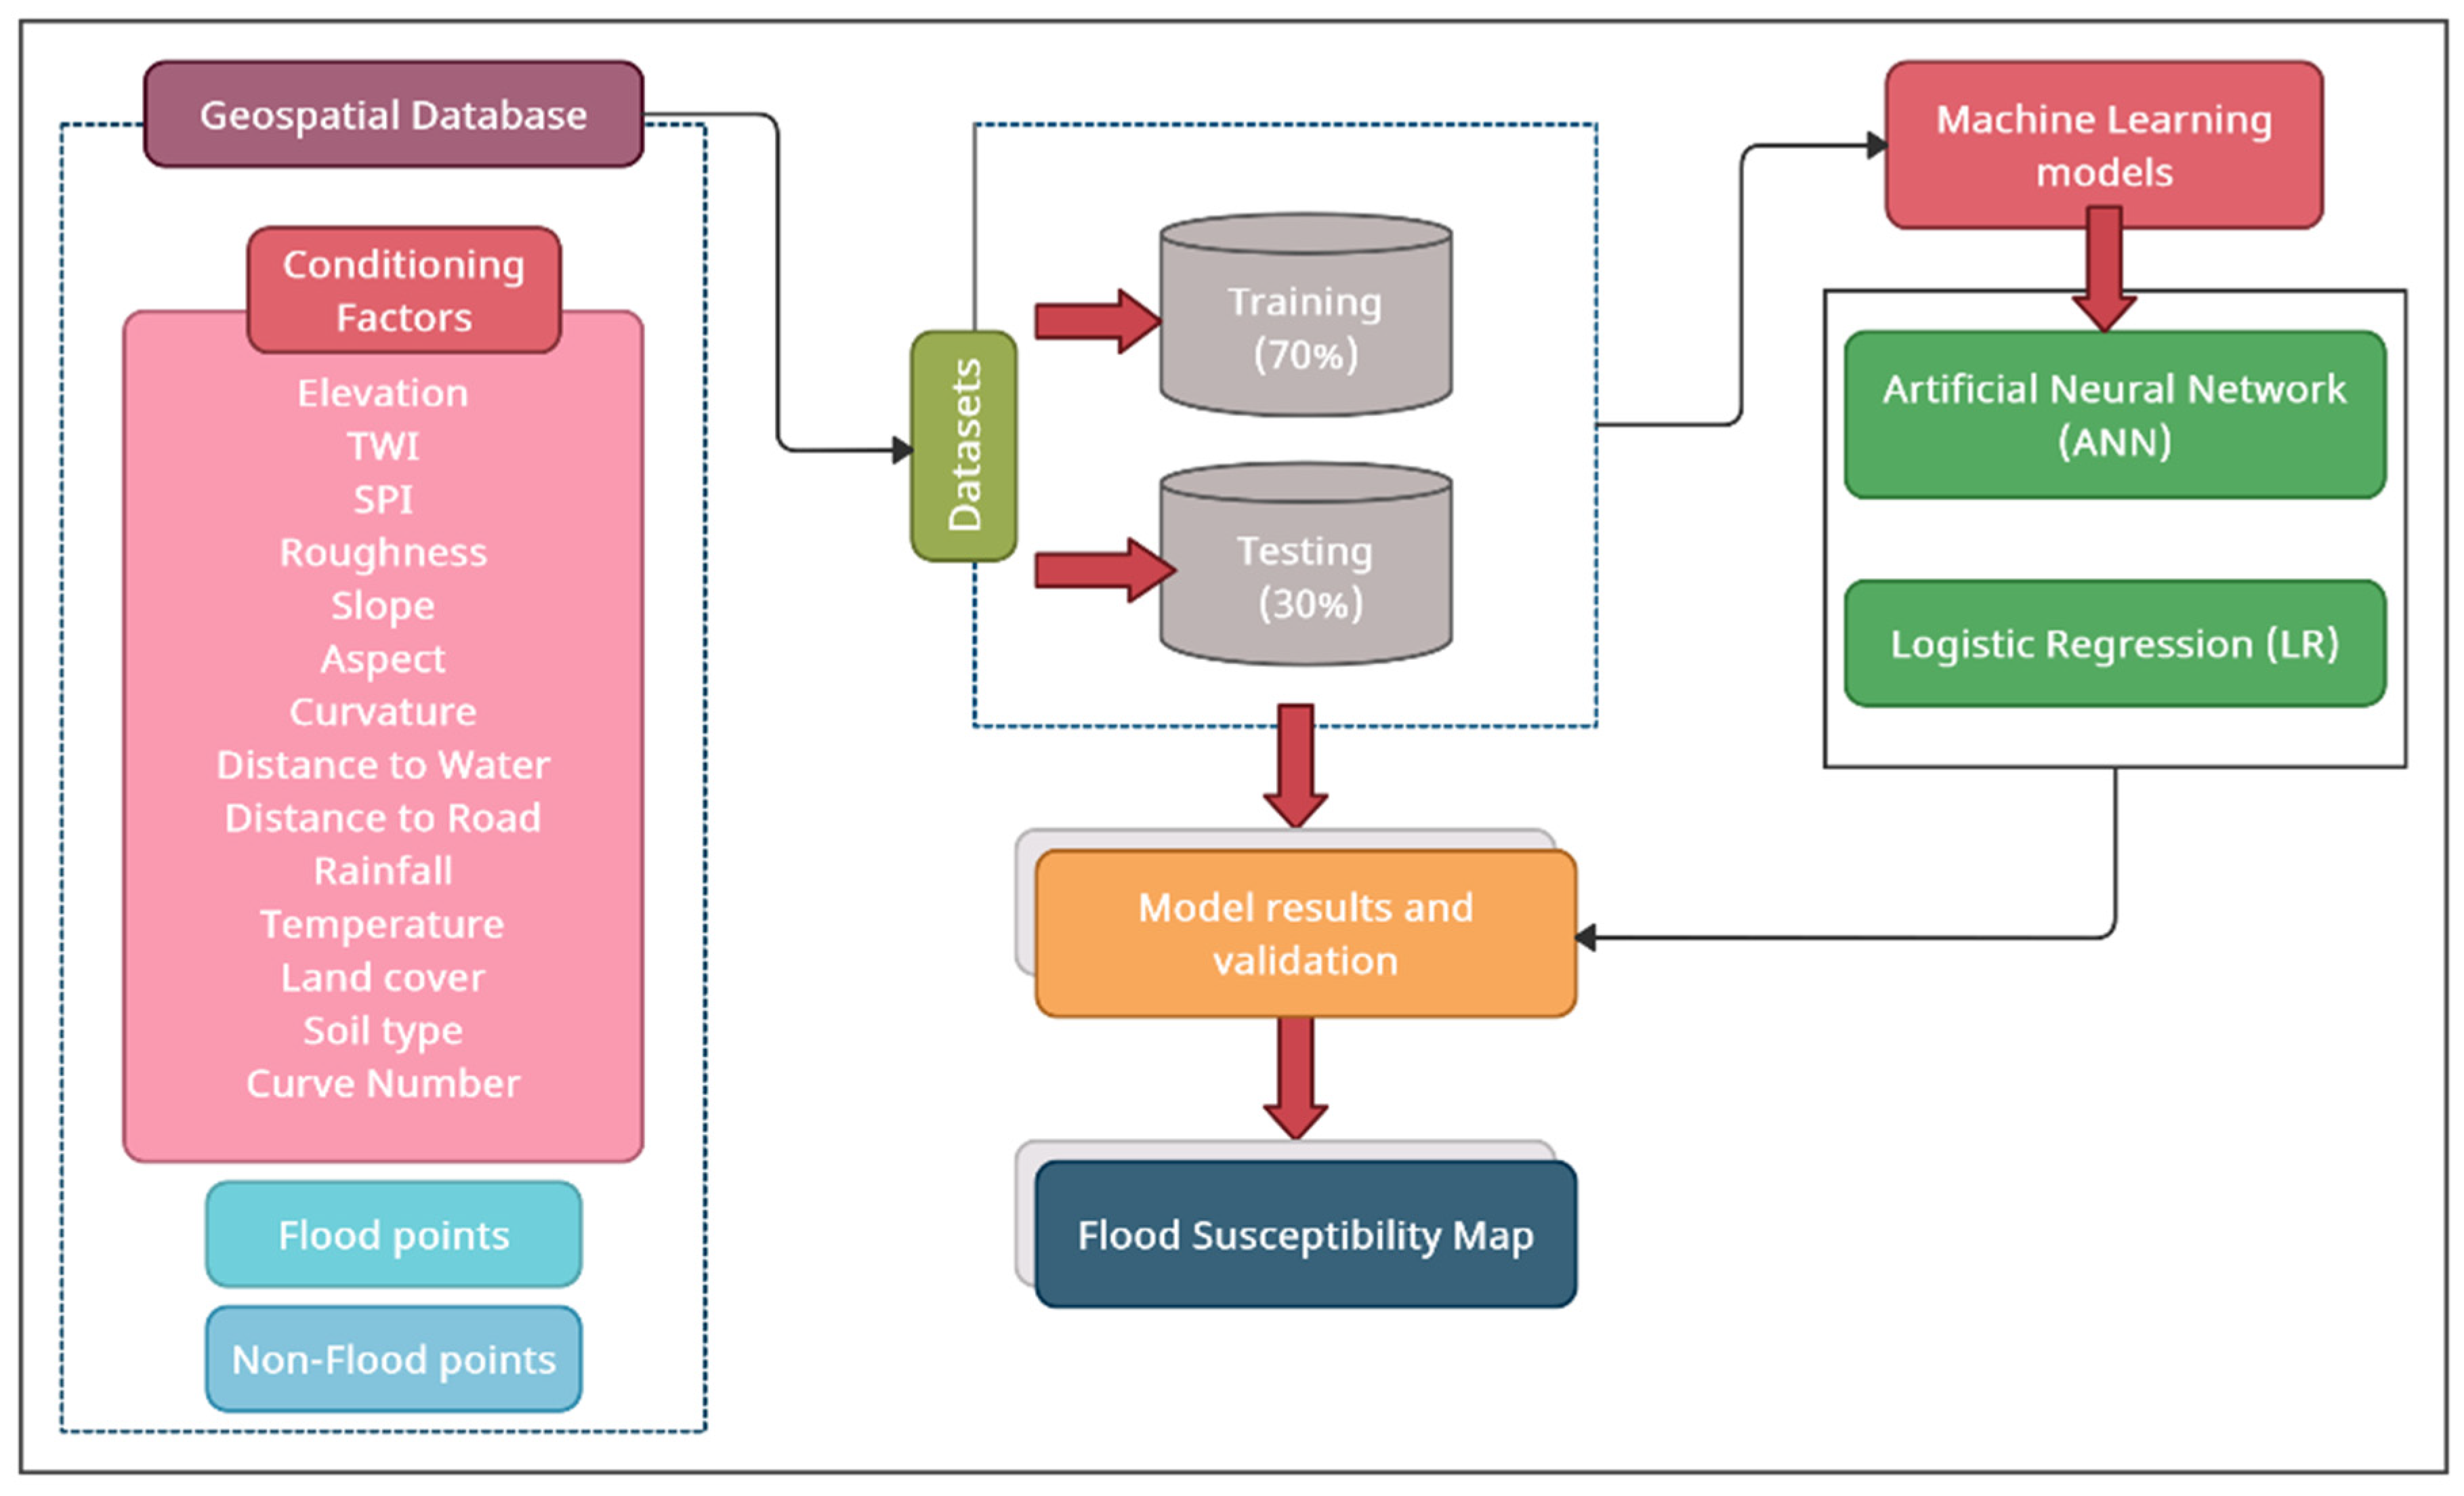
The conditioning factors (
Figure 4A–O) mentioned above help assess the possibility of flood occurrence using the machine learning ANN and LR algorithms. Using machine learning methods allows assessing each conditioning factor and evaluating their correlations without classifying the independent datasets (conditioning factors). Furthermore, the methodology used in this study can be reproduced and implemented in other predictive modelling tasks such as landslides because it does not require extensive data on the hydrology and topology of the study area.


