1. Introduction
Investment planning and optimization is a crucial step toward the sustainability of enterprises in the future. A systemic approach increases the efficiency of financial planning. The inclusion of a systemic sustainable approach in financial planning and investment decision making can contribute to a comprehensive view of the topic. This article aims to address current issues related to the systems approach in the context of sustainable development in corporate finance and investment. This goal was achieved both by modeling financial resources and by modeling future investments over time. The issues addressed and the issue of financial sustainability of enterprises are currently very hot topics. The current pandemic situation has provided space for the creation of new and effective approaches to management decision-making processes.
Financial planning is a demanding process in a company that evaluates the financial situation and its financial resources. As part of this process, goals are set and the company’s future financial strategy is formed [
1,
2]. With optimal financial and investment planning, enterprises can predict the financial situation and its sustainability. In this process, it is important that the company’s management identifies funding opportunities and sources [
3].
In order to achieve the financial sustainability of enterprises, it is important to focus on the correct identification of cash flows, which in the investment evaluation process represents the start-up phase of financial planning [
4].
The investment planning that comes with investment projects enters the financial planning process of the business. The transformation of these investment variables creates the risk of incorrect estimation of the value and structure of financial flows. Experience shows that excessive optimism of managers leads to inefficient financial and investment decisions [
5,
6] and to an increase in the incidence of financial risks. [
7] It is important that the company’s management uses in these decisions methods and procedures that not only take into account the favorable development of financial indicators but also predict the unfavorable development of economic efficiency indicators and minimize the impact of financial risks. Incorrect management decisions about the allocation of financial resources and future investments can lead to high financial losses for the company [
8].
In addition to identifying the structure and value of financial resources, it is also necessary to identify factors influencing economic efficiency indicators [
9].
Most traditional methods use the return on investment and the value of the cash-flow indicator to evaluate economic efficiency. Modern methods work with discounted cash flows, relying primarily on the net present value of the investment (NPV). NPV is an indicator that assesses the profitability of an investment over time and provides accurate information on future developments. This information is the basis for developing a strategy to optimize key factors (investment, own and external sources of financing, inflation, interest rate and credit risk) [
10].
Thus, we can say that while the traditional cash-flow indicator is based only on cash flows from operating activities, the modern NPV indicator is determined by the amount of annual cash flow from the investment and the value of available costs associated with the investment [
11,
12].
Ideally, the company’s management should use methods in its decision-making processes that integrate the traditional and modern approaches into assessing the economic efficiency of the investment and the process of achieving future financial sustainability. Our article provides instructions on how to use a modern sophisticated tool combining these two approaches. This tool can serve as a support tool for reducing or eliminating financial risks in the decision-making process of business management.
The aim of this article is to propose the methodology of investments and financial risks in enterprises from a time perspective. The goal of modeling is to maximize the economic efficiency of investment that is based on the cash-flow indicator in order to reach the maximum NPV possible.
The secondary aim is to integrate the use of new modern and classical economic-statistical methods, which makes it an effective tool for the sustainability of enterprises. This article demonstrates the application of such modeling to capital-expenditure-related processes in the field of risk management. The methodology shows two approaches to planning and optimization in enterprises in Slovakia. The first approach presents the modeling of investment and financial risks using the principles of financial mathematics in order to optimize these and to establish an algorithm of the process approach toward risk interaction. The second approach is statistical modeling that is based on finding normality and statistical significance. The following analyses and modeling allowed for the identification of risk factors and the possibility to reach the goals given. A detailed methodology and systemic approach gradually made the implementation of the presented aims related to the solving of the enterprise’s optimizing tasks possible. By modifying the input parameters based on the legislative and market specifics of individual countries, it is possible to modify the algorithm to these conditions and apply the methodology in enterprises in other countries around the world which are similar to the financial system in Slovakia.
2. Literature Review
Several authors are currently working on the applicability of traditional methods in the process of financial risk assessment and investment management. They all agree on the many shortcomings of this approach but also point to the many advantages of using traditional approaches. Many scientific papers also present the relationship to financial risks, which are implemented in the evaluation of the economic efficiency of investments [
13,
14,
15].
In ensuring the sustainability of the business and assessing financial risks, the authors rely on qualitative data on the availability of internal and external sources of funding [
16]. The tool for achieving sustainability is the forecast of future investments using cash flows [
17,
18]. Experience shows that the use of excessive investment depends on internal cash flows [
19,
20,
21,
22].
Financial resources and their structure play an important role in all types of businesses. The authors claim that large enterprises have various financial resources that increase their costs and tend to show low cash. Internal sources of financing have a significant impact on the management of investment activities [
23,
24].
A number of authors have dealt with financial risk modeling and investment management in practice (Kim, K.-j.; Lee, K.; Ahn, H. [
25]). However, in their study, they focused only on modeling based on financial mathematics and using statistical methods.
Some authors modeled financial structure and investment through game theory [
26], while others used mathematical-statistical approaches in a software environment [
27,
28,
29].
In practice, we have not yet encountered a tool that would use graphical management algorithms using financial mathematics to integrate traditional and modern methods into the process of managerial decision making. For this reason, we consider the managerial algorithm created by us to be unique. Its general applicability in enterprises in Slovakia creates a precondition for its effective use in practice.
The economy in Slovakia has been hit by the COVID-19 pandemic in recent years, as have economies in other countries. After continuous economic growth in the last decade, there has been a growing level of debt in the private and public sectors. This phenomenon has been associated with significant risks stemming from the uncertainty and reduced solvency capacity of many borrowers in the business sector. The current situation has negatively affected all macroeconomic indicators in Slovakia’s sectors. There has been an increase in unemployment, an increase in inflation, a reduction in the solvency of enterprises and an increase in the credit burden. For this reason, there is a significant change in the ratio of internal and external financial resources in enterprises, an increase in interest rates in the financial market, which negatively affected the process of financial planning and decision making [
30,
31].
For this reason, enterprises are forced to look for new financing options or tools to optimize and support managerial decisions in financial planning and investment. In our article, we focus on the design of a tool for managerial decision making in the form of an algorithm, which makes this process simple and clear. The management algorithm provides a simple guide for manufacturing enterprises in Slovakia to achieve sustainability with regard to the identification of financial risks in the investment decision-making process.
3. Materials and Methods
The objective of the article is to propose a management system that would ensure the sustainability of the funds dedicated to investment activities in enterprises. The goal is to ensure the solvency and positive cash flow of such enterprises. The deliverable of the management system was a model for the evaluation of financial risks and sustainability of funding sources. The methodology comprises the following steps.
3.1. Step 1: Model Evaluating the Financial Risks and Investment
The model evaluating the financial risks endangering manufacturing enterprises in the existing market environments while ensuring their sustainability can be applied in medium-size and large manufacturing enterprises. The enterprises are subjected to market and legislative principles applicable in the territory of the Slovak Republic. At the same time, such enterprises are subject to a turbulent market environment producing risks, which is even more relevant considering the existing pandemic situation related to COVID-19.
A high level of investments, which are, especially in the time of market crisis, of high risk, is typical for manufacturing enterprises. This capital intensity has been, at the same time, connected to a long-term horizon resulting from a demanding implementation process. In relation to time, the funds are subject to the rate of update that mostly reacts to inflation. For the given reason, the data in the model are stated in their current value, and, throughout the steps to come, they are evaluated using the value defined as the moving median of market value development arising from the data provided by the National Bank of Slovakia. At the same time, the high level of capital intensity leads to an increased indebtedness of enterprises in the form of bank credits. The amount of the loan has been simulated in the model on the basis of the actual investment projects implemented in manufacturing enterprises.
It is necessary to set a time period during which the model would examine the impact of each fund on the operation and existence of the company. From a theoretical point of view, it is appropriate to rely on expert estimates that define the expected return on investment. However, from a practical point of view, the following may be predicted:
Investment projects in functioning enterprises can be completed also in two years if having sufficient investment funds;
On the basis of the previous condition, an enterprise starts to make revenues as early as in year three;
In the modeling process, it is necessary to define the return on investment as generally observed. This is why the model also perceives a positive impact on return on investment to a given extent. When longer, the return on investment is considered a means potentially threatening the existence of an enterprise in the long run and as such is specified as risk in the model.
The model was reviewed from two perspectives. The first perspective is the economic efficiency of the financial risk model, the final indicator of which is cash flow, NPV and the modeling of its trend and prediction of potential funding of investment projects using internal and external sources. For the need of such economic assessment, it was necessary to accept the following input conditions of the model stated in
Table 1.
The created model designed for financial risk assessment comprises four basic steps, namely the analysis of sensitivity, analysis of risk interaction, assessment of outputs or deliverables and risk elimination. At the same time, each year also includes partial simulations identifying risk financial factors.
3.2. Step 2: Statistical Significance
The second perspective to be considered is the statistical significance of the factors subject to monitoring [
32,
33].
- (a)
The one-way analysis of variance (ANOVA) is used in the process of determining significant differences between the preferred values of three or more variables that are independent of each other. This method compares the values between the variables in the groups and determines their possible significant difference. These are groups that are important for research.
To be more specific, it tests the null hypothesis:
Hypothesis 0 (H0): .
and then
Hypothesis 1 (H1): non-H0.
- (b)
Where µ—group mean and k—number of groups. If, however, the one-way ANOVA returns a significant result, we accept the alternative hypothesis (H1). In this condition, we can see significant difference between the least two groups’ means. We defined the independence of individual observations, the normal distribution of samples and the equal variance as distribution assumptions for the ANOVA calculation. Normality can be graphically assessed before performing the Shapiro–Wilk test. We use a histogram, Q-Q plot, P-P graph and box graph to assess it. If there are population variances in each group, we speak of homogeneity of variances.
- (c)
The same as the one-way ANOVA, the Kruskal–Wallis test by ranks is also a non-parametric method. This test compares samples in which a normal distribution of residues is not expected. The first assumption is the equality of the medians of all groups. The second assumption is the difference of at least one medium from the group.
3.3. Step 3: Software
Modeling of the sustainability of funds related to the investment activities of manufacturing enterprises that is based on various ratios of the internal and external sources and their effect on the NPV and cash flow. The Microsoft Excel software environment was used to model the interactions of these financial risks.
4. Results
4.1. Managerial Modeling Using Financial Mathematics
Financial risk development modeling is a complex process. The model created for the simulation of enterprise investment activity funding that has the form of internal and external sources demonstrates the trend of the cash-flow indicator.
The model proposed for fund identification and sustainability comprises several steps. The first step of the model under proposal was the specification of the investment value. The investment must include all the technical, technological and material requirements, systems and personnel included. For the purpose of modeling, it was necessary to identify individual cost items with the focus on a detailed analysis of direct and indirect costs. In the step that followed, the operating, labor and other costs arising from enterprise activities were identified. Cost modeling includes the following conditions:
- (a)
When modeling labor cost, the average salary and the number of employees were used. The labor cost in question included the contributions to funds representing 35.2% in Slovakia [
34].
- (b)
The operating cost also includes depreciations. Considering the fact that capital-intensive enterprises dispose of a large number of depreciated items, linear depreciation was used for modeling purposes with the value of such depreciation being expressed by the relation stated in
Table 1.
- (c)
The value of the operating cost was calculated according to the following relation:
where:
DC—direct cost
IC—indirect cost
D—depreciations
LC—labor cost
OC—other costs
The cost was subsequently recalculated using the rate of update which considered the influence of time on financial indicators. When modeling the cost items, it was necessary to model income and revenues in order to identify financial risks and calculate the cash-flow value. Both items above are based on the assumption of product and services rendered to the given enterprises being priced and on the estimate of the sold number of individual products. Even in this case, the individual items are recalculated using the rate of update that considers the influence of time. Revenues are calculated using the following relation:
where:
The model of financial risk assessment also considered tax burden in the form of income tax calculation.
Under Section 15 (b) of the Income Tax Act, the corporate tax rate in Slovakia is 21%, and it is calculated from the tax base following tax loss deduction [
34].
The tax base is calculated using the following relation:
On the basis of all the above-defined conditions, the MONEOSOFTWARE was used to calculate the cash-flow indicator. Microsoft Excel, on the other hand, was used to perform partial analyses. The cash-flow indicator is also suitable from the perspective of the dependence of the profit rate on it. Unless enterprises reach a positive cash-flow value in the year given and the projected cumulative cash-flow value in the future, they cannot be profitable.
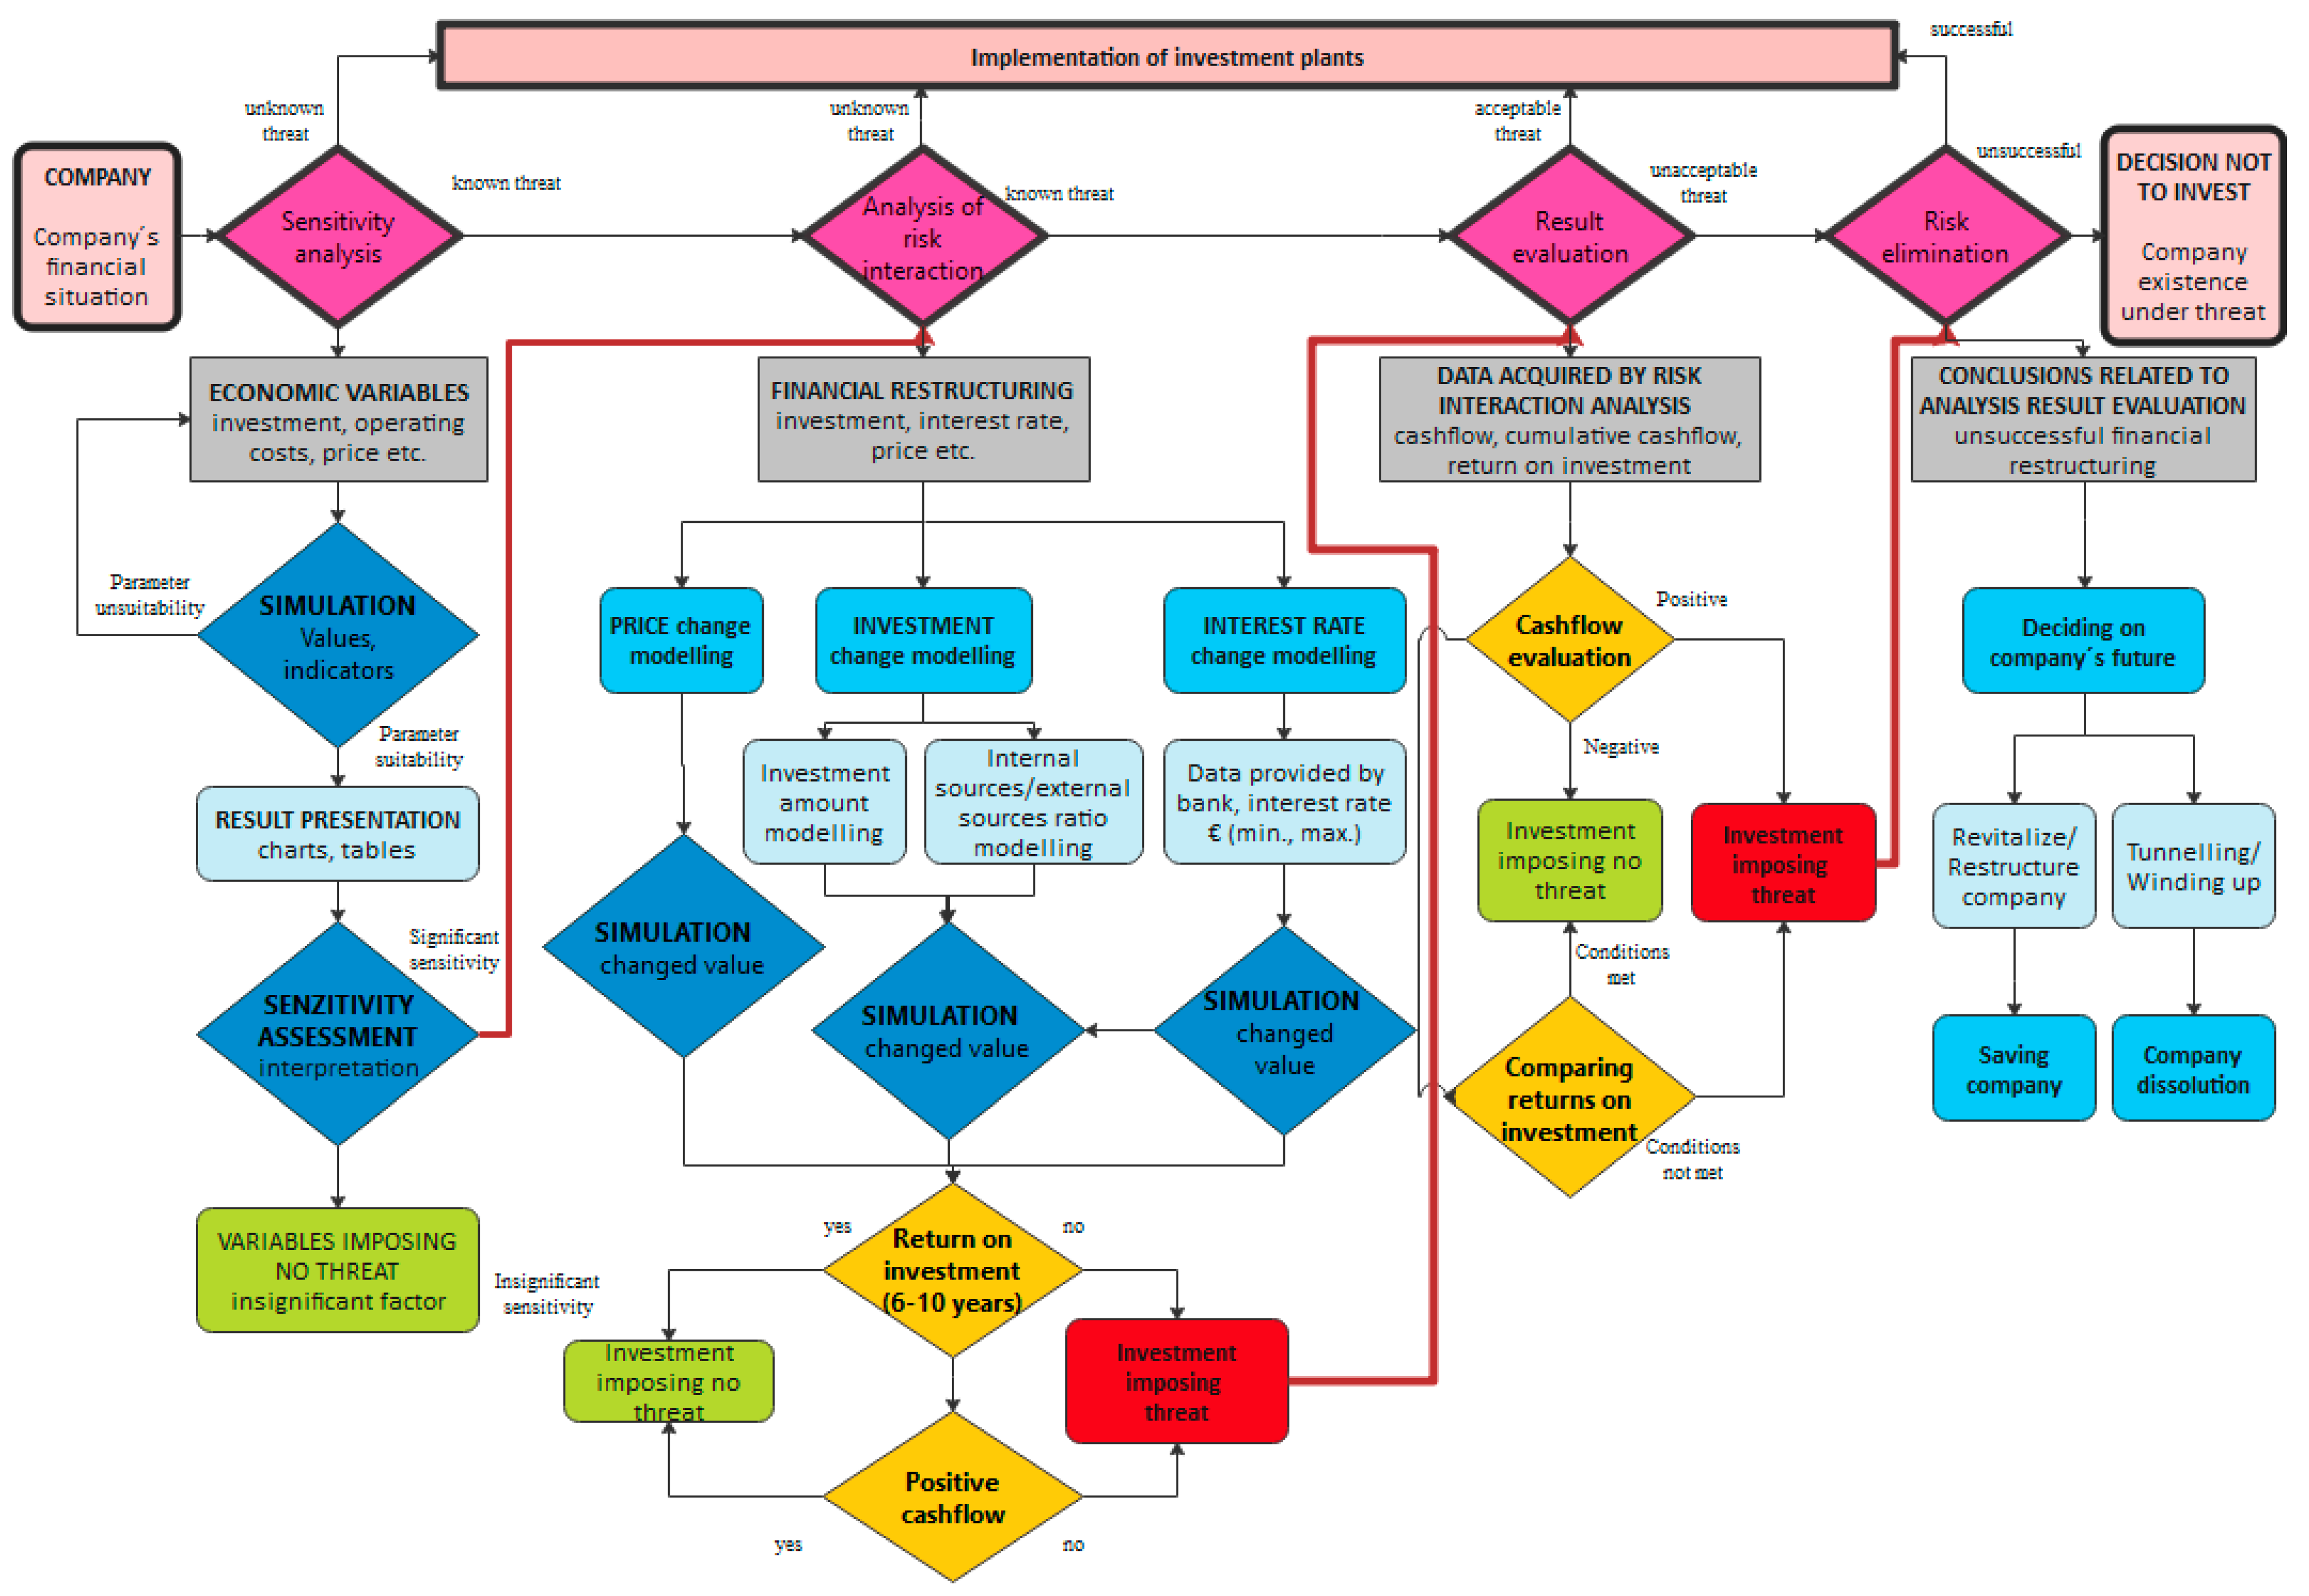
To keep things simple and transparent, the algorithm depicted in
Figure 1 was created on the basis of the above-specified steps.
The algorithm consists of two basic parts. The first part is a basic algorithm consisting of four steps: sensitivity analysis, analysis of risk interaction, result evaluation and risk elimination. The entry value into the algorithm is the company with its financial situation. There are two options for output from the algorithm. First, we can implement investment plans; second, it will be recommended to reject the investment. Each of the four parts of the basic algorithm integrates another algorithm. These algorithms contain processes and methods that lead to an evaluation of the input parameters. These are mainly simulations and selected economic analyses. Their output is the interpretation of analyzed data, which at the same time represents an input parameter for the next step in the algorithm.
Individual analyses and simulations can be carried out through available software tools, which will greatly simplify their implementation. As part of our research, MS Excel was introduced, and the calculations were extensive.
The output data are stated in the table as well as in graphic form. The outputs of the model in the MS Excel software environment are 44 charts, on which the points where an enterprise is or is not in danger can be identified. The presentation of such graphical depiction for the partial simulation of cash-flow calculation with 30% of internal funds and 70% of external funds can be seen in
Figure 2.
Once the mathematical relation was incorporated into the algorithm, a new mathematical algorithm stated in
Figure 3 was created.
4.2. Statistical Verification of Financial Risk
The outputs of the statistical verification of financial risk significance are as follows. The independence assumption is based on the way the data are collected. In order to statistically verify the significance of the financial risks related to capital-intensive operations in industrial and transport enterprises, the ratio of the internal and external funding sources was of focus and so were its effects on the cash-flow indicator value with the internal/external fund ratios being modeled as 0/100, 10/90, 20/80.......100/0.
The testing of conditions can be seen in
Table 2. The table shows that for some internal and external sources, ratios
p < α (α—level of significance 0.05), which means that the null hypothesis about the normal distribution can be rejected. Based on the Shapiro–Wilk test, it was concluded that not all the indicators meet the conditions of normality. We can use a non-parametric test to compare the ratios of funding sources.
If the assumptions of the parametric tests are not met, a non-parametric test is used. The graphical presentation of the monitored values is in
Figure 4, and the results of the Kruskal–Wallis test can be found in
Table 3.
The box plot depicting the funding sources demonstrates that the minimum values of the cash-flow indicator are in direct correlation with the funding sources ratio (internal/external resources) while the maximum values remain unchanged. The medians of individual ratios of funding sources vary. The statistical significance of such differences was reviewed using the Kruskal–Wallis test [
32,
33].
Table 3 shows that the value of the test criterion is 1.908486. The smallest significance level is
p-value,
p = 0.9970, for which the null hypothesis was accepted. The minimum level of significance is higher than 0.05. At that level, the null hypothesis can be rejected. The ratio of funding resources (internal/external) has no statistically significant influence on the value of the cash-flow indicator and as such cannot be deemed endangering for the enterprises subject to the analysis.
5. Discussion
As part of the financial risk correlation examination, the model also considered the ratio of the internal and external sources. On the basis of the above-modeled data, it was possible to specify the ratio of the investment covered by credits and by internal sources that is of threat to an enterprise and to what extent under the conditions given. The following table shows the mutual dependence of the credit risk and the interest rate risk. Considering the contextual complexity of the data acquired from modeling, the table states only the data representing a certain threat to enterprises thus exposing them to risk.
Table 4 shows that the risk increases with an increase in the interest rate and invested amount and in the percentage of external sources. An enterprise becomes endangered when the percentage of external sources exceeds 50% of investments. Considering the fact that the analyzed enterprises are financially demanding institutions, it is almost impossible to have 100% of the investments covered from internal sources. That is the reason why it is so important for each enterprise to consider all the options and identify all the risks it is exposed to while conducting its activities in a market environment.
The modeling and identification of statistical significance proved that the funding sources ratio comprising the internal and external sources has no statistical influence on the value of the cash-flow indicator and as such cannot be deemed an indicator endangering the enterprises subject to the analysis [
35]. However, when performing the economic evaluation of sustainability of the funds invested in enterprise manufacturing activities, this ratio significantly influences the positivity of the cash-flow indicator and thus also the NPV. In an enterprise, the value of the indicator in question directly correlates with the sustainability of enterprise funds, with its solvency.
From the conclusions above, it is clear that the presented methodology is an effective tool that integrates traditional and modern sophisticated approaches into financial planning and investment decision making. The application of such a tool allows enterprises in Slovakia to plan their sustainability in the long term and effectively optimize the ratios of financial resources in times of unforeseen negative events. This process is also integrated into the assessment of financial risks in enterprises.
6. Conclusions
The article reviews the sensitivity of the cash-flow investment in enterprises. It was shown that access to external funds is a key channel through which the development at the corporate level affects the sensitivity of investments in internal cash flows. At present, the professional public has not presented a similar system approach to achieving the sustainability of enterprises, and thus the proposed managerial algorithm can be considered unique.
Within the corporate investment, the professional public considers internal cash flows to be variable and external sources of financing to be expensive [
36,
37].
Several authors state that the viability of an enterprise depends on a sufficient amount of economic resources and their location in the enterprise. Internal sources of financing are sensitive to the availability of external sources of financing, which is considered a key factor in the investment decision-making process [
38].
We believe that the article will contribute to the development of new theoretical and empirical knowledge in the field of future financial risk management research. It can be a start-up study for increasing business sustainability. The article demonstrates a new managerial algorithm for determining financial threats in enterprises in Slovakia. This can be realized by modifying the input parameters based on the legislative and market specifics of individual countries.
Enterprises have been trying to achieve a high level of investment efficiency and short return on investment; this, in fact, calls for investments that would bring the greatest benefit and reliability of income at the same time. The goal of this article is to present a systemic approach based on modeling that would maximize economically efficient investment. Economic efficiency was monitored through the cash-flow and NPV indicators. Optimization was pursued via two different research activities, and the results of these were compared. Based on the first approach, a managerial algorithm was subsequently created. The approaches to optimization were then subject to risk analyses which allowed for a model to be used for projecting risk factors in the future. The dependence of the discovered impacts was statistically verified via an ANOVA analysis. The normality was monitored using the Shapiro–Wilk test, and the Kruskal–Wallis test was used as the non-parametric test. The approaches presented herein represent the way toward the elimination of financial risks. This approach can be applied in the conditions of enterprises in general.
The presented approach to investment-related decision making considered the actual conditions and risks enterprises are exposed to when performing their activities. In reality, an incorrect investment-related decision may lead to high capital-expenditure losses, especially in manufacturing enterprises. The introduction of a suitable model, the application of which will enable enterprises to forecast the development of investment and identify the appearance of financial risks, increased the quality of managerial decisions. The proposed algorithm is of great help to science and practice as it provides new opportunities and uses information and communication technologies for managerial decision making.
The importance of this issue was demonstrated by the current conditions of the market environment of enterprises, which has been influenced by the global pandemic; connected to that is also the specification of economic efficiency of investments and financial planning. The possibilities of further research in this field will contribute to the sustainability of manufacturing sector development both in Slovakia and abroad.
The article, written by authors recognized as experts in this field, provides key references to the searched sources of information and states particular details to illustrate the interaction of mutual risk situations.
Author Contributions
Conceptualization, A.T. and A.S.; methodology, G.I.; software, G.I. and A.T.; validation, A.T., A.S. and G.I.; formal analysis, A.T. and I.K.; investigation, A.S.; resources, I.K.; data curation, A.T., A.S. and G.I.; writing—original draft preparation, A.T. and A.S.; writing—review and editing, A.T., A.S. and G.I.; visualization, A.T. and A.S.; supervision, A.T. and A.S.; project administration, A.T. All authors have read and agreed to the published version of the manuscript.
Funding
This research received no external funding.
Institutional Review Board Statement
Not applicable.
Informed Consent Statement
Not applicable.
Data Availability Statement
Not applicable.
Conflicts of Interest
The authors declare no conflict of interest.
References
- Shakar, E. Financial Planning and Cashflow Management. Elan & Co with Advice and Case Studies. 2008. Available online: http://www.bpatc.org.bd/elibrary/files/1271328456Financial-Planning-eBook.pdf (accessed on 3 March 2022).
- Uzun, E.; Türk, Z.; Uzun, E. The Role of Business Success and Innovation in Financial Planning. J. Manag. Econ. Manag. Econ. 2003, 10, 63–73. [Google Scholar]
- Gençtürk, M.; Bağcı, G. An Overview of the Company of Budget and Budget Practices: A Qualitative Study to Enterprises in Burdur Province. J. Account. Financ. 2012, 53, 49–68. [Google Scholar]
- Fotr, J.; Souček, I. Podnikatelský Zámer a Investiční Rozhodování; Grada Publishing: Praha, Czech Republic, 2005; p. 356. [Google Scholar]
- Lehutova, K.; Krizanova, A.; Kliestik, T. Quantification of Equity and Debt Capital Costs in the Specific Conditions of Transport Enterprises. In Proceedings of the 17th International Conference on Transport Means, Kaunas, Lithuania, 24–25 October 2013; pp. 258–261. [Google Scholar]
- Kliestik, T.; Lyakin, A.N.; Valaskova, K. Stochastic calculus and modelling in economics and finance. In Proceedings of the 2nd International Conference on Economics and Social Science, Information Engineering Research Institute, Shenzhen, China, 29–30 July 2014; Volume 61, pp. 161–167. [Google Scholar]
- Harris, C.; Roark, S. Cash Flow Risk and Capital Structure Decisions. Financ. Res. Lett. 2019, 29, 393–397. [Google Scholar] [CrossRef]
- Janekova, J.; Fabianova, J.; Izarikova, G.; Onofrejova, D.; Kovac, J. Product Mix Optimization Based on Monte Carlo Simulation: A Case Study. Int. J. Simul. Model. 2018, 17, 295–307. [Google Scholar] [CrossRef]
- Kislingerová, E. Manažerské Finance; C.H. Beck: Praha, Czech Republic, 2004; p. 714. [Google Scholar]
- Mellichamp, D.A. Profitability, risk, and investment in conceptual plant design: Optimizing key financial parameters rigorously using NPV %. Comput. Chem. Eng. 2019, 128, 450–467. [Google Scholar] [CrossRef]
- Scholleova, H. Investment Controlling: How to Evaluate Investment Intentions and Manage Company Investments, 1st ed.; Grada: Praha, Czech Republic, 2009. [Google Scholar]
- Oral, C.; Akkaya, G.C. Cash Flow at Risk: A Tool for Financial Planning. Procedia Econ. Financ. 2015, 23, 262–266. [Google Scholar] [CrossRef] [Green Version]
- Bartošova, V.; Majerčák, P.; Hrašková, D. Taking Risk into Account in the Evaluation of Economic Efficiency of Investment Projects: Traditional Methods. Procedia Econ. Financ. 2015, 24, 68–75. [Google Scholar] [CrossRef]
- Janekova, J.; Fabianova, J.; Rosova, A. Environmental and economic aspects in decision making of the investment project “wind park”. Pol. J. Manag. Sudies 2016, 13, 90–100. [Google Scholar] [CrossRef]
- Janeková, J.; Fabianová, J.; Onofrejová, D.; Puskas, E. Implementation of Deviation Analysis Method in the Utilisation Phase of the Investment Project: A Case Study. Pol. J. Manag. Stud. 2017, 15, 99–109. [Google Scholar] [CrossRef]
- Skrodzka, W. The assessment of the efficiency of investment in the shares of the Polish IT sector. Pol. J. Manag. Stud. 2015, 12, 186–197. [Google Scholar]
- Kadapakkam, P.-R.; Kumar, P.; Riddick, L.A. The impact of cash flows and firm size on investment: ‘The international evidence’. J. Bank. Financ. 1998, 22, 293–320. [Google Scholar] [CrossRef]
- Almeida, H.; Campello, M.; Weisbach, M.S. The cash flow sensitivity of cash. J. Financ. 2004, 59, 1777–1804. [Google Scholar] [CrossRef]
- Richardson, S. Over-investment of free cash flow. Rev. Account. Stud. 2006, 11, 159–189. [Google Scholar] [CrossRef]
- Lamont, O. Cash flow and investment: ‘Evidence from internal capital markets. J. Financ. 1997, 52, 83–109. [Google Scholar] [CrossRef]
- Xin, C.; Sun, Y.; Xu, X. Free cash flow, over-investment and corporate governance in China. Pac.-Basin Financ. J. 2016, 37, 81–103. [Google Scholar]
- Ahiadorme, J.W.; Gyeke-Dako, A.; Abor, J.Y. Debt holdings and investment cash flow sensitivity of listed firms. Int. J. Emerg. Mark. 2018, 13, 943–958. [Google Scholar] [CrossRef] [Green Version]
- Michael, D.; Schiantarelli, F. Investment, Finacial Factors and Cash Flow: Evidence from UK Panel Data (No. w3116); National Bureau of Economic Research: Cambridge, UK, 1990. [Google Scholar]
- Athey, M.J.; Laumas, P.S. Internal funds and corporate investment in India. J. Dev. Econ. 1994, 45, 287–303. [Google Scholar] [CrossRef]
- Kim, K.-j.; Lee, K.; Ahn, H. Predicting Corporate Financial Sustainability Using Novel Business Analytics. Sustainability 2019, 11, 64. [Google Scholar] [CrossRef] [Green Version]
- Migdalas, A. Applications of game theory in finance and managerial accounting. Oper. Res. Int. J. 2002, 2, 209–241. [Google Scholar] [CrossRef]
- Zhao, Y.; Ziemba, W.T. A Stochastic Programming Model using an Endogenously Determined Worst Case Risk Measure for Dynamic Asset Allocation. Math. Program. 2001, 89B, 293–309. [Google Scholar] [CrossRef]
- Ogryczak, W.; Ruszczynski, A. On Consistency of Stochastic Dominance and Mean-Semideviation Models. Math. Program. 2001, 89B, 217–232. [Google Scholar] [CrossRef]
- Sprinkle, G.B.; Williamson, M.G. Experimental Research in Managerial Accounting. Handb. Manag. Account. Res. 2006, 1, 415–444. [Google Scholar] [CrossRef]
- Annual Report 2020. National Bank of Slovakia 2021. Available online: https://www.nbs.sk/_img/Documents/_Publikacie/AnnualReport/ARNBS20.pdf (accessed on 13 April 2022).
- Kelemen, M.; Polishchuk, V.; Gavurová, B.; Rozenberg, R.; Bartok, J.; Gaál, L.; Gera, M.; Kelemen, M., Jr. Model of Evaluation and Selection of Expert Group Members for Smart Cities, Green Transportation and Mobility: From Safe Times to Pandemic Times. Mathematics 2021, 9, 1287. [Google Scholar] [CrossRef]
- Mishra, P.; Pandey, C.; Keshri, A.; Sabaretnam, M. Selection of Appropriate Statistical Methods for Data Analysis. Ann. Card. Anaesth. 2019, 22, 297–301. [Google Scholar] [CrossRef]
- Khusainova, R.M.; Shilova, Z.V.; Curteva, O.V. Selection of Appropriate Statistical Methods for Research Results Processing. Math. Educ. 2016, 11, 303–315. [Google Scholar]
- Act No. 461/2003 Coll. on Social Insurance as Amended, Act No. 580/2004 Coll. on Health Insurance as Amended. Available online: https://www.podnikajte.sk/dan-z-prijmov/sadzby-dane-z-prijmov-fyzickych-pravnickych-osob-2019-2020 (accessed on 13 April 2022).
- Valaskova, K.; Kliestik, T.; Svabova, L.; Adamko, P. Financial Risk Measurement and Prediction Modelling for Sustainable Development of Business Entities Using Regression Analysis. Sustainability 2018, 10, 2144. [Google Scholar] [CrossRef] [Green Version]
- Froot, K.A.; Scharfstein, D.S.; Stein, J.C. Risk Management: Coordinating Corporate Investment and Financing Policies. J. Financ. 1993, 48, 1629–1658. [Google Scholar] [CrossRef] [Green Version]
- Jankensgård, H.; Moursli, R.M. Derivative Cash Flows and Corporate Investment. J. Bank. Financ. 2020, 119, 105916. [Google Scholar] [CrossRef]
- Mazanec, J.; Bartosova, V. Prediction Model as Sustainability Tool for Assessing Financial Status of Non-Profit Organizations in the Slovak Republic. Sustainability 2021, 13, 9721. [Google Scholar] [CrossRef]
| Publisher’s Note: MDPI stays neutral with regard to jurisdictional claims in published maps and institutional affiliations. |
© 2022 by the authors. Licensee MDPI, Basel, Switzerland. This article is an open access article distributed under the terms and conditions of the Creative Commons Attribution (CC BY) license (https://creativecommons.org/licenses/by/4.0/).


 The significant level of threat.
  The highest level of threat.
  High level of threat.
  Medium level of threat.
  Low level of threat.
  The lowest level of threat.
  The insignificant level of threat.