Next Article in Journal
Soils of the Ribeira Valley (Brazil) as Environmental Protection Barriers: Characterization and Adsorption of Lead and Cadmium
Next Article in Special Issue
Land Cover and Land Use Changes between 1986 and 2018, and Preliminary Carbon Footprint Implications for Manoka Island (Littoral Region of Cameroon)
Previous Article in Journal
Tourism Network Attention Variation of Chinese Cities under the COVID-19 Pandemic
Previous Article in Special Issue
Global Mangrove Deforestation and Its Interacting Social-Ecological Drivers: A Systematic Review and Synthesis
 
 
Correction published on 27 July 2022, see Sustainability 2022, 14(15), 9176.
Article

Successive Cyclones Attacked the World’s Largest Mangrove Forest Located in the Bay of Bengal under Pandemic

1
Institute of Ocean and Earth Sciences (IOES), University of Malaya, Kuala Lumpur 50603, Malaysia
2
Japan International Research Center for Agricultural Sciences (JIRCAS), Tsukuba 305-8686, Japan
3
Atmosphere and Ocean Research Institute, The University of Tokyo, Kashiwa 277-8564, Japan
4
Graduate School of Advanced Science and Engineering, Hiroshima University, Hiroshima 739-8511, Japan
*
Author to whom correspondence should be addressed.
Sustainability 2022, 14(9), 5130; https://doi.org/10.3390/su14095130
Submission received: 19 January 2022 / Revised: 19 April 2022 / Accepted: 21 April 2022 / Published: 24 April 2022 / Corrected: 27 July 2022
(This article belongs to the Special Issue Mangrove Ecosystem Ecology, Conservation and Sustainability)

Abstract

:
Despite the global focus on the COVID-19 pandemic, the promise of impact to tropical coastlines and stochasticity of destruction caused by tropical cyclones remains unaltered, forcing human societies to adapt to new unadaptable scenarios. Super Cyclone Amphan’s landfall—the third cyclone of the season within the world’s largest mangrove forest—brought a new uncertainty to this undeveloped region of South Asia. How do vulnerable people deal with multiple disasters that limit necessary humanitarian response while still maintaining the natural environmental integrity of a system harboring critical wildlife populations and protecting people from further disaster? We explored this reality for the Sundarbans region using a remote sensing technique and found that the western part of Sundarbans mangroves was severely damaged by Amphan, suggesting that rapid remote sensing techniques can help direct resources, and recognize the eventuality that response will be a best effort for now. If 2020 is a window, multiple disaster management scenarios may become more common in the future. Yet, society’s obligation for maintaining environmental integrity remains unchanged.

1. Introduction

Although a positive feedback between global warming and the degree of variability of tropical cyclone frequency and intensity has been a subject of debate, consistencies among simulation models and physical reasoning are capable of projecting at least 3 future scenarios: (1) decreases or no change in tropical cyclone frequency [1,2,3], (2) increases in intensity with clustering patterns and fractional increases in the number of more intense storms, and (3) increases in tropical cyclone-related rainfall rates [1,2,3]. Scenarios 2 and 3 explicitly apply to the northern Indian Ocean (NIO) where, despite reduced frequencies of cyclones compared to other basins, the destructive power of cyclones is often much stronger because of the lower social and economic development of the human landscape [4].
The Bay of Bengal (BoB), located at the eastern side of the NIO, is the largest bay in the world, and one of the most populated coastal settings (~500 million people) where the
Frequency of intense cyclones has risen recently [5], and with some of the deadliest reported cyclones in recent history. An analysis of all tropical cyclones that formed from 1982 to 2020 over the NIO indicated that the BoB was also a prominent source of cyclone intensification in comparison to the western Arabian coast. The BoB has a warm oceanic-sized water body throughout the year with present sea surface temperatures (SST) of 28–29 °C [6]. These SSTs are greater than the threshold SST for cyclogenesis (25.5–26.5 °C) [7], ensuring rapid intensification of any cyclone before it strikes land. Geometry of BoB is a “textbook example” of how to propagate a super cyclone to have maximum destructive influence. High probability of cyclone intensification, shallow-water concave bay, low flat coastal terrain, and the funnel shape of BoB are conducive for water propagation by strong winds and surge energy that become further concentrated through funneling as storms move toward land [8]. The most recent large cyclone was Super Cyclone Amphan, which made landfall accompanying heavy rainfall in the coastal areas of India and Bangladesh on 20 May 2020. This month was also recorded as the warmest in the region since 1880, as per NOAA, NASA, and WMO [9,10,11]. Importantly, Super Cyclone Amphan became the first super cyclone in recent history to impact an under-developed area of the world during a global pandemic. Additionally, after Super Cyclone Amphan, the BoB was hit by two successive cyclones, BOB02 (11 October 2020) and BOB (20 October 2020). Though impact severity of the two successive cyclones was less compared to Amphan, BOB02 generated heavy rain at landfall affecting the eastern coast of India (Andhra Pradesh) [12].
Amphan’s impact occurred at a time when lockdown due to the COVID-19 pandemic was a pervasive global priority affecting humanitarian response and forcing millions of local people to be evacuated and huddled in safe-shelters while attempting to socially distance. Globally, Amphan was among the deadliest natural disasters registered during the pandemic [Category 3 or H3 as per Saffir–Simpson Hurricane Wind Scale (SSHWS), 178–208 km h−1; more than 100 fatalities] [12], which was compounded by the pandemic’s grasp on society’s ability to provide aid and an uncertain toll yet to come from group spread of the disease as neighbors, friends, and outside personnel provided necessary aid. Yet, Amphan was the third successive cyclone in a season that developed in the BoB, causing severe damage to the eastern part of the BoB coast. The other two were Fani in April/May and Bulbul in November of 2019 (H4 and H2, respectively) [12]; a cyclonic succession that is even more difficult to recover from as a new set of rules began to govern how people can interact.
Cyclone impacts to the BoB result in saline water surge rapidly killing freshwater fish used for subsistence and further affecting drinking water sources, as well as preventing some land uses to cultivation for up to five years. Coastal communities often mitigate this multi-year impact by moving to cities until they can return, a process hindered significantly by COVID-19. After the cyclone, infections (especially diarrhea) occur quickly, and on-going medical treatments were impacted. Recently, the same occurred in The Philippines where Super Cyclone Goni, recorded as the strongest cyclone in the last four years, hit Catanduanes Island on 26 October 2020, when many parts of the country were under pandemic lockdown orders as well. Before Goni, The Philippines was struck by 12 cyclones (including category 3 and 4) in the same pandemic year. Following the alarming forecast of Goni, around four million people were evacuated, similar to the situation of Amphan, raising concerns over reduced social distancing and further viral spread. Like the BoB, it is noteworthy that The Philippines holds large mangrove areas (2675.2 km²) occupying 32.8% of their coastline. Cyclone impact is also common. For instance, a large section of mangrove forest was devastated in the central Philippines due to Super Cyclone Haiyan (2 November 2013) that caused damage of $12–15 billion (USD) and >10,000 human casualties [13]. In normal years, such impact is very difficult to overcome; the pandemic made recovery much more difficult to manage. Mangroves likely did play an important role in protecting coastal peoples from wind and waves. However, increased frequencies of tropical cyclones and the potential for intensified Super Cyclones (e.g., Amphan and Goni) are particularly concerning with or without mangroves, especially as coastal populations increase and pandemic spread probabilities intensify.
The land-ocean interface of the BoB has global uniqueness because of the presence of the Sundarbans, the world’s largest contiguous mangrove forest located on the coast of two adjacent countries, Bangladesh (62%) and India (38%) [14]. The Sundarbans also draw people to this low-lying area, creating a conflict between societal provisioning and disaster vulnerability. Functioning of mangroves as bio-shields against natural disasters, like tsunamis and tropical cyclones, has the potential to save thousands of inhabitants at the coastal rim, but even large mangrove areas alone do not provide all the protections humans would like [15], though the coastal protection can be considered as one of the most undervalued ecosystem services of mangroves [16]. While our understanding of surge protection value is limited versus other ecosystem services provided by mangroves, such as protecting infrastructure, provisioning of wildlife habitat and carbon sequestration, mangroves are likely to be much more effective in normal wave suppression than they are surge protection [17]. Yet, going largely unnoticed was the statistically significant reduction in human deaths during a super cyclone landfall along the eastern BoB, India in October 1999 [18], or the protective role of coastal vegetation during the Asian tsunami in 2004 [19]. Mangroves certainly help to spare lives in multiple ways during storms; an influence that may be reduced with repetitive future cyclonic events.
The Sundarbans have global significance as a UNESCO World Heritage Site, registering large rates of carbon uptake from atmospheric CO2 [20], providing for fisheries, and supporting a unique wildlife resource (e.g., Royal Bengal Tiger, Chital Deer, unique dolphins) while partially adjusting naturally to current rates of sea level rise [21]. At stake are protective or recovery measures to ameliorate human impacts to mangroves (e.g., as people gather additional sustaining resource from the mangroves) and wildlife impact to mangroves (e.g., destruction of a fence to keep tigers away from humans), which are compromised by pandemic rules that are still quite foreign to the Sundarbans residents. It is expected that this juxtaposition between normal response to a super cyclone and COVID-19 could worsen Amphan’s impact to the Sundarbans, and future cyclones, perhaps turning parts of the Sundarbans into a carbon source from delayed re-engineering or re-planting efforts requiring lots of people to gather in small spaces. In the Sundarbans mangroves, it has been reported that mangrove rehabilitation programs are one of the major determinants of turnover between mangrove and non-mangrove as well as encroachment, erosion and aggradation [22]. Reforestation and afforestation have been conducted in the Indian Sundarbans since 1989 to conserve endangered species such as Heritiera fomes and to establish bio-shields against cyclones by planting mangroves [23]. The moving control under pandemic could bring a delay of reforestation after the storm disturbance. The aftermath of the largest mangrove dieback in Australia yielded something similar vis-à-vis massive carbon loss [24]. Sediment erosion and inundation often result in accelerated forest land subsidence [25] with slow but steady submergence of many outer shore islands around the BoB. As site access is impossible after many cyclones, it is necessary to estimate the extent of damage reliably with remote sensing, identify potential eco-physiological disorders underway with the mangroves immediately after a cyclone strike, and begin to plan actions to facilitate mangrove and wildlife habitat recovery post-cyclone with due diligence once post-pandemic access returns. This study presents the results of monitoring the damage caused by a super cyclone Amphan using remote sensing technology that enables us to conduct a quick assessment, and proposes an approach for assessing a massively disturbed natural environment under moving control conditions, such as during a pandemic of COVID19, to facilitate environmental and cultural sustainability.

2. Materials and Methods
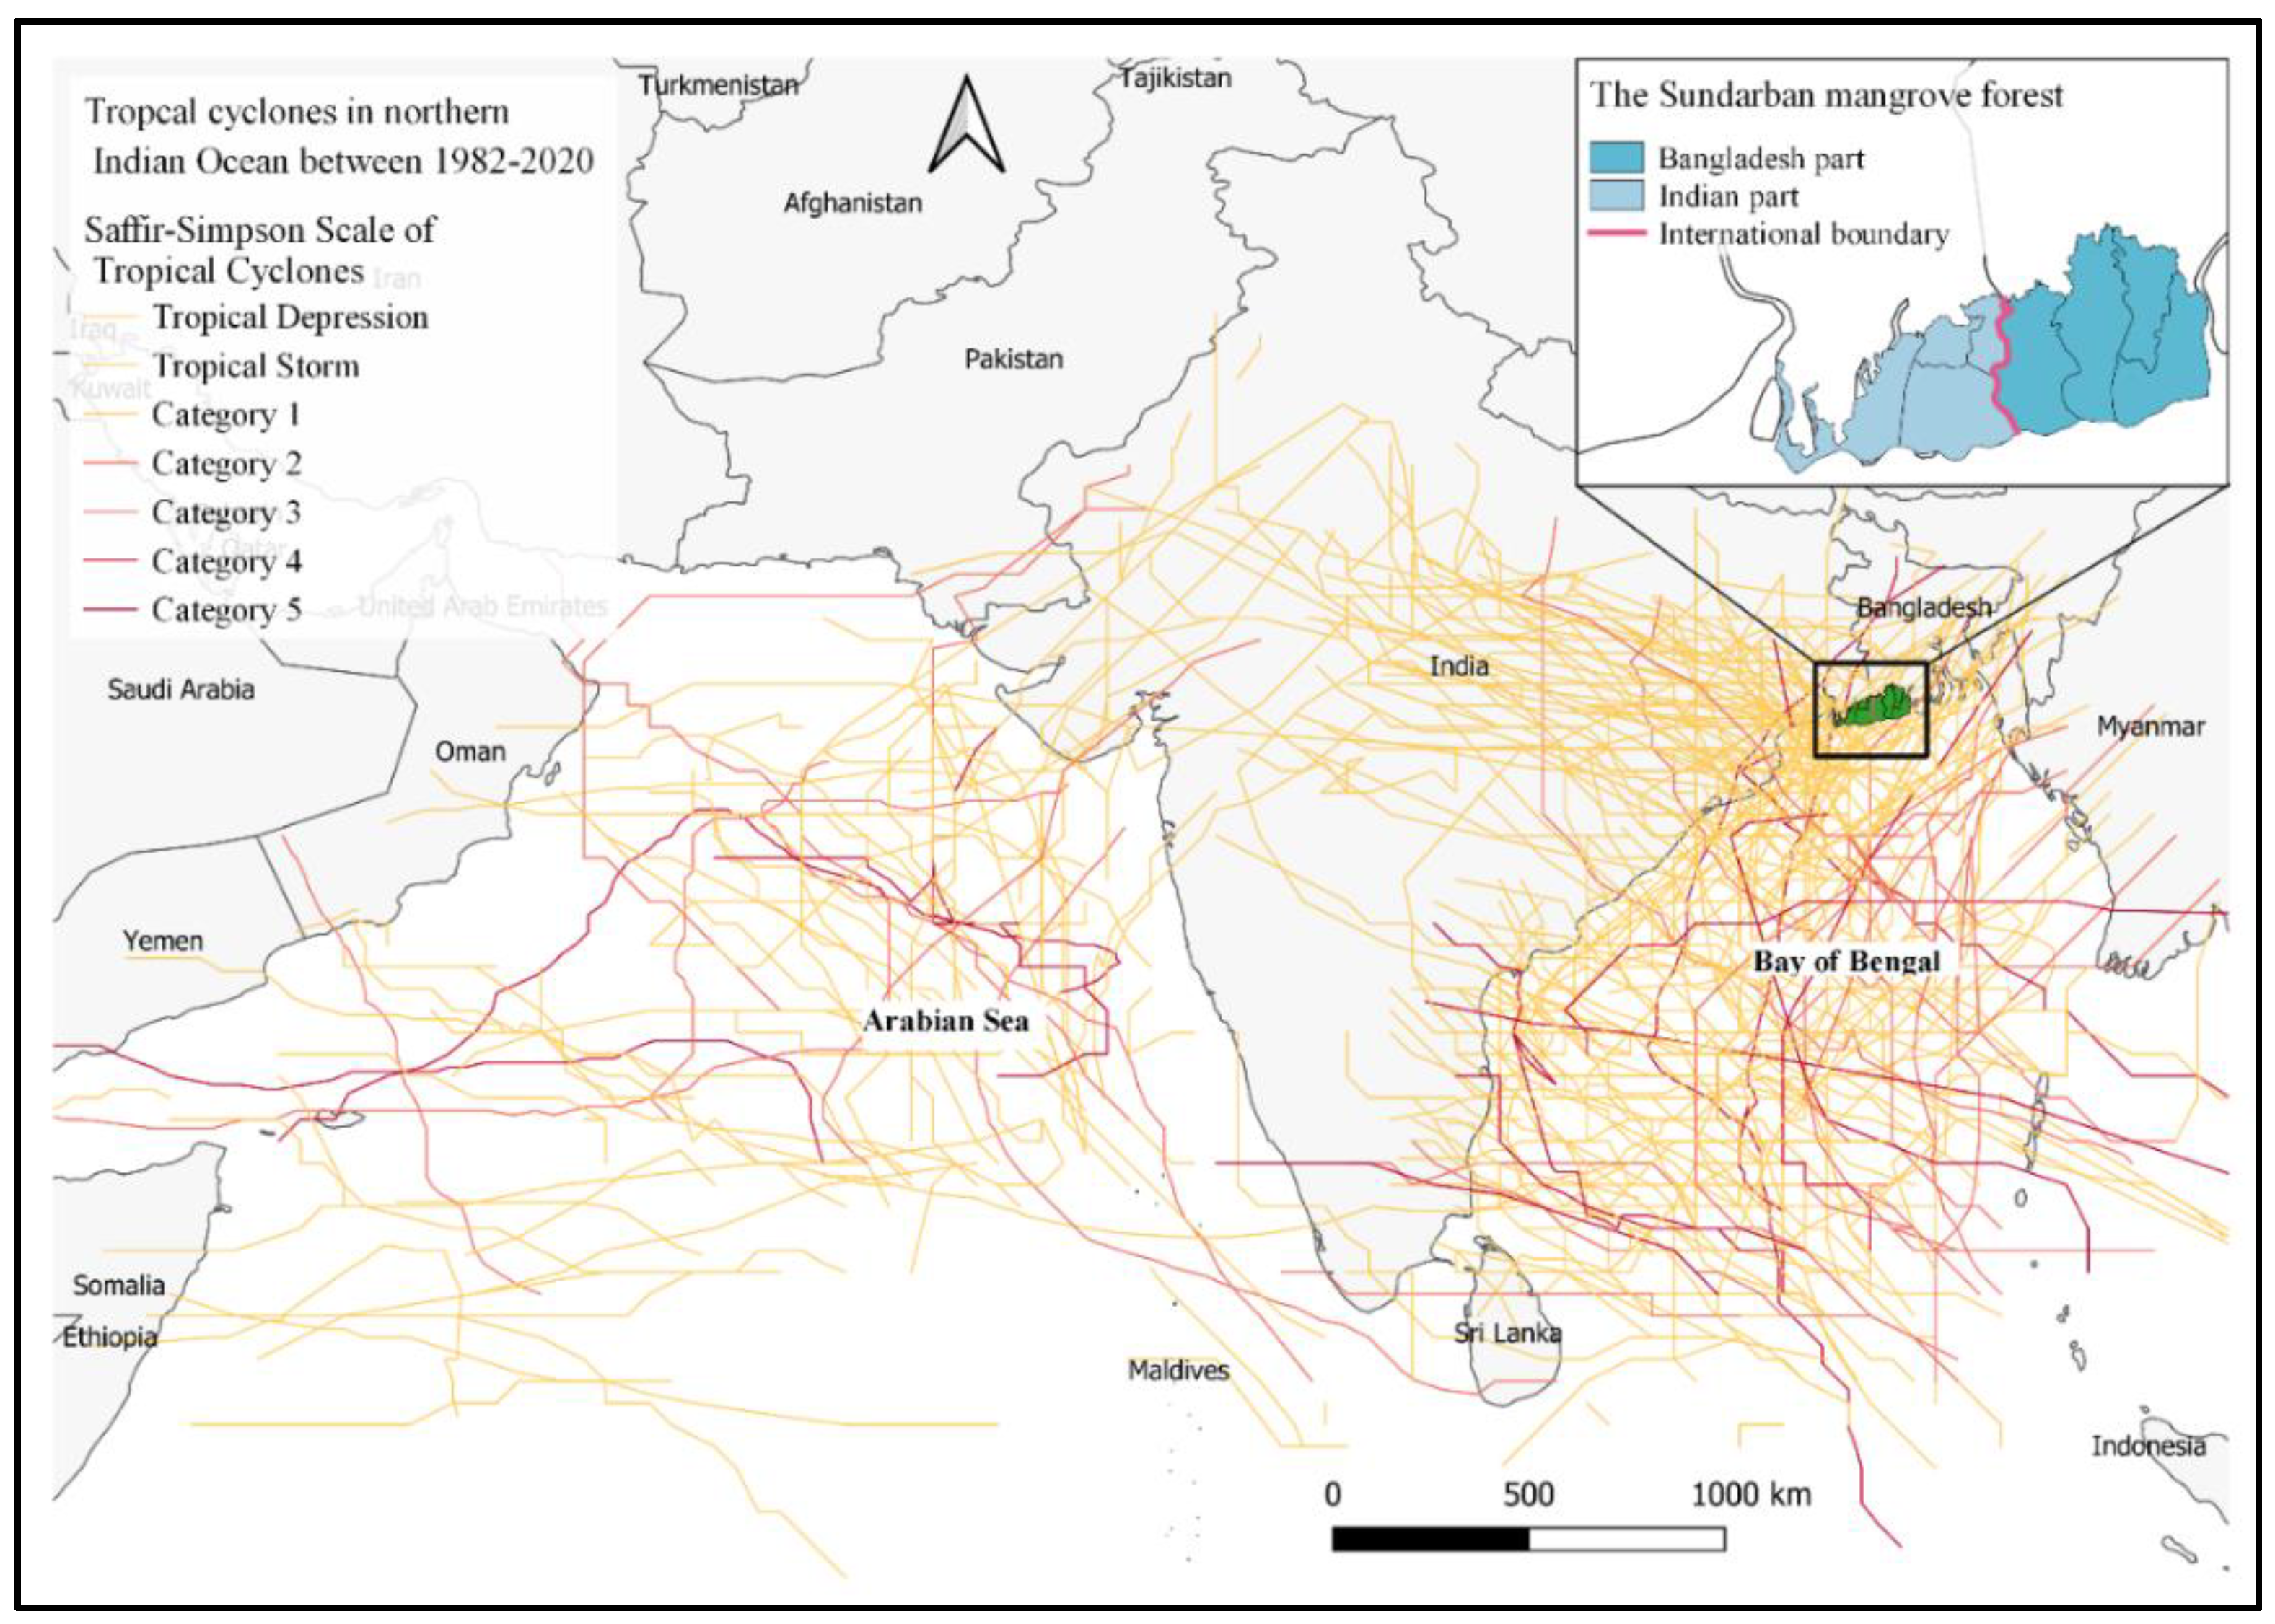
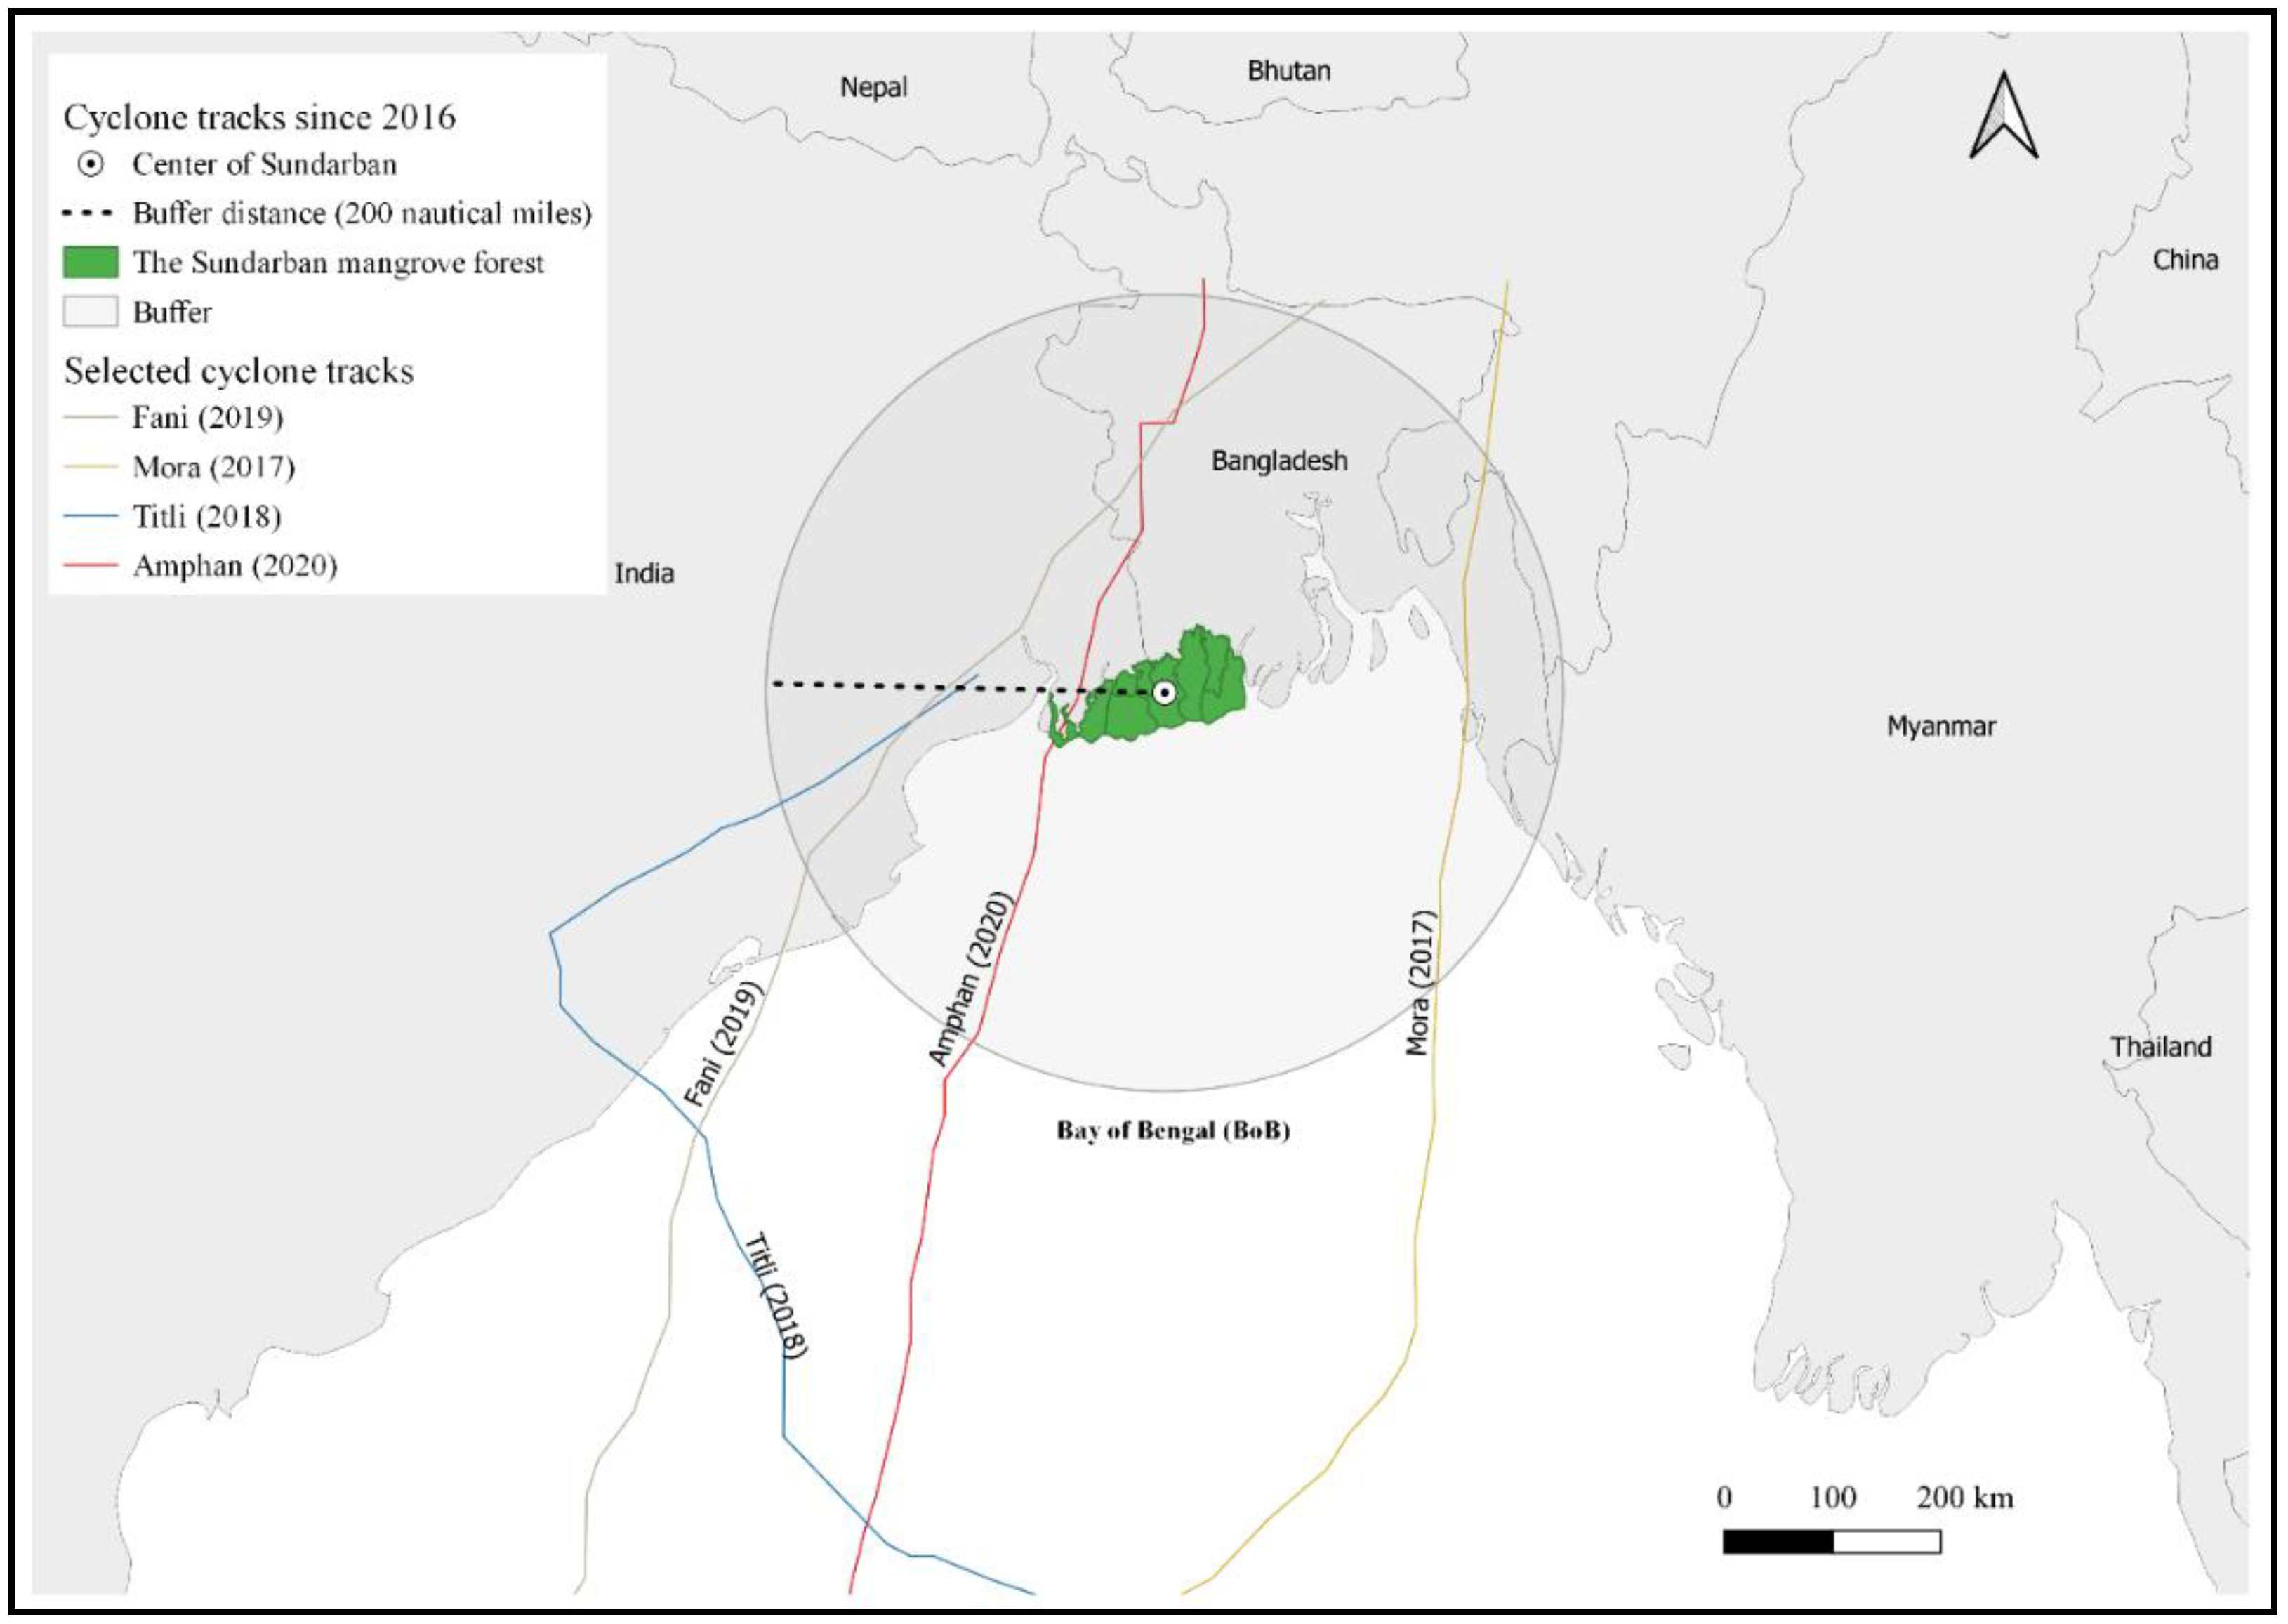
2.1. Study Area

The Sundarbans mangrove forest region (Figure 1), both Bangladesh and Indian part bounded by 21°32′–22°40′ N latitude and 88°05′–89°51′ E longitude, was the focus of the study. Comprised of numerous complex, interconnected tidal creeks or channels the forests receive continuous supply of freshwater. The Sundarbans mangrove forest is a unique ecosystem that supports a large number of flora and fauna. Due to its immense importance, the forest is heavily protected by law as part of UNESCO world heritage site both in India and Bangladesh [14,20].
About two thousand animal species including the Royal Bengal Tiger dwells in this wonderful ecosystem. It hosts over 300 plant species, of which over 27 are mangrove tree species [14,26]. Major mangrove species that dominate the forests are: H. fomes, Excoecaria agallocha, Ceriops decandra and Sonneratia apetala. However, patches and mixes of Avicennia, Xylocarpus, Bruguiera, and Rhizophora trees and Nypa palm exists throughout the forest [14,26,27]. The mean monthly temperature, rainfall and relative humidity varies between ranges from 12 to 35 °C, 1600–2000 mm and 70–80%, respectively [14,26]. The monsoon season, months of June to October, brings about 80% of the total rainfall [28]. Located at the tip of the Bay of Bengal, the Sundarbans mangrove forest is often impacted by frequent cyclonic storms of varied intensities (Figure 1).

2.2. Cyclone Data

Data on major cyclones that formed in the Northern India (NI) basin since 1982 were retrieved from the India Meteorological Department (IMD) [12] (Figure 1). Cyclones that impacted the Sundarbans or made landfall there since 2016 (i.e., a centroid point: 21°56′21.31″ N, 89°10′56.01″ E) within a radius of 370.4 km (200 nautical miles) were cataloged according to the methodology described in Mandal and Hosaka [2], with adjustments due to image availability. As multiple cyclones impacted the Sundarbans, only the strongest were selected each year. As a result, cyclones Mora in 2017, Titli in 2018, Fani in 2019 and Amphan in 2020 were identified as our focal storms (Figure 2). The India Meteorological Department (IMD) uses a slightly elaborated categorization of cyclones based on estimated maximum sustained wind speed (km h−1; hereafter “wind speed”), but for comparison, the SSHWS was used for categorization (hereafter “category”). Minimum distance (km; hereafter “distance”) of cyclone eye wall track from the center of the Sundarbans was determined. Study-selected cyclones along with those identified previously by Mandal and Hosaka [2], as well as specific cyclone-defining parameters, are presented (Table 1).

2.3. Multi-Spectral Remote Sensing Data Analyses

Landsat 8 Operational Land Imager and Thermal Infrared Sensor (OLI/TIRS) surface reflectance data (Earth Engine ID: LANDSAT/LC08/C01/T1_SR) were accessed using the Google Earth Engine (GEE) platform [30]. Provided images from GEE were already atmospherically corrected, and filtered of cloud and shadow masking using a custom made function in GEE based on pixel_qa band. We chose the GEE platform because it is widely accessible to many natural resource agencies.
We developed a vegetation mask using a supervised classification and regression tree (CART) method. Landsat 8 surface reflectance images from 2018 (total 77 images) were sorted and filtered in GEE, and Normalized Difference Vegetation Index (NDVI) was calculated for each image. NDVI was calculated as follows:
NDVI = (NIR − RED)/(NIR + RED)
where, NIR represents band 5 (B5) and RED represents band 4 (B4) data from Landsat 8′s Operational Land Imager. The first seven bands (B1 to B7) and the NDVI band were used as prediction bands. Four classifications were used to define the Sundarbans mangroves remotely; (1) vegetation class: mangrove forest vegetation; (2) water class: river channels and open water areas; (3) mudflat: bare soil and flooded areas associated with channels; and (4) bare soil: bare land and sand beaches (not classified as mud). For data training, randomly selected points (about 30–100 per class) were generated using Google Earth Pro and published maps. 70% of the points were used to train the classifier and the remainder of the dataset (30%) was used to assess accuracy using a confusion matrix [31]. A forest cover vegetation mask was then produced from a classified map, and further analyses of forest disturbances were conducted for vegetated areas only. Results of the supervised classification and accuracy assessment are summarized (Table 2).
The pre-disturbance period from Landsat imagery was selected as January to March for all cyclones, which consistently represented periods prior to cyclone impact. This period allowed us to avoid cloud contamination and reduce seasonal phenological differences from vegetation. The post-disturbance period from Landsat imagery was selected from the same months, but from the year following impact for cyclones Mora (2017), Titli (2018), and Fani (2019). For Super Cyclone Amphan, pre-storm and post-storm images were collected from 6 April to 17 May 2020, and 24 May to 12 August 2020, respectively.
Different approaches have been used previously for assessing cyclone disturbances. These included spectral mixture analysis [32,33] as well as spectral index analysis based on such components as enhanced vegetation index (EVI) [34] and normalized difference moisture index (NDMI) [24]. However, in the absence of field data (especially during pandemic lockdowns) and for the purposes of our quick assessment needs, we used remotely sensed NDVI only.
NDVI is perhaps the most popular index used globally, because this index has strong correlations with leaf area indices [35]. We calculated NDVI for all pre- and post-disturbance periods, then we produced maximum value composites using GEE’s “quality mosaic” function. Post-disturbance NDVI composites were subtracted from pre-disturbance NDVI images, and mean values (μ) were analyzed. We carefully checked the resultant μ values for normality and calculated a selection threshold using the formula.
Threshold = μ ± nσ
where σ is the standard deviation of the mean difference in composite values and n is non-negative integer numbers. We used ±3σ (thus, n = 3) for cyclones Mora (2017), Titli (2018) and Fani (2019), and ±1σ (thus, n= 1) for Super Cyclone Amphan (2020). The basic assumption was that any change in NDVI values less than μ ± nσ (i.e., approximately 0.1) might reflect natural forest dynamics and not actual damage from cyclone disturbance. Therefore, those values of “n” were censored. Without field data, it was not possible to quantitatively assess the true threshold value; however, we compared our results for Super Cyclone Amphan (2020) with local news, expert opinion, and field photos which was helpful for verifying our rapid analysis. Similar change detection methodology has been applied to assess cyclone disturbances in the Everglades mangrove forests [36,37], and cyclone induced land use and land cover changes in central regions of Mozambique [38].

2.4. Empirical Models to Validate the Impacts of Cyclones on NDVI Change

To interpret the spatial pattern of NDVI loss (NDVIloss: dimensionless) after Super Cyclone Amphan, the relationships of NDVIloss to the distance from the trajectory of Amphan (Track: m), distance from the water’s edge (Water: m), and NDVI before cyclone attack (preNDVI: dimensionless) were analyzed with a general additive model (GAM) by applying the penalized thin plate regression spline function of latitude (X: m) and longitude (Y: m). In the GAM, X and Y values are treated as the random effect to avoid Type I error caused by spatial auto-correlation among neighboring pixels. We used the function, gam, from package, mgcv, available in R software ver. 4.0.2 [39]. To calculate Track and Water, we used a plugin, NNJoin, from an open-source GIS software program QGIS ver. 3.10.1-A Coruña [40].

3. Results and Discussion

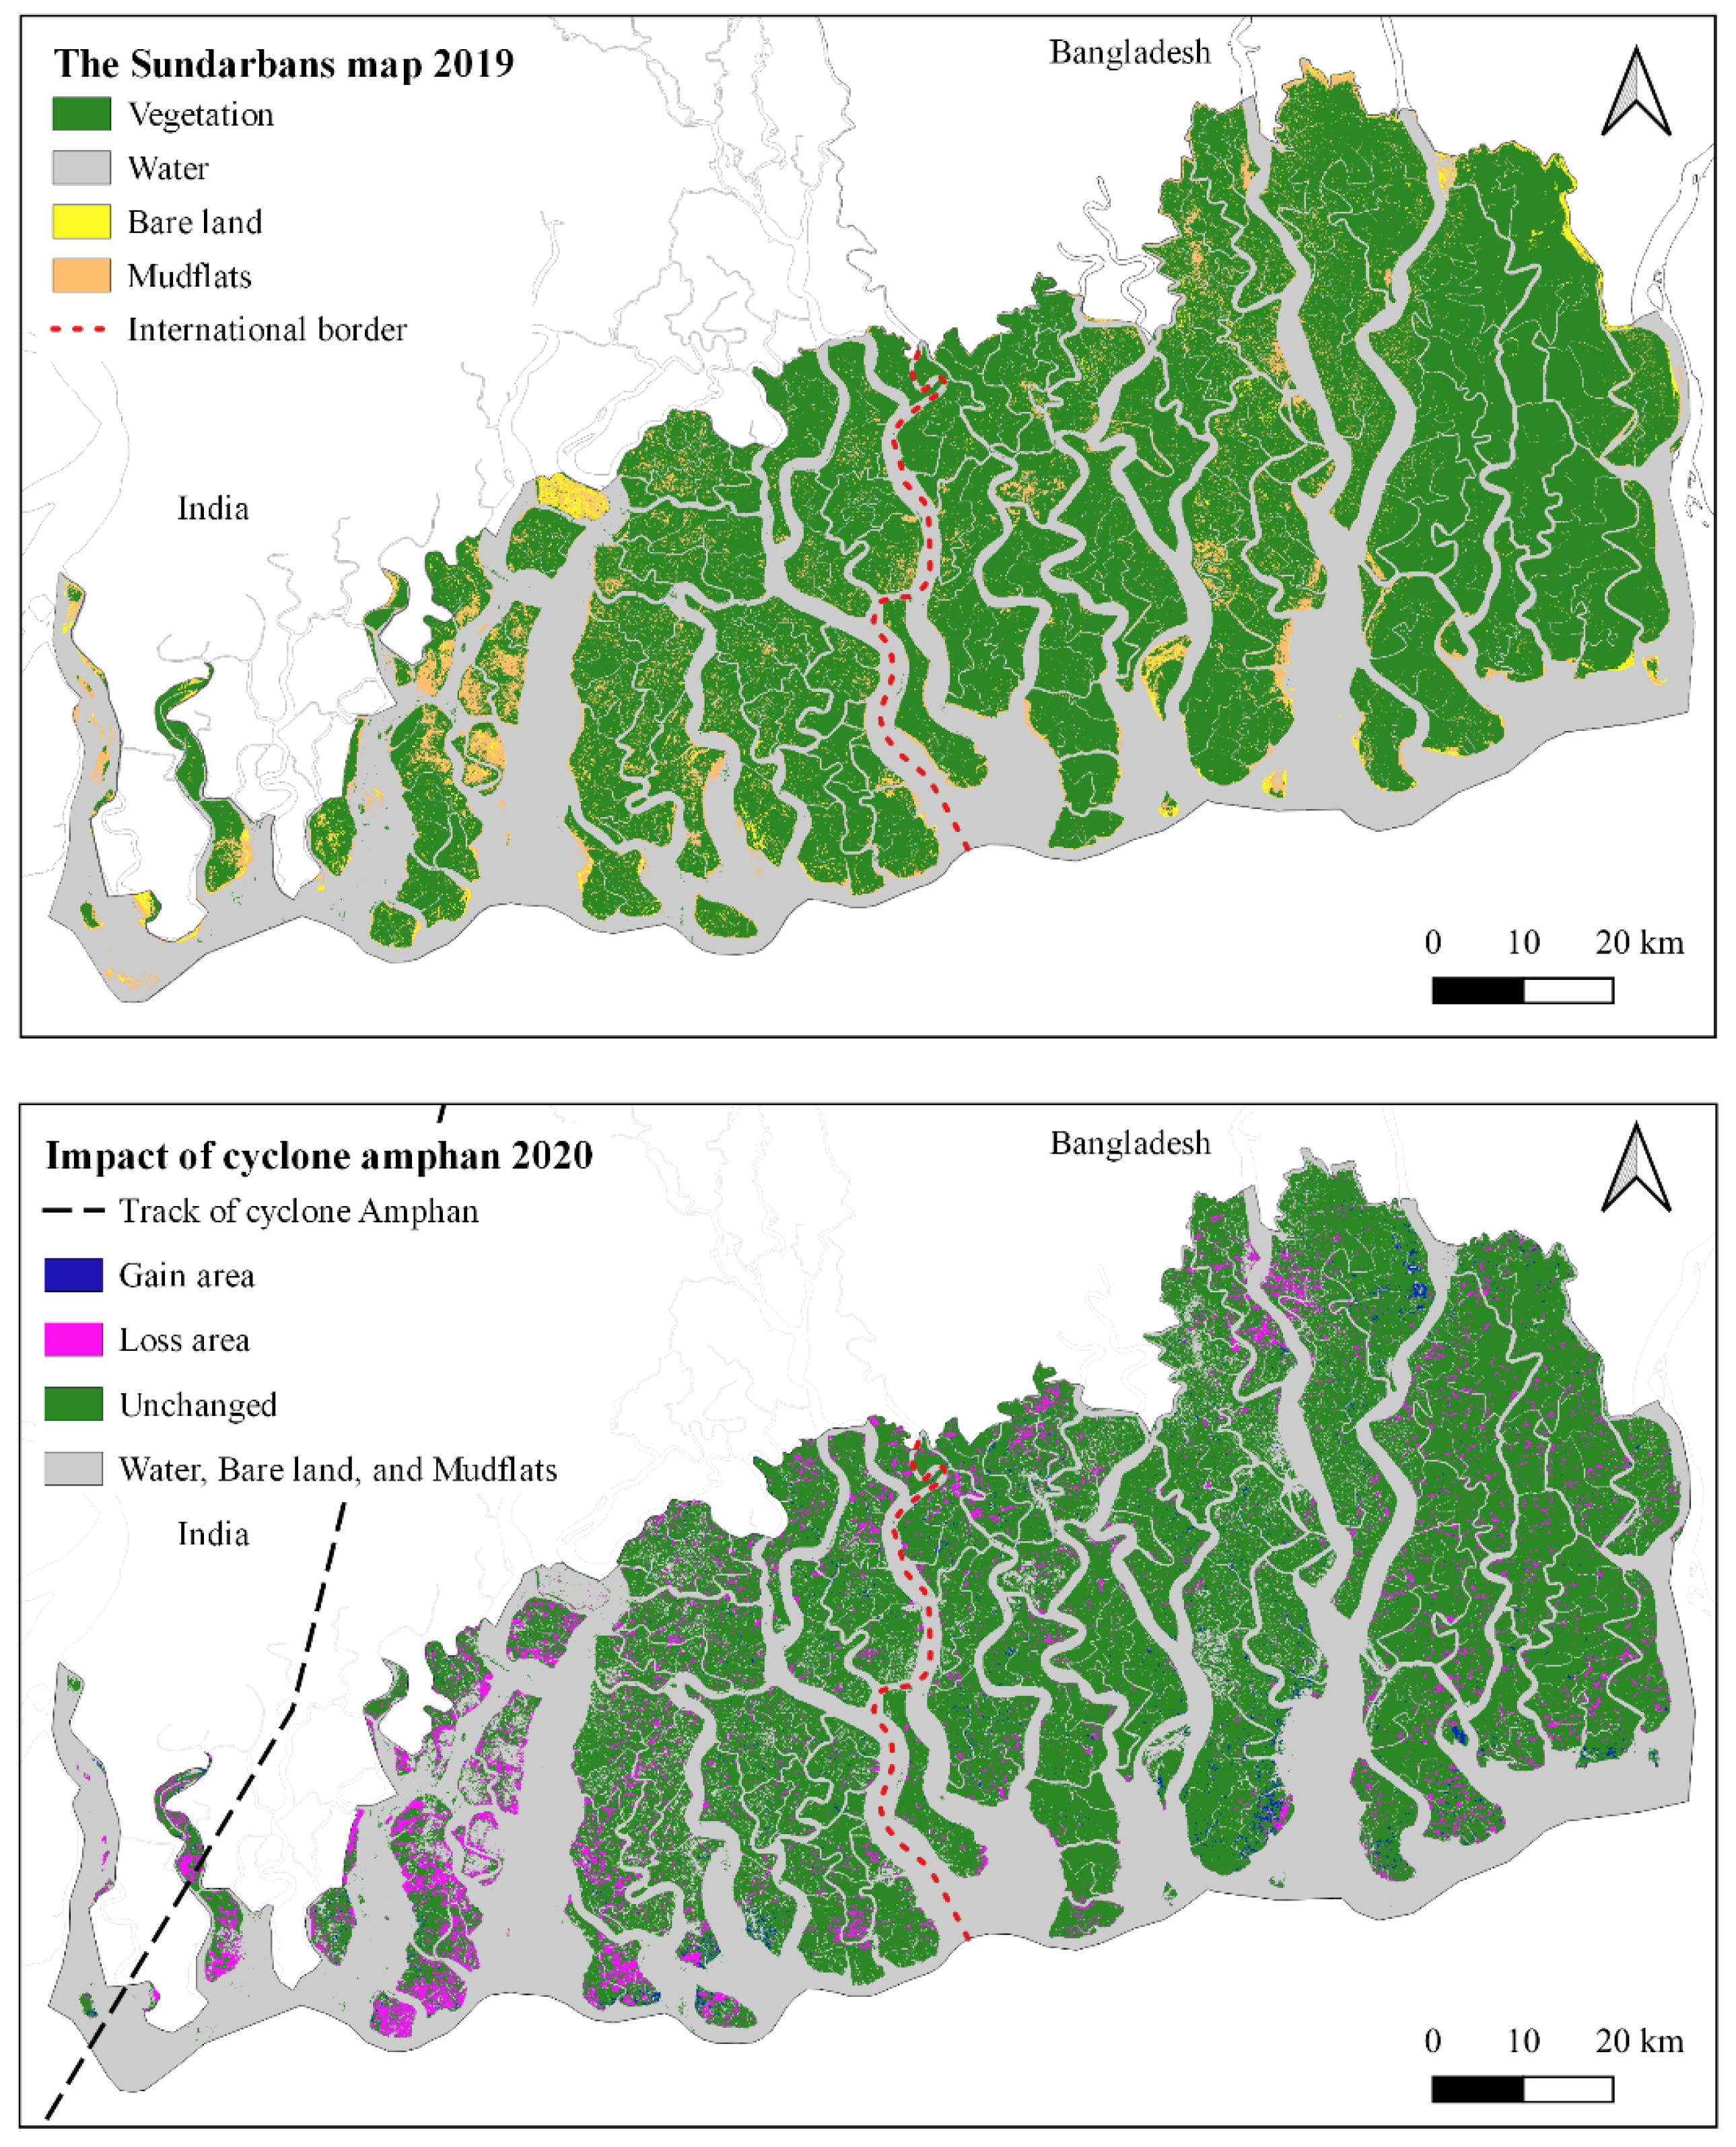
3.1. Rapid Detection of Mangrove Damage by Remote Sensing

Post-Amphan, true loss or damage of the Sundarbans mangrove vegetation is unknown; the pandemic still governs access. However, some damage like many broken embankments, inland flooding, and uprooted trees are reported on electronic media and obvious in our remote sensing work. A large portion of the mangroves lining several creeks and waterways are turning brownish red (as burnt or scalded) after Amphan; a strong remotely-sensed indicator of wide-spread mangrove mortality. Likewise, in early July of 2020, Calcutta University scientists surveyed some of the affected islands of the Indian Sundarbans and observed widespread mangrove mortality resulting from a mix of storm winds and pervasive post-Amphan hypersaline flooding beyond physiological tolerances of mangroves (Figure 3).
Changes in NDVI before versus after cyclones that occurred between 1990 and 2016 in the Sundarbans of both India and Bangladesh were recently analyzed [2,28], see Table 1. Category 3, or higher-intensity cyclones that occurred in succession after 7 to 12 years destructively affected 20% or more of the Sundarbans mangrove forest area, offering a grim insight into what a future with more cyclones might mean when impact is compounded through successive cyclones. In general, the first cyclone strike can bring massive damages to trees and subsequent cyclones immediately after the first one bring less damages to trees compared to the first strike since vulnerable trees are already excluded by the first strike [41,42]. The areas of four major cyclones impacting the Sundarbans in successive years of 2017 to 2020 were analyzed using Landsat images, and all areas hit by cyclones in the Sundarbans between 1990 to 2020 or made landfall within a radius of 370.4 km (200 nautical miles) were analyzed over successive years since impact (Table 1). From this, the intensity of Amphan (C20) was the third most severe after Sidr (C07) and an unnamed cyclone (C95) over the last 3 decades, with Amphan causing 11.5% damage to the mangrove vegetation. In comparison, previous cyclones caused more damage, with C07 and C95 impacting the Sundarbans in 2007 and 1995, and registered 24.1% and 12.3% mangrove damage, respectively.

3.2. Empirical Models of NDVI Changes

The GAM analysis detected significant negative effects of Track, Water and preNDVI to NDVIloss on the mangroves (Table 3). The smoothing term based on X and Y assigned a random effect and was significant (p < 0.001). The Sundarbans mangrove forest showed greater loss of NDVI from Amphan versus the Bangladesh part. However, the effect of Water was visually unclear even at the local scale (Figure 4b). This is because preNDVI tends to be smaller near the shore and showed a more significant negative effect to NDVIloss than Water. As a result, the lower NDVIloss near the shore can be visually confirmed because of the effect of lower preNDVI near the shore. This is a reasonable result since the vegetation near the shore is regularly disturbed by wind and waves which determine the local limit of natural mangrove habitat occurrence and should result in the lower preNDVI. Interestingly, a photo (Figure 3b) captured the general trend that we noted in the mangroves near the shore consisting of shorter individuals with green canopies. Taller individual mangrove trees in interior areas showed damaged canopies, as indicated by reddish hues or complete defoliation. Similarly, a previous study on the influence of Super Typhoon Haiyan on mangroves in the Philippines reported that mangrove trees taller than 10 m were much more severely damaged than shorter trees [43]. Tree size-distributed cyclone wind damage is a common theme in mangrove forests globally [18].
The main trajectory of Amphan was over the extreme western part of the Sundarbans. As a result, the extent of mangrove structural change was more prominent on the Indian side of the Sundarbans versus Bangladesh’s mangroves (Figure 5), and the statistical results based on general additive modeling also revealed that areas closer to the trajectory of Amphan showed significantly greater decreases in NDVI (p < 0.01) (Table 3). Recovery trajectories of cyclone affected mangrove ecosystems after multiple cyclone strikes is unknown but being monitored by remote sensing in the Sundarbans. On the basis of the previous reports related to recovery process of mangroves after storm disturbances, we can expect the Sundarbans mangrove forests to show quick recovery after storm disturbance [13,43,44], which has been observed in our image monitoring after the Amphan strike (data is not shown). This quick recovery of mangroves is because the mangrove forests have distinct disturbance adaptive traits. That is, some dominant mangrove species, such as Heritiera fomes, Excoecaria agallocha, Avicennia spp., and Sonneratia spp. have the ability to recover by sprouting, as reported in Myanmar [44] and The Philippines [43], though high mortality of Rhizophora spp. is notable [43,44]. In the case of Sundarbans mangroves, the dominant species are H. fomes, E. agallocha, Ceriops decandra and Sonneratia apetala [26,27]. Thus, three of four dominant species (H. fomes, E. agallocha and S. apetala) in Sundarbans can be considered as resilient mangrove species. However, beyond the ecological resilience of mangroves, we should pay attention to a possible delay of recovery of mangroves owing to moving control caused by COVID19 pandemic and delayed human intervention.

3.3. Importance of Timely Assessment, Pandemic and Points of Concern

Time-series remote sensing inventory of Sundarbans mangrove damage from cyclones can be updated fairly rapidly post-storm, and relies less on overcoming the destructive impacts to human infrastructure to facilitate expedient decisions during times of compounded disasters. Updates on spatial mangrove recovery and delayed mortality from Titli, Fani, and Amphan are currently underway despite COVID-19. Indeed, the impacts of successive cyclones to mangroves are visibly more effectual in our imagery the longer the gap between storms as recovery is better enabled with longer temporal gaps, e.g., [17]. However, impacts to humans and wildlife do not necessarily follow that same trend.
Another perspective of this research is that scientists map mangrove damage in most cases, but from a sustainability context, the pandemic caused (and continues to cause) many issues that we describe. Timely mapping efforts should be part of disaster response, and not limited to science advancement years after. We are not the only scientists who have noted this, and we want to get this message out when other have not. News headlines rarely focus on lesser-known regions of the world. Quick action is critical to sustainable systems management, and the pandemic is a barrier in need to future accommodation through disaster planning. We may compare our story, e.g., with the following very recent headline, “Tonga races to prevent a ‘tsunami of covid’ as rescue efforts begin after underwater volcano disaster” [45]. This made headlines quickly, but cyclones are all too often not considered in the same light, despite their proportionately higher destructive frequencies and human mortality.

4. Conclusions

Whilst cyclones continue to affect coastlines in developing countries, quick responses facilitated by remote sensing [32] as well as for quantifying resilience/recovery will become increasingly more critical. The decrease in NDVI could just be a short-term effect (leaf loss, structural damage) and forest recovery may occur quickly in some areas. With longer-term data or monitoring effort, these metrics can be used to characterize and map resistance (no change), resilience (recovery to a previous condition), or regime shifts (original ecosystem loss). For example, after Super Cyclone Haiyan, The Philippines’ Department for Environment and Natural Resources proposed a $22 million (USD) mangrove replanting program for the affected mangrove-fringed coastal zone to develop the first line of defense against future cyclones [13]. Conservation and protection of mangroves alone cannot fulfill future situations for local coastal communities as well as achieving sustainable development goals. The livelihood is definitely an important part of every country. For example, Bakhawan Ecopark, a mangrove reforestation project, did not only address the community’s flood problems but also provided a means of livelihood for the local people in the area through eco-tourism, and has been evaluated as one of the good forest management practice in the whole of Asia and the Pacific by FAO [46]. Thus, mangroves act not only as bio-shield but also provide other functions including carbon sequestration, enhancement of fish stocks, eco-tourism spots, etc. Adding coastal blue carbon ecosystems in Nationally Determined Contributions (NDCs) would be one of the ways for coastal countries to achieve minimization of carbon emissions via protecting mangroves, and create additional opportunity for economic recovery that consider the reality of successive cyclone strikes. Finding ways to maintain mangrove ecosystem health and resilience via natural recovery, reforestation, conservation, and proper sustainable management after successive cyclones must be a part of national-scale strategies in spite of pandemics and future unforeseen circumstances. Necessary delays from pandemics do not change natural resource needs.

Author Contributions

S.S. and R.R. conceived the project and wrote the original draft. R.S. and M.S.H.M. processed R.S. data and images. All authors have read and agreed to the published version of the manuscript.

Funding

Authors wish to express their gratitude for the financial support provided by the Japan International Cooperation Agency (JICA) and Japan Science and Technology Agency (JST) through the Science and Technology Research Partnership for Sustainable Development Program (SATREPS) in the Project “Comprehensive Assessment and Conservation of Blue Carbon. Authors are grateful for additional funds from University of Malaya (Grant No. RU009C-2018), and the USGS Climate Research & Development Program.

Data Availability Statement

Data will be made available upon request to the corresponding author.

Acknowledgments

Authors are sincerely thankful to Dept of Marine Science, Calcutta University (S. K. Mukhopadhyay and research team) for sharing the photographs of the Sundarbans post-Amphan (refers to Figure 4). Any use of trade, firm, or product names is for descriptive purposes only and does not imply endorsement by the U.S. Government.

Conflicts of Interest

The authors declare no conflict of interest.

References

  1. Mumby, P.J.; Vitolo, R.; Stephenson, D.B. Temporal Clustering of Tropical Cyclones and Its Ecosystem Impacts. Proc. Natl. Acad. Sci. USA 2011, 108, 17626–17630. [Google Scholar] [CrossRef] [PubMed] [Green Version]
  2. Mandal, M.S.H.; Hosaka, T. Assessing Cyclone Disturbances (1988–2016) in the Sundarbans Mangrove Forests Using Landsat and Google Earth Engine. Nat. Hazards 2020, 102, 133–150. [Google Scholar] [CrossRef]
  3. Paul, B.; Rashid, H. Climatic Hazards in Coastal Bangladesh: Non-Structural and Structural Solutions; Butterworth-Heinemann: Oxford, UK, 2016. [Google Scholar]
  4. Knutson, T.; Camargo, S.J.; Chan, J.C.; Emanuel, K.; Ho, C.-H.; Kossin, J.; Mohapatra, M.; Satoh, M.; Sugi, M.; Walsh, K.; et al. Tropical Cyclones and Climate Change Assessment: Part I: Detection and Attribution. Bull. Am. Meteorol. Soc. 2019, 100, 1987–2007. [Google Scholar] [CrossRef] [Green Version]
  5. Sánchez-Triana, E.; Paul, T.; Leonard, O. Building Resilience for Sustainable Development of the Sundarbans: Strategy Report; South Asia Region Sustainable Development Department Environment & Water Resources Management Unit, The Work Bank: Washington, DC, USA, 2014. [Google Scholar]
  6. Singh, O.; Khan, T.M.A.; Rahman, M.S. Has the Frequency of Intense Tropical Cyclones Increased in the North Indian Ocean? Curr. Sci. 2001, 80, 575–580. [Google Scholar]
  7. Balaguru, K.; Taraphdar, S.; Leung, L.R.; Foltz, G.R. Increase in the Intensity of Postmonsoon Bay of Bengal Tropical Cyclones. Geophys. Res. Lett. 2014, 41, 3594–3601. [Google Scholar] [CrossRef]
  8. Dare, R.A.; McBride, J.L. The Threshold Sea Surface Temperature Condition for Tropical Cyclogenesis. J. Clim. 2011, 24, 4570–4576. [Google Scholar] [CrossRef]
  9. World Meteorological Organization (WMO). Cyclone Amphan Highlights the Value of Multi-Hazard Early Warnings. Available online: https://public.wmo.int/en/media/news/cyclone-amphan-highlights-value-of-multi-hazard-early-warnings/ (accessed on 12 June 2020).
  10. The National Aeronautics and Space Administration (NASA). Tropical Cyclone Amphan. Available online: https://earthobservatory.nasa.gov/images/146746/tropical-cyclone-amphan (accessed on 12 June 2020).
  11. National Oceanic and Atmospheric Administration (NOAA). Tropical Cyclone Amphan Heads Toward India and Bangladesh. Available online: https://www.nesdis.noaa.gov/news/tropical-cyclone-amphan-heads-toward-india-and-bangladesh/ (accessed on 12 June 2020).
  12. India Meteorological Department (IMD). Regional Specialized Meteorological Centre for Tropical Cyclones over North Indian Ocean. Ministry of Earth Sciences, Government of India. Available online: http://www.rsmcnewdelhi.imd.gov.in/ (accessed on 12 June 2020).
  13. Primavera, J.; Dela Cruz, M.; Montilijao, C.; Consunji, H.; Dela Paz, M.; Rollon, R.; Maranan, K.; Samson, M.; Blanco, A. Preliminary Assessment of Post-Haiyan Mangrove Damage and Short-Term Recovery in Eastern Samar, Central Philippines. Mar. Pollut. Bull. 2016, 109, 744–750. [Google Scholar] [CrossRef]
  14. Spalding, M. World Atlas of Mangroves; Routledge: Oxfordshire, UK, 2010. [Google Scholar]
  15. Feagin, R.A.; Mukherjee, N.; Shanker, K.; Baird, A.H.; Cinner, J.; Kerr, A.M.; Koedam, N.; Sridhar, A.; Arthur, R.; Jayatissa, L.P.; et al. Shelter from the Storm? Use and Misuse of Coastal Vegetation Bioshields for Managing Natural Disasters. Conserv. Lett. 2010, 3, 1–11. [Google Scholar] [CrossRef] [Green Version]
  16. Barbier, E.B.; Hacker, S.D.; Kennedy, C.; Koch, E.W.; Stier, A.C.; Silliman, B.R. The Value of Estuarine and Coastal Ecosystem. Serv. Ecol. Monogr. 2011, 81, 169–193. [Google Scholar] [CrossRef]
  17. Krauss, K.W.; Osland, M.J. Tropical Cyclones and the Organization of Mangrove Forests: A Review. Ann. Bot. 2020, 125, 213–234. [Google Scholar] [CrossRef]
  18. Vincent, J.R.; Das, S. Reply to Baird et al.: Mangroves and Storm Protection: Getting the Numbers Right. Proc. Natl. Acad. Sci. USA 2009, 106, E112. [Google Scholar] [CrossRef] [Green Version]
  19. Danielsen, F.; Sørensen, M.K.; Olwig, M.F.; Selvam, V.; Parish, F.; Burgess, N.D.; Hiraishi, T.; Karunagaran, V.M.; Rasmussen, M.S.; Hansen, L.B.; et al. The Asian Tsunami: A Protective Role for Coastal Vegetation. Science 2005, 310, 643. [Google Scholar] [CrossRef] [PubMed] [Green Version]
  20. Ray, R.; Chowdhury, C.; Majumder, N.; Dutta, M.K.; Mukhopadhyay, S.K.; Jana, T.K. Improved Model Calculation of Atmospheric CO2 Increment in Affecting Carbon Stock of Tropical Mangrove Forest. Tellus B Chem. Phys. Meteorol. 2013, 65, 18981. [Google Scholar] [CrossRef]
  21. Rahman, A.F.; Dragoni, D.; El-Masri, B. Response of the Sundarbans Coastline to Sea Level Rise and Decreased Sediment Flow: A Remote Sensing Assessment. Remote Sens. Environ. 2011, 115, 3121–3128. [Google Scholar] [CrossRef]
  22. Giri, C.; Pengra, B.; Zhu, Z.; Singh, A.; Tieszen, L.L. Monitoring Mangrove Forest Dynamics of the Sundarbans in Bangladesh and India Using Multi-Temporal Satellite Data from 1973 to 2000. Estuar. Coast. Shelf Sci. 2007, 73, 91–100. [Google Scholar] [CrossRef]
  23. Sampath, V. India: National Report on the Status and Development Potential of the Coastal and Marine Environment of the East Coast of India and Its Living Resources. GEF/FAO Bay of Bengal Large Marine Ecosystem Programme. Open J. Ecol. 2003, 3, 296. [Google Scholar]
  24. Sippo, J.Z.; Sanders, C.J.; Santos, I.R.; Jeffrey, L.C.; Call, M.; Harada, Y.; Maguire, K.; Brown, D.; Conrad, S.R.; Maher, D.T. Coastal Carbon Cycle Changes Following Mangrove Loss. Limnol. Oceanogr. 2020, 65, 2642–2656. [Google Scholar] [CrossRef]
  25. Payo, A.; Mukhopadhyay, A.; Hazra, S.; Ghosh, T.; Ghosh, S.; Brown, S.; Nicholls, R.J.; Bricheno, L.; Wolf, J.; Kay, S.; et al. Projected Changes in Area of the Sundarban Mangrove Forest in Bangladesh Due to SLR by 2100. Clim. Change 2016, 139, 279–291. [Google Scholar] [CrossRef] [PubMed] [Green Version]
  26. Iftekhar, M.; Saenger, P. Vegetation Dynamics in the Bangladesh Sundarbans Mangroves: A Review of Forest Inventories. Wetl. Ecol. Manag. 2008, 16, 291–312. [Google Scholar] [CrossRef]
  27. Mandal, M.S.H.; Kamruzzaman, M.; Hosaka, T. Elucidating the Phenology of the Sundarbans Mangrove Forest Using 18-Year Time Series of MODIS Vegetation Indices. Tropics 2020, 29, 41–55. [Google Scholar] [CrossRef]
  28. Mandal, M.S.H. Remote Sensing of Mangrove Forest Dynamics in the Sundarbans. Ph.D. Thesis, Hiroshima University, Hiroshima, Japan, 2020. [Google Scholar]
  29. UIA World Countries Boundaries. ArcGIS Hub. Available online: https://hub.arcgis.com/datasets/UIA::uia-world-countries-boundaries/data/ (accessed on 10 June 2020).
  30. Gorelick, N.; Hancher, M.; Dixon, M.; Ilyushchenko, S.; Thau, D.; Moore, R. Google Earth Engine: Planetary-Scale Geospatial Analysis for Everyone. Remote Sens. Environ. 2017, 202, 18–27. [Google Scholar] [CrossRef]
  31. Hladik, C.; Alber, M. Classification of Salt Marsh Vegetation Using Edaphic and Remote Sensing-Derived Variables. Estuar. Coast. Shelf Sci. 2014, 141, 47–57. [Google Scholar] [CrossRef]
  32. Chambers, J.Q.; Fisher, J.I.; Zeng, H.; Chapman, E.L.; Baker, D.B.; Hurtt, G.C. Hurricane Katrina’s Carbon Footprint on US Gulf Coast Forests. Science 2007, 318, 1107. [Google Scholar] [CrossRef] [PubMed] [Green Version]
  33. Feng, Y.; Negrón-Juárez, R.I.; Chambers, J.Q. Remote Sensing and Statistical Analysis of the Effects of Hurricane María on the Forests of Puerto Rico. Remote Sens. Environ. 2020, 247, 111940. [Google Scholar] [CrossRef]
  34. Berlanga-Robles, C.A.; Ruiz-Luna, A. Assessing Seasonal and Long-Term Mangrove Canopy Variations in Sinaloa, Northwest Mexico, Based on Time Series of Enhanced Vegetation Index (EVI) Data. Wetl. Ecol. Manag. 2020, 28, 229–249. [Google Scholar] [CrossRef]
  35. Carlson, T.N.; Ripley, D.A. On the Relation between NDVI, Fractional Vegetation Cover, and Leaf Area Index. Remote Sens. Environ. 1997, 62, 241–252. [Google Scholar] [CrossRef]
  36. Zhang, K.; Thapa, B.; Ross, M.; Gann, D. Remote Sensing of Seasonal Changes and Disturbances in Mangrove Forest: A Case Study from South Florida. Ecosphere 2016, 7, e01366. [Google Scholar] [CrossRef] [Green Version]
  37. Taillie, P.J.; Roman-Cuesta, R.; Lagomasino, D.; Cifuentes-Jara, M.; Fatoyinbo, T.; Ott, L.E.; Poulter, B. Widespread Mangrove Damage Resulting from the 2017 Atlantic Mega Hurricane Season. Environ. Res. Lett. 2020, 15, 064010. [Google Scholar] [CrossRef]
  38. Charrua, A.B.; Padmanaban, R.; Cabral, P.; Bandeira, S.; Romeiras, M.M. Impacts of the Tropical Cyclone Idai in Mozambique: A Multi-Temporal Landsat Satellite Imagery Analysis. Remote Sens. 2021, 13, 201. [Google Scholar] [CrossRef]
  39. R Core Team. R: A Language and Environment for Statistical Computing; R Foundation for Statistical Computing: Vienna, Austria, 2022; Available online: https://cran.r-project.org/ (accessed on 18 January 2022).
  40. QGIS.org. QGIS Geographic Information System. 2020. Available online: https://www.qgis.org/en/site/ (accessed on 18 January 2022).
  41. Kamimura, Y.; Shoji, J. Does Macroalgal Vegetation Cover Influence Post-Settlement Survival and Recruitment Potential of Juvenile Black Rockfish Sebastes Cheni? Estuar. Coast. Shelf Sci. 2013, 129, 86–93. [Google Scholar] [CrossRef]
  42. Sharma, S.; Hoque, A.R.; Analuddin, K.; Hagihara, A. Litterfall Dynamics in an Overcrowded Mangrove Kandelia Obovata (S., L.) Yong Stand over Five Years. Estuar. Coast. Shelf Sci. 2012, 98, 31–41. [Google Scholar] [CrossRef]
  43. Villamayor, B.M.R.; Rollon, R.N.; Samson, M.S.; Albano, G.M.G.; Primavera, J.H. Impact of Haiyan on Philippine Mangroves: Implications to the Fate of the Widespread Monospecific Rhizophora Plantations against Strong Typhoons. Ocean. Coast. Manag. 2016, 132, 1–14. [Google Scholar] [CrossRef]
  44. Aung, T.T.; Mochida, Y.; Than, M.M. Prediction of Recovery Pathways of Cyclone-Disturbed Mangroves in the Mega Delta of Myanmar. For. Ecol. Manag. 2013, 293, 103–113. [Google Scholar] [CrossRef]
  45. Pannet, R.; Miller, M.E.; Vinall, F. Tonga Races to Prevent a ‘Tsunami of Covid’ as Rescue Efforts Begin after Underwater Volcano Disaster. Washington Post, 18 January 2022. [Google Scholar]
  46. Walton, M.E.; Samonte-Tan, G.P.; Primavera, J.H.; Edwards-Jones, G.; Le Vay, L. Are Mangroves Worth Replanting? The Direct Economic Benefits of a Community-Based Reforestation Project. Environ. Conserv. 2006, 33, 335–343. [Google Scholar] [CrossRef]
Figure 1. Number of tropical cyclones observed since 1982 over the northern Indian Ocean. The Sundarbans area is represented by thick black inset box. Best track data of tropical cyclones were obtained from India Meteorological Department [12]. Base map: UIA World Countries Boundaries [29].
Sustainability 14 05130 g001
Figure 2. Tracks of selected cyclones since 2016. Best track data of tropical cyclones were obtained from India Meteorological Department [12]. Base map: UIA World Countries Boundaries [29].
Sustainability 14 05130 g002
Figure 3. Impacts of the Super Cyclone Amphan on Sundarbans mangrove areas of India, depicting: (a) Defoliation of mangroves near the shore (representative of wide areas), (b) Coastline mangrove canopy turned to reddish brown (representative of wide areas), as well as examples of (c) a broken mangrove stem with resultant canopy gap and coarse woody debris and (d) an uprooted tree of Avicennia marina under muddy conditions.
Sustainability 14 05130 g003
Figure 4. (a) Distribution of NDVI loss across the Sundarbans from Super Cyclone Amphan in 2020 at the entire scale of the Sundarbans, and (b) an example of a detailed map depicting local distribution of NDVI loss (approximately, 21°35′8.78″ N; 88°31′39.71″ E, south of Kalas forest, South 24 Parganas, West Bengal, India).
Sustainability 14 05130 g004
Figure 5. Impacts of Super Cyclone Amphan on the Sundarbans mangrove forest vegetation. Top panel illustrates the classified map of Sundarbans area in 2019. Bottom panel illustrates the track of Super Cyclone Amphan in May 2020 [12], and the distributions of unchanged vegetation (green color). Lost (pink color) and gained (dark blue) areas from Amphan are based on NDVI.
Sustainability 14 05130 g005
Table 1. Major tropical cyclones that impacted the Sundarbans since the year 1988 from Mandal and Hosaka [2] in comparison to the present study (Mora, Titli, Fani, Amphan). The Saffir–Simpson Hurricane Wind Scale (SSHWS) was used for categorization of cyclone intensity (category), minimum distance (km; distance) of cyclone eye track from center (i.e., a centroid point: 21°56′21.31″ N, 89°10′56.01″ E), and maximum sustained wind speed (km h−1; wind speed).
CodeNameDateCategoryDistance
(km)
Wind Speed
(km h−1)
Detected Area km2
(% of Damage)
C8804B28–29 November 1988H3242041093 (20.4)
C89Unnamed23–26 May 1989TS20010225 (0.5)
C90BOB 09/04B17–19 December 1990TS2108324(0.5)
C91Gorky29–30 April 1991H4160241432 (8.1)
C92Unnamed22–24 September 1992TD335693 (1.7)
C94Unnamed2 May 1994H3328204418 (7.8)
C95Unnamed24–25 November 1995H2255157659 (12.3)
C96Unnamed28 October 1996TD347461 (1.1)
C97Unnamed18–19 May 1997H1243120281 (5.3)
C98Unnamed18–20 May 1998H1210130166 (3.1)
C99Unnamed8–11 June 1999TS12365336 (6.3)
C00Unnamed27–28 October 2000TS526578 (1.5)
C02Unnamed12 November 2002TS9410229 (0.6)
C04Unnamed15–18 May 2004H1303120300 (5.6)
C05Unnamed1–3 October 2005TS11574279 (5.2)
C06Unnamed30 June–5 July 2007TS16065441 (8.2)
C07Sidr15–16 November 2007H5592591291 (24.1)
C08Rashmi25–26 October 2008TS5983258 (4.8)
C09Aila25–26 May 2009H212212053 (1)
C15Komen26 June–2 August 2015TS11646137 (2.6)
C16Roanu20–21 May 2016TS106116152 (2.9)
C17Mora28–30 May 2017TS28111117.9 (0.3)
C18Titli8–12 October 2018H11014831.2 (0.5)
C19Fani26 April–4 May 2019H414621366 (1.1)
C20Amphan16–21 May 2020H481241550.1 (11.5)
TD tropical depression TS tropical storm, H1–H5 Category 1–5 cyclone based on SSHWS.
Table 2. Results of supervised classification and accuracy assessment.
NoClassArea (km2)Producer’s AccuracyConsumer’s Accuracy
1Vegetation6077.370.990.78
2Water3855.140.880.96
3Mudflat624.160.710.83
4Bare soil117.800.540.86
Total area10,674.47
Overall accuracy 0.86%
Kappa coefficient 0.79
Table 3. Results of the general additive model (GAM) analysis for the relationship of altered NDVI after Super Cyclone Amphan (NDVIalt: dimensionless) to distance from trajectory of Amphan (Track: m), distance from water edge (Water: m) and NDVI before Amphan (preNDVI: dimensionless). R2 was 0.16. The smoothing term based on a thin-plate spline function of latitude (X in m) and longitude (Y in m) was treated as a random effect (d.f. = 29, GCV = 0.004724, p < 0.001).
CoefficientsMean(95% CI)p
Intercept−9.82 × 10⁻²(−9.87 × 10⁻² to −9.76 × 10⁻²)<0.001
Track7.40 × 10−3(7.37 × 10⁻² to 7.43 × 10⁻³)<0.001
Water7.02 × 10−5(3.93 × 10⁻⁵ to 10.10 × 10⁻⁵)<0.01
preNDVI1.91 × 10−1(0.19 to 0.20)<0.001
Publisher’s Note: MDPI stays neutral with regard to jurisdictional claims in published maps and institutional affiliations.

