Article

An Estimation of the Anthropogenic Heat Emissions in Darwin City Using Urban Microclimate Simulations

by
Shehani Rajapaksha
1,
Raphael Chukwuka Nnachi
2,
Muhammad Atiq Ur Rehman Tariq
3,4,
Anne W. M. Ng
1,
Malik Muneeb Abid
5,
Paras Sidiqui
6,
Muhammad Farooq Rais
7,
Erum Aamir
8,
Luis Herrera Diaz
1,
Saeed Kimiaei
9 and
Hooman Mehdizadeh-Rad
1,*
1
College of Engineering, Information Technology and Environment, Charles Darwin University, Ellengowan Drive, Brinkin, NT 0810, Australia
2
Faculty of Biological Sciences, Alex Ekwueme Federal University Ndufu Alike Ikwo, Abakaliki P.M.B. 1010, Nigeria
3
College of Engineering and Science, Victoria University, Melbourne, VIC 8001, Australia
4
Institute for Sustainable Industries & Liveable Cities, Victoria University, Melbourne, VIC 8001, Australia
5
Department of Civil Engineering, College of Engineering and Technology, University of Sargodha, Sargodha 40100, Pakistan
6
Live + Smart Research Laboratory, School of Architecture & Built Environment, Deakin University, Geelong, VIC 3220, Australia
7
Cosmos Science Corporation, 5 Sagar Road, Lahore Cantt, Lahore 54810, Pakistan
8
Institute of Environmental Sciences and Engineering SCEE, National University of Science and Technology, Islamabad 44000, Pakistan
9
School of Mechanical Engineering, Sharif University of Technology, Azadi Ave., Tehran 11365, Iran
*
Author to whom correspondence should be addressed.
Sustainability 2022, 14(9), 5218; https://doi.org/10.3390/su14095218
Submission received: 3 March 2022 / Revised: 15 April 2022 / Accepted: 21 April 2022 / Published: 26 April 2022
(This article belongs to the Special Issue Sustainable Approaches to Reduce Building Energy Consumptions)

Abstract

:
The energy consumption due to urbanization and man-made activities has resulted in production of waste, heat, and pollution in the urban environment. These have further resulted in undesirable environmental issues such as the production of excessive Anthropogenic Heat Emissions (AHE), thus leading to an increased Urban Heat Island (UHI) effect. The aim of this study was to estimate the total AHE based on the contribution of three major sources of waste heat generation in an urban environment, i.e., buildings, vehicular traffic, and human metabolism. Furthermore, a comparison of dominating anthropogenic heat factor of Darwin with that of other major international cities was carried out. Field measurements of microclimate (temperatures, humidity, solar radiation, and other factors of climate measures) were conducted along Smith Street, Darwin City. Then, surveys were conducted to collect information regarding the buildings, vehicle traffic and Human population (metabolism) in the study area. Each individual component of AHE was calculated based on a conceptual framework of the anthropogenic heat model developed within this study. The results showed that AHE from buildings is the most dominant factor influencing the total AHE in Darwin, contributing to about 87% to 95% of total AHE. This is followed by vehicular traffic (4–13%) and lastly, human metabolism (0.1–0.8%). The study also shows that Darwin gains an average of 990 Wm−2 solar power on a peak day. This study proves that building anthropogenic heat is the major dominating factor influencing the UHI in tropical urban climates.

1. Introduction

With rapidly increasing population, it has been projected that the proportion of the world’s population living in urban areas will continue to rise from 47% to 60%. According to the United Nation’s (UN) data analytics predictions [1], by 2030 one third of the global population may be living in urban cities around the world [2]. This urbanisation has resulted in unpredictable environmental conditions; altering the climate conditions [3]; changes in heat capacity [4], reflectivity [5], and surface energy model [6]; and production of excess anthropogenic heat emission [7], thus leading to an increased Urban Heat Island (UHI) [8], which is defined as a phenomenon where solar heat is absorbed and dissipates as “anthropogenic waste” to the atmosphere; which is due to non-natural or human-made activities [9].
Various previous studies [10] on UHI found that Land-Use Cover (LUC) and Anthropogenic Heat Emission (AHE) are one of the key reasons for the formation of UHI [11], with AHE contributing majorly [12]. By 2030, the contribution of AHE to UHI will be increasing with a percentage of 30 to 50 [13]. According to the global study results on AHE by [14], the AHE has not been considered by many global climate models yet and it is having an increasing effect on the global annual mean temperature by around 0.02 K as well as the land surface temperature by around 0.05 K [15]. Additionally, more studies have identified that AHE is largely dependent on the energy usage, building coverage, and meteorologic conditions of a city [16].
A global study on AHE for 29 largest cities around the world identified that the heat emission from Commercial, Residential and Transport (CRT) sectors contributed about 40% to 95% of heat emissions [17] while heating due to population density varies from about 2% to 60% [18]. For instance, in 2017, Beijing city had reached about 1.11 × 10¹⁸ J AHE per year with a mean intensity of Anthropogenic Heat Flux (AHF) varying between 77 Wm−2 to 135 Wm−2 throughout the year in different seasons [19]. Meanwhile the AHF in Downtown, Los Angeles was found to be around 100 Wm−2 in 2017 [20]. An AHE study in China [21] identified that the total AHE is a sum of 45% heat generation from buildings, 5% from human Metabolism, 30% from vehicle traffic and 20% from different industries [22]. Furthermore, Chinese metropolitan cities produce an AHF ranging from 20 Wm−2 to 100 Wm−2 [21].
Australia, a country with a high-income economy, retains the highest rank in urban population ratings [23]. It consists of various climate zones, so different locations around the country require different heating and cooling conditions based on these climate zones [24]. According to the Australian Building Codes Board (ABCB), Darwin city located in the Northern Territory (NT) of Australia falls under climate zone number 1 which is “high humidity summer and warm winter” [25]. The maximum and minimum mean temperatures for Darwin throughout the year lie between 34 °C and 20 °C, respectively [26]. According to the relative humidity data, the relative humidity in the morning is considerably high and varies from around 82% to 60% while in the evening humidity varies from 70% to 40%. However, the Australian Institute of Refrigeration, Air conditioning and Heating (AIRAH) technical handbook puts the ideal humidity condition between 60% and 30% [27]. This implies that the present Darwin climatic condition does not fulfill the thermal comfort level for humans [28].
Thus, this study was aimed at estimating the AHE in Darwin, a metropolitan city located in the hot and humid tropical climate of Australia. Three approaches were employed to achieve this aim. Firstly, the calculation of the temporal variation of the total AHE values of the three major AHE contributing factors including buildings, vehicles, and human metabolism was carried out. Secondly, an analysis of the dominating anthropogenic heat factor that had a greater influence on the UHI, resulting in raised urban air temperatures was conducted. Finally, the potential impact of AHE on the urban climate of Darwin was compared with that of other major international cities.

2. Methodology

2.1. Area of Study

Figure 1 Illustrates the map of the study area. The boundary of the selected area indicated in thick black lines sums up to 76,853 m2 of area. Furthermore, the study area included 33 buildings shown on both sides of the Smith Street Road totalling approximately 550 m of road length. The field measurements were conducted at the following locations in Smith Street Road (the busiest road in Darwin Central Business District) [29]; Saint Mary’s Cathedral, the banks of Australia and New Zealand Banking (ANZ), the National Australia Bank (NAB) Darwin city branch, and near the Smith Street Mall. These locations were selected for the field measurements to cover the whole area including the beginning of the street, middle of the street, and end of the street. All meteorological data were obtained from the Bureau of Meteorology BOM climate data service located at the Darwin Airport (Station number 014015) [26].

2.2. Adopted Study Approach

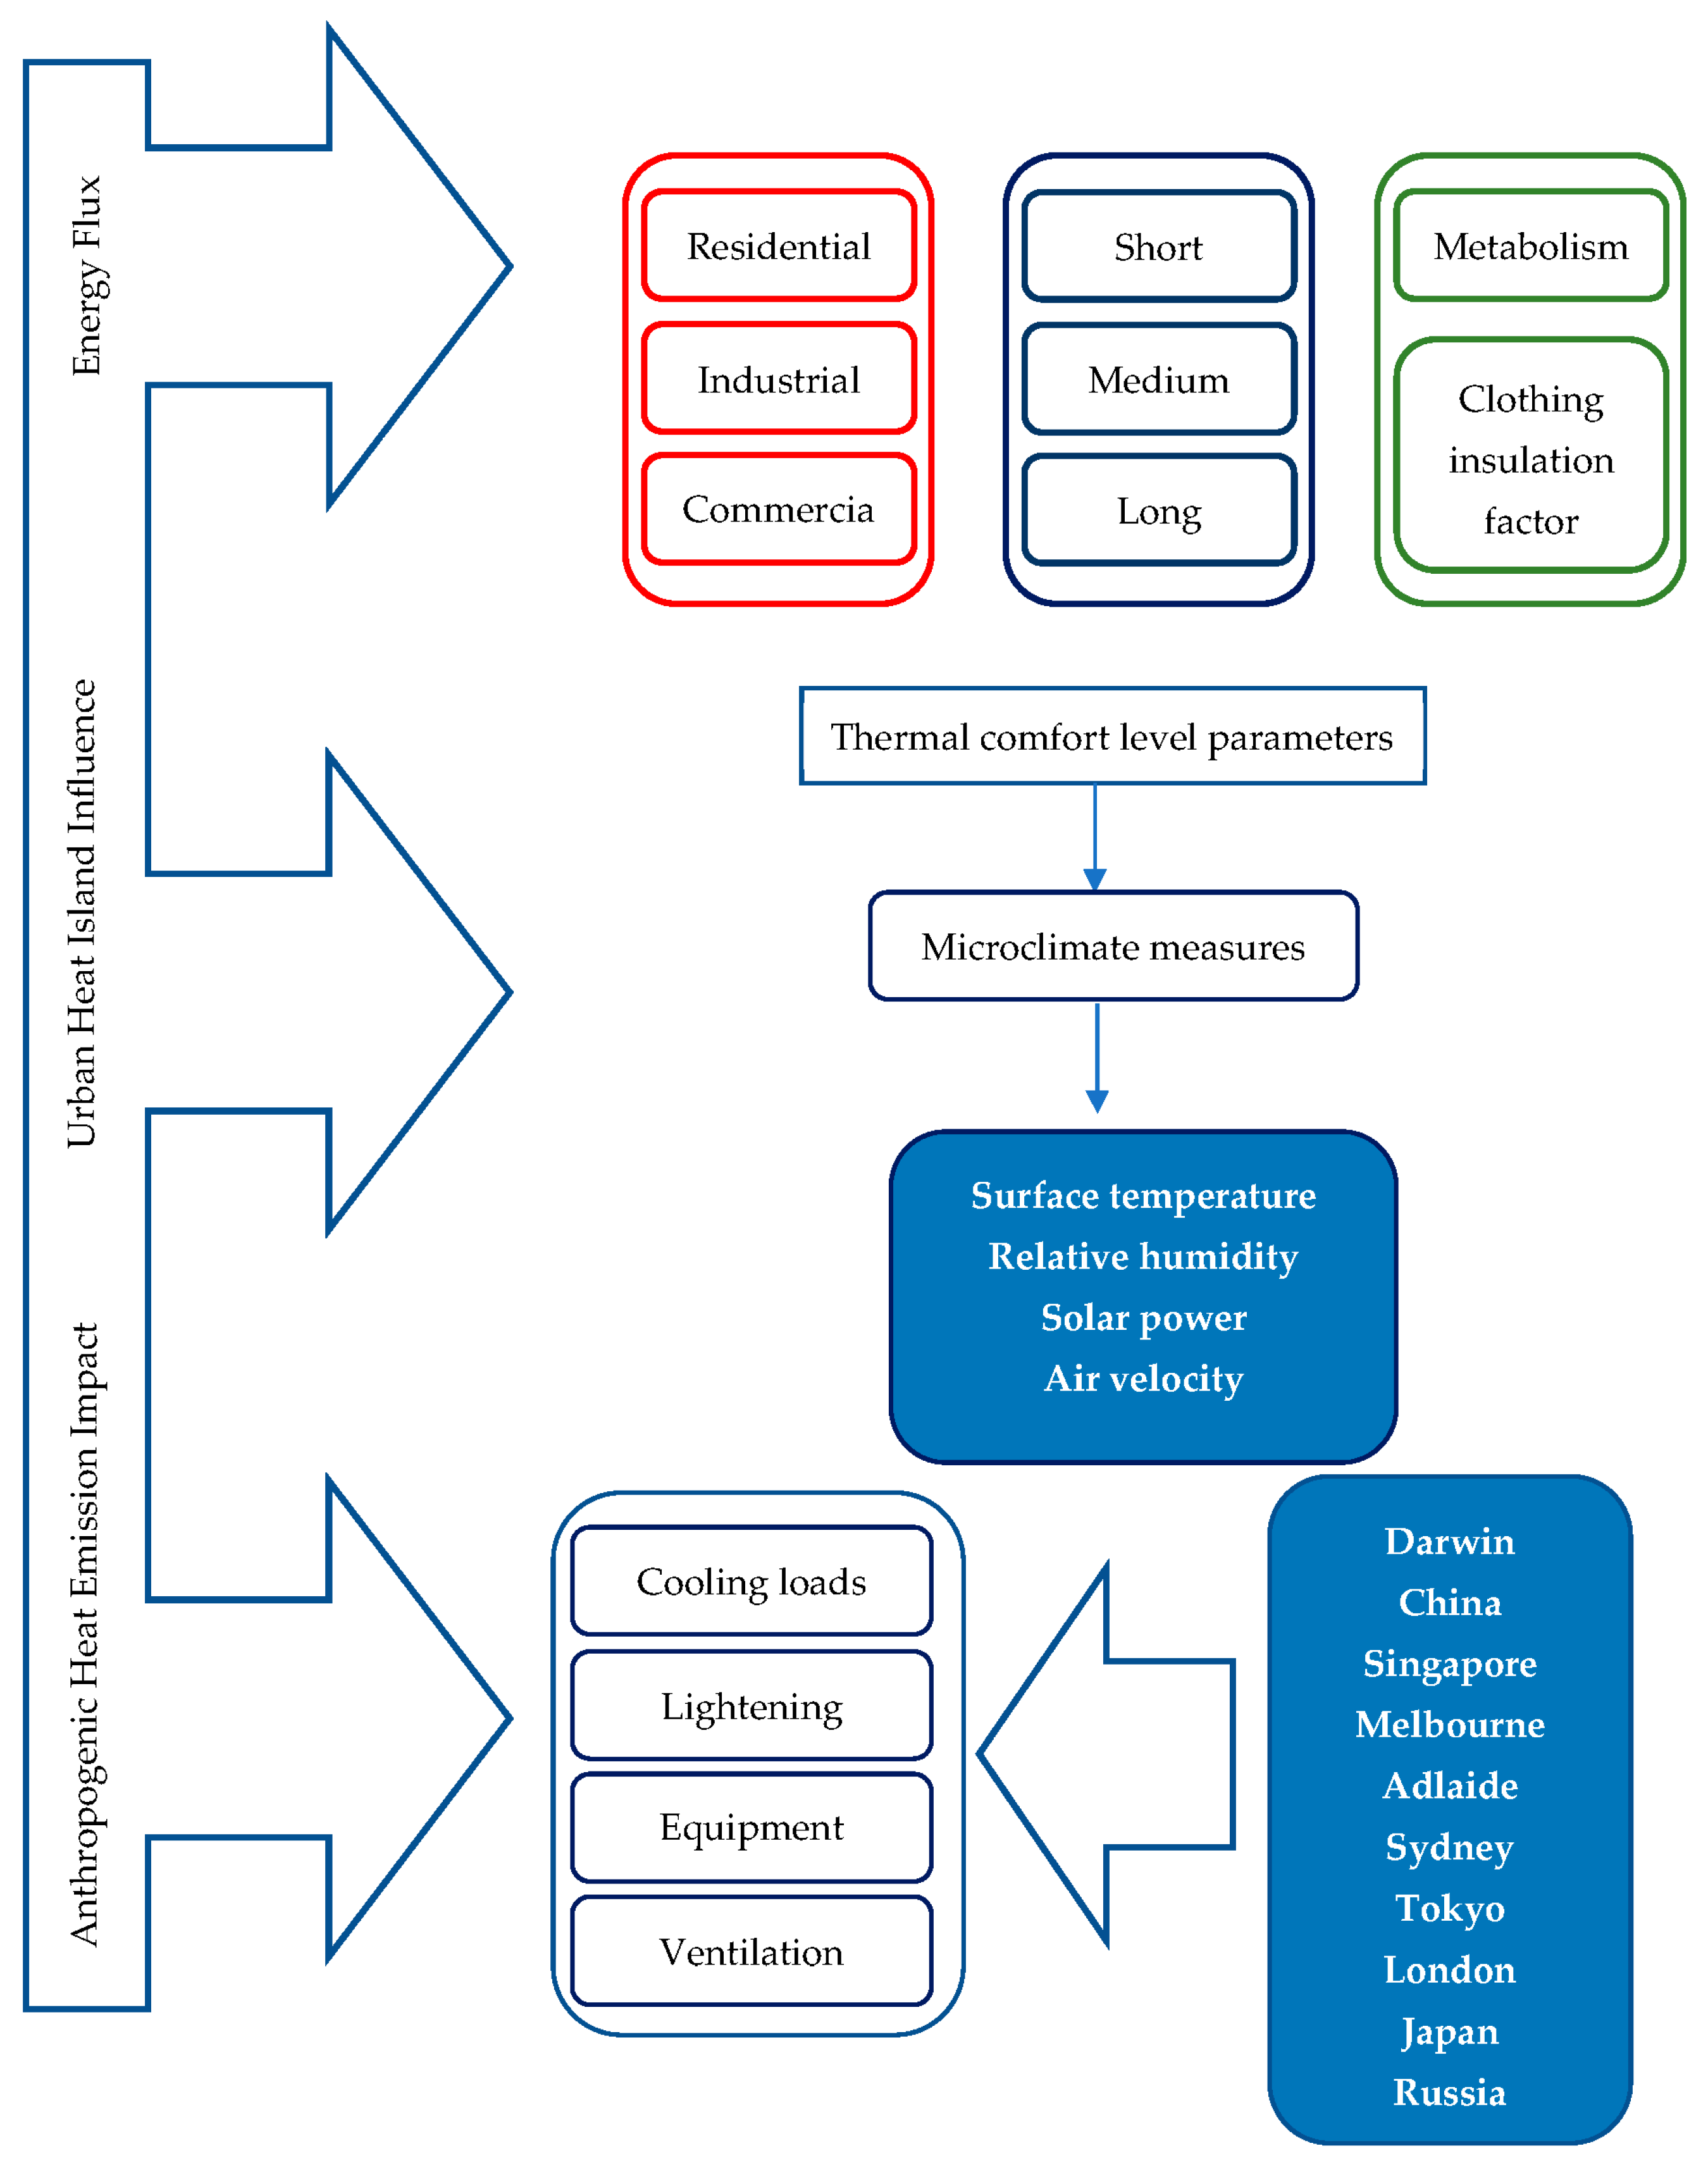
This research aimed to estimate the AHE in Darwin, Australia. A three-stage process (Figure 2) was adopted for this study. In the first stage, the temporal variation of the total AHE values of the three major AHE contributing factors (buildings, vehicles, and human metabolism) was calculated using a developed anthropogenic heat model. In the second phase, the dominating anthropogenic heat factor that had a greater influence on the UHI, resulting in raised urban air temperatures was analysed. In the final stage, the potential impact of AHE on the urban climate of Darwin was compared with that of other major international cities.

2.3. Microclimate (Temperature and Humidity Variation) Measurements

Field measurements were carried out and the following microclimate parameters were measured; surface temperature (using a Milwaukee Alkaline Laser Temperature Gun Handheld Digital Thermometer), air velocity, wet bulb temperature, and relative humidity were measured using a Kestrel 3500 DT Weather Meter, while the solar power was measured using a Lutron SPM-1116SD solar power meter. The measurements were carried out at all three measuring points in Smith Street once every 2 h between 10 am to 4 pm in August and the average value was taken to ensure accuracy. Furthermore, the surface temperature variation of the study area was visually observed and recorded using FLIR ONE Pro thermal camera during the fieldwork measurements because the measured values for road surface temperatures could be validated from thermal photos as this equipment has a sensitivity that detects temperature differences up to 70 mK.

2.4. Estimation of Anthropogenic Heat Emission Factors

The survey procedure and the inventory approach also known as the “Top-down approach” were used to estimate the number of vehicles on the road [30]. The survey was conducted for a sample period of 15 min every 2 h from 10 am to 4 pm. The size of vehicles was categorised based on ‘Austroads Vehicle Classification’ System as either short, medium, or long. Surveys were also conducted to gather building data from houses on both sides of Smith Street [31]. The data collected included the type of building, number of levels on a building (number of storeys), type of occupancy or usage, location, and any important observations of buildings [32]. Additional information about each building was gathered using Google Earth Pro (v7.3.3). Finally, the survey procedure was also used to obtain data on the human population as follows: the number of people on the road was counted for a sample period of 15 min for every 2 h from 10 am to 4 pm. The collected data were used to calculate the AHE from the human population.

2.4.1. Estimation of Anthropogenic Heat Emission from Vehicle Traffic

Estimation of vehicle traffic was carried out based on the approaches by [22,33]. Based on this, the equation (Equation (1)) for hourly AHE from vehicles due to combustion of fuel ( Q V ) was created as follows:
Heat emission from vehicle traffic
Q V = N i × d × E i , j × x j t × A × 1000
Energy used per vehicle
E i , j = H V j × ρ j × F C i
where,
Q V = AHE due to vehicles (Wm−2)
N i = total count of vehicle class i on the road
d = travel distance of the vehicle (km)
E i , j = energy used by vehicle class i using fuel type j (kJ/km)
x j = proportion of fuel type j vehicles in NT
t = sample time of the survey period (s)
A = size of the study area (m2)
H V j = heating value of fuel type j (kJ/kg)
ρ j = density of fuel type j (kg/L)
F C i = fuel consumption of the vehicle class i (L/km) [33]

2.4.2. Estimation of Anthropogenic Heat Emission from Buildings

The heat emission from buildings included all the energy consumption estimations due to industrial plants, commercial buildings and residential buildings [20], with the assumption that the total energy consumption within each building is completely exhausted to the environment as waste heat [20]. Based on this, the equation below (Equation (2)) was developed to estimate the AHE from buildings. Each building within the study area was assigned an identification number. The subscript i indicated the building identification number. L i and A i are cooling load and area of each building respectively. All the buildings in the study area were categorised based on AIRAH.
Heat emission from buildings
Q B = L i × A i A
where,
Q B = AHE due to buildings (Wm−2)
L i = cooling load of building number i (Wm−2)
A i = area of building number i (m2)
A = size of the study area (m2) [34]

2.4.3. Estimation of Anthropogenic Heat Emission from Human Population (Metabolism)

AHE from the population was calculated based on the equation below (Equation (3)). Heat dissipation rates for different human activities was obtained from AIRAH standards [35]. To estimate the AHE from human metabolism, people inside the buildings were ignored while only people who were outside the buildings (on the road) were considered because the cooling load of the buildings included the effect from building occupancy as well.
Heat emission from human metabolism
Q p = N × E A
where,
Q p   = AHE due to human metabolism (Wm−2)
N = population count
E = heat emission from a single human due to walking (W)
A = study area (m2) [35]

3. Results and Discussion

This study was aimed at understanding the climatic conditions of Darwin by estimating the AHE in Darwin, the temporal variation of the total AHE and analysis of the three major AHE contributing factors (including buildings, vehicles, and human metabolism) in Darwin. Temporal variation of total AHE and contributing factors were individually analysed and the results indicated that the largest mean hourly anthropogenic heat emission in Darwin occurs at around 2 pm and the value is around 121 Wm−2.
Results from this study showed that the building category was the dominant contributory factor to anthropogenic heat in Darwin city, making up 87% to 95% of the total AHE value. This is mainly due to the strong demands for air-conditioning by the energy-intensive buildings located in the city area, particularly hotel/apartment buildings. Only 4% to 11% of the total anthropogenic heat value was generated from vehicle traffic in the city followed by 0.1% to 0.8% from human metabolism.
The study equally investigated the dominating anthropogenic heat factor that had a greater influence on the UHI and the potential impact of AHE on the urban climate of Darwin. The findings of this study were validated by comparing the AHE values of Darwin with other international cities and it was shown that AHE plays a major role in UHI, and metropolitan tropical cities like Darwin are at risk of experiencing high AHE values in their commercial/business centres.
Although the developed conceptual framework of the present study has been efficient and more reliable in estimating AHE, but not without some limitations. For instance, the study was carried out in one area, using field measurements and surveys and this could have affected the accuracy of the analysis by adding up values and increasing the accuracy of the estimation. Additionally, the results were dependent on the heating or cooling load requirement of buildings which is determined based on climate conditions. On the other hand, the present study can be validated further by conducting a Computational Fluid Dynamics (CFD) analysis. This analysis will provide a visualisation of the air properties (temperature, pressure, and air velocity), and an estimation of the urban energy budget within Darwin city.

3.1. Microclimate (Temperature and Humidity) Variations

The microclimate (temperature and humidity) variation graph shown in Figure 3 illustrates the measured values for ambient temperature, surface temperature, wet bulb temperature, and relative humidity. According to this graph, from 12 pm to 2 pm, the ambient temperature reached the highest value of 34 °C and this represented the mean maximum temperature of Darwin city. The graph also shows that relative humidity reached the maximum of around 70% at 10 am and declined to 58% as time passed. Metrological data of Darwin also showed a similar humidity variation, particularly in August. From 10 am to 12 pm, road surface temperature increased significantly from 40 °C to around 54 °C and then fluctuated around 54 °C–55 °C throughout the rest of the period (12 pm to 4 pm). Overall, road surface temperature varied significantly more than the other microclimatic factors.
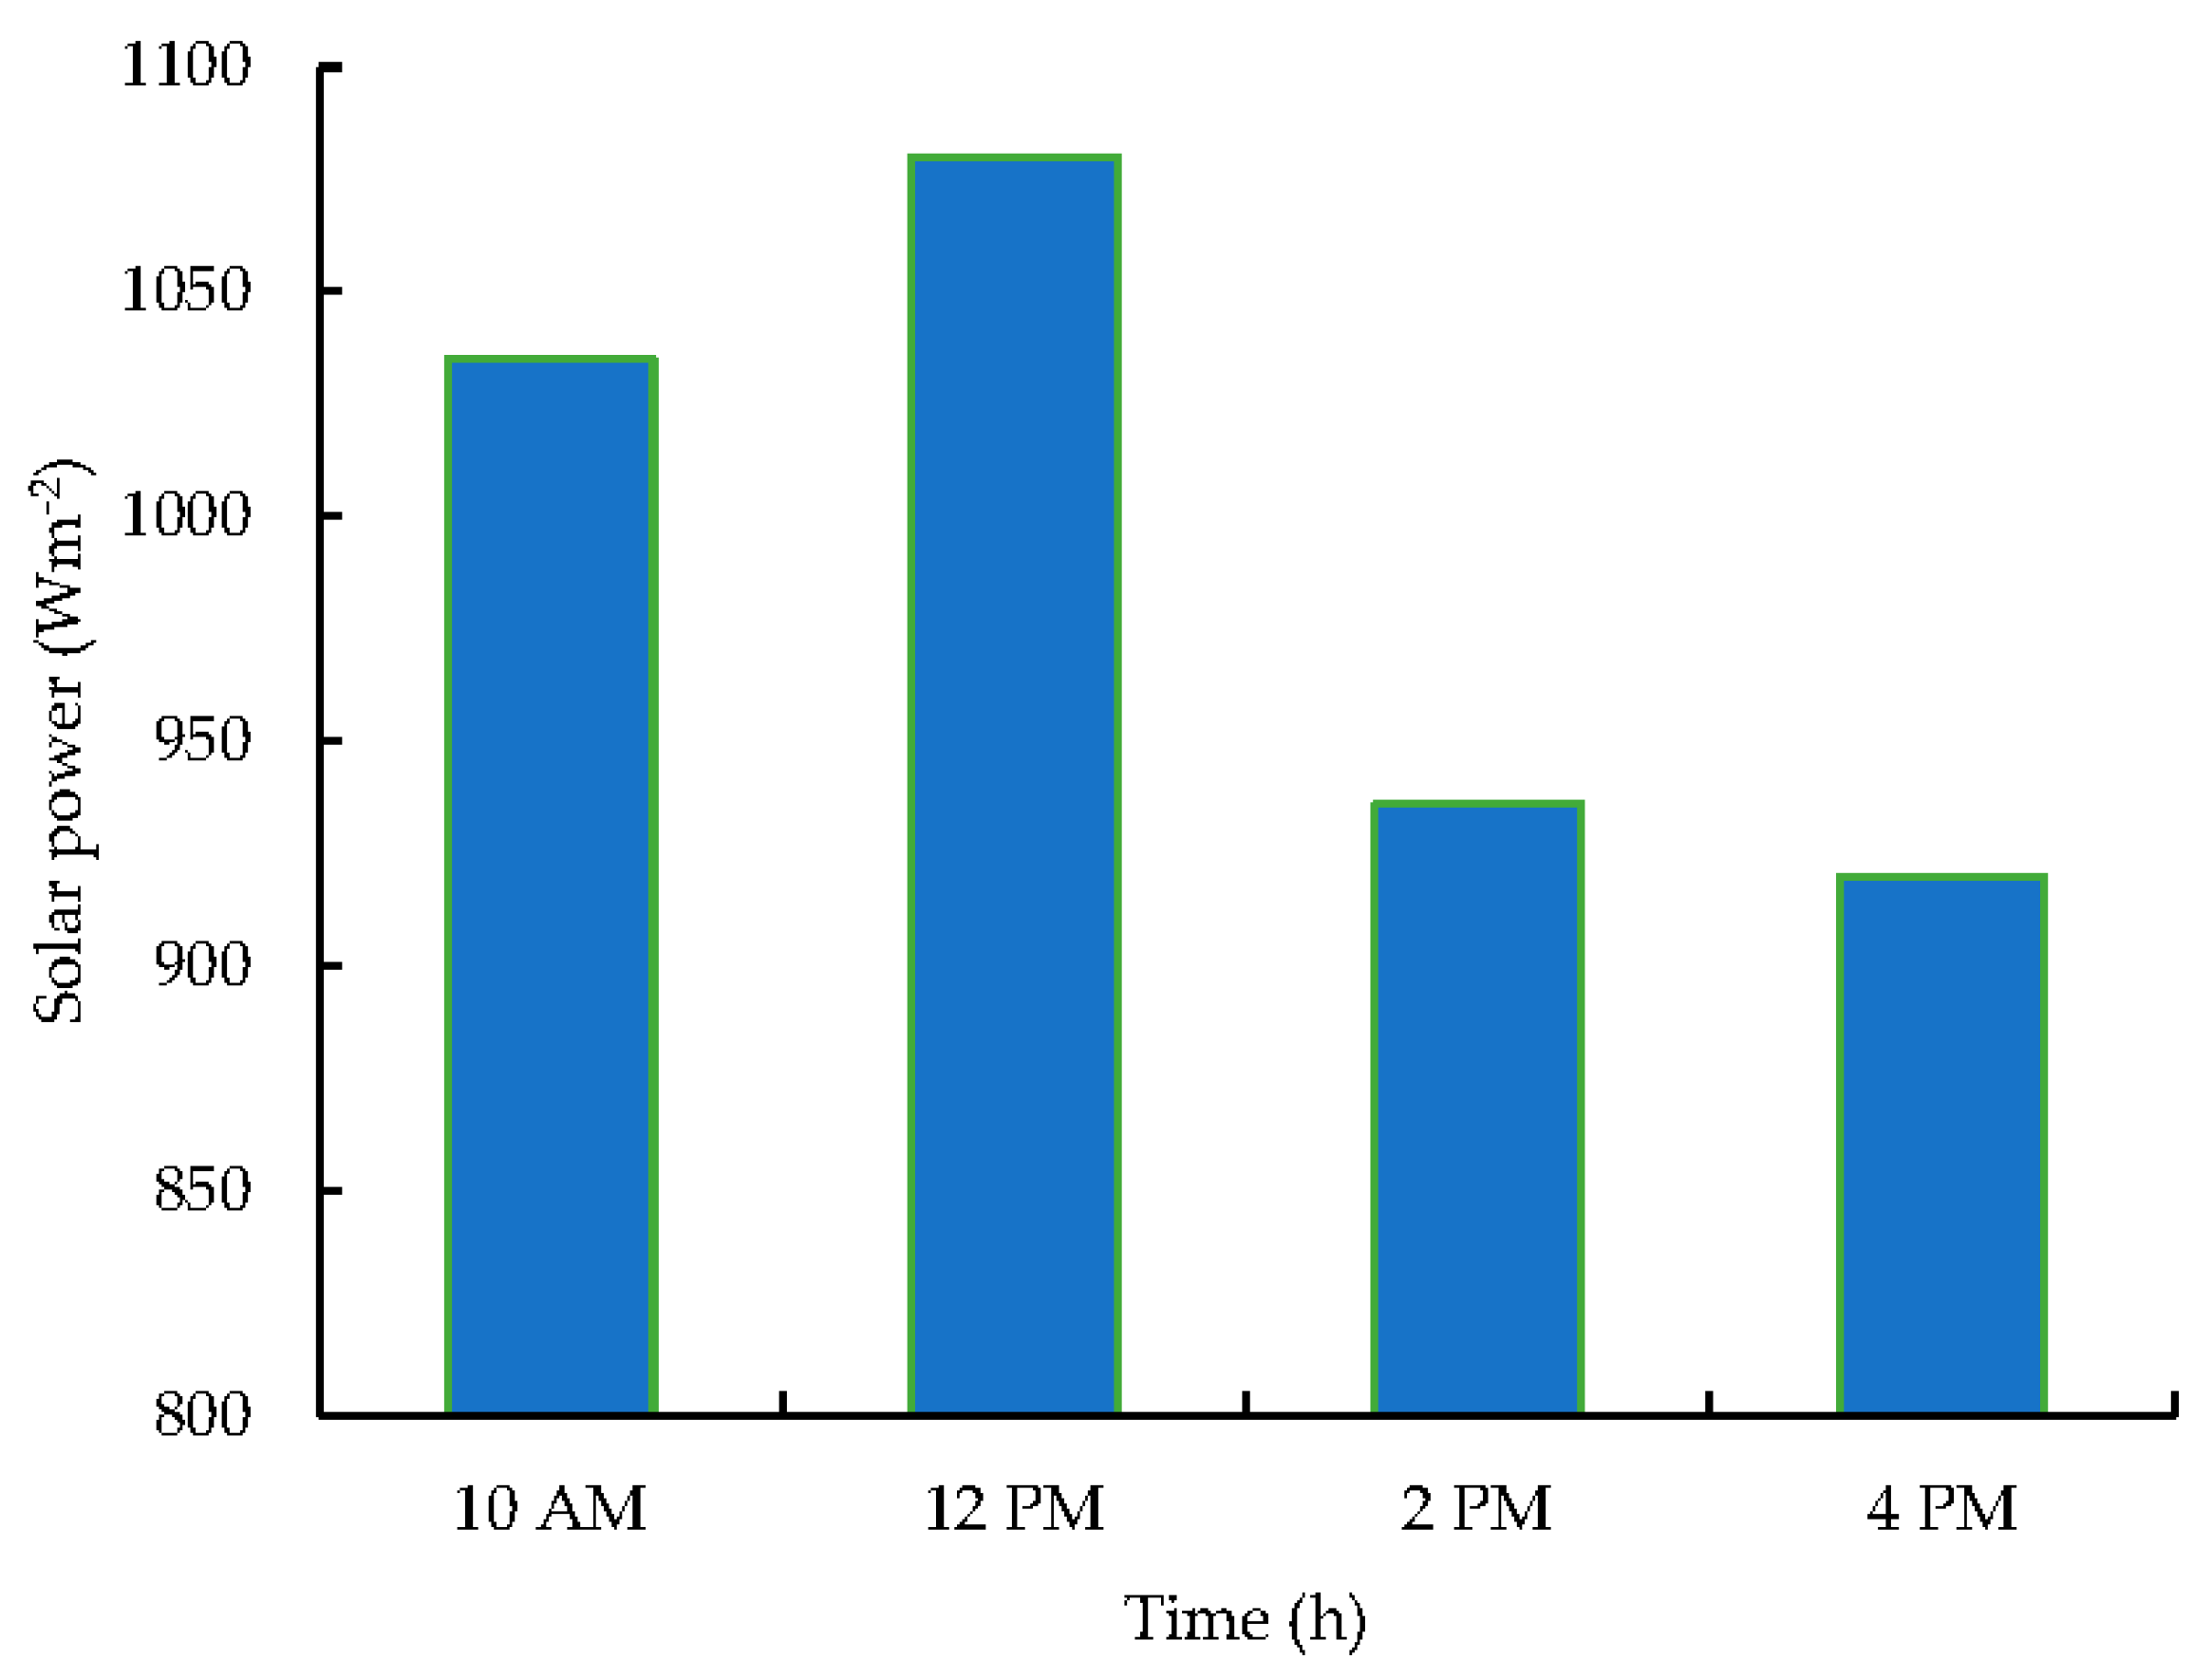
Figure 4 illustrates the solar power measurement results from 10 am to 4 pm and according to this figure, Darwin gains an average of 990 Wm−2 solar power within the peak time of a day. However, according to the Bureau of Meteorology Australian Government, the average daily sunshine hours in Darwin for August is around 9 to 11 h and the average daily solar exposure in August is around 21 to 24 MJ/m2, with an average solar power of 740 Wm−2. Thus, the obtained average solar power of 990 Wm−2 is slightly higher than published metrological data (740 Wm−2). Nevertheless, both values suggest that Darwin is rich in solar power.
For further evaluation of the microclimate variation, thermal photos of the study area were recorded using a FLIR ONE Pro thermal camara. Surface temperature variation was visually observed from thermal photographs. Figure 5 illustrates the thermal photographs of two locations in the study area taken at two different times. (A) and (B) indicates temperature variation near Saint Mary’s Cathedral church at 10 am and 4 pm, respectively. According to these figures road surfaces gained higher temperatures compared to building surfaces and ambient temperature. It should also be noted that road surface temperature drastically increased from just about 34 °C to 50 °C within the period from 10 am to 4 pm possibly because of increased intensity of solar radiation and increased activities on the road due to increased human and vehicular activities. A similar pattern was observed in the other locations of the study areas as well. (C) and (D) illustrates the area near NAB at 10 am and 4 pm, respectively. The figures indicate that road surface temperatures in this area increase from 37 °C to 51 from 10 am to 4 pm.

3.2. Anthropogenic Heat Emission Effects

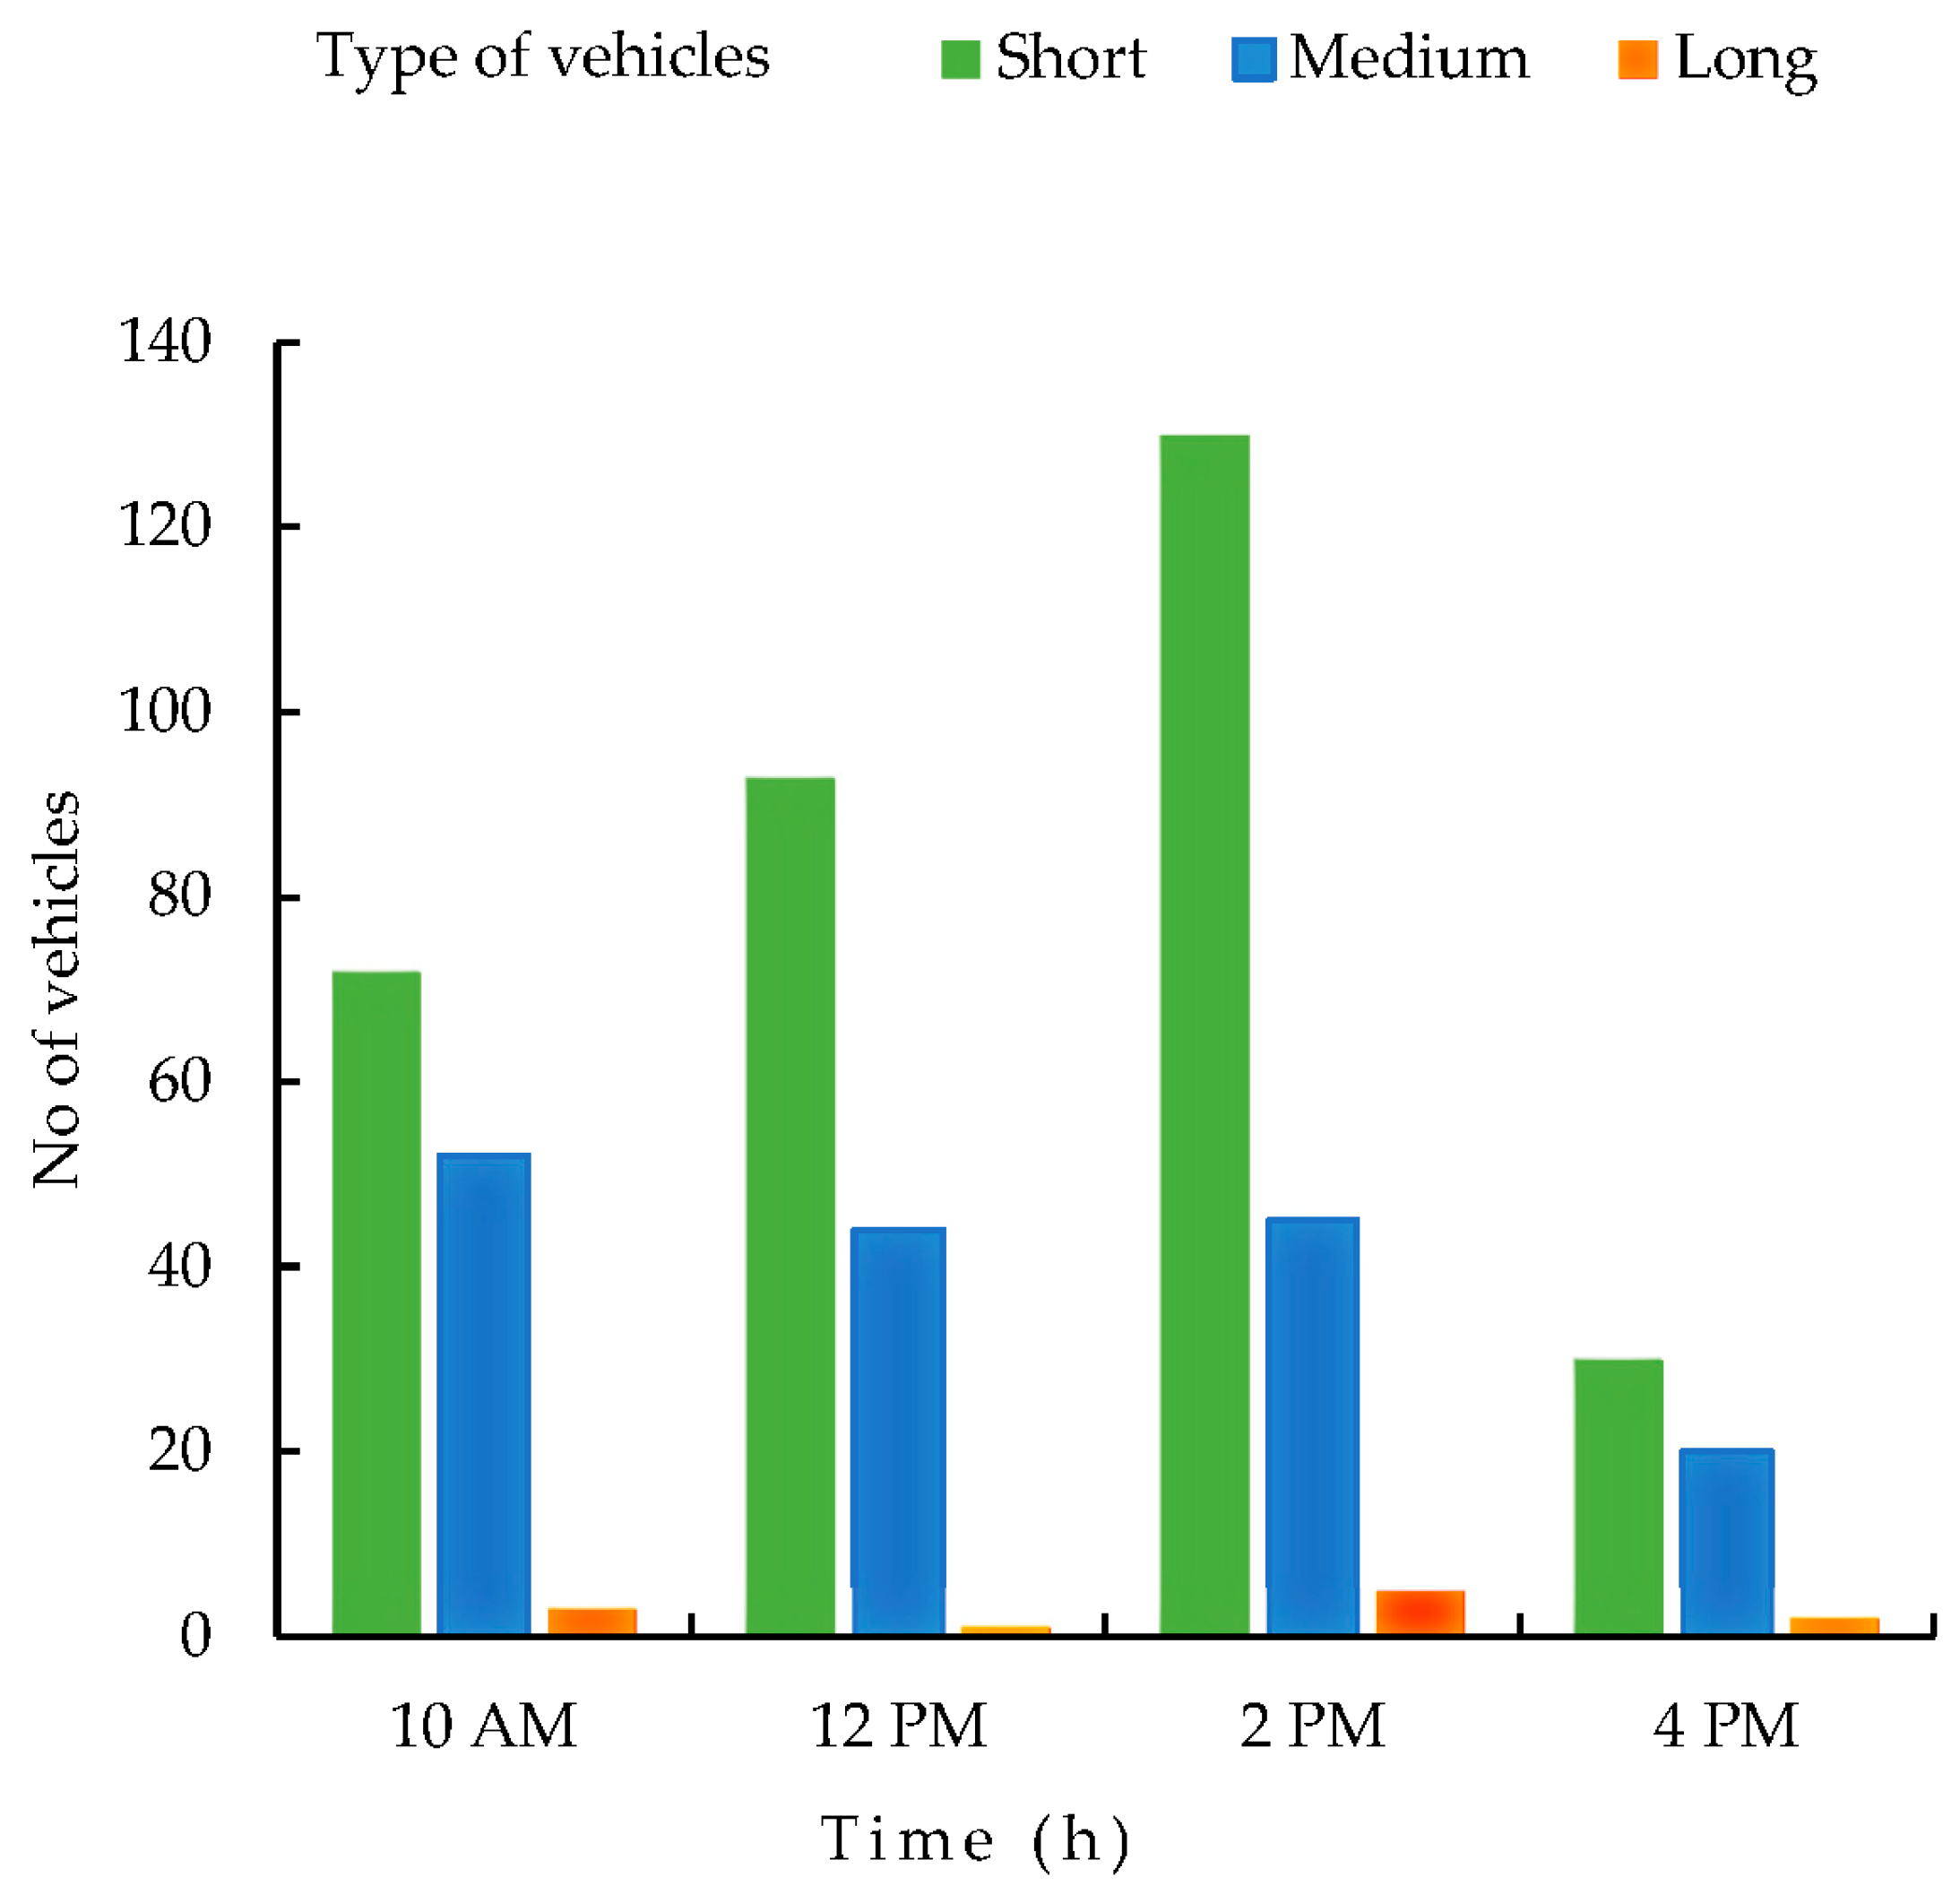
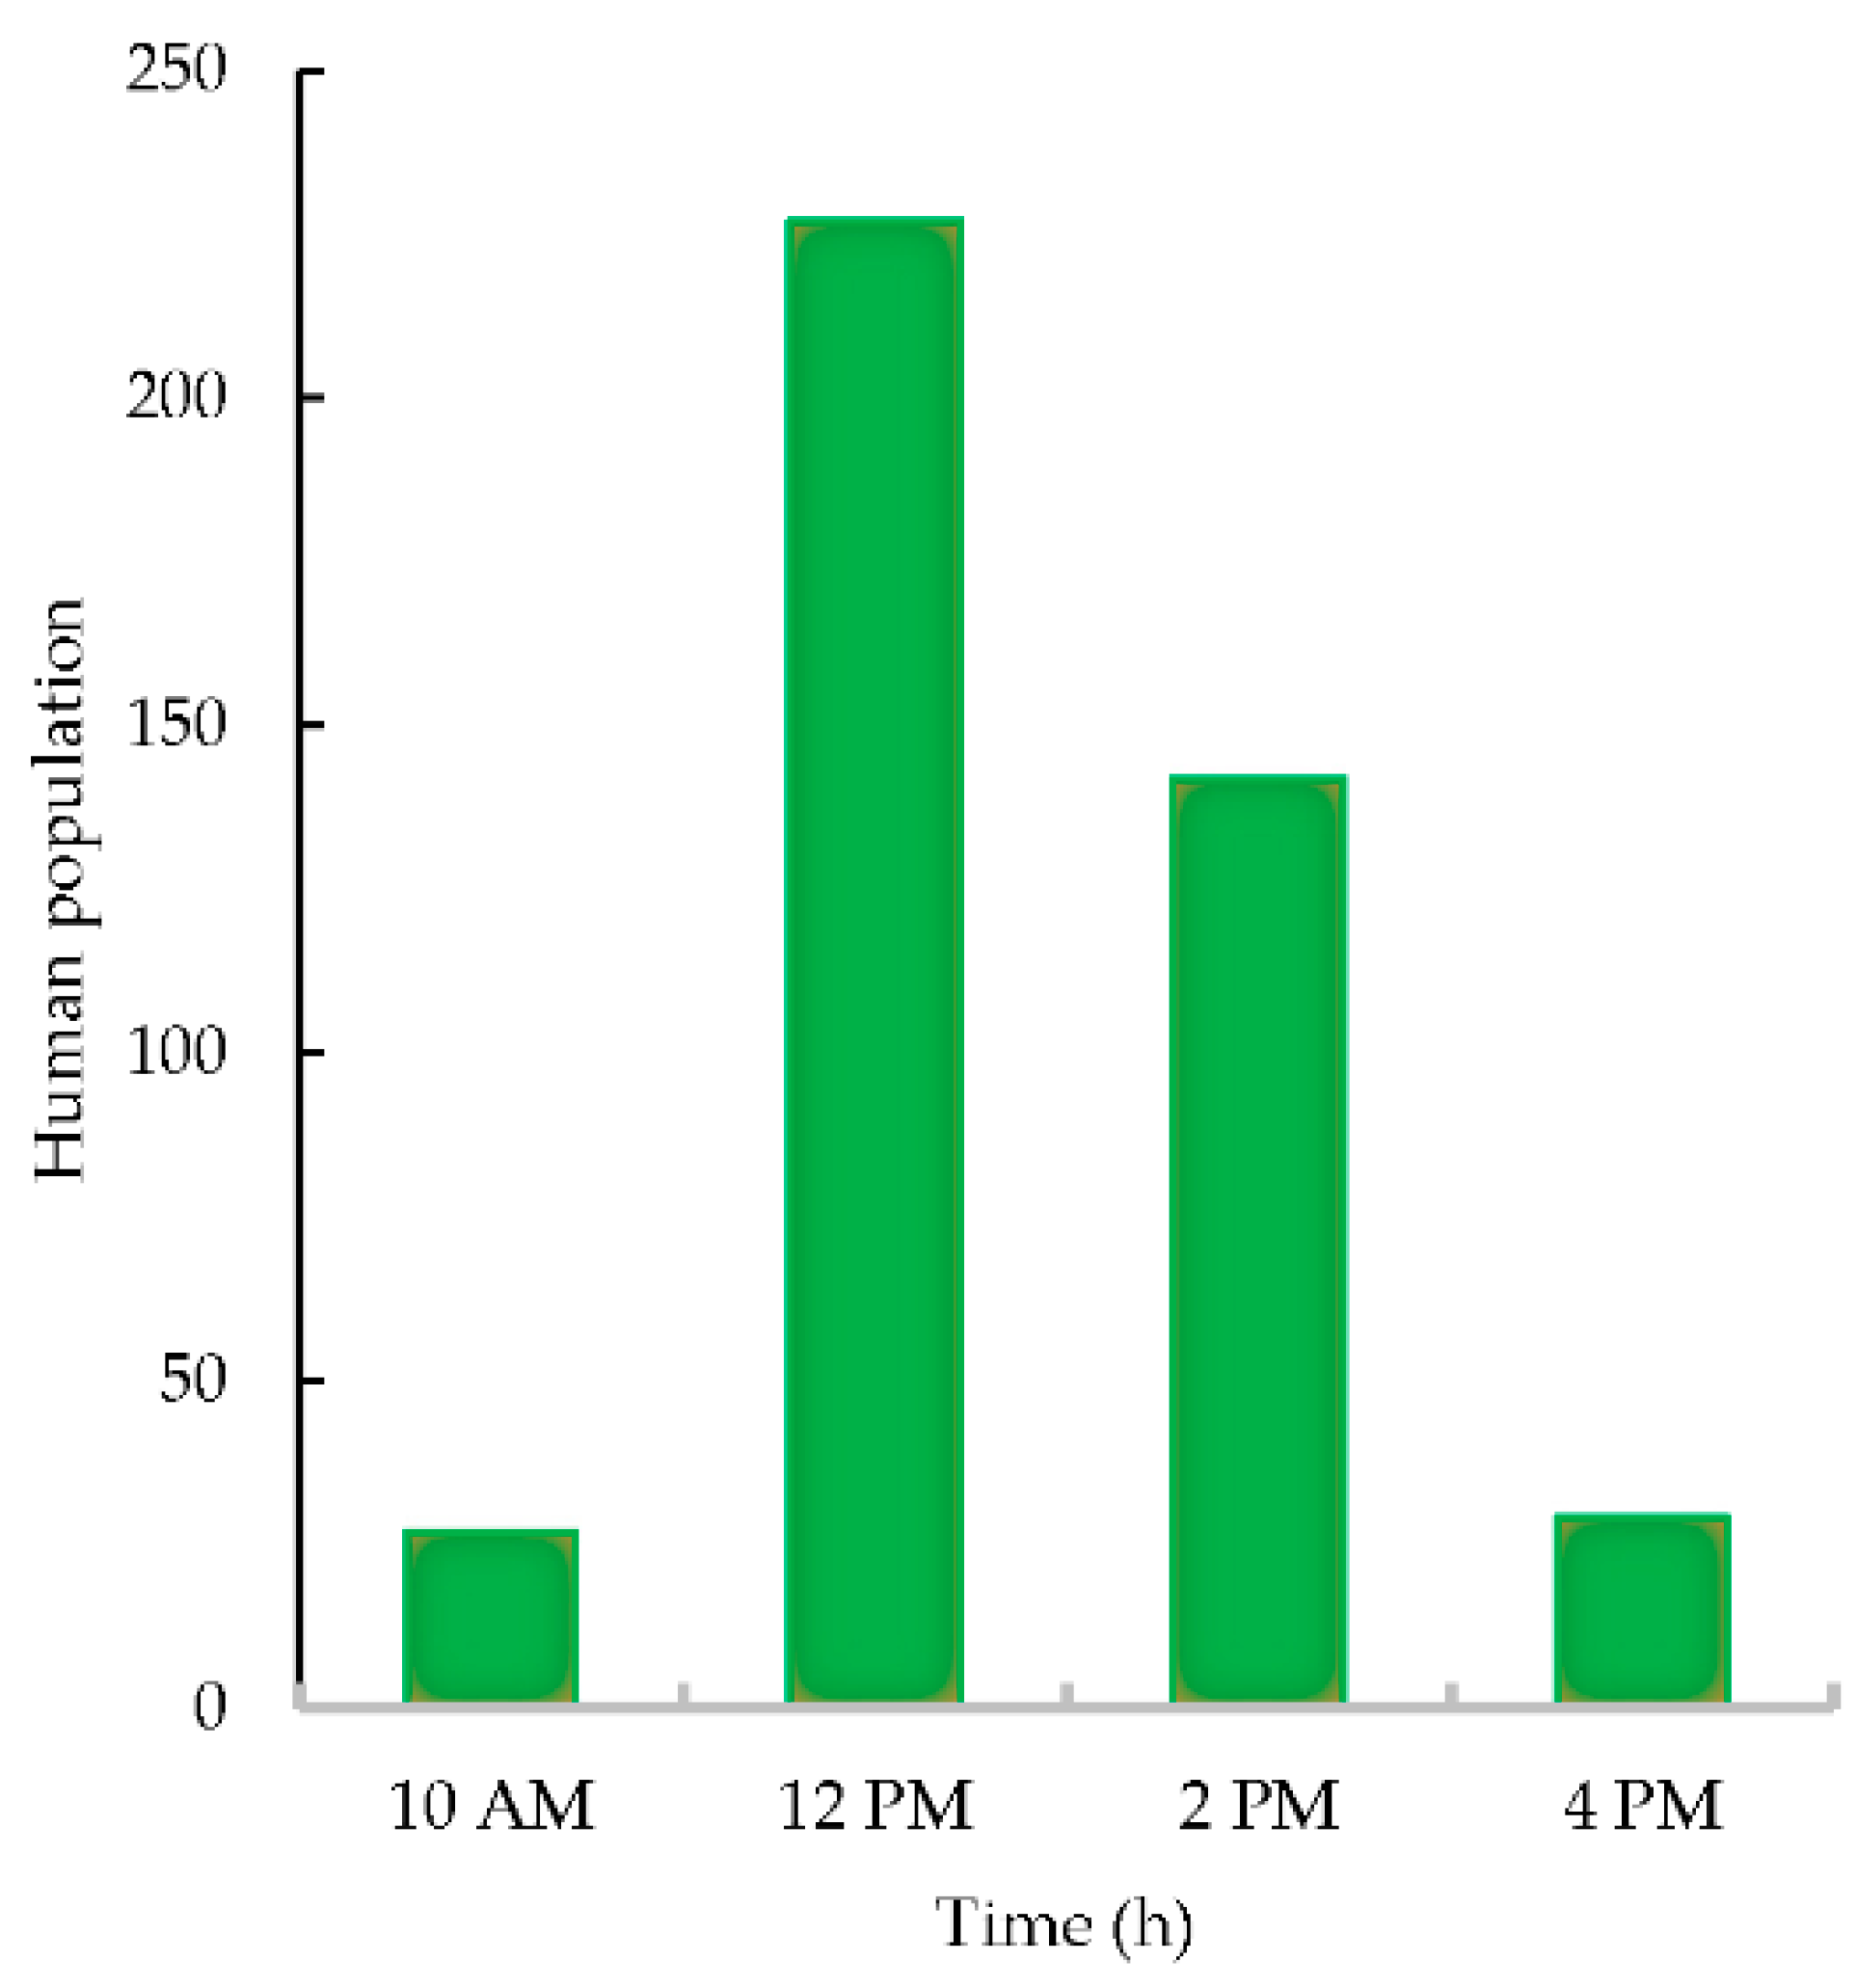
The results of the Vehicle, Human Population (metabolism) and building surveys are shown in Figure 6, Figure 7 and Figure 8, respectively. The results showed a high volume of traffic during the period from 12 PM to 2 PM and most of the vehicles on the road were small vehicles. In terms of buildings, there were 33 buildings, 77% of these buildings were low-rise buildings (1–3 story buildings) while 7% were mid-rise (5–6 story), and 16% (7–10 story) were high rise buildings. On the other hand, the human population (metabolism) survey results showed little activity by 10 AM, which peaked by 12 PM before gradually declining from 2 PM and ultimately reducing significantly by 4 PM. Thus, between the period from 12 PM to 2 PM, the population density reached the highest value.

3.3. Temporal Variation of Anthropogenic Heat Emission and Its Influence on Urban Heat Island Effects

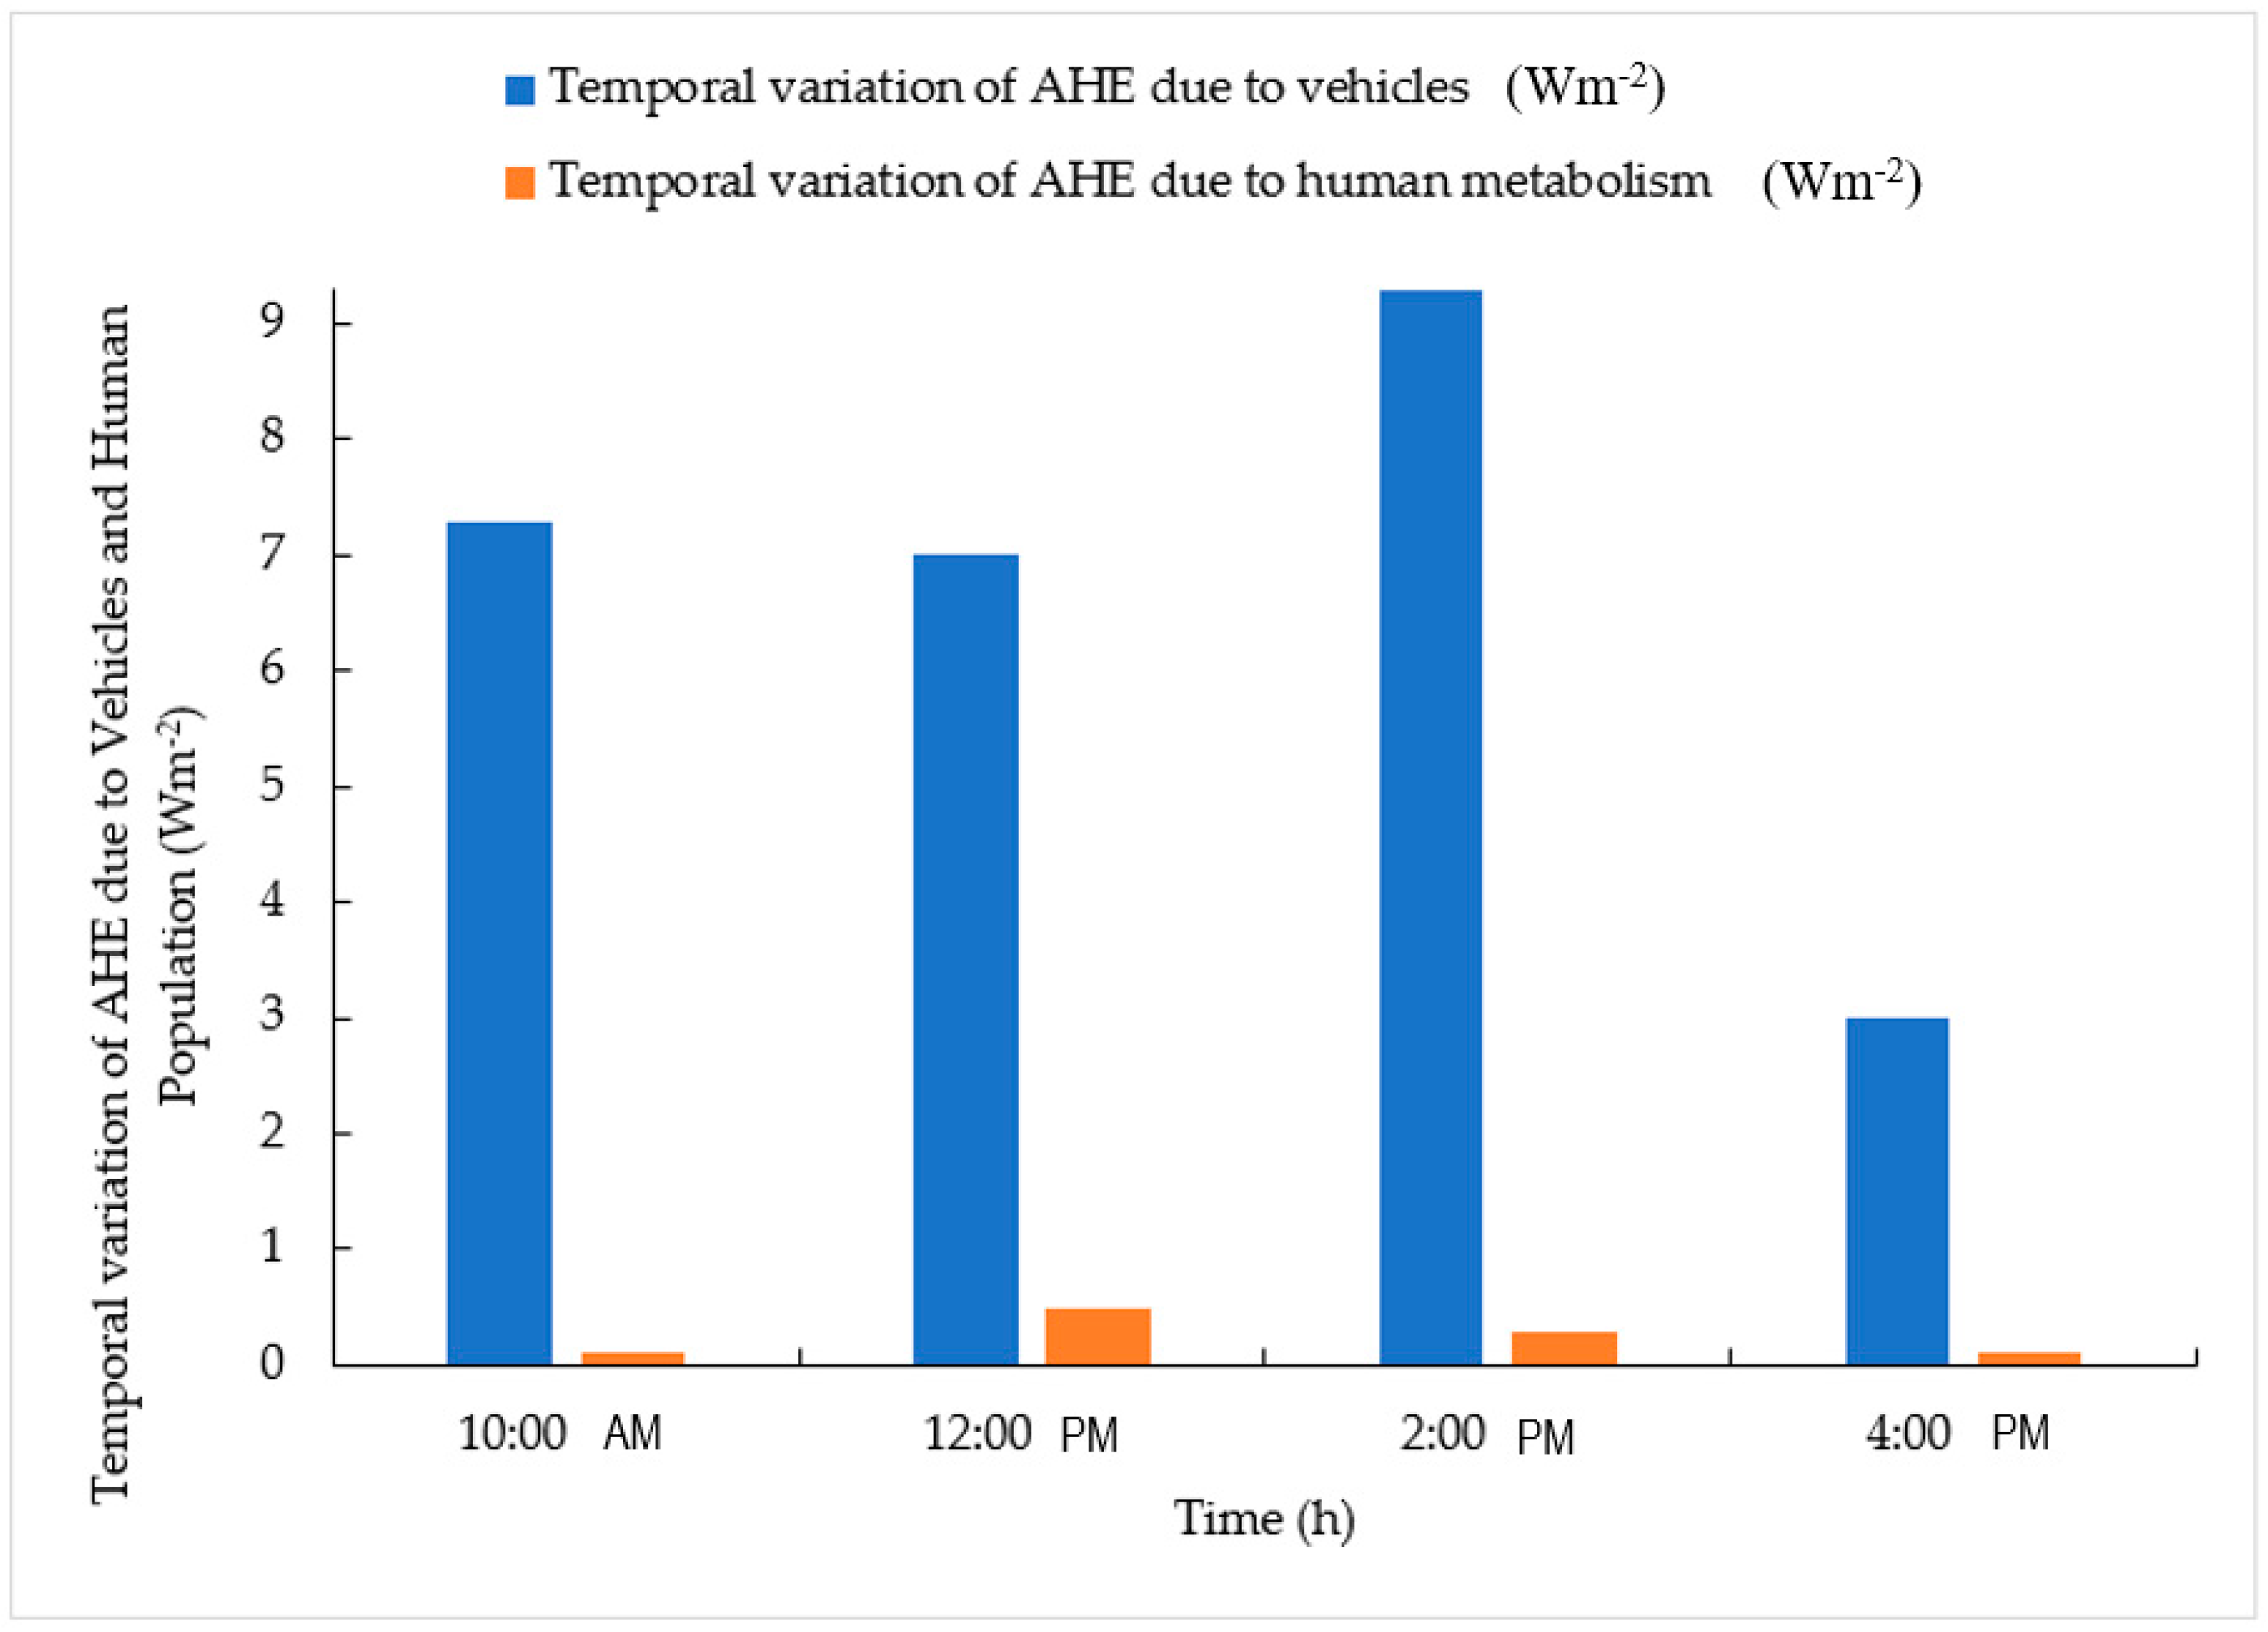
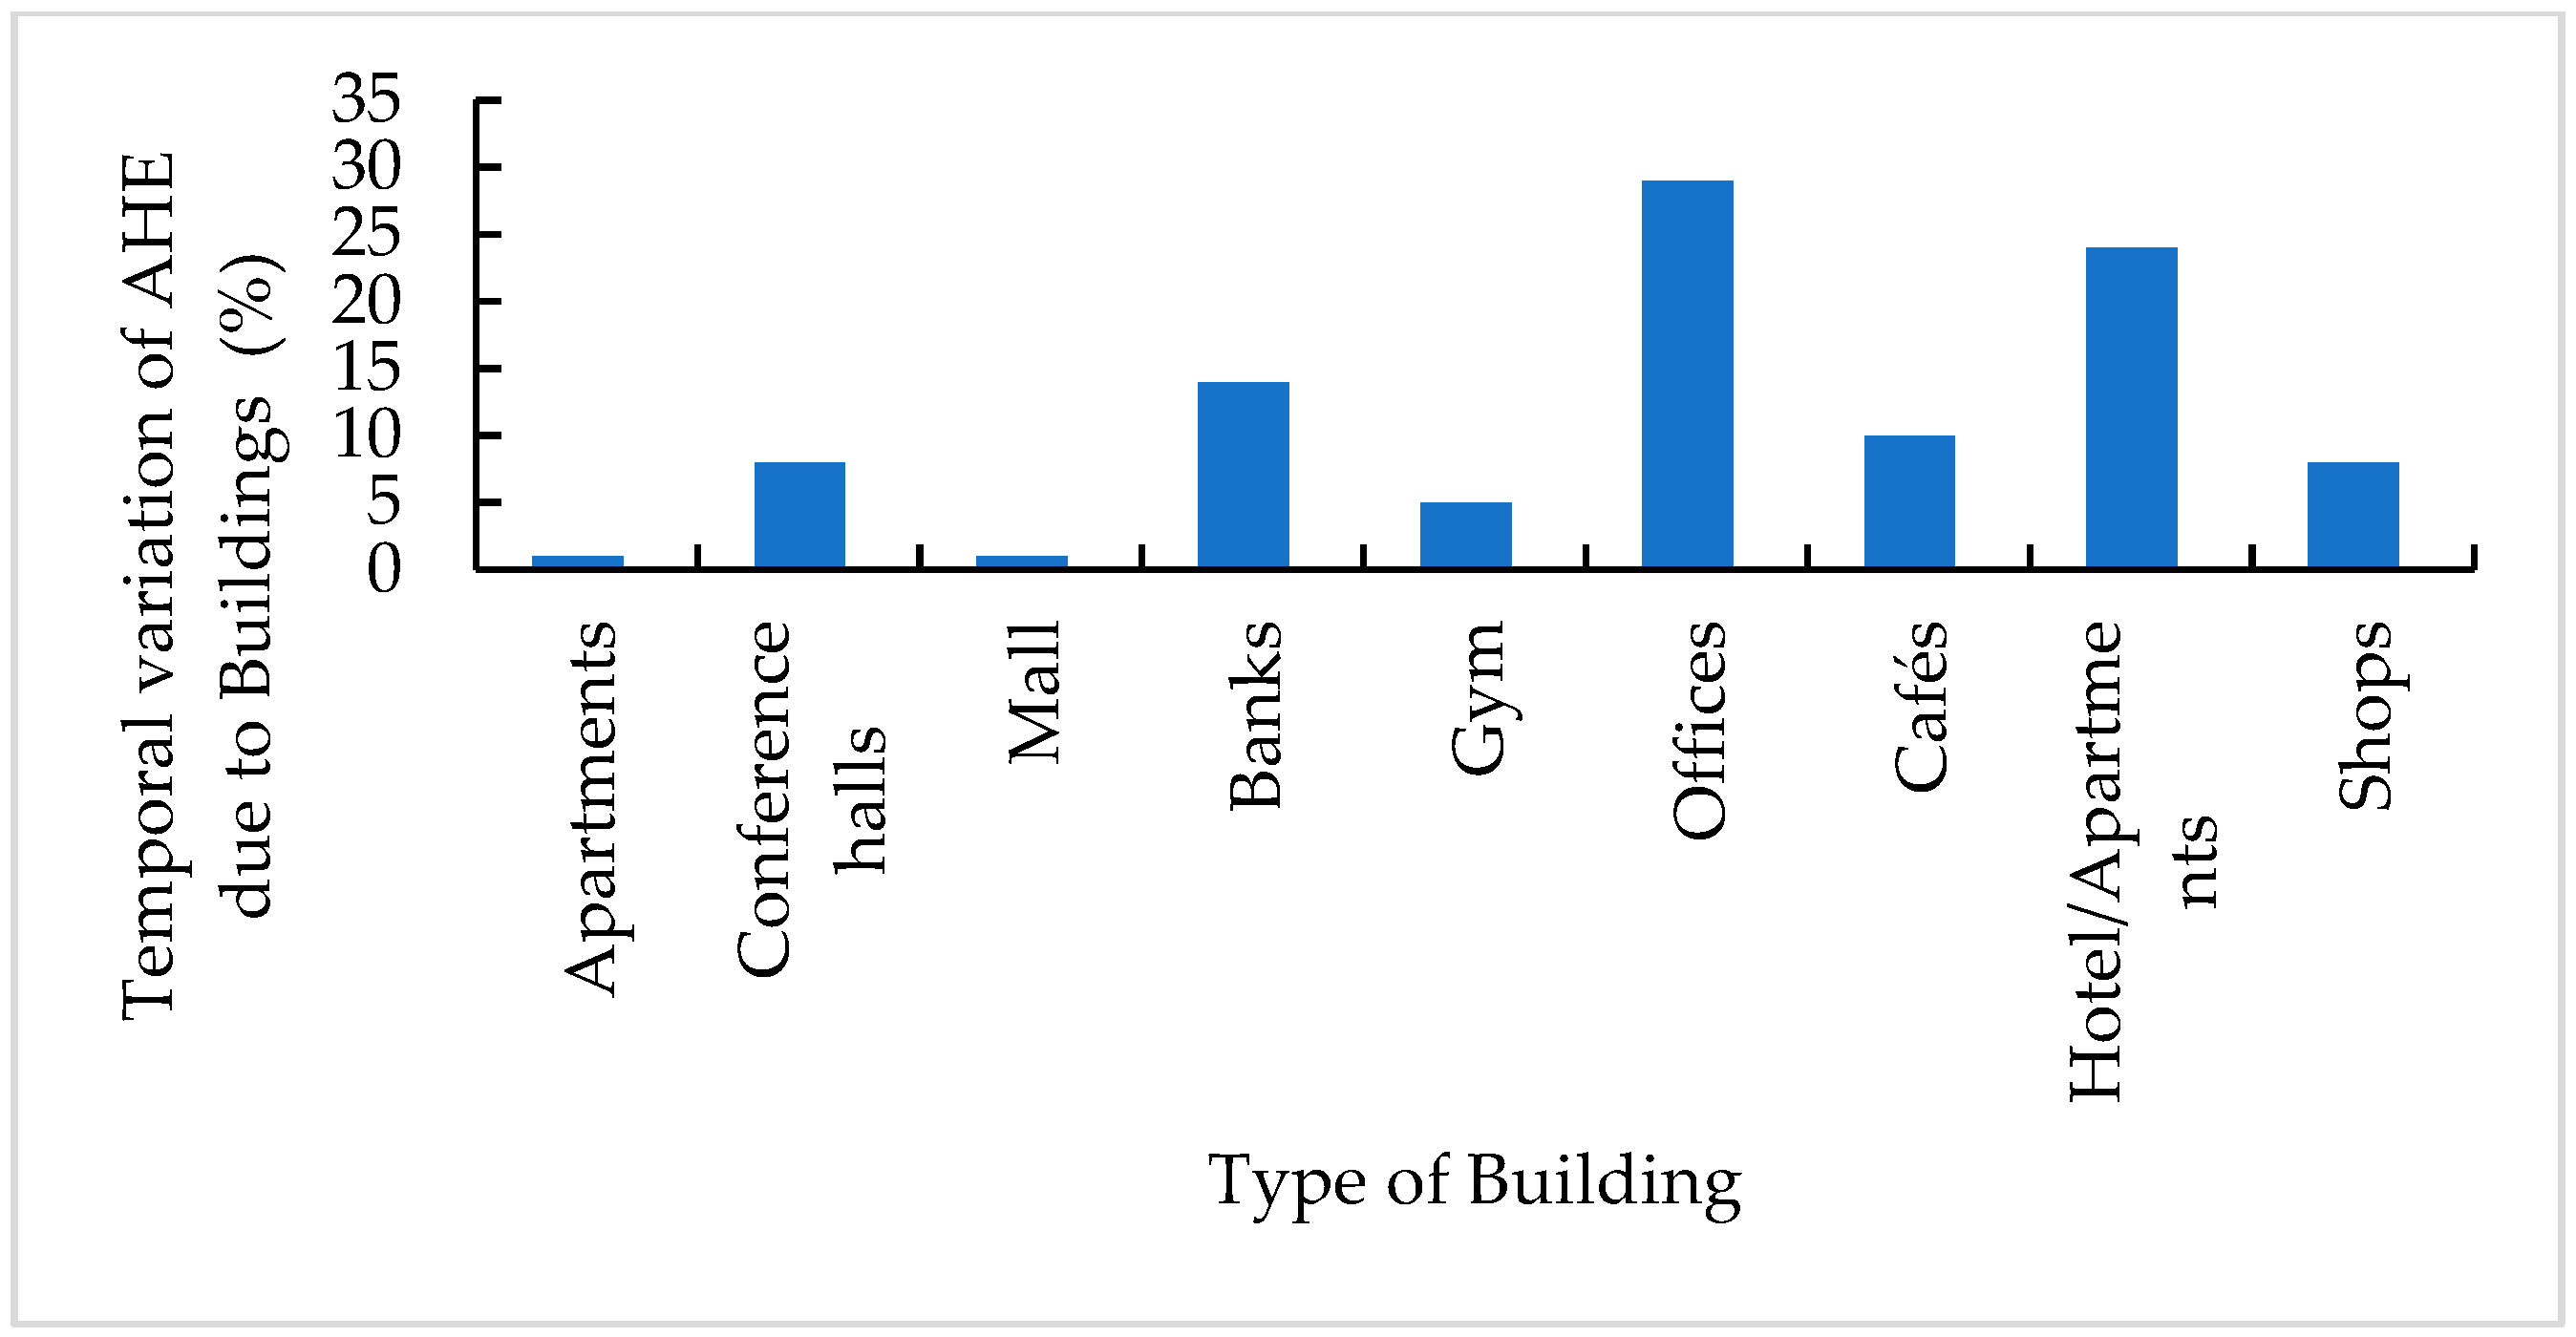
Estimation of the temporal AHE variations due to buildings (QB), human population (metabolism) (QH) and vehicles (QV) were carried out between the periods of 10 am to 4 pm. Figure 9 and Figure 10 illustrates the variation of the contributions of human metabolism and vehicle types, and building type to the total AHE in Darwin, respectively.
The temporal variation of AHE due to vehicles (QV) shows a maximum value of 9.3 Wm−2 observed at 2 pm. The larger value in this graph reflects the presence of heavy traffic in the area. Understandably, peak vehicular traffic periods vary from one city to another in Australia; however, the results show that rush hour in Darwin begins from 8 AM to 12 PM and peaks just at about 2 PM and slowly declines around 4 PM (least value of 3 Wm−2 observed at around 4 pm).
Regarding the temporal variation of AHE due to human metabolism (QH) for the observation period, the population was considered as the people who were outside the buildings, i.e., on the road only, because the effect from people who are inside the building has been already considered for QB. The observed QH values varied from 0.1 Wm−2 to 0.5 Wm−2, with a maximum QH value for the present study gained at the peak time of 12 pm. The population density reached the highest value between the period from 12 pm to 2 pm. The reason for this might be due to larger portion of the population within this area are working and they receive their lunchtime break during 12 pm to 2 pm period.
For the building category, the total estimated QB value was 112 Wm−2 and the highest contribution for QB came from office and hotel/apartment buildings. This is mainly due to the operating of air-conditioning units within these buildings. the least QB came from the mall, gym, and apartments.
Regarding the dominating AHE factor that had the greatest influence on the UHI effects, Figure 11 illustrates the percentage breakdown of all individual components contributing to UHI effects. According to this graph, the heat emission from buildings QB is the dominant factor influencing the UHI effects in the study area, contributing about 87% to 95%. The contribution from QV varies from 4% to 13% throughout the study period. In contrast, QH only contributed a fairly amount of 0.1% to 0.8% to the UHI effects.

3.4. Comparison between the Impacts of Anthropogenic Heat Emission in Darwin with Some Major Cities

Analysis of the total AHE results for Darwin and other major cities shows some similarities and differences (Table 1). For instance, the AHE of Darwin and Singapore are similar and the reason might be because both Darwin and Singapore are tropical climates [36] and require continuous operation of the air conditioning systems during the day [37], particularly during summer, thus contributing to AHE from buildings [38]. In contrast, Toulouse winter season emits high anthropogenic heat similar to that of Darwin [39] due to Toulouse’s high demand for heating of building spaces during the winter season [40]. The same reason applies to Moscow and Beijing as well [41]. Moscow has a short hot summer season and long cold winter season, hence the annual AHE adds up to a value similar to Darwin [42]. The AHE value of Downtown, Los Angeles is similar to that of Darwin as it has a Subtropical-Mediterranean climate [43].
According to the ABCB climate zoning, many major cities in Australia fall into different climate zones [44]. Melbourne with a mild to cool temperature range falls under climate zone 6 and 7, Sydney falls under zone 5 and 6 with a warm—mild temperature range, Brisbane with warm humid summer and mild winter falls under zone 2, while Adelaide falls under zone 5. On the other hand, Darwin falls under zone 1 which is high humidity summer and warm winter [45]. Despite falling into relatively cooler climate zones, The AHE values of Sydney and Melbourne are more than twice and thrice that of Darwin, respectively, and this could be because Melbourne and Sydney are densely populated cities with larger usage of land for building coverage [16]. These cities undergo both high-temperature summer and low-temperature winter seasons [46]; thus, HVAC demand for cooling and heating of spaces is considerably higher [47]. This phenomenon applies to Brisbane as well, with high population density and high demand for air conditioning space and a resultant high AHE value [48]. In contrast, Adelaide is not as densely populated as Melbourne, Sydney, or Brisbane [49], and Adelaide has a considerably more desirable temperature than other mentioned major cities. Consequently, the AHE value in Adelaide is considerably smaller than that of Darwin [50].

4. Conclusions

Anthropogenic heat emission is one of the major contributors to Urban Heat Island effects globally. The UHI in turn has increased the demand for the cooling load as well as the energy consumption of air-conditioning systems. With an increase in cooling loads, more heat is consistently released into the environment. It is evident that this increase in overall energy demand has contributed massively to global warming and other climate change effects including reported shifts in weather patterns. Interestingly, the majority of the AHE in Darwin and other major international cities including Singapore, London, and Tokyo emanate from energy-intensive buildings such as hotels, schools, and offices.
As climate change experts and environmental scientists continue to measure the rate of AHE in Darwin, more researchers are continuing to discover innovative ways of reducing the overall AHE rate in Darwin. One such approach is the incorporation of green roofs in building designs. It is expected that such innovative approaches would assist in proffering a sustainable solution to the climate change effects caused by AHE in Darwin and other major cities as these cities transition into more eco-friendly urban centres.
Failure to address the challenges caused by increasing AHE in Darwin and other major international cities shall result in continually increased UHI effects, erratic weather patterns, and high heat waves currently experienced in these cities.

Author Contributions

Conceptualization, S.R. and H.M.-R.; methodology, A.W.M.N., S.R. and H.M.-R.; software, S.R. and H.M.-R.; validation, R.C.N., M.A.U.R.T., S.R. and H.M.-R.; formal analysis, S.R., H.M.-R., M.A.U.R.T., R.C.N. and L.H.D.; investigation, M.M.A., P.S. and S.K.; resources, H.M.-R., E.A., P.S. and L.H.D.; data curation, M.A.U.R.T., A.W.M.N. and M.F.R.; writing—original draft preparation, S.R. and R.C.N.; writing—review and editing, M.A.U.R.T., M.M.A., P.S., L.H.D., E.A., S.K. and M.A.U.R.T.; supervision, M.A.U.R.T., A.W.M.N., M.M.A., P.S., M.F.R., E.A., L.H.D., S.K. and H.M.-R. All authors have read and agreed to the published version of the manuscript.

Funding

This research received no external funding.

Institutional Review Board Statement

Not applicable.

Informed Consent Statement

Not applicable.

Conflicts of Interest

The authors declare no conflict of interest.

References

  1. United Nations. World Urbanization Prospects, Demographic Research. 2018. Available online: https://population.un.org/wup/publications/Files/WUP2018-Report.pdf (accessed on 4 April 2022).
  2. Stewart, D.P. The United Nations and Human Rights. A Critical Appraisal. Edited by Philip Alston. New York, Oxford: Oxford University Press, 1992. Pp. xiii, 748. Index. $145. Am. J. Int. Law 1994, 88, 386–388. [Google Scholar] [CrossRef]
  3. Mishra, J.; Mishra, P.; Arora, N.K. Linkages between environmental issues and zoonotic diseases: With reference to COVID-19 pandemic. Environ. Sustain. 2021, 4, 455–467. [Google Scholar] [CrossRef]
  4. Li, G.; Zhang, X.; Mirzaei, P.A.; Zhang, J.; Zhao, Z. Urban heat island effect of a typical valley city in China: Responds to the global warming and rapid urbanization. Sustain. Cities Soc. 2018, 38, 736–745. [Google Scholar] [CrossRef]
  5. Nath, B.; Ni-Meister, W.; Choudhury, R. Impact of urbanization on land use and land cover change in Guwahati city, India and its implication on declining groundwater level. Groundw. Sustain. Dev. 2021, 12, 100500. [Google Scholar] [CrossRef]
  6. Huang, L.; Zhai, J.; Sun, C.Y.; Liu, J.Y.; Ning, J.; Zhao, G.S. Biogeophysical Forcing of Land-Use Changes on Local Temperatures across Different Climate Regimes in China. J. Clim. 2018, 31, 7053–7068. [Google Scholar] [CrossRef]
  7. Luo, X.; Vahmani, P.; Hong, T.; Jones, A. City-Scale Building Anthropogenic Heating during Heat Waves. Atmosphere 2020, 11, 1206. [Google Scholar] [CrossRef]
  8. Mirzaei, P.A.; Haghighat, F. Approaches to study Urban Heat Island–Abilities and limitations. Build. Environ. 2010, 45, 2192–2201. [Google Scholar] [CrossRef]
  9. Mazzone, A. Thermal comfort and cooling strategies in the Brazilian Amazon. An assessment of the concept of fuel poverty in tropical climates. Energy Policy 2020, 139, 111256. [Google Scholar] [CrossRef]
  10. FAN, H.; SAILOR, D. Modeling the impacts of anthropogenic heating on the urban climate of Philadelphia: A comparison of implementations in two PBL schemes. Atmos. Environ. 2005, 39, 73–84. [Google Scholar] [CrossRef]
  11. Lu, Y.; Yue, W.; Huang, Y. Effects of Land Use on Land Surface Temperature: A Case Study of Wuhan, China. Int. J. Environ. Res. Public Health 2021, 18, 9987. [Google Scholar] [CrossRef]
  12. Lung, S.-C.C.; Thi Hien, T.; Cambaliza, M.O.L.; Hlaing, O.M.T.; Oanh, N.T.K.; Latif, M.T.; Lestari, P.; Salam, A.; Lee, S.-Y.; Wang, W.-C.V.; et al. Research Priorities of Applying Low-Cost PM2.5 Sensors in Southeast Asian Countries. Int. J. Environ. Res. Public Health 2022, 19, 1522. [Google Scholar] [CrossRef] [PubMed]
  13. Doan, V.Q.; Kusaka, H.; Nguyen, T.M. Roles of past, present, and future land use and anthropogenic heat release changes on urban heat island effects in Hanoi, Vietnam: Numerical experiments with a regional climate model. Sustain. Cities Soc. 2019, 47, 101479. [Google Scholar] [CrossRef]
  14. Chen, B.; Wu, C.; Liu, X.; Chen, L.; Wu, J.; Yang, H.; Luo, T.; Wu, X.; Jiang, Y.; Jiang, L.; et al. Seasonal climatic effects and feedbacks of anthropogenic heat release due to global energy consumption with CAM5. Clim. Dyn. 2019, 52, 6377–6390. [Google Scholar] [CrossRef]
  15. Yang, Y.; Ren, L.; Li, H.; Wang, H.; Wang, P.; Chen, L.; Yue, X.; Liao, H. Fast Climate Responses to Aerosol Emission Reductions During the COVID-19 Pandemic. Geophys. Res. Lett. 2020, 47, e2020GL089788. [Google Scholar] [CrossRef]
  16. Chapman, S.; Watson, J.; McAlpine, C. Large seasonal and diurnal anthropogenic heat flux across four Australian cities. J. South. Hemisph. Earth Syst. Sci. 2016, 66, 342–360. [Google Scholar] [CrossRef]
  17. Azizalrahman, H.; Hasyimi, V. A model for urban sector drivers of carbon emissions. Sustain. Cities Soc. 2019, 44, 46–55. [Google Scholar] [CrossRef]
  18. de Almeida, C.R.; Teodoro, A.C.; Gonçalves, A. Study of the Urban Heat Island (UHI) Using Remote Sensing Data/Techniques: A Systematic Review. Environments 2021, 8, 105. [Google Scholar] [CrossRef]
  19. Chen, S.; Hu, D. Parameterizing anthropogenic heat flux with an energy-consumption inventory and multi-source remote sensing data. Remote Sens. 2017, 9, 1165. [Google Scholar] [CrossRef] [Green Version]
  20. Zheng, Y.; Weng, Q. High spatial- and temporal-resolution anthropogenic heat discharge estimation in Los Angeles County, California. J. Environ. Manag. 2018, 206, 1274–1286. [Google Scholar] [CrossRef]
  21. Lu, Y.; Wang, Q.; Zhang, Y.; Sun, P.; Qian, Y. An estimate of anthropogenic heat emissions in China. Int. J. Climatol. 2016, 36, 1134–1142. [Google Scholar] [CrossRef] [Green Version]
  22. Sun, R.; Wang, Y.; Chen, L. A distributed model for quantifying temporal-spatial patterns of anthropogenic heat based on energy consumption. J. Clean. Prod. 2018, 170, 601–609. [Google Scholar] [CrossRef]
  23. Ross, J.; Cunningham, C.O.; Hanna, D.B. HIV outcomes among migrants from low-income and middle-income countries living in high-income countries. Curr. Opin. Infect. Dis. 2018, 31, 25–32. [Google Scholar] [CrossRef] [PubMed]
  24. Bohnenstengel, S.I.; Hamilton, I.; Davies, M.; Belcher, S.E. Impact of anthropogenic heat emissions on London’s temperatures. Q. J. R. Meteorol. Soc. 2014, 140, 687–698. [Google Scholar] [CrossRef]
  25. World Bank Country and Lending Groups. Available online: https://datahelpdesk.worldbank.org/knowledgebase/articles/906519 (accessed on 11 February 2022).
  26. Australian Government Bureau of Meteorology. Climate Statistics for Australian Locations. Available online: http://www.bom.gov.au/climate/averages/tables/cw_014015.shtml (accessed on 11 February 2022).
  27. Yang, W.; Chen, B.; Cui, X. High-Resolution Mapping of Anthropogenic Heat in China from 1992 to 2010. Int. J. Environ. Res. Public Health 2014, 11, 4066–4077. [Google Scholar] [CrossRef] [PubMed] [Green Version]
  28. Australian Institute of Refrigeration Air Conditioning and Heating (AIRAH). Thought Leadership Policy and Advocacy Positions 2017–2020; Australian Institute of Refrigeration Air Conditioning and Heating (AIRAH): Melbourne, Australia, 2020. [Google Scholar]
  29. Northern Territory Planning Commission; Central Darwin Area Plan. Central Darwin Area Plan in NT Planning Scheme. 2021. Available online: https://planningcommission.nt.gov.au/projects/central-darwin-area-plan (accessed on 11 February 2022).
  30. Afshari, A.; Schuch, F.; Marpu, P. Estimation of the traffic related anthropogenic heat release using BTEX measurements—A case study in Abu Dhabi. Urban Clim. 2018, 24, 311–325. [Google Scholar] [CrossRef]
  31. Wang, S.; Hu, D.; Yu, C.; Chen, S.; Di, Y. Mapping China’s time-series anthropogenic heat flux with inventory method and multi-source remotely sensed data. Sci. Total. Environ. 2020, 734, 139457. [Google Scholar] [CrossRef]
  32. Wang, K.; Aktas, Y.D.; Malki-Epshtein, L.; Wu, D.; Ammar Bin Abdullah, M.F. Mapping the city scale anthropogenic heat emissions from buildings in Kuala Lumpur through a top-down and a bottom-up approach. Sustain. Cities Soc. 2022, 76, 103443. [Google Scholar] [CrossRef]
  33. Smith, C.; Lindley, S.; Levermore, G. Estimating spatial and temporal patterns of urban anthropogenic heat fluxes for UK cities: The case of Manchester. Theor. Appl. Climatol. 2009, 98, 19–35. [Google Scholar] [CrossRef]
  34. Karim, M.A.; Hasan, M.M.; Khan, M.I.H. A simplistic and efficient method of estimating air-conditioning load of commercial buildings in the sub-tropical climate. Energy Build. 2019, 203, 109396. [Google Scholar] [CrossRef]
  35. Daniel, L. ‘We like to live in the weather’: Cooling practices in naturally ventilated dwellings in Darwin, Australia. Energy Build. 2018, 158, 549–557. [Google Scholar] [CrossRef]
  36. Yang, W.; Wong, N.H.; Jusuf, S.K. Thermal comfort in outdoor urban spaces in Singapore. Build. Environ. 2013, 59, 426–435. [Google Scholar] [CrossRef]
  37. Mohammad Harmay, N.S.; Kim, D.; Choi, M. Urban Heat Island associated with Land Use/Land Cover and climate variations in Melbourne, Australia. Sustain. Cities Soc. 2021, 69, 102861. [Google Scholar] [CrossRef]
  38. Moriwaki, R.; Kanda, M.; Senoo, H.; Hagishima, A.; Kinouchi, T. Anthropogenic water vapor emissions in Tokyo. Water Resour. Res. 2008, 44, 11. [Google Scholar] [CrossRef]
  39. Adelia, A.S.; Yuan, C.; Liu, L.; Shan, R.Q. Effects of urban morphology on anthropogenic heat dispersion in tropical high-density residential areas. Energy Build. 2019, 186, 368–383. [Google Scholar] [CrossRef]
  40. Pigeon, G.; Legain, D.; Durand, P.; Masson, V. Anthropogenic heat release in an old European agglomeration (Toulouse, France). Int. J. Climatol. 2007, 27, 1969–1981. [Google Scholar] [CrossRef]
  41. Mostafavi, F.; Tahsildoost, M.; Zomorodian, Z. Energy efficiency and carbon emission in high-rise buildings: A review (2005-2020). Build. Environ. 2021, 206, 108329. [Google Scholar] [CrossRef]
  42. SMIC. Climate, Inadvertent Climate Modification: Report of the Study of Man’s Impact on Climate (SMIC); Study of Man’s Impact on Climate (SMIC); MIT Press: Cambridge, MA, USA, 1971. [Google Scholar]
  43. Hulley, G.C.; Dousset, B.; Kahn, B.H. Rising Trends in Heatwave Metrics Across Southern California. Earth’s Futur. 2020, 8, 7. [Google Scholar] [CrossRef]
  44. Dey, R.; Lewis, S.C.; Arblaster, J.M.; Abram, N.J. A review of past and projected changes in Australia’s rainfall. WIREs Clim. Chang. 2019, 10, 3. [Google Scholar] [CrossRef]
  45. Australian Building Codes Board. Climate Zone Map: Australia Wide. Aust. Build. Codes Board 2019, 1. Available online: https://www.abcb.gov.au/Resources/Tools-Calculators/Climate-Zone-Map-Australia-Wide# (accessed on 12 February 2022).
  46. de Jesus, A.L.; Thompson, H.; Knibbs, L.D.; Hanigan, I.; De Torres, L.; Fisher, G.; Berko, H.; Morawska, L. Two decades of trends in urban particulate matter concentrations across Australia. Environ. Res. 2020, 190, 110021. [Google Scholar] [CrossRef]
  47. Block, A.H.; Livesley, S.J.; Williams, N.S.G. Responding to the Urban Heat Island: A Review of the Potential of Green Infrastructure. Vic. Cent. Clim. Chang. Adapt. 2012, 1–62. Available online: http://staging.202020vision.com.au/media/1026/responding-to-the-urban-heat-island-a-review-of-the-potential-of-green-infrastructure.pdf (accessed on 12 February 2022).
  48. Ali, M.M.; Al-Kodmany, K. Tall Buildings and Urban Habitat of the 21st Century: A Global Perspective. Buildings 2012, 2, 384–423. [Google Scholar] [CrossRef] [Green Version]
  49. Douglas, A.N.J.; Morgan, A.L.; Rogers, E.I.E.; Irga, P.J.; Torpy, F.R. Evaluating and comparing the green wall retrofit suitability across major Australian cities. J. Environ. Manag. 2021, 298, 113417. [Google Scholar] [CrossRef] [PubMed]
  50. Slavko, B.; Glavatskiy, K.; Prokopenko, M. City structure shapes directional resettlement flows in Australia. Sci. Rep. 2020, 10, 8235. [Google Scholar] [CrossRef] [PubMed]
  51. Newcombe, K. Energy use in Hong Kong: Part III, spatial and temporal patterns. Urban Ecol. 1976, 2, 139–172. [Google Scholar] [CrossRef]
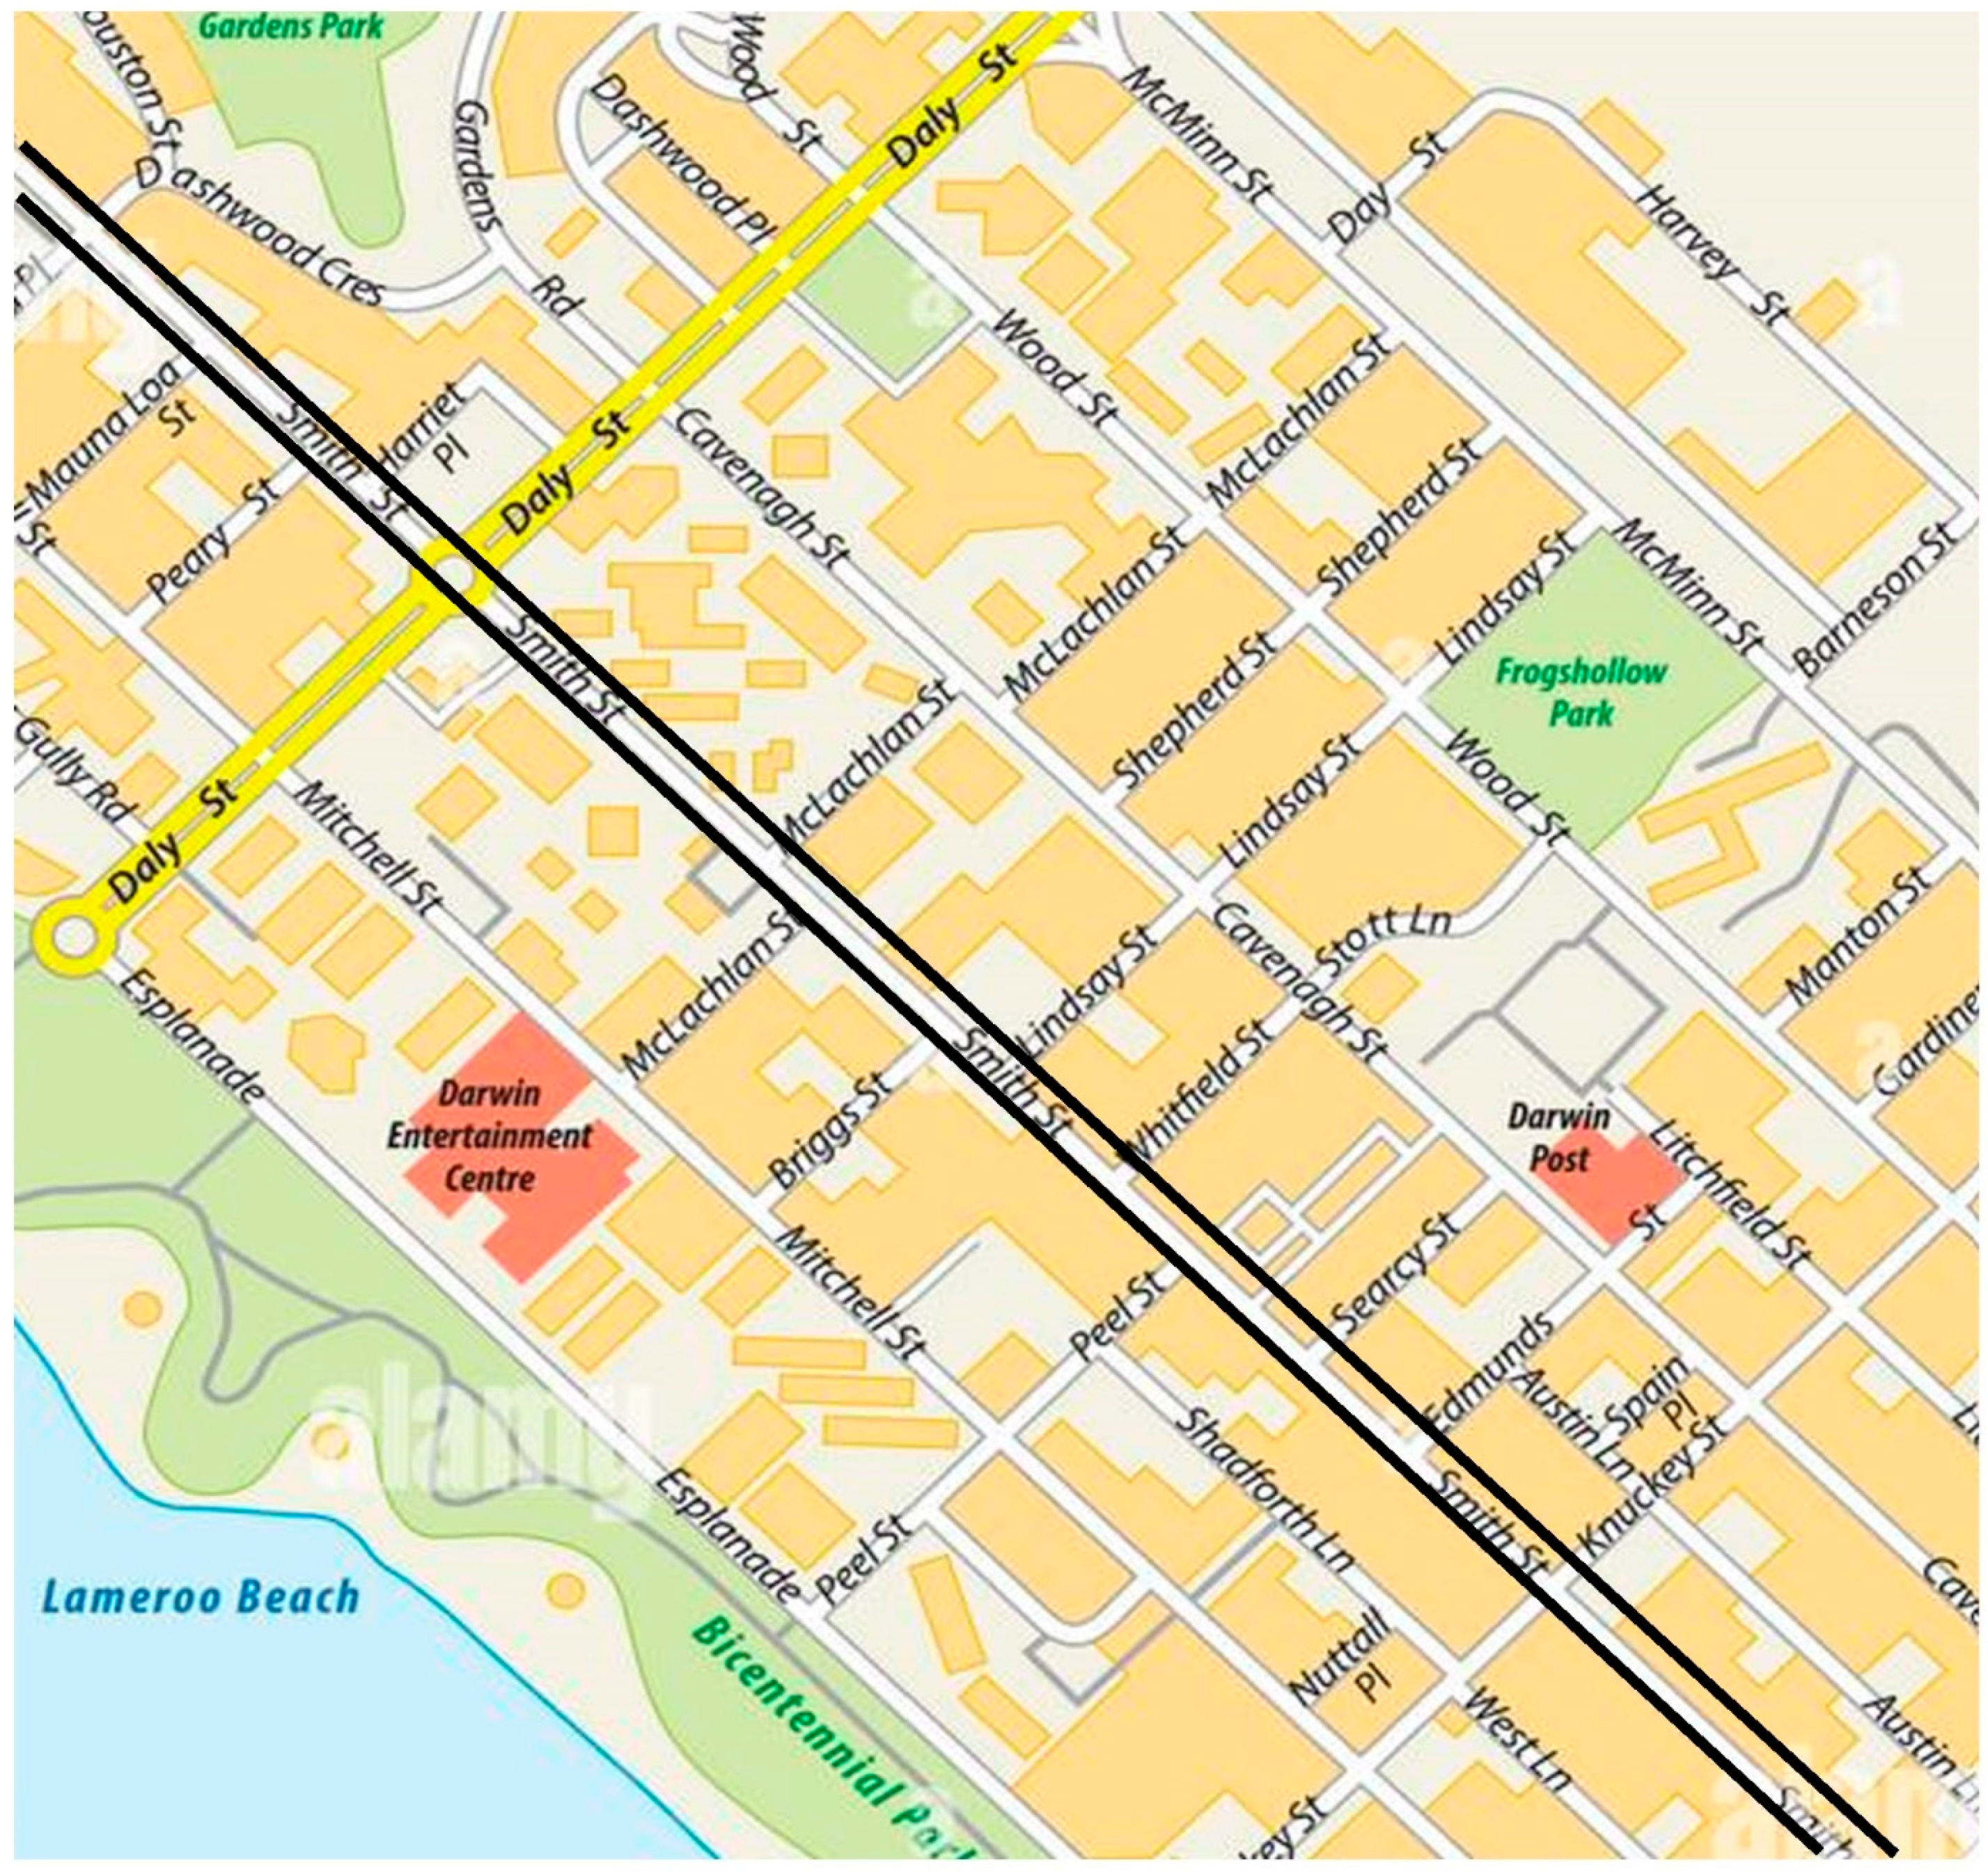
Figure 1. Map of the Study Area; Smith street, Darwin [29].
Sustainability 14 05218 g001
Figure 2. Adopted Approach for the Estimation of the AHE in Darwin.
Sustainability 14 05218 g002
Figure 3. Microclimate Variation Chart.
Sustainability 14 05218 g003
Figure 4. Solar Power Variation Chart.
Sustainability 14 05218 g004
Figure 5. Estimated Daily Solar Power Variation Using Thermal Photography. (A) At 10 am near Church. (B) At 4 pm near Church. (C) At 10 am near NAB. (D) At 4 pm near NAB.
Sustainability 14 05218 g005
Figure 6. Outcome of Vehicle Survey.
Sustainability 14 05218 g006
Figure 7. Outcome of Population Survey.
Sustainability 14 05218 g007
Figure 8. Outcome of Building Survey.
Sustainability 14 05218 g008
Figure 9. Temporal Variation of Anthropogenic Heat Emission Due to Vehicles (QV) and Human Population (QH).
Sustainability 14 05218 g009
Figure 10. Temporal Variation of Anthropogenic Heat Emission Due to building types (QB).
Sustainability 14 05218 g010
Figure 11. Influence of Anthropogenic Heat Emission factors on the Urban Heat Island Effects.
Sustainability 14 05218 g011
Table 1. Anthropogenic Heat Emission Magnitudes of Various Urban City Centres Compared to Darwin.
YearCityQAHE (Wm−2)Reference
AnnualWinterAutumnSummerSpring
1970Moscow, Russia127
1971Hong Kong, China 334132 [42]
1986–1994Ginza, Tokyo 86 a [51]
1986–1994Shinjuku, Tokyo 136 a [38]
2005Toulouse, France 100 25 [38]
2008Manchester, England23 [40]
2011Singapore113 a [33]
2016Melbourne, Australia376 [51]
2016Brisbane, Australia261 [16]
2016Sydney, Australia256 [16]
2016Adelaide, Australia39 [16]
2017Los Angeles, USA100 [16]
2017Beijing, China 135848277[20]
2021Darwin121 a Present study
a Represents maximum mean hourly value.
Publisher’s Note: MDPI stays neutral with regard to jurisdictional claims in published maps and institutional affiliations.