Article

How COVID-19 Affected GHG Emissions of Ferries in Europe

by
Gianandrea Mannarini
1,*,
Mario Leonardo Salinas
1,
Lorenzo Carelli
1 and
Alessandro Fassò
2
1
CMCC (Centro Euro-Mediterraneo sui Cambiamenti Climatici), Ocean Predictions and Applications Division, 73100 Lecce, Italy
2
Dipartimento di Scienze Economiche, University of Bergamo, 24127 Bergamo, Italy
*
Author to whom correspondence should be addressed.
Sustainability 2022, 14(9), 5287; https://doi.org/10.3390/su14095287
Submission received: 1 April 2022 / Revised: 21 April 2022 / Accepted: 22 April 2022 / Published: 27 April 2022
(This article belongs to the Special Issue Statistics and Econometrics of Environment and Climate Change)

Abstract

:
Unprecedented socioeconomic conditions during the COVID-19 pandemic impacted shipping. We combined ferry CO 2 emissions in Europe (from the EU-MRV) with port call data and vessel parameters, and analysed them using mixed-effects linear models with interactions. We found a generalized reduction in unitary emissions in 2020, confirming its causal relation with COVID-19. Furthermore, for larger ferries, additional and COVID-19-related reductions between 14% and 31% occurred, with the larger reductions for those built before 1999. Ferries operating in the Baltic and Mediterranean Seas experienced comparable reductions in their unitary emissions, but in the North Sea per-ship emissions decreased by an additional 18%. Per-ship emissions at berth, while showing increases or decreases depending on ferry type, did not significantly change at the fleet level. We believe that our methodology may help assess the progress of shipping toward decarbonisation in the presence of external shocks.

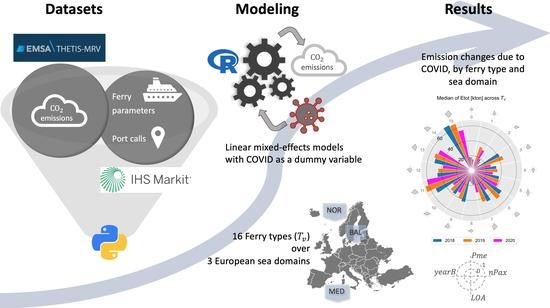
Graphical Abstract

1. Introduction

The COVID-19 pandemic (hereafter: “COVID”) imposed a global shock on people’s mobility [1], energy consumption [2], and airborne emissions [3,4]. The restrictions in both short-range mobility and traveling enforced by governments to safeguard the public health had the side effect of triggering an unprecedented economic downturn, with most countries experiencing a deep recession and long-lasting disruptions to the global supply chain [5].
The maritime sector has been affected in multiple ways by this shock. In the early stages of the pandemic, outbreaks on cruise ships made headlines because clusters of the virus were highly lethal in confined spaces [6]. Later, as the demand for goods shrank due to the restrictions put in place, maritime trade was also affected. A reduction in port calls followed which, according to the United Nations Conference on Trade and Development (UNCTAD), was particularly relevant for the break-bulk, container, and dry-bulk ship segments [7]. However, according to the European Maritime Safety Agency (EMSA), the greatest effects in terms of ship activity were on cruise ships and ferries, at least in Europe. These shipping segments conducted 85% and 19% fewer port calls in 2020, respectively [8].
Maritime emissions of carbon dioxide (CO 2 ) from ships have been monitored in Europe since before COVID, due to the EU-MRV (monitoring, reporting, verification) regulation [9]. Information regarding annually aggregated CO 2 emissions have been made available from all ships above a given size threshold that call at European ports. The fact that the EU-MRV system had already been operational for two full years before the COVID outbreak represents an unparalleled opportunity. Like other cases where data collection systems continued to operate during the anthropause imposed by COVID [10,11], this provides a unique chance to conduct a natural experiment [12] into maritime transport.
Among the various ships monitored through the EU-MRV, ferries are likely to increase and perhaps distort any COVID-related anomalies, due to their hybrid services in which they carry both (rolling) vehicles and passengers (hence their technical name of “Ro-Pax” ships) [13,14]. The transport of people via ferries may have suffered specific and amplified shocks or adjustments, which in part may differ from those of freights. These can include a specific geographical and temporal pattern, following the restrictions put in place in specific countries during the various surges of the pandemic [15,16].
We therefore use the EU-MRV data to address the question of whether COVID led to statistically significant changes in ferry CO 2 emissions, how they were distributed across the fleet and the various European sea domains, and if they could reveal any insights into the functioning of the ferry industry during this macroeconomic shock. This investigation required additional information about ferry characteristics and their port calls, and we also developed an advanced statistical modelling framework. We considered the panel structure of the ferry activity and CO 2 emission data and based our inference on linear mixed-effects models with interactions to handle COVID effects while accounting for the high heterogeneity of the dataset and its temporal correlation.
This work presents three novelties. The first one lies in the data used: a bespoke vessel characteristics and mobility dataset was combined with an emission dataset derived from the EU-MRV regulation, leading to a joint and open access dataset. The second novelty is the analysis method: that is, the use of linear mixed-effects models for representing both vessel-specific effects and terms related to the way of operating the ferry fleet on various European seas. Another novelty is the results: to our knowledge, the impact of COVID on CO 2 emissions had not yet been assessed in relation to the various ferry types, also distinguishing between total and at-berth emissions.
The remainder of this manuscript is organized as follows. Section 2 provides a review of the literature regarding (i) maritime transportation during the first two years of COVID, (ii) major policies regarding maritime greenhouse gases (GHG) emissions, and (iii) some of the statistical analysis methods used for assessing the impact of COVID. In Section 2.1, the effects of COVID are examined through three specific research questions. We then introduce the datasets used and the preprocessing approach in Section 3. The preliminary data analysis in Section 4 is followed by Section 5, which provides a description of the statistical methods. In Section 6, we examine the results for both total emission and emission at berth, and answer the three research questions. Section 7 provides a discussion based on the results obtained, and we present the conclusions of the paper in Section 8. Appendix A provides additional information for reproducing the results of this work.

2. Literature Review and Research Questions

Several studies have investigated the changes to shipping during the pandemic by analysing ship activity data. For example, a global reduction was found in the expected number of navigated miles and port calls occurring in the first half of 2020, particularly for passenger (−43%) and container ships (−14%), with an increase in the proportion of idle passenger ships (from about 10% in 2019 to over 45% in 2020) [17]. Another study based on global data from the Automatic Identification System (AIS) found a statistically significant relationship between ship traffic, an index of the stringency of COVID containment measures, and a country’s income [15]. Both of these studies noted that any comparison with 2019 may lead to an underestimation of the impact of COVID due to the increasing trend in the prepandemic period. According to an UNCTAD report [18], shipping (i.e., cargo-carrying ships) first reacted to the pandemic-triggered macroeconomic framework with blank sailings, i.e., the cancellation of part or all of the port calls of a voyage. This continued until mid-2020, when the demand again increased, and both the blank sailings and the proportion of idle ships in the fleet decreased. In addition, slow-steaming was not found to be an option for the container shipping fleet during the pandemic, as this had already been in place since the 2008–2009 financial crisis [19].
Only a few studies have focussed on the changes to ferries in 2020. In the seas of the Strait of Gibraltar, the emissions of six Ro-Pax ferries propelled by water jet systems were estimated to have been reduced by nearly 95% over a 90-day period that corresponded to the national lockdown [20]. AIS data were used to estimate the changes in CO 2 emissions from various ship types in the Western Singapore Straits [21], and the Ro-Pax CO 2 emissions were found to be reduced by more than 75% (2020 to 2019), with a drop to nearly zero emissions from April 2020 until the end of the year. Changes in ferry activity at the port of Oslo were quantified by applying dynamic time warping on AIS data of 2017–2020. It was found that the changes were related to a stringency index of COVID restrictions [22]. Making use of a national database (https://www.havbase.no/, accessed on 3 March 2022), the monthly resolved evolution of ferry emissions in Norway in 2020 was described in [23], finding in particular that several of the international ferries were canceled due to COVID, whereas domestic ferries continued operating, albeit at lower intensity than before the pandemic. In [24], AIS data for Danish waters were used to prove a statistically significant drop in average draught of Ro-Pax ships between 2020 and 2019. However, their number and average speed did not change significantly.
In 2020, global GHG emissions dropped by 7% on a year-to-year basis for the first time [2,25]. These estimations are based on energy consumption, but they do not account for the contribution from shipping. The estimation regarding shipping in [25] was based on the assumption that the emissions are linearly proportional to the transported volumes, and a not verifiable data source for the volume contraction in only the second quarter of 2020 was used. More recent estimates, including the contribution from shipping, could assess a drop of just 5.4% in 2020 relative to 2019, corresponding to a 1.9 Gton CO 2 decrease [26]. Also, a year-to-year rebound for 2021 in the range of 4.2% [27] to 4.9% [26] is projected.
Thus, GHG emissions from the maritime sector are worthy of attention, as they exacerbate climate problems [28] and also in view of the regulations implemented in the sector over the last few years. The GHG emissions from shipping are considered hard-to-abate because of the long lifespans of the assets, the high level of energy dependency, and the inherent limits to any potential electrification. Reducing the absolute GHG emissions from ships would require technical innovations in terms of energy-saving devices [29], operational improvements [30], market-based measures [31], or scalable zero-emission fuels [32]. In 2018, the International Maritime Organization (IMO) set its ambition to halve shipping GHG emissions by mid-century [33]. In 2021, the first mandatory measures were approved; starting from 2023, all ships will be required to reduce their carbon intensity, following a ship-type-specific reference line [34].
The EU-MRV regulation is a piece of regional policy requiring the monitoring of CO 2 emissions or their proxies (fuel consumption or bunkering sales) from all ships above 5,000 gross tonnes (GT) that call at ports in the European Economic Area (EEA) [35]. The EU-MRV uses “top-down” estimates rather than “bottom-up” approaches, which would involve identifying ship activity and colour emissions (such as in [20,21]). A legislative proposal by the EU Commission, as part of the “fit for 55” package (https://ec.europa.eu/commission/presscorner/detail/en/IP_21_3541, last accessed on 3 March 2022), suggested that shipping GHG emissions should be included in the EU Emission Trading Scheme (ETS). This implies that the maritime polluter would have to surrender an allowance to compensate for its own CO 2 emissions (As of 9 March 2022, the unit price was above 81 EUR/t CO 2 , https://tradingeconomics.com/commodity/carbon, last accessed on 3 March 2022) The emissions would be assessed on the basis of the EU-MRV data, again highlighting the value of this dataset.
Therefore, the decarbonisation of maritime transportation is now clearly on the agenda for policy makers. However, systemic stresses and crises such as the COVID pandemic may hinder a clear assessment of the progress in this industry. To analyse time-series data, statistical panel data methods are required. Such methods have traditionally been applied in econometrics [36], biostatistics [37] and environmental statistics [38]. The most accepted approach is based on linear mixed-effects (LME) models. Essentially, these extend regression models and analysis of variance to consider correlations among observations at different time points. Spatial correlations can also be handled. Such correlations render traditional multivariate regressions unreliable. LME models enable heterogeneity due to unobserved covariates being filtered, and thus more precise inferences can be made. The importance of panel data in transportation research was highlighted by [39]. Ref. [40] used ordinary least squares regression to examine transport energy consumption. The COVID impact on the shipping trade using monthly resolution data was studied by [41] using the seemingly unrelated regression model. Changes in linkages between variables, including a port connectivity index, trade variables, and COVID were investigated by [42]. They assessed both direction and strength of causality links, with maritime connectivity more affected by the number of COVID cases than deaths.

2.1. Research Questions

In most of these works on maritime CO 2 emissions (exceptions include [15,41]), a descriptive statistical approach was taken in which the time series of the observed data were aggregated on a specific time scale, usually monthly or yearly, and then, year-to-year comparisons were conducted. However, this approach cannot attribute the changes directly to COVID or distinguish them from any pre-COVID trends. In addition, it cannot identify signals of change smaller than the internal variability of the datasets or assess the associated uncertainty.
However, the feasibility of an advanced statistical analysis is limited by the actual data available. Figure 1 illustrates the connection between the level of data availability and a causal graph of ferry CO 2 emissions. The arrows indicate the causal relationships, while the colour shadings represent the level of data availability. The number of passengers and the vehicle mobility via ferries are influenced by the combined effect of the pandemic, the ferry fleet characteristics (engine power, vessel length, etc.), and the specific European sea basin. Some data for these three factors are available. The level of mobility affects the number of port calls due to the strategic planning of shipowners who aim to operate their vessels optimally [43]. The port calls affect the timing of the voyages and, together with the sea basin dependent meteo-oceanographic (meteocean) conditions, the voyage profiles, i.e., the time evolution of kinematic and energetic aspects [44]. In particular, each port call implies an acceleration (either a speed increase or decrease) for the vessel, which leads to CO 2 rates higher than those during a steady state in navigation [45]. In conclusion, each voyage profile provides the values of the CO 2 emissions for that voyage.
We draw on annually aggregated emission data in this study, and thus cannot capture the detailed dynamic impact of the heterogeneous restrictions on passenger mobility imposed by various countries at different times to combat the COVID outbreak [15]. Instead, we consider the whole of 2020 as the COVID-related factor, although the various pandemic waves did not span the whole year in Europe, and the timing and quality of the restrictions to passenger mobility varied extensively in time and space [16].
This work aims to address the following main question: “How did the Ro-Pax CO 2 emissions change in Europe in the aftermath of the COVID outbreak of 2020”? As a quantitative answer is sought, the initial expectation that COVID led to a generalised reduction in CO 2 emissions can be questioned. For instance: What part of the emission reduction was due to COVID and what had to do with an internal variability of the ferry fleet? Was there a geographic pattern in the emission changes? If the total emissions decreased, did the same happen to the emissions at berth? Could we expect that, for some vessels, emissions at berth increased due to the longer time spent at harbours? Or did they decrease because of idle vessels switching off their engines? Therefore, we believe that the investigation should focus on the following three research questions:
Q1.
Did the heterogeneity of the ferry fleet influence the outcome and how?
Q2.
Was there any specific geographical pattern across the European sea basins?
Q3.
Was the change related to the way the vessels were operated, in particular their number of port calls?
These questions are considered in terms of both total emissions and emissions at berth. This distinction can inform about the functioning of the ferry industry in Europe during the pandemic.

3. Data and Preprocessing

In this section we describe the datasets and the relevant variables used and discuss the data preprocessing phase.

3.1. Datasets and Variables

Two main datasets were used in this study: THETIS-MRV (or “THETIS”) and IHS Markit (“IHS”).
THETIS corresponds to the data collected through the EU-MRV system and published (https://mrv.emsa.europa.eu/, last accessed on 3 March 2022) by EMSA. This vessel-specific information is reported as annually aggregated data. These data are self-reported by shipping companies but subject to third-party verification. The official FAQs clarifying the details of the collected information are available (https://ec.europa.eu/clima/eu-action/transport-emissions/reducing-emissions-shipping-sector_en, last accessed on 3 March 2022) Of the several variables reported for each ship, we focussed on two measurements: the total CO 2 emissions per ship, Etot, and the CO 2 emitted while the ship is at berth at ports under an EU member state’s jurisdiction, Eber, cf. Table 1. Throughout the paper, the terms “per-ship” or “unitary” are used interchangeably with reference to emissions.
IHS here refers to two commercial (https://ihsmarkit.com/products/ship-and-port-data.html, last accessed on 3 March 2022) and bespoke databases purchased by CMCC including: (i) ship parameters (hull, machinery, and capacity) and (ii) port calls of all Ro-Pax vessels above 5000 GT calling at ports of the EEA in 2018–2020. The IHS dataset was built by CMCC in cooperation with the data provider by selecting ports and vessels matching the THETIS information. The variables obtained from IHS are also reported in Table 1 and represent the minimal set of information needed for answering the research questions of Section 2.1.

3.2. Preprocessing of THETIS

Information about unitary CO2 emissions was extracted from the THETIS dataset. According to the EU-MRV regulation, the annual emission reports of each ship in the previous calendar year are published by EMSA from 30 June. However, information for all ships is not always provided by this date. Furthermore, already published data for some ships may be reviewed by the companies. In either case (ships added or data reviewed), a new version of the dataset for that specific monitoring year is generated by THETIS and then published. We therefore considered the latest version available at the time we began our research for each monitoring year. The THETIS versions selected for our study are reported in Table 2.
Four CO 2 monitoring methods were available to companies according to the EU-MRV regulation. We assumed that any changes in the method for a given ship over the years do not negatively affect the consistency of the emission dataset. Verifying this assumption is beyond the scope of the present paper.
We first removed a few obvious outliers (Etot < Eber; Etot lower than emissions from all voyages between ports under a member state’s jurisdiction; an annual total time spent at sea that exceeded the number of hours in a year). Then, only ships of the “Ro-pax” type were selected, thus matching the IHS dataset. This class also includes high-speed craft (HSC), which exhibit very different speed and propulsion characteristics than displacement vessels. In terms of their GHG emissions, it has been proposed that HSC should be assessed separately from other ferries [46]. We therefore removed them from the “Ro-Pax ship”. To this end, a condition suggested by [47] on a scaled service speed (the Froude number Fn) was applied:
Fn = maxV g 0 · LOA < 0.4
The service speed maxV and ship length LOA used for evaluating Equation (1) were taken from specific variables in the IHS dataset as reported in Table 1. The gravity acceleration was g 0 = 9.8 m/s 2 .
The subset of ships resulting from the above filtering was kept as the reference fleet for all subsequent analyses. As Table 2 shows, although the non-HSC vessels represent less than 3% of the THETIS fleet, their share of emissions is around 9% of the EEA total.

3.3. Preprocessing of IHS

The IHS databases provided: (i) the vessel characteristics, (ii) approximate georeferences for their emissions, and (iii) the number of their port calls. This corresponds to the three research questions in Section 2.1.
(i) A categorical variable VType was introduced to describe the vessel type. This was coded as an integer value of between 0 and 15, as given by
VType = k = 0 3 2 k · H ( φ k φ k 0 )
where H is the Heaviside function, and φ k are the vessels’ variables listed in Table 3 together with their threshold values φ k 0 . These thresholds were selected as the medians of the distributions of φ k . The VType = 0 therefore consists of low main-engine power, low passenger-carrying capacity, short length and old ferries. This is the reference class for the subsequent inferential analysis conducted in Section 6. Other classification criteria would in principle be possible, depending on ferry data availability. E.g., annual revenues, lane-meter capacity, or bed capacity could also be considered [14].
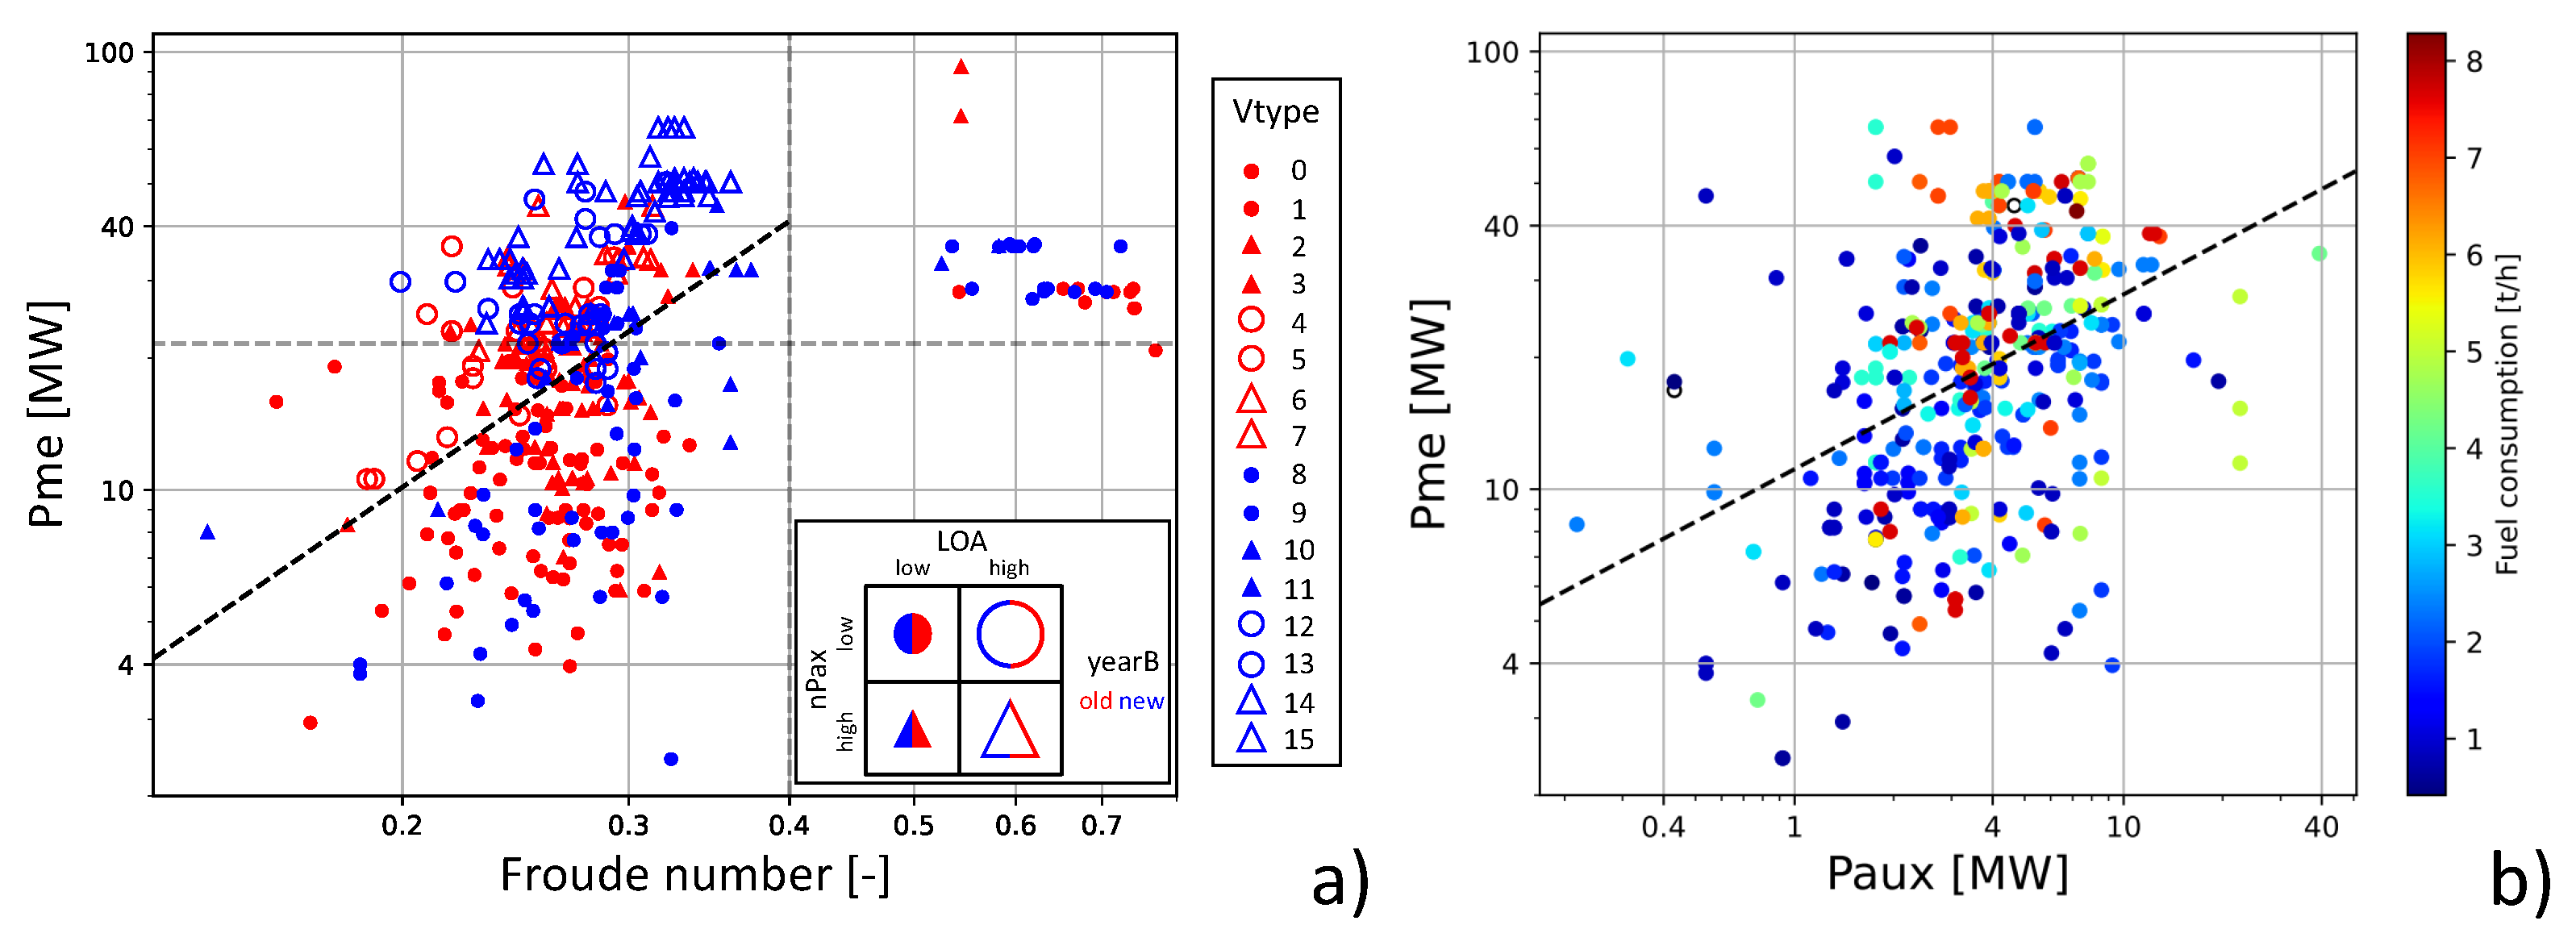
In Figure 2a, the Ro-Pax fleet (including HSC) is illustrated in terms of main engine power and service speed and taking into account the dichotomous components of VType.
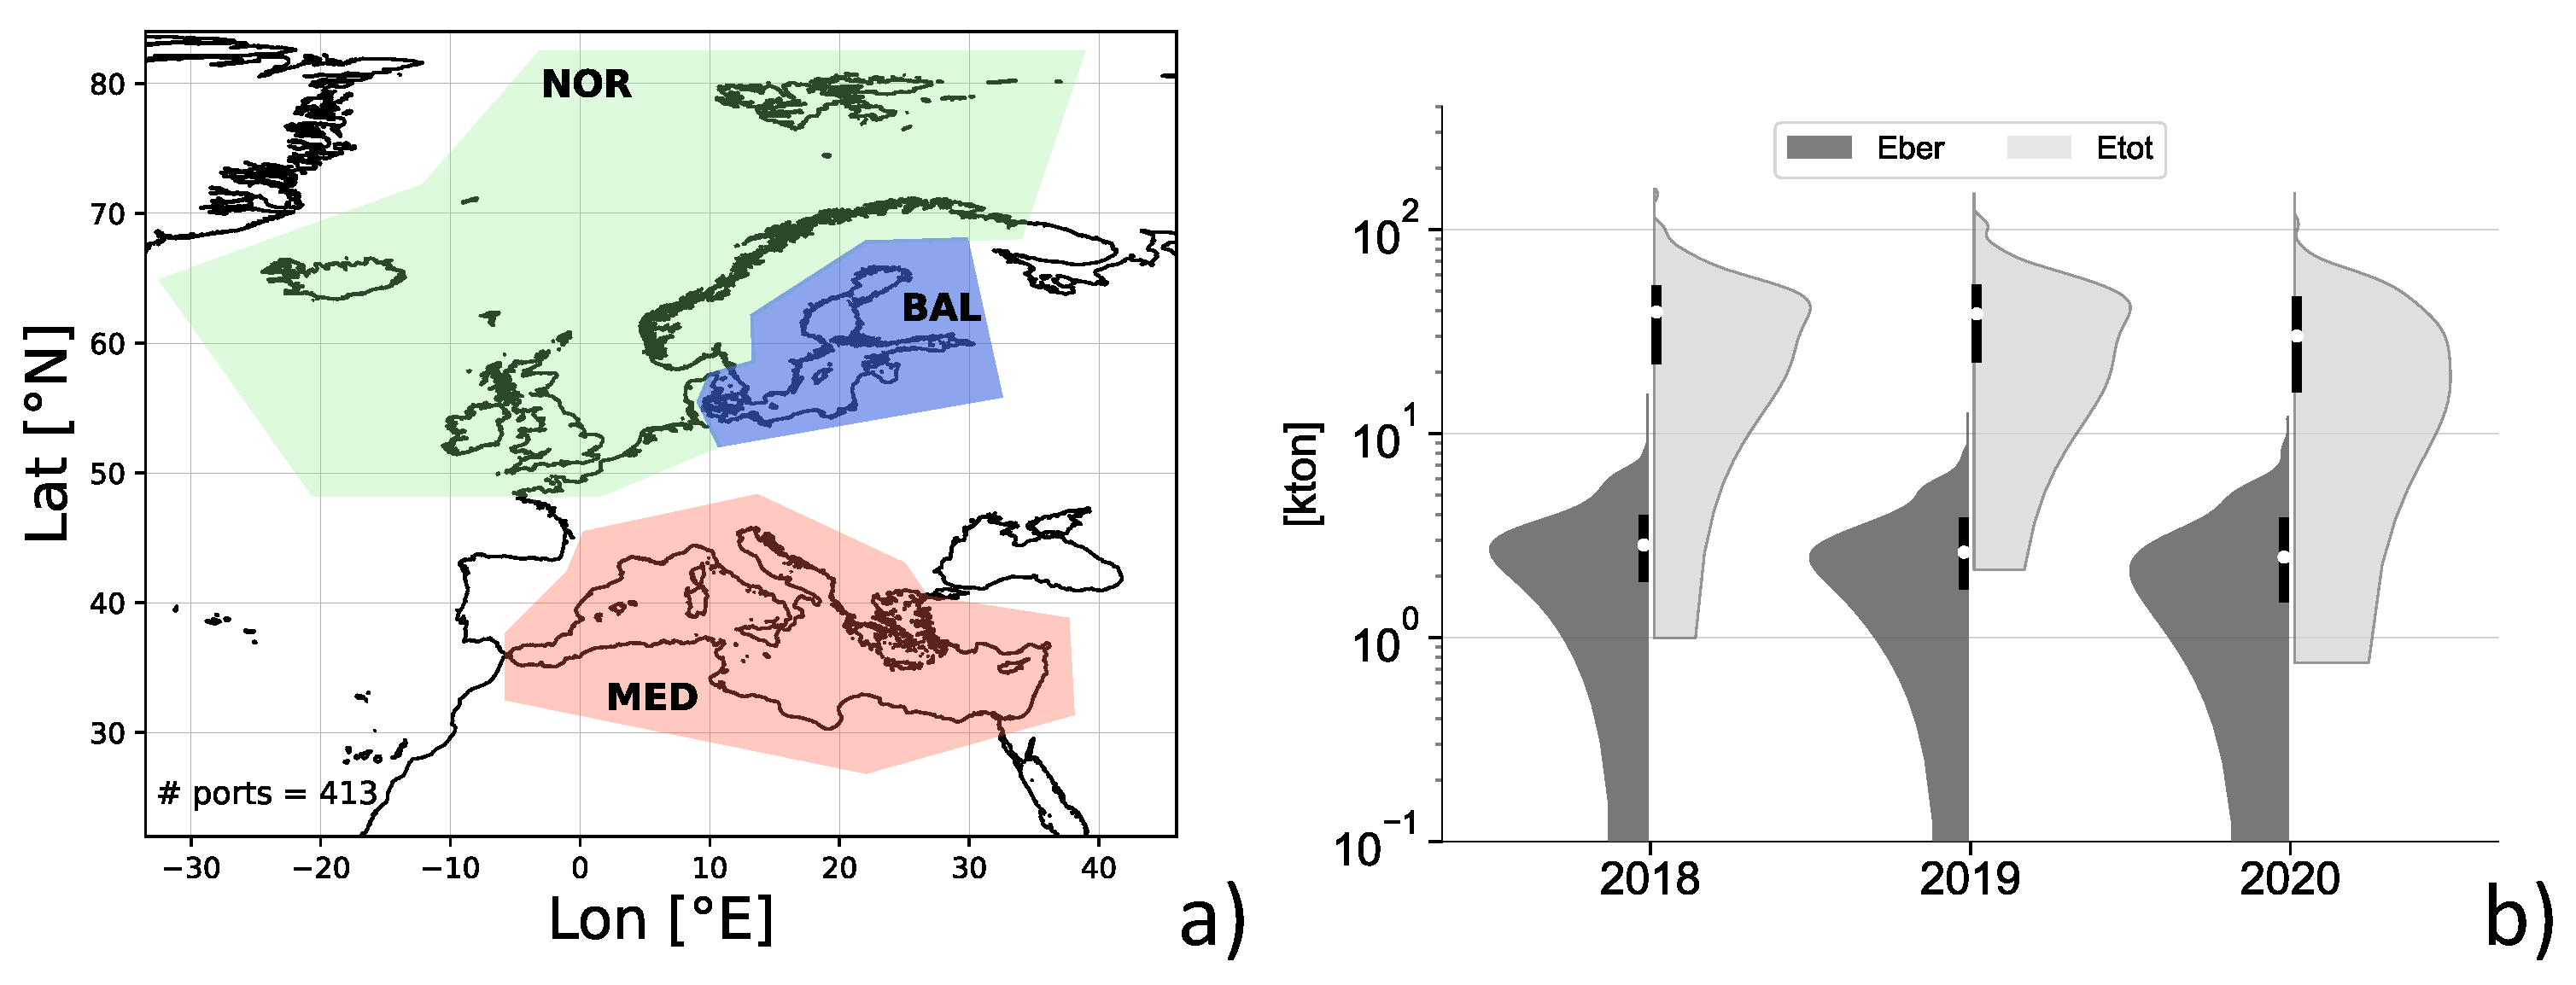
(ii) Vessels are assigned to one of the three European basins of Figure 3a (Dom categorical variable with the values of Baltic, Mediterranean, or North Sea) based on the location of its ports of call. These were obtained from the corresponding IHS database. A vessel was assigned to the domain where it made most of its calls in a specific year. The Black Sea and Atlantic Ocean were discarded due to a limited number of vessels sailing in those domains.
(iii) The port calls of each vessel for each of the three years 2018–2020 were added up into the nCalls variable.

4. Preliminary Analysis

This section provides a preliminary overview of the fleet’s characteristics and the impact of COVID on their CO 2 emissions.
The whole Ro-Pax fleet operating in the EEA is represented in Figure 2 and includes key propulsion and size parameters.
First, Figure 2a shows that the threshold at Fn = 0.4 suggested by [47] is effective in identifying the HSC cluster. For non-HSC vessels, the main engine power Pme involves a power–law dependence on the Froude number Fn. However, for any given Fn, Pme tends to increase with VType as defined by Equation (2). Thus, newer and larger vessels (tendency toward “jumboizing”, [14]) are generally powered by larger main engines. In addition, for a given Pme, newer vessels can sail at a larger Fn.
Figure 2b suggests that the power of the auxiliary engines Paux on average scales as Pme . The fuel consumption rate (i.e., the mass of fuel burned per hour, FuelC), however, is only weakly related to either Pme or Paux. This is likely due to the role played by the mass of fuel burned per work unit or a specific fuel consumption [48]. The CO 2 emission rate is then proportional to the fuel consumption.
Table 2 shows fleet-level aggregated figures. The non-HSC fleet accounts for around 11–13 Mton CO 2 of annual emissions. This would currently cost about EUR one billion in allowances when including shipping in the EU-ETS (see Section 2).
Table 2 shows that the CO 2 emissions at berth represent a minor proportion (less than one-tenth) of the total. However, these emissions occurred in ports, sometimes close to densely inhabited areas. CO 2 is not directly harmful to human health but could be a proxy for other noxious emissions such as particulate matter, sulfur oxides, and to some extent nitrates [20]. Thus, emissions at berth, although clearly smaller, are kept at the same level of detail of the total emissions throughout this paper.
The inter-annual changes of aggregated values can provide a preliminary sense of the impact of COVID. The total emissions from all non-HSC ferries of the EEA decreased by 2.6 Mton from 2019 to 2020, and corresponding emissions at berth were 74 kton lower, as also shown in Table 2.
The distributions of the per-ship emissions in 2018–2020 are provided in Figure 3b. A change in shape can be observed, particularly for the distribution of Etot in 2020, which is broader than in previous years and includes a fatter low-emissions tail.
A reduction is observed for both emission variables at the transition from 2018 to 2019, but this was only statistically significant from 2019 to 2020, with Etot falling by nearly 15% and Eber by 6% (Table 4). The number nCalls of per-ship annual port calls was stable from 2018 to 2019 but then decreased by about 7% in 2020, which is highly significant. The values from Table 4 are per-ship median figures for non-HSC only, in contrast with those reported in [8], which is likely an average value at the Ro-Pax fleet level.
All subsequent observations and findings in this paper refer to per-ship figures of the non-HSC fleet.
The statistical processing and significance testing of this section were performed in python, making use of the scipy.stats python library.

5. Methods

In this section, we describe the statistical modelling approach used for assessing the relationships between CO 2 emission variables and factors related to vessel type, domain, and activity.
A standard multiple regression is not adequate in this case due to the high temporal correlation of the residuals. In fact, the Pearson’s correlation coefficient of Etot over the three years 2018–2020 is about 0.9. Such a high correlation would make both standard errors (SE) and p-values unreliable. Therefore, a panel data approach using LME models was adopted [36,41], which can handle both ship-specific effects and interactions among predictors [37,38]. LME models not only allow us to address the time correlation of the data but also to reduce the residual variability, while accounting for the large heterogeneity of the fleet. Moreover, considering interaction terms in the LME models, we take advantage of the detailed description of the fleet structure given by the IHS dataset and can assess the impact of COVID from the perspective of research questions Q1–Q3 of Section 2.1.
To introduce the general form of the LME models for either Etot or Eber, let y i , t denote the generic CO 2 emissions of ship i = 1 , , n t in year t = 2018 ,   2019 ,   2020 . Thus, the model setup is given by:
y i , t = a i + β x i , t + ε i , t
where x i , t is the design vector including both categorical and numerical variables (COVID, VType, Dom, nCalls) and their interactions. The vector β contains the corresponding fixed effects, which are estimated using maximum likelihood. In addition, a i , i = 1 , , n t are the vessel-specific random intercepts given by independent, normal random variables with zero mean and a common variance. They account for the unobserved heterogeneity of the fleet and the correlation among the three years we consider. The residual error ε is assumed to be a Gaussian white noise with zero mean and constant variance independent of the random intercepts. This is checked later in Section 6.1.
To understand the optimality of models used in the results section, we considered 40 candidate models of Equation (3) type characterized by different x vectors, i.e., different subsets of predictors and their interactions. The complete list of models with their estimated terms and statistics is provided in the Supplementary Materials (S1 and S2). The 40 models are characterised by an increasing level of complexity, with the first 20 containing fixed effect models only and the remaining 20 also including a ship-specific random intercept term. In each of the two subsets, the first five models do not include VType as a predictor.
The LME model in Equation (3) could be extended to have one or more random slopes at the cost of simplicity of the model. A discussion of the effect of random slope on the selected model is deferred to Section 6.1.
Although prediction is not the main aim of this paper, we followed a modern data analysis approach ([49], Chapter 2) and considered the models’ prediction capability for a validation set in our model selection. According to this approach, the coefficients of each model were estimated using a training set, and the model forecast performance is assessed in a validation set.
We used the conditional root mean square error in the validation set (RMSEvC), i.e., the RMSE of the forecast obtained by conditioning on all data available. To obtain a more complete picture, we also used Akaike’s information criterion (AIC). According to the equifinality concept, [50], we considered a set of acceptable models instead of a single best one. Thus, we avoided automatic model selection and focussed on nearly best models, in which the above scores are very close to best. We then chose the model that most closely addressed the three research questions in Section 2.1.
Following the standard approach of ([49], Chapter 5) we conducted a k-fold cross-validation ( k = 10 ) to compute the RMSEvC. Figure 4 depicts the behaviour of AIC and RMSEvC for both emission types and shows that the random intercept reduces both scores. The presence of VType further improves these scores.
In terms of handling categorical variables, the LME models are based on the reference category, which throughout the paper corresponds to the VType = 0 vessels of the Baltic Sea in pre-COVID years (i.e., 2018 and 2019). This follows from the fact that, by default, the R language uses the alpha-numerically first category as a reference, which can be changed, as shown in the code in Appendix A.2.
The Δ z relative changes due to COVID for a categorical predictor z (i.e., a specific value of either VType or Dom) can be computed as
Δ z = β ^ C + β ^ C : z y ¯ z
where β ^ ’s are the estimated coefficients of the corresponding model terms, y ¯ z is the mean value of the emission variable in the z category before COVID, and C denotes COVID = 1. The uncertainties of the coefficients can be estimated through the SE. It is a quadratic form of the variance–covariance matrix of β :
SE 2 = J T Var [ β ] J
where J is a vector of zeros with one at the position of both the COVID and COVID:z terms. The uncertainty on Δ z is thus expressed as SE / y ¯ z .

6. Results

We discuss the results for the colour approach of Section 5 in this section. First, one of the 40 LME models is chosen (Section 6.1), and then we address its implications in terms of our research questions (Section 6.2).

6.1. Selected Model

The performance of the 40 models in terms of both the conditional RMSE in the validation set and AIC is provided in Figure 4.
Here we focus on model #30, which when using Wilkinson’s notation (https://it.mathworks.com/help/stats/wilkinson-notation.html, last accessed on 3 March 2022) reads:
y ( 1 | IMOn ) + COVID VType + COVID Dom + COVID nCalls
with y being either Etot or Eber. The first term denotes the vessel-specific random intercept. The remaining three summands represent linear terms in each of the predictors and in the COVID dummy variable and all interactions between COVID and the other predictors.
In Table 6, the estimates of model #30 for all the interaction terms with COVID are provided for both Etot and Eber. This table covers Q1-Q2-Q3 research questions by means of impact estimates and p-values as discussed below in Section 6.2. The table also shows that VType = 1 and 14 are only weakly represented due to conflicting parameters (such as low power and large hull). Full details of model #30, inclusive of the terms that do not interact with COVID, are provided in the Supplementary Materials (S3).
Model #30 is a quasi-optimal model in terms of AIC and RMSEvC. When considering Etot, it leads to an AIC of less than 0.1% off the minimum of all of the 40 tested models and a RMSEvC of less than 1.5% off the minimum. In addition, considering Eber, model #30 is less than 0.1% off the minimum AIC among all the 40 tested models and less than 2% off the minimum RMSEvC.
In Table 7, statistics of the residuals of model #30 are reported. Consistent with the heterogeneity of the spatio-temporal changes in ferry activity during the pandemic, their standard deviation in 2020 is larger than before for both Etot and Eber. In addition, the skewness is mildly different from zero, particularly for Eber, and the kurtosis is larger than three before COVID. Thus, a moderate non-normality and a moderate heteroskedasticity characterize the residuals. Nevertheless, we believe the sample size is large enough for an approximated asymptotic normality of the estimates and a correct interpretation of p-values.
From Table 7, one could also observe that the difference in residual variances before and during COVID may hint at a random slope in model #30, given by ( 1 + COVID | IMOn ) . We considered this case, not reported here for brevity. The resulting model is similar to model #30 and does not affect its quasi-optimality. As expected, the residual variance is smaller, being captured by the random slope variance, but a level of heteroskedasticity close to that in Table 7 is still present, being only slightly alleviated by the additional random component. Also, fixed effect estimates and their p-values are approximately the same as model #30, and the conclusions are substantially unchanged.

6.2. Research Questions Answered

As the COVID term in Table 6 shows, an overall reduction of CO 2 emissions in 2020 for all vessels is confirmed by LME model #30. A statistically significant change of −4169 (1620) t per ship is estimated for Etot, and a change is also observed for Eber, but this is not statistically significant. The specific changes in vessel type, sea domains, and ship activity (port calls) due to COVID are presented in the following three subsections.

6.2.1. Role of Vessel Type (Q1)

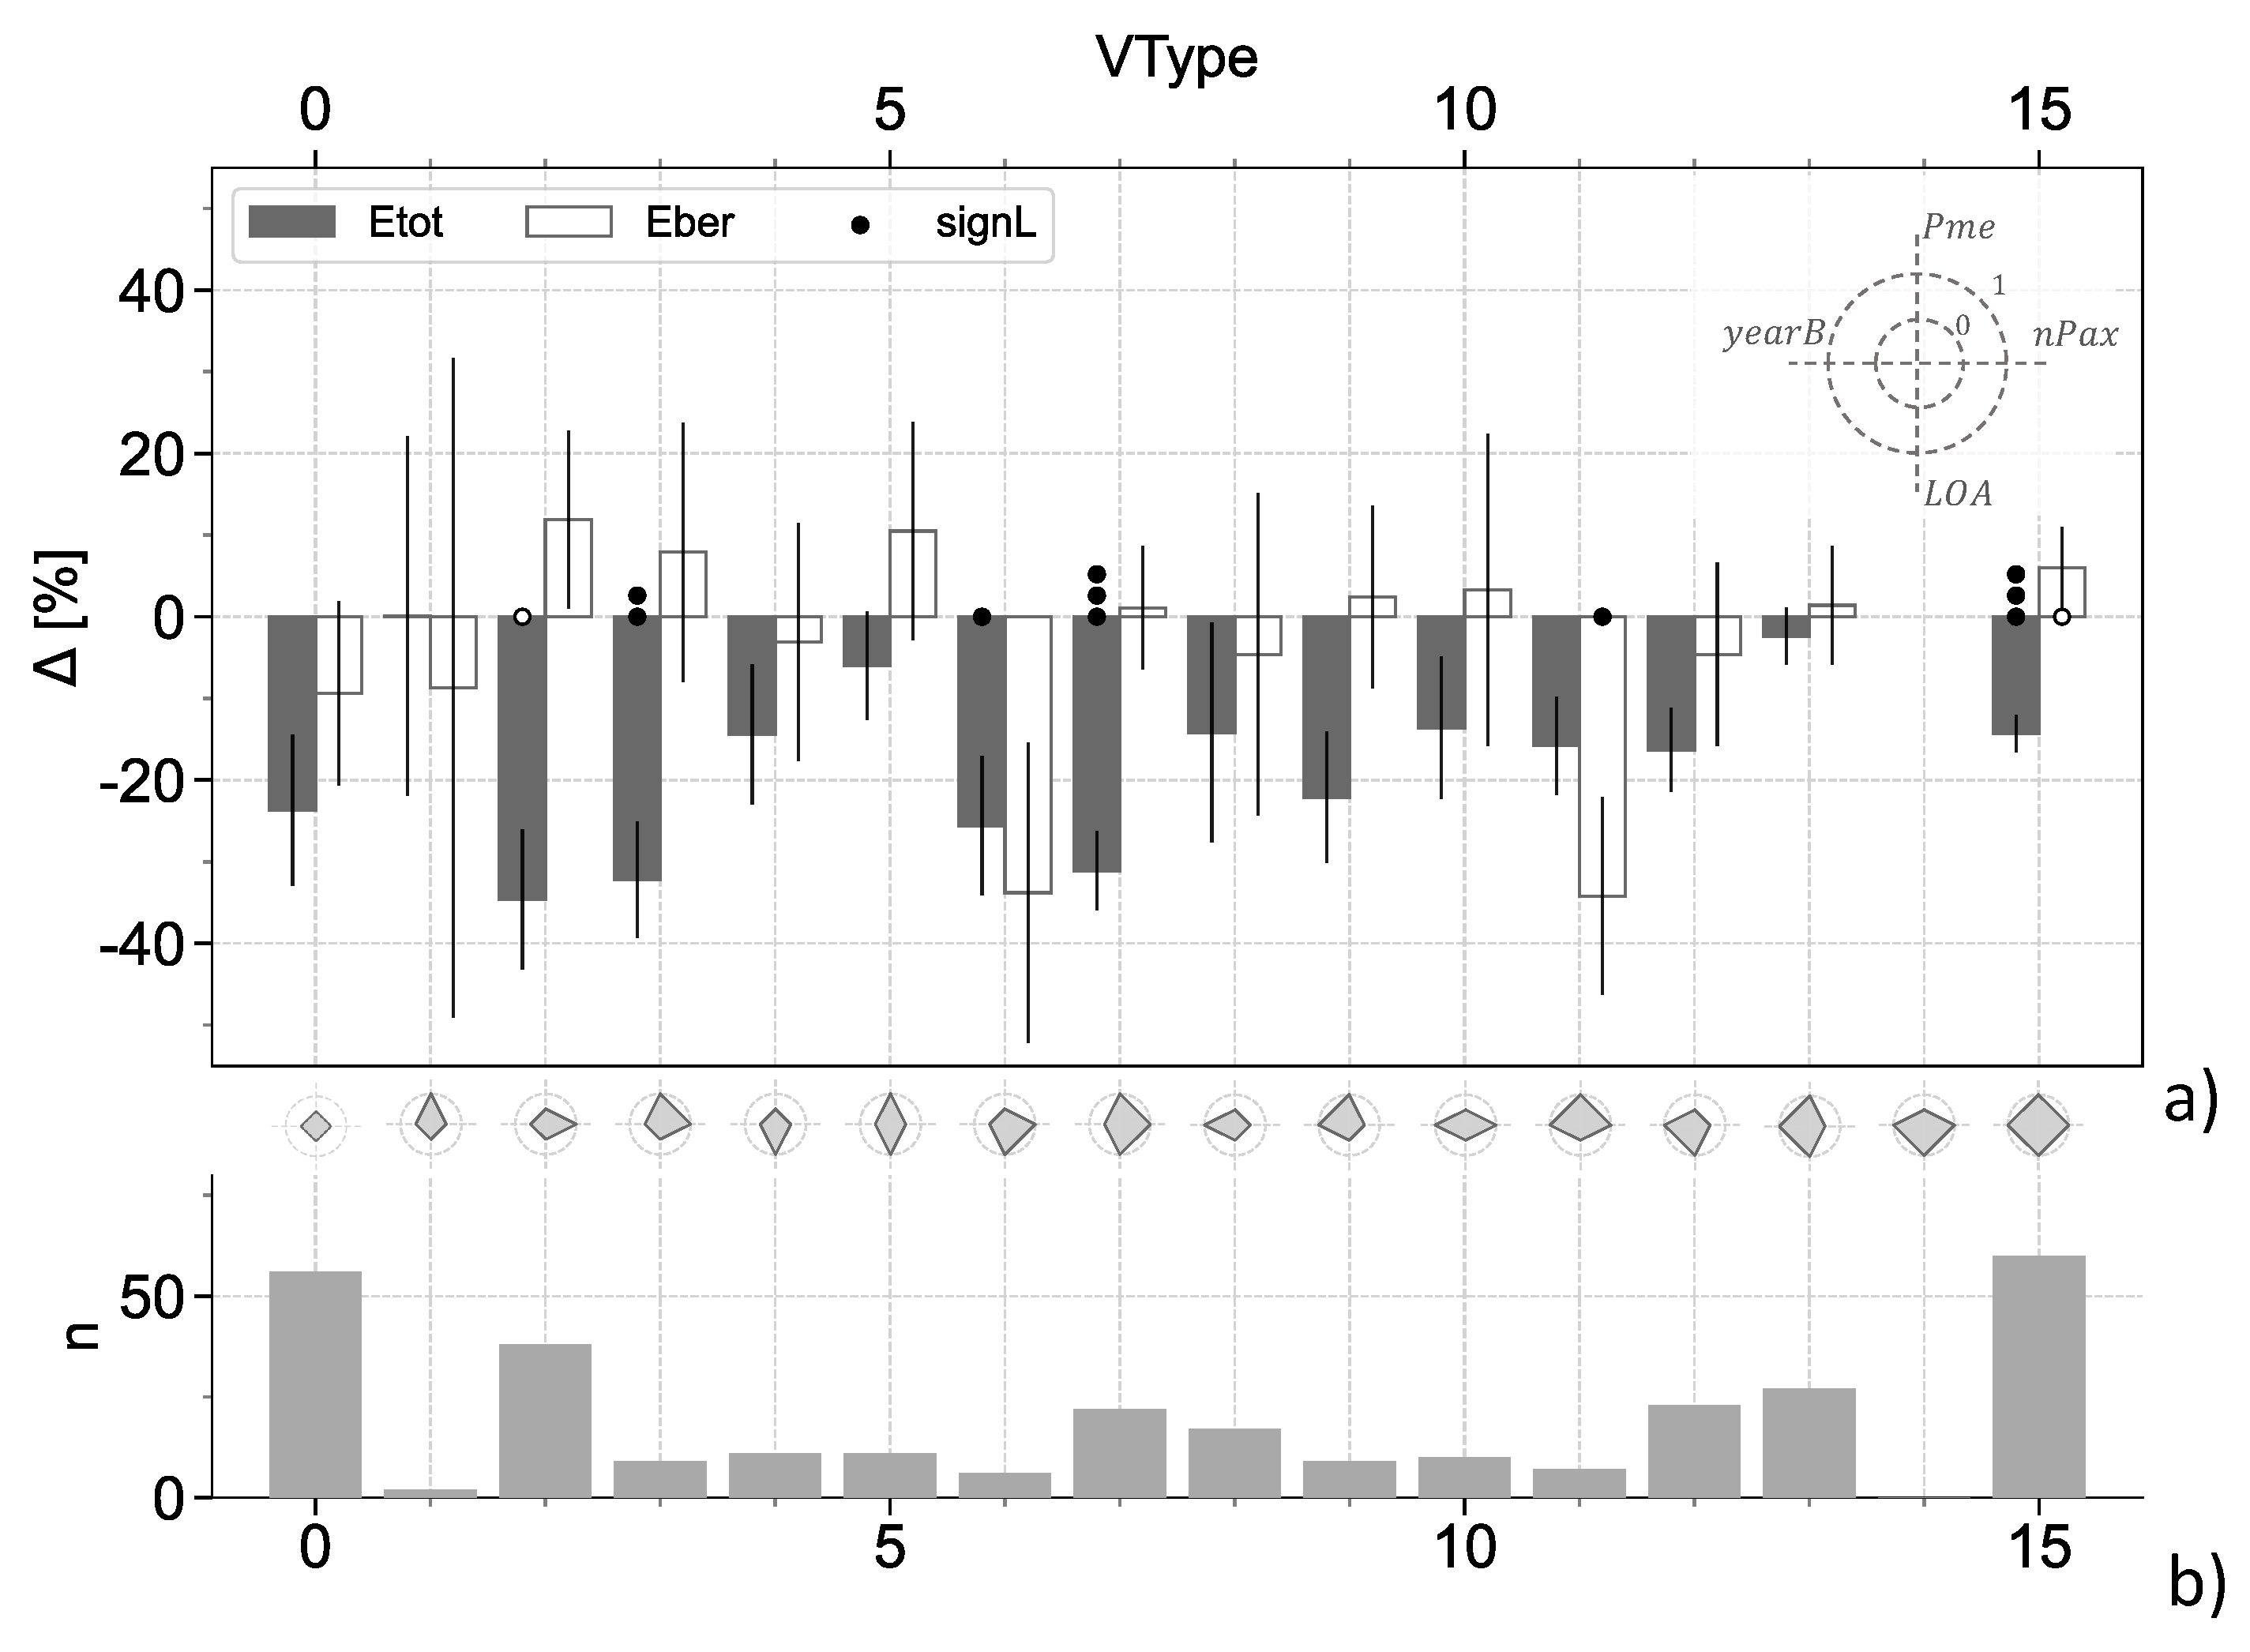
During the COVID year (2020), some ferry types showed statistically significant additional reductions of Etot with respect to the reference category, i.e., VType = 2, 3, 6, 7, and 15. In addition to the reference (VType = 0), the categories 15, 2, and 7 included the greatest number of ships. These are all high-passenger capacity ferries. Two ferry types (7 and 15) experienced highly significant emission reductions. Using Equations (4) and (5), we found (cf. the Supplementary Materials, S3) that their total changes exceeded −31 (5)% (VType = 7, ships built up to 1999) and −14 (2)% (VType = 15, new builds) compared to pre-COVID mean values.
However, for Eber, Table 6 shows that only VType = 11 (large power, high capacity, short hull, new builds) deviated significantly with respect to the reference category, which represented a reduction of 1199 (484) t in unitary CO 2 emissions. A slightly significant increase with respect to the reference occurred for VType = 15, which differs from the previous class only in terms of longer hulls. The unitary emission changes of these two ferry types were −34 (12) and +6 (5)%, respectively. Most of the other types of ferries increased their unitary emissions at berth.
For both Etot and Eber, the relative changes with respect to the reference category are reported in Figure 5. The changes are associated to the vessel types via radarplots. We can also observe how the uncertainty in the statistical estimates relates to the number of vessels in each class.

6.2.2. Role of Sea Basin (Q2)

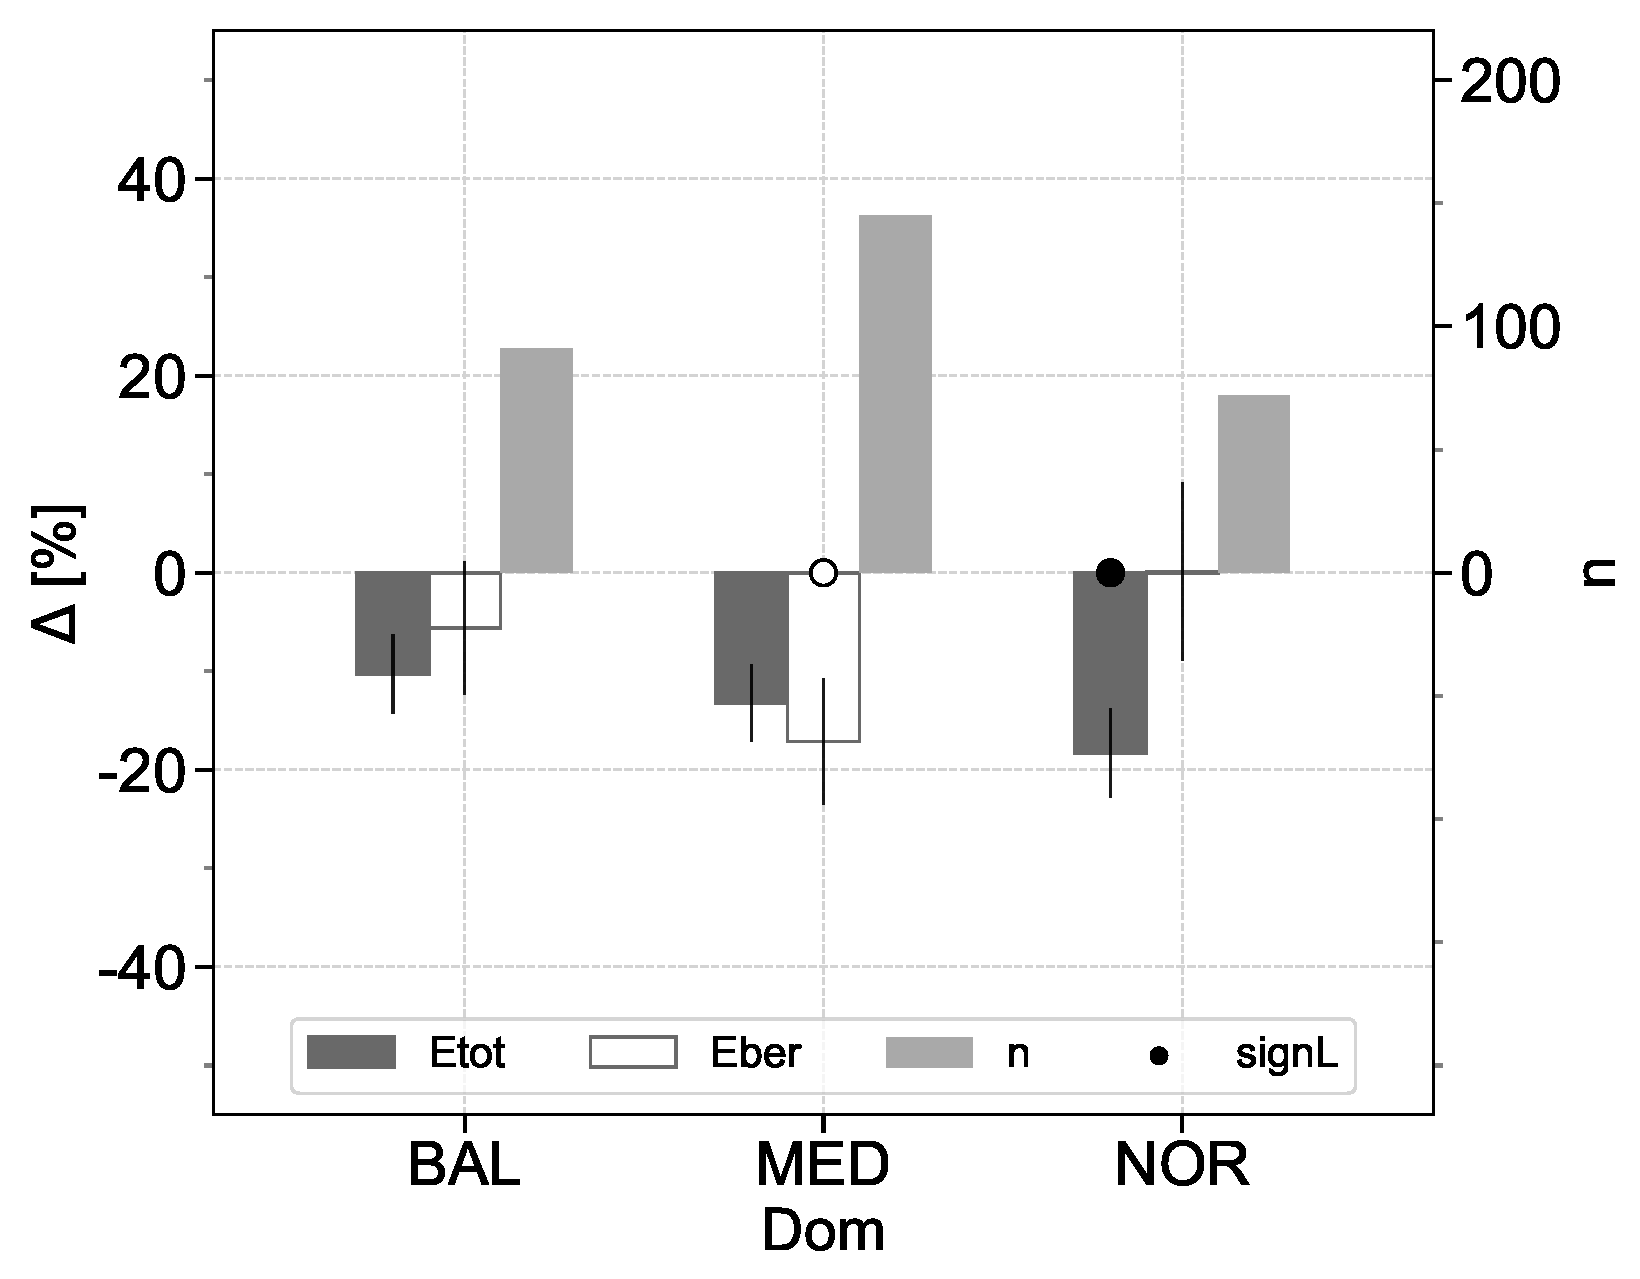
During the COVID year, only the North Sea ferries displayed an additional and statistically significant reduction of Etot with respect to the reference category, reaching a total change Δ C : N O R of −18 (5)%.
When we consider Eber, Mediterranean and North Sea ferries behaved differently from the reference category of the Baltic Sea (i.e., VType = 0 ferries of pre-COVID years). In the North Sea, emissions slightly increased, but this was not statistically significant, while in the Mediterranean Sea the unitary emissions changed by −17 (6)%, which was slightly significant. This drop can mainly be ascribed to the emission reductions from vessels of VType = 11 (cf. Section 6.2.1), which were all sailing in the Mediterranean Sea.
The greater significance of the reduction of Etot in the North Sea compared to the reduction of Eber in the Mediterranean is mirrored by the size of the uncertainties as illustrated in Figure 6.

6.2.3. Role of Port Calls (Q3)

The estimate of the COVID : nCalls model term represents the Etot / nCalls partial derivative. For this, model #30 identifies a value that was close to zero before COVID, within the confidence interval of 0.7 (0.8) ton per call, see the Supplementary Materials (S3). During 2020, the value increased to 1.1 (0.6) ton per port call, although this was below the threshold of statistical significance.
This additional contribution from the maneuvering operations next to ports can be compared to the CO 2 emissions during one hour of navigation of the smaller ferries. In fact, the hourly emissions of the non-HSC ranged between about 2 and 25 ton for the values in Figure 2b and for typical hydrocarbon fuels (This implies an emission factor ∼3 g/g, [51]). However, more data regarding ship movements and emissions on a voyage basis will be required to gain a deeper understanding of the effects of port calls on the total emissions during COVID.
Emissions at berth, Eber, do not by definition include the port call operations. Their dependence on nCalls is consistently found to be null within the uncertainty.

7. Discussion

7.1. Data Availability

As anticipated in Section 2.1, data availability defined the scope of this work. It enabled a top-down study of the regional impact of COVID on CO 2 emissions from ferries, i.e., a study based on direct emission estimates through one of the four monitoring methods of THETIS. In contrast, bottom-up studies, such as for example [20,21,52], rely on an inventory of ship movements when colour their emissions. A top-down analysis of CO 2 maritime emissions is not possible for previous global shocks such as the 2008–2009 financial crisis [19]. At that time neither EU-MRV nor any other legislative framework for the collection of maritime emissions was in force anywhere in the world. COVID is therefore the first global shock in which both types of analysis can be conducted for ship emissions. This has the potential to lead to higher quality findings when assessing the role of COVID on maritime transport.
However, while the EU-MRV regulation requires a per-voyage monitoring, the published data are aggregated on a yearly basis. This fact makes it difficult to assess how the CO 2 emissions were influenced, e.g., by the actual stringency of the COVID containment measures [15,22] or by the actual meteocean conditions along the voyages. Apart from commercial considerations, the route decided by the shipmaster may also be determined by the avoidance of rough seas or adverse currents [30,43,44]. Even if the actual voyage profiles are used (as in [15,17]), comparing them to voyage-level CO 2 emission data would not be possible, as they are not published by THETIS. In an opposite scenario, with full availability of sub-voyage resolution data, it was even possible to state if the emissions were in line with the observed meteocean conditions [53,54]. The lack of per-voyage basis resolution in the published THETIS dataset may prevent an independent verification of the progress of shipping toward higher carbon efficiency. We note that in the EU-MRV regulation, emission monitoring is the first required step in view of subsequent mitigation policies [9]. The present work provides a deeper understanding of the monitored emission data and their relationship with an external shock such as COVID.

7.2. Emissions at Berth

The observation of an opposite trend for the emissions at berth among new vessels with large power and high-passenger capacity, depending on their hull length, may be somewhat surprising. The unitary emissions of shorter vessels (VType = 11) decreased by 34%, while in longer vessels (VType = 15) they increased by 6% compared to the reference category. In our analysis, these two categories are only differentiated by LOA/ nPax, which can be regarded as a proxy of the space available per passenger.
These findings may be related to different practices of managing the idle time at berth during the restrictions due to the pandemic. The two main options available are (https://bit.ly/DNVlayup, last accessed on 3 March 2022) first, keeping a vessel and its machinery at a reduced but still operational level (hot lay-up), or second, switching it off completely and leaving it without a crew onboard (cold lay-up). Hot lay-up is suitable for vessels kept out of service for short times (3–12 months), while cold lay-up is an exceptional measure that only applies to assets likely to be out of service for an extended period, for example with a view to upgrading or dry-docking them.
Thus, the observation that the low LOA/ nPax ferries (VType = 11) underwent a decrease of emissions at berth is consistent with a cold lay-up. These ferries could have had less of a commercial appeal due to inferior services (less space available per person) and higher operational costs (high fuel consumption). Thus, their owners may have decided to lay them up cold to mitigate their economic losses during the pandemic. More data are needed to confirm this hypothesis, though.

8. Conclusions

We conducted a statistical analysis of CO 2 emissions from ferries sailing in the EEA during the 2018–2020 period. This includes the first year that the restriction on mobility put in place to address the COVID pandemic had an impact. By using both publicly available, yearly aggregated emission data and two commercial databases of vessel features and activity, we addressed the question of characterising the impact of the pandemic on ferry CO 2  emissions.
We focussed on two outcome variables: total emissions and emissions at berth, both at a per-ship level, and we used the sea basin, the number of port calls, and a compound indicator of the vessel type as predictor variables. The statistical analysis was based on mixed-effects linear modelling, which was able to identify the influence of COVID on both the predictors and the outcome variables.
A generalized and statistically significant reduction of total emissions at ship level was found in 2020. In addition, specific variations for 16 ferry subtypes and three sea domains were identified, with some of them experiencing a statistically significant reduction compared to a specific reference category.
In particular, we found that the emissions from large ferries with main engine power above 22 MW, more than 1250 passengers, and hulls longer than 174 m significantly differed from the general trend of reduction. Out of these, ferries built after 1999 had an additional per-ship reduction of 14%, while the older ferries were 31% below the reference category.
In terms of the unitary emissions at berth, significant differences were only found for high-power, high-passenger capacity new ferries. Those shorter than 174 m experienced a COVID-related variation of −31%, while longer vessels increased by 6%. We guess that these opposite outcomes are related to different lay-up practices.
Ferries operating in either the Baltic or the Mediterranean Seas experienced comparable reductions of their unitary emissions, but those from ferries of the North Sea decreased significantly more, reaching −18% of the total change in per-ship total emissions. Ferries at berth in the Mediterranean Sea reduced their unit emissions by 17%.
The absolute number of port calls decreased, but each accounted for a proportion of CO 2 emissions (about 1 ton per call) that in 2020 was larger than during the pre-COVID years.
These results based on LME models might be compared with other approaches on the same dataset made available in Appendix A.1 through this paper. In addition, provided the required people mobility and economic data, the present framework might be useful for assessing the impacts of COVID on the part of the touristic industry relying on ferries.
Our contribution makes use of data collected from the EU-MRV regulation to distinguish the role of COVID in the observed emission reductions. If and when shipping emissions will be part of a market-based measure such as the EU-ETS, it might be important to have a capacity of distinguishing emission reductions from sustainable technology and operational choices from those induced by macroeconomic shocks. A framework such as the one developed in this manuscript may help in this task.
In addition to CO 2 emissions, the emissions per mile and other Carbon Intensity Indicators (CIIs) are important metrics too, being embedded into a measure recently adopted by the IMO for decarbonisation of shipping in the short term [34,48]. The Fourth IMO GHG study indicated a slow reduction trend for CIIs of the global ferry fleet in the years 2012–2018 [34]. The THETIS dataset includes, also for the Ro-Pax ships, several types of CIIs. The initial guess would be that these variables, being scaled to ferry transport work, do not carry a specific signature of COVID. However, the CIIs might reveal unexpected information when investigated via the current modelling framework, and this is also left for future work.
The total emissions of the non-HSC fleet decreased by 2.6 Mton CO 2 from those of 2019, which is a 19% reduction on a year-to-year basis. This came at the cost of great human suffering and an economic downturn. These reductions are not even expected to contribute to pushing shipping toward a different emission trajectory in the medium term, as signals of rebound are already emerging (http://emsa.europa.eu/csn-menu/items.html?cid=14&id=4436, last accessed on 3 March 2022) [26,55]. Rather, the observed emission reductions are due to a combination of multiple variables that affect ferry operations (vessel type, sea domain, port calls) and their interactions with the changes in activity resulting from the restrictions put in place to address the first waves of the pandemic.
In our study, we use the interaction terms in linear mixed-effects models to provide a rigorous methodological framework for assessing any causal relationship between COVID and CO 2 emissions. The method is general and could be used in combination with other ferry classification criteria (e.g., annual revenues, lane-meter capacity, or bed capacity), or for investigating the impact of COVID on different emission variables (such as the carbon intensity indicators). The approach of this paper can also be applied to identifying the trends of maritime emissions after future unpredictable shocks, such as new pandemics, recession periods, financial crises, political instabilities and conflicts, technological changes in the energy supply chain, or extreme events triggered by climate change.

Supplementary Materials

The following supporting information can be downloaded at https://www.mdpi.com/article/10.3390/su14095287/s1: S1, The 40 LME models for Etot; S2, The 40 LME models for Eber; S3, Featured results for just LME model #30, for both Etot Eber.

Author Contributions

Conceptualization: G.M., A.F., M.L.S.; Methodology: G.M., A.F.; Software: M.L.S., L.C.; Investigation: M.L.S.; Writing—Original Draft: G.M., A.F., M.L.S.; Writing—Review & Editing: G.M., A.F.; Visualization: M.L.S., L.C.; Supervision: G.M.; Project administration: G.M. All authors have read and agreed to the published version of the manuscript.

Funding

This work was supported by the European Regional Development Fund through the Italy-Croatia Interreg programme, project GUTTA, grant number 10043587.

Data Availability Statement

Both input dataset and source code are openly made available with licences specified at their publication web pages, see Appendix A.

Conflicts of Interest

The authors declare no conflict of interest.

Abbreviations

The following abbreviations were used in this manuscript:
AICAkaike’s information criterium
AISAutomatic Identification System
CO 2 carbon dioxide
COVIDcoronavirus disease of 2019
EMSAEuropean Maritime Safety Agency
EUEuropean Union
EU-MRVEU Monitoring Reporting Verification
GHGgreenhouse gas(es)
GTGross Tonnes (a vessel’s size metric)
HSChigh speed craft
IMOInternational Maritime Organization
LMElinear-mixed effects
RMSEvCconditional root mean square error of the validation set
Ro-Paxroll-on/roll-off passenger ship
SEstandard error

Appendix A

Appendix A.1. Input Dataset

The “COVID-CO2-ferries” dataset (created from both THETIS and IHS sources described in Section 3) which was used as an input for the processing of Section 5, is published at https://doi.org/10.5281/zenodo.6473158, (last accessed on 3 March 2022).

Appendix A.2. Source Code

The results in Section 5 refer to LME models without and with random intercept. The computations without the random intercept were performed through the statsmodels python library (https://www.statsmodels.org/dev/generated/statsmodels.regression.linear_model.OLS.html, last accessed on 3 March 2022). The computations with random intercept were performed in R through the pymer4 wrapper for python [56] making use of R-CRAN libraries (https://cran.r-project.org/web/packages/lme4/index.html, last accessed on 3 March 2022). For both, the source code is published as a Jupyter notebook at https://github.com/hybrs/COVID-CO2-ferries (last accessed on 3 March 2022).

References

  1. Pan, Y.; Darzi, A.; Kabiri, A.; Zhao, G.; Luo, W.; Xiong, C.; Zhang, L. Quantifying human mobility behaviour changes during the COVID-19 outbreak in the United States. Sci. Rep. 2020, 10, 20742. [Google Scholar] [CrossRef] [PubMed]
  2. Le Quéré, C.; Peters, G.P.; Friedlingstein, P.; Andrew, R.M.; Canadell, J.G.; Davis, S.J.; Jackson, R.B.; Jones, M.W. Fossil CO2 emissions in the post-COVID-19 era. Nat. Clim. Chang. 2021, 11, 197–199. [Google Scholar] [CrossRef]
  3. Menut, L.; Bessagnet, B.; Siour, G.; Mailler, S.; Pennel, R.; Cholakian, A. Impact of lockdown measures to combat COVID-19 on air quality over western Europe. Sci. Total Environ. 2020, 741, 140426. [Google Scholar] [CrossRef]
  4. Ropkins, K.; Tate, J.E. Early observations on the impact of the COVID-19 lockdown on air quality trends across the UK. Sci. Total Environ. 2021, 754, 142374. [Google Scholar] [CrossRef]
  5. Guan, D.; Wang, D.; Hallegatte, S.; Davis, S.J.; Huo, J.; Li, S.; Bai, Y.; Lei, T.; Xue, Q.; Coffman, D.; et al. Global supply-chain effects of COVID-19 control measures. Nat. Hum. Behav. 2020, 4, 577–587. [Google Scholar] [CrossRef]
  6. Moriarty, L.F.; Plucinski, M.M.; Marston, B.J.; Kurbatova, E.V.; Knust, B.; Murray, E.L.; Pesik, N.; Rose, D.; Fitter, D.; Kobayashi, M.; et al. Public health responses to COVID-19 outbreaks on cruise ships—Worldwide, February–March 2020. Morb. Mortal. Wkly. Rep. 2020, 69, 347. [Google Scholar] [CrossRef]
  7. UNCTAD. COVID-19 and Maritime Transport Impact and Responses; Transport and Trade Facilitation 15; United Nations: New York, NY, USA, 2021. [Google Scholar]
  8. EMSA. COVID-19—Impact on Shipping; Technical Report; European Maritime Safety Agency: Lisbon, Portugal, 2021. [Google Scholar]
  9. EU. Regulation 2015/757 of 29 April 2015 on the Monitoring, Reporting and Verification of Carbon Dioxide Emissions from Maritime Transport, and Amending Directive 2009/16/EC; Technical Report; European Parliament and the Council: Strasbourg, France, 2015. [Google Scholar]
  10. Chowdhury, R.B.; Khan, A.; Mahiat, T.; Dutta, H.; Tasmeea, T.; Binth Arman, A.B.; Fardu, F.; Roy, B.B.; Hossain, M.M.; Khan, N.A.; et al. Environmental externalities of the COVID-19 lockdown: Insights for sustainability planning in the Anthropocene. Sci. Total Environ. 2021, 783, 147015. [Google Scholar] [CrossRef]
  11. Rutz, C.; Loretto, M.C.; Bates, A.E.; Davidson, S.C.; Duarte, C.M.; Jetz, W.; Johnson, M.; Kato, A.; Kays, R.; Mueller, T.; et al. COVID-19 lockdown allows researchers to quantify the effects of human activity on wildlife. Nat. Ecol. Evol. 2020, 4, 1156–1159. [Google Scholar] [CrossRef]
  12. Angrist, J.D.; Krueger, A.B. Instrumental variables and the search for identification: From supply and demand to natural experiments. J. Econ. Perspect. 2001, 15, 69–85. [Google Scholar] [CrossRef] [Green Version]
  13. Marzano, V.; Tocchi, D.; Fiori, C.; Tinessa, F.; Simonelli, F.; Cascetta, E. Ro-Ro/Ro-Pax maritime transport in Italy: A policy-oriented market analysis. Case Stud. Transp. Policy 2020, 8, 1201–1211. [Google Scholar] [CrossRef]
  14. Wergeland, T. The Blackwell Companion to Maritime Economics; Ferry Passenger Markets; Wiley-Blackwell Publishing: Oxford, UK, 2012; Chapter 9; pp. 161–183. [Google Scholar]
  15. March, D.; Metcalfe, K.; Tintoré, J.; Godley, B.J. Tracking the global reduction of marine traffic during the COVID-19 pandemic. Nat. Commun. 2021, 12, 2415. [Google Scholar] [CrossRef] [PubMed]
  16. Cacciapaglia, G.; Cot, C.; Sannino, F. Multiwave pandemic dynamics explained: How to tame the next wave of infectious diseases. Sci. Rep. 2021, 11, 6638. [Google Scholar] [CrossRef] [PubMed]
  17. Millefiori, L.M.; Braca, P.; Zissis, D.; Spiliopoulos, G.; Marano, S.; Willett, P.K.; Carniel, S. COVID-19 impact on global maritime mobility. Sci. Rep. 2021, 11, 18039. [Google Scholar] [CrossRef] [PubMed]
  18. UNCTAD. Review of Maritime Transport 2021; Technical Report; United Nations: New York, NY, USA, 2021. [Google Scholar]
  19. Notteboom, T.; Pallis, T.; Rodrigue, J.P. Disruptions and resilience in global container shipping and ports: The COVID-19 pandemic versus the 2008–2009 financial crisis. Marit. Econ. Logist. 2021, 23, 179–210. [Google Scholar] [CrossRef]
  20. Durán-Grados, V.; Amado-Sánchez, Y.; Calderay-Cayetano, F.; Rodríguez-Moreno, R.; Pájaro-Velázquez, E.; Ramírez-Sánchez, A.; Sousa, S.I.V.; Nunes, R.A.O.; Alvim-Ferraz, M.C.M.; Moreno-Gutiérrez, J. Calculating a Drop in Carbon Emissions in the Strait of Gibraltar (Spain) from Domestic Shipping Traffic Caused by the COVID-19 Crisis. Sustainability 2020, 12, 10368. [Google Scholar] [CrossRef]
  21. Ju, Y.; Hargreaves, C.A. The impact of shipping CO2 emissions from marine traffic in Western Singapore Straits during COVID-19. Sci. Total Environ. 2021, 789, 148063. [Google Scholar] [CrossRef]
  22. Wang, C.; Li, G.; Han, P.; Osen, O.; Zhang, H. Impacts of COVID-19 on Ship Behaviours in Port Area: An AIS Data-Based Pattern Recognition Approach. IEEE Trans. Intell. Transp. Syst. 2022, 1–12. [Google Scholar] [CrossRef]
  23. Grythe, H.; Lopez-Aparicio, S. The who, why and where of Norway’s CO2 emissions from tourist travel. Environ. Adv. 2021, 5, 100104. [Google Scholar] [CrossRef]
  24. Chen, Q.; Ge, Y.E.; yip Lau, Y.; Dulebenets, M.A.; Sun, X.; Kawasaki, T.; Mellalou, A.; Tao, X. Effects of COVID-19 on passenger shipping activities and emissions: Empirical analysis of passenger ships in Danish waters. Marit. Policy Manag. 2022, 1–21. [Google Scholar] [CrossRef]
  25. Liu, Z.; Ciais, P.; Deng, Z.; Lei, R.; Davis, S.J.; Feng, S.; Zheng, B.; Cui, D.; Dou, X.; Zhu, B.; et al. Near-real-time monitoring of global CO2 emissions reveals the effects of the COVID-19 pandemic. Nat. Commun. 2020, 11, 5172. [Google Scholar] [CrossRef]
  26. Friedlingstein, P.; Jones, M.W.; O’Sullivan, M.; Andrew, R.M.; Bakker, D.C.E.; Hauck, J.; Le Quéré, C.; Peters, G.P.; Peters, W.; Pongratz, J.; et al. Global Carbon Budget 2021. Earth Syst. Sci. Data Discuss. 2021, 2021, 1–191. [Google Scholar] [CrossRef]
  27. Jackson, R.; Friedlingstein, P.; Le Quéré, C.; Abernethy, S.; Andrew, R.; Canadell, J.; Ciais, P.; Davis, S.; Deng, Z.; Liu, Z.; et al. Global fossil carbon emissions rebound near pre-COVID-19 levels. Environ. Res. Lett. 2022, 17, 031001. [Google Scholar] [CrossRef]
  28. IPCC. Sixth Assessment Report; Technical Report; IPCC: Geneva, Switzerland, 2021. [Google Scholar]
  29. Rehmatulla, N.; Calleya, J.; Smith, T. The implementation of technical energy efficiency and CO2 emission reduction measures in shipping. Ocean Eng. 2017, 139, 184–197. [Google Scholar] [CrossRef]
  30. Zis, T.P.; Psaraftis, H.N.; Ding, L. Ship weather routing: A taxonomy and survey. Ocean Eng. 2020, 213, 107697. [Google Scholar] [CrossRef]
  31. Lagouvardou, S.; Psaraftis, H.N.; Zis, T. A Literature Survey on Market-Based Measures for the Decarbonization of Shipping. Sustainability 2020, 12, 3953. [Google Scholar] [CrossRef]
  32. Lindstad, E.; Lagemann, B.; Rialland, A.; Gamlem, G.M.; Valland, A. Reduction of maritime GHG emissions and the potential role of E-fuels. Transp. Res. Part D Transp. Environ. 2021, 101, 103075. [Google Scholar] [CrossRef]
  33. IMO. MEPC.304(72) Initial IMO Strategy on Reduction of GHG Emissions from Ships; Technical Report Annex 11; International Maritime Organization: London, UK, 2018. [Google Scholar]
  34. IMO. MEPC 76/WP1/Rev.1 Draft Report of The Marine Environment Protection Committee On Its Seventy-Sixth Session; Technical Report; International Maritime Organization: London, UK, 2021. [Google Scholar]
  35. Panagakos, G.; Pessôa, T.d.S.; Dessypris, N.; Barfod, M.B.; Psaraftis, H.N. Monitoring the carbon footprint of dry bulk shipping in the EU: An early assessment of the MRV regulation. Sustainability 2019, 11, 5133. [Google Scholar] [CrossRef] [Green Version]
  36. Baltagi, B.H. Panel data methods. In Handbook of Applied Economic Statistics; CRC Press: Boca Raton, FL, USA, 1998; pp. 311–323. [Google Scholar]
  37. Fahrmeir, L.; Kneib, T.; Lang, S.; Marx, B. Regression models. In Regression; Springer: Berlin/Heidelberg, Germany, 2013; pp. 21–72. [Google Scholar]
  38. Zuur, A.; Ieno, E.N.; Walker, N.; Saveliev, A.A.; Smith, G.M. Mixed Effects Models and Extensions in Ecology with R; Springer Science & Business Media: Berlin/Heidelberg, Germany, 2009. [Google Scholar]
  39. Merkert, R.; Mulley, C. Chapter 18 - Panel Data in Transportation Research. In Panel Data Econometrics; Tsionas, M., Ed.; Academic Press: Cambridge, MA, USA, 2019; pp. 583–608. [Google Scholar]
  40. Lv, T.; Wu, X. Using Panel Data to Evaluate the Factors Affecting Transport Energy Consumption in China’s Three Regions. Int. J. Environ. Res. Public Health 2019, 16, 555. [Google Scholar] [CrossRef] [Green Version]
  41. Xu, L.; Shi, J.; Chen, J.; Li, L. Estimating the effect of COVID-19 epidemic on shipping trade: An empirical analysis using panel data. Mar. Policy 2021, 133, 104768. [Google Scholar] [CrossRef]
  42. Tianming, G.; Erokhin, V.; Arskiy, A.; Khudzhatov, M. Has the COVID-19 Pandemic Affected Maritime Connectivity? An Estimation for China and the Polar Silk Road Countries. Sustainability 2021, 13, 3521. [Google Scholar] [CrossRef]
  43. Poulsen, R.T.; Viktorelius, M.; Varvne, H.; Rasmussen, H.B.; von Knorring, H. Energy efficiency in ship operations—Exploring voyage decisions and decision-makers. Transp. Res. Part D Transp. Environ. 2022, 102, 103120. [Google Scholar] [CrossRef]
  44. Mannarini, G.; Carelli, L. VISIR-1.b: Ocean surface gravity waves and currents for energy-efficient navigation. Geosci. Model Dev. 2019, 12, 3449–3480. [Google Scholar] [CrossRef] [Green Version]
  45. Chu-Van, T.; Ristovski, Z.; Pourkhesalian, A.M.; Rainey, T.; Garaniya, V.; Abbassi, R.; Jahangiri, S.; Enshaei, H.; Kam, U.S.; Kimball, R.; et al. On-board measurements of particle and gaseous emissions from a large cargo vessel at different operating conditions. Environ. Pollut. 2018, 237, 832–841. [Google Scholar] [CrossRef] [PubMed] [Green Version]
  46. INTERFERRY. MEPC 76/7/14 Reduction of GHG Emissions from Ships; Technical Report; International Maritime Organization: London, UK, 2021. [Google Scholar]
  47. Grigoropoulos, G. Recent Advances in the Hydrodynamic Design of Fast Monohulls. Ship Technol. Res. 2005, 52, 14–33. [Google Scholar] [CrossRef]
  48. Mannarini, G.; Carelli, L.; Orović, J.; Martinkus, C.P.; Coppini, G. toward Least-CO2 Ferry Routes in the Adriatic Sea. J. Mar. Sci. Eng. 2021, 9, 115. [Google Scholar] [CrossRef]
  49. James, G.; Witten, D.; Hastie, T.; Tibshirani, R. An Introduction to Statistical Learning; Springer: Berlin/Heidelberg, Germany, 2013. [Google Scholar]
  50. Beven, K. Validation and Equifinality. In Computer Simulation Validation; Springer: Berlin/Heidelberg, Germany, 2019; pp. 791–809. [Google Scholar]
  51. Mannarini, G.; Carelli, L.; Salhi, A. EU-MRV: An analysis of 2018’s Ro-Pax CO2 data. In Proceedings of the 21st IEEE International Conference on Mobile Data Management (MDM), Versailles, France, 30 June–3 July 2020; pp. 287–292. [Google Scholar]
  52. Mocerino, L.; Quaranta, F. How emissions from cruise ships in the port of Naples changed in the COVID-19 lock down period. Proc. Inst. Mech. Eng. Part M J. Eng. Marit. Environ. 2021, 236, 125–130. [Google Scholar] [CrossRef]
  53. Capezza, C.; Centofanti, F.; Lepore, A.; Menafoglio, A.; Palumbo, B.; Vantini, S. Functional regression control chart for monitoring ship CO2 emissions. Qual. Reliab. Eng. Int. 2021. [Google Scholar] [CrossRef]
  54. Capezza, C.; Lepore, A.; Menafoglio, A.; Palumbo, B.; Vantini, S. Control charts for monitoring ship operating conditions and CO2 emissions based on scalar-on-function regression. Appl. Stoch. Model. Bus. Ind. 2020, 36, 477–500. [Google Scholar] [CrossRef]
  55. Gavalas, D.; Syriopoulos, T.; Tsatsaronis, M. COVID–19 impact on the shipping industry: An event study approach. Transp. Policy 2022, 116, 157–164. [Google Scholar] [CrossRef]
  56. Jolly, E. Pymer4: Connecting R and Python for linear mixed modeling. J. Open Source Softw. 2018, 3, 862. [Google Scholar] [CrossRef]
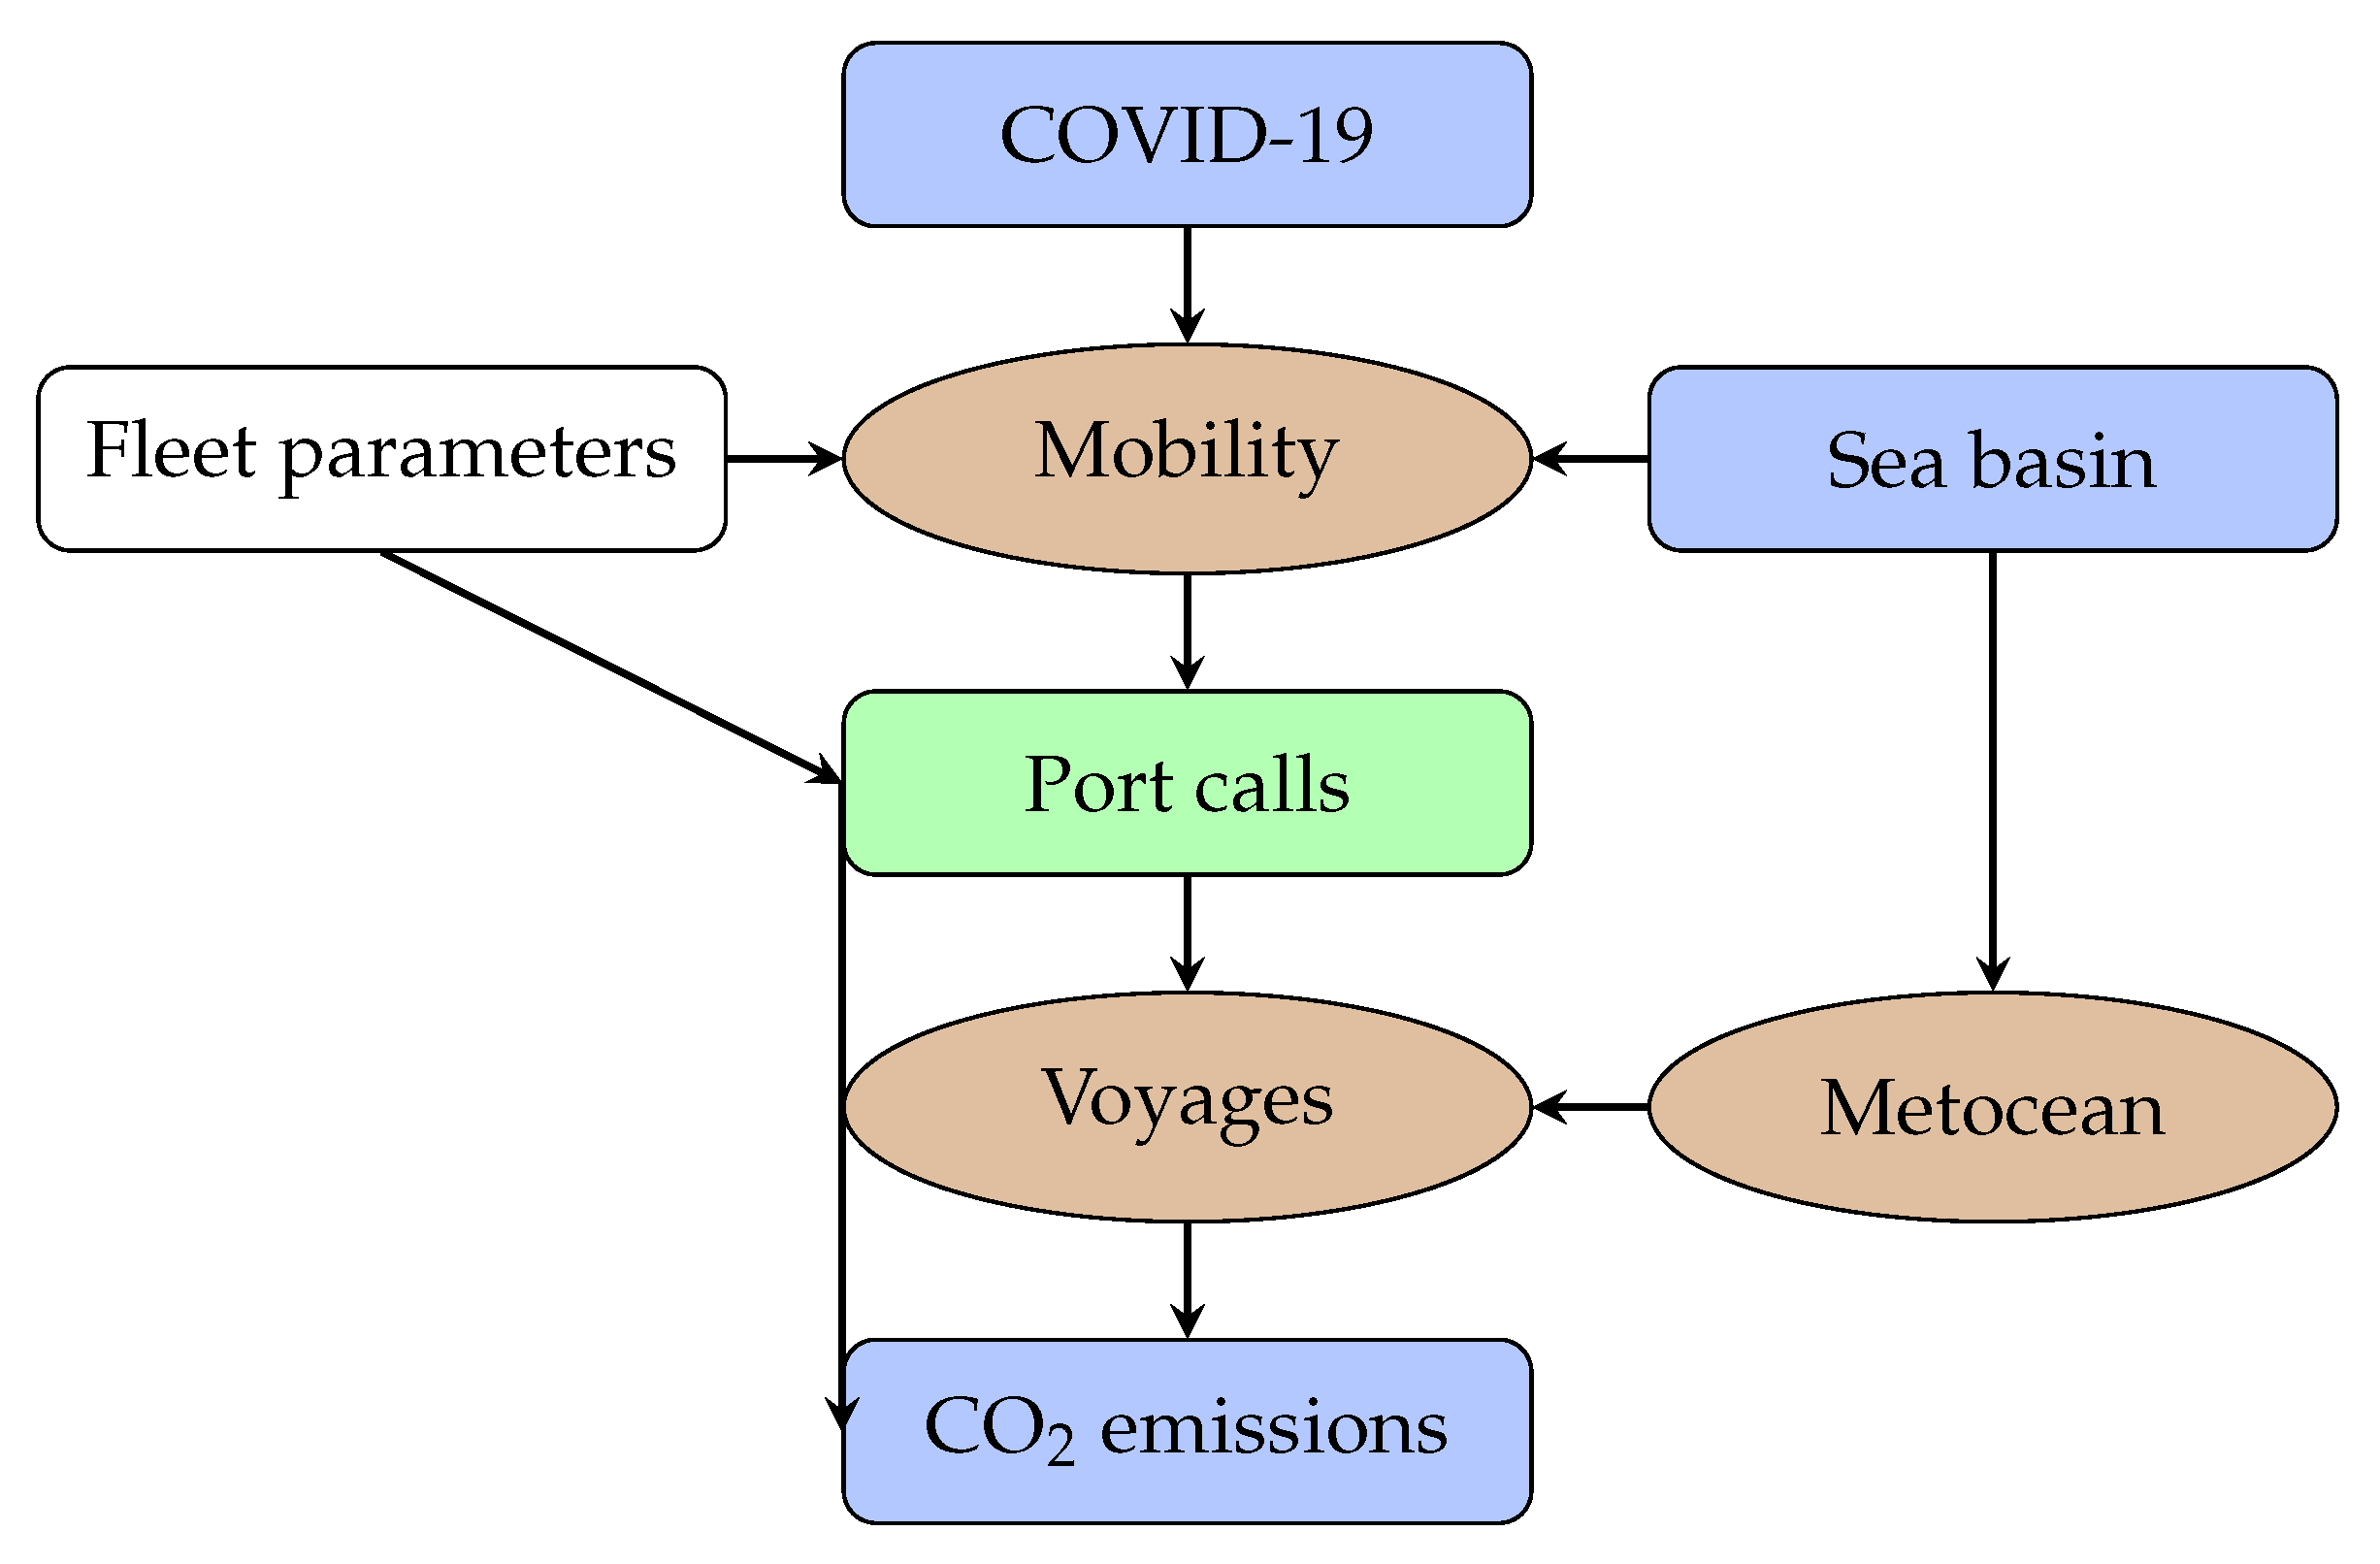
Figure 1. Data availability and causal graph of the CO 2 ferry emissions. Blue boxes represent data available at the yearly level; brown elliptical nodes denote voyage-level data not available for this study; the green box represents available data resolved at the level of individual voyages; the transparent box refers to constant parameters. The arrows link causes (tail) and effects (head).
Sustainability 14 05287 g001
Figure 2. Main engine power Pme of the EEA Ro-Pax ships: (a) vs. Froude number, with vessel type Equation (2) portrayed as marker feature (see inset), and the Pme threshold of Table 3 is given as a horizontal dashed line (HSC lay in the region to the right of the vertical dashed line); (b) vs. auxiliary engine power Paux, only for non-HSC, with marker colours indicating fuel consumption rates. Both panels are at the log-log scale and the slant dashed line is identified via least-square fits.
Sustainability 14 05287 g002
Figure 3. (a) Ports called at by ferries in 2018–2020 (markers) and the geographical regions considered (coloured areas); (b) Violin plots of Eber and Etot during the three years. The black cord at the edge of each half-violin spans the 95% confidence interval of the median, which is represented by the white dot.
Sustainability 14 05287 g003
Figure 4. Scores of the 40 candidate models for: (a) Etot; and (b) Eber. The chosen model (#30) is highlighted with a vertical dashed line. The conditional RMSE in the validation set and the AIC are shown as diamonds and circles, respectively. Their minimum values are indicated by filled markers.
Sustainability 14 05287 g004
Figure 5. Per-ship emission changes due to COVID with respect to the reference category (which includes VType = 0) for model #30: (a) Etot and Eber shown as dark and empty bars, respectively, with the lines centered at the top of the columns representing the 95% confidence intervals, and level of significance of β ^ VType represented as symbols (cf. Table 5); (b) number of vessels in each class (light grey bars), with VType decoded by the radar plots. Their legend is provided in the top-right corner of (a).
Sustainability 14 05287 g005
Figure 6. Per-ship emission changes due to COVID by Dom, for model #30. MED and NOR refer to the Mediterranean and North Sea, respectively, while the Baltic Sea (BAL) is part of the reference category. The shadings, lines, and symbols are as in Figure 5.
Sustainability 14 05287 g006
Table 1. Input datasets variables and additional variables used in this work.
DatasetSource VariableAcronymDescriptionUnits/Type
THETISIMO numberIMOnVessel unique identifier-
Total CO 2 emissionsEtotPer-ship total CO 2 emissions[ton]
CO 2 emissions which
occurred within ports under
a MS jurisdiction at berth
EberPer-ship CO 2 emissions at berth[ton]
IHSSpeedservicemaxVService speed[kts]
ConsumptionValue1FuelCFuel consumption rate[ton/h]
TotalKilowattsofMainEnginesPmeTotal power of main engines[kW]
TotalPowerOfAuxiliaryEnginesPauxPower of auxiliary engines[kW]
PassengerCapacitynPaxPassenger carrying capacity-
LengthOverallLOALOALength over all[m]
YearOfBuildyearBYear of building-
IHS-derivedseveralVTypeVessel type of Equation (2)[categorical]
Port Latitude/Longitude DecimalDomSea basin (BAL, MED, NOR)[categorical]
Call IDnCallsPer-ship number of port calls-
-COVIDDummy variable for year 2020[categorical]
Table 2. CO 2 emissions in the THETIS dataset. The Σ in front of the variables indicates that they are integrated across the fleet. The changes in emissions Δ refer to the previous year. Units are Mt. The number N of vessels in each dataset and the number of obvious outliers (cf. Section 3.2) are also given.
SubsetAllNon-HSC
Σ Etot Σ Eber N Σ Etot Δ Σ Eber Δ Σ nCalls Δ N Pruned
2018-v217142.198.7112,05913.03 0.96 231,332 3214
2019-v191146.39.2112,33613.530.51.010.05265,19333,8613458
2020-v62125.838.0911,67610.95−2.580.94−0.07230,626−34,5673254
Table 3. Threshold values for the predictors in VType, i.e., arguments of the Heaviside function in Equation (2).
k φ k φ k 0 Units
0Pme21,600kW
1nPax1250-
2LOA174m
3yearB1999-
Table 4. Per-ship values of emissions and number of port calls. The first three lines report the medians and the following two the median changes. The levels of significance of unidirectional tests are expressed via symbols in Table 5 in the “SignL” column. Wilkoxon’s unilateral tests were also conducted.
EtotnCallsEber
[ton][%]SignL[# per Ship][%]SignL[ton][%]SignL
201837,482 467 2779
201937,432 475 2621
202030,182 402 2474
2019 vs. 2018−480−1.700 −30−1.4
2020 vs. 2019−4418−15.4 −33−6.8 −104−5.9
Table 5. Upper threshold p-values for either bi- or unidirectional tests, with corresponding symbols and predicates.
SymbolpPredicate
biuni
0.080.04Nearly significant
0.050.0025Slightly significant
0.010.005Significant
0.0010.0005Highly significant
Table 6. Model #30: Fixed effects estimates for the interaction terms with COVID. For VType, the > symbol indicates that the corresponding variable is above the threshold of Table 3 and thus different from that in the reference category (VType = 0). The n 20 column gives the non-HSC counts in 2020. Full details of model #30 are reported in the Supplementary Materials (S3).
Etot n 20 Eber
β ^ [t]SE [t]signL β ^ [t]SE [t]signL
−41691620COVID308−180216
COVID : VType
β ^ [t]SE [t]signLVTypePmenPaxLOAyearB β ^ [t]SE [t]signL
---0----56---
42147526 1>---2−37.41,010
−351419552->--38458.2261
−96983249 3>>--9382.7433
−5523057 4-->-1197.9409
15682976 5>->-11481.3399
−816541396->>-6−827.4553
−96022296 7>>>-22220.7308
14502565 8--->1798.4343
−51163413 9>-->9275.1457
−9193210 10->->10255.5429
−55133624 11>>->7−1199484
−29562342 12-->>2355.3313
28432147 13>->>27228.3288
14->>>0
−61431719 15>>>>60447.5230
Total308
β ^ [t]SE [t]signLCOVID : Dom β ^ [t]SE [t]signL
---BAL91---
−6661327 MED145−332178
−35141590NOR72181212
β ^ [t]SE [t]signL β ^ [t]SE [t]signL
1.10.6 COVID : nCalls30800.1
Table 7. Statistics of the conditional residuals of the LME model #30 of Section 6 for vessels sailing during either 2018–2019 (ref.) or 2020 (COVID). The full dataset is used as learning data.
EtotEber
unitsref.COVIDref.COVID
nsamples-648308648308
std [ t o n ] 56676672793896
skewness-0.2−0.310.7
kurtosis-5.02.06.22.1
Publisher’s Note: MDPI stays neutral with regard to jurisdictional claims in published maps and institutional affiliations.