Abstract
Funds from the European Union that are devoted to fostering a low-carbon economy are aimed at assisting Member States and regions in implementing the required investments in energy efficiency, renewable energy, and smart distribution electricity grids, and for research and innovation in these areas. In this context, we assessed the implementation of these funds in small and medium-sized enterprises across different beneficiary countries and regions of the European Union. Therefore, this study uses a non-radial slack-based data envelopment analysis model coupled with cluster analysis that covers multiple aspects of evaluation, including two inputs and two outputs, to assess 102 programs from 22 countries. Overall, we were able to ascertain that there are 25 efficient operational programs that remain robustly efficient, whereas 51 remain robustly inefficient for data perturbations of 5 and 10%. Under the current output level, there was almost no input surplus. Therefore, to promote a low-carbon economy, operational program managers should concentrate on solving the problems behind the poor results achieved, both in terms of greenhouse gas emissions reduction and the pace of the programs’ implementation.
1. Introduction
Curbing the impact of climate change represents one of the major concerns of the current European Union (EU) policy agenda. The 2050 climate and energy framework, which comprises EU-wide targets and policy objectives, proposes cuts of at least 55% in greenhouse gas (GHG) emissions (from 1990 levels) and a 40% utilization of renewable sources in the EU’s energy mix, set to be achieved by 2030. Hence, the EU strategy for tackling the impacts of climate change requires transitioning to a low-carbon economy (LCE). Simply put, an LCE is an economy where the structure is supported by activities associated with low levels of carbon dioxide emissions into the atmosphere [1]. In this framework, the EU policies, primarily its cohesion policy, provide support in the form of the promotion of low-carbon investments. The number and quality of low-carbon projects, besides the required structures and capacities of regions, will depend upon coordinated national and regional policies and actions. In addition, the significance of cohesion policy programs is extremely reliant on the global funding that has been assigned to this low-carbon thematic objective. The cohesion policy has backed the transition to an LCE in the past programming period, but the 2014–2020 commitments have increased significantly, especially due to the provision of special funds for the transition to an LCE (20% in more developed regions, 15% in regions of transition, and 12% in less developed regions). Therefore, evaluation assumes a prominent role in cohesion policy formulation because it helps support policy design and implementation, also providing sound evidence regarding the results and impact of the actions taken. The rules governing the planning and implementation of cohesion policies are progressively centered on evaluating their impact. From 2014 to 2020, member states (MS) became obligated (for the first time) to conduct evaluations to appraise the effectiveness, efficiency, and impact of each program’s objective. These rules apply to the European Regional Development Fund (ERDF), the European Social Fund (ESF), and the Cohesion Fund.
Various methods can be employed in the assessment of the cohesion policy, each of them with its own merits and demerits [2]. The two approaches most often used for this purpose are based on macroeconomic and econometric models. The first type of these models enables evaluating the potential impact of EU funds on economic growth but do not encompass the assessment of management failures [3]. Besides, these models neglect the allocation of EU funding across themes and sectors in each country. The mainstream research, which is based on econometric analyses, also reaches quite mixed conclusions [4] and has led several authors to start questioning their use [4,5,6].
An alternative technique considers microeconomic studies, which use control groups for contrasting the outcomes of the beneficiaries of structural funds with those of control groups having similar characteristics. Finally, in terms of the case study evaluation type, a blend of data gathered from surveys, program monitoring reports and quantitative analysis is applied to identify the impacts of structural funds at the regional, program or project level [7].
The previously employed evaluation methodologies do not allow any country/region/program to be compared with its counterparts or to establish the adjustments that need to be implemented to make an inefficient country/region/program efficient [8]. Moreover, these methodologies frequently require the satisfaction of statistical assumptions, such as normality, the absence of multicollinearity and homoscedasticity.
In general, stochastic methods can be used to estimate the frontier production function, but most of them need to consider a single output. An alternative way to establish the efficiency frontier is through the use of non-parametric methods, such as data envelopment analysis (DEA), which can easily handle multiple inputs and outputs. In contrast to stochastic methods, DEA is a non-statistical and non-parametric approach that makes no assumption regarding the distribution of inefficiencies or the functional form of the production function. Instead, it utilizes the factors of evaluation, i.e., inputs (resources) and outputs (results generated), using linear programming methods to compute the production possibility frontier. The efficiency of each unit under evaluation is measured so as to reflect the unit’s efficiency relative to all the others in the dataset. With DEA, it is assumed that the deviations from the efficient frontier are the result of inefficiency. In addition, DEA can help identify the benchmarks of each inefficient unit under evaluation and the potential causes of each unit’s inefficiency, providing decision-makers with information on the necessary adjustments required to tackle them. Based on this reasoning, the authors of [9] used the DEA approach to assess the relative spatial disadvantages of the EU’s Level II regions. Kutan and Yigit [10] employed structural break testing and DEA to evaluate the accession process of five European countries (Portugal, Spain, Finland, Austria, and Sweden). Later, the authors of [11] assessed the pure technical efficiency and global technical efficiency of Objective 1 in the application of structural funds from 2000 to 2006 in various regions, using the rate of employment and productivity as outputs in parametric (stochastic frontier) and non-parametric (DEA) approaches. Recently, the authors of [8] suggested the use of a value-based DEA approach, which combines DEA with multiple criteria decision-aiding, considering the main factors that might influence the efficiency of the implementation of structural funds across different EU beneficiary countries and regions. This study uses data made publicly available by the European Commission regarding finance implementation and expected achievements (targets), under the theme of “competitiveness of small and medium-sized enterprises (SMEs)”.
Although the publications available for evaluating structural funds are prolific (see Section 2), there are still gaps in the literature, particularly when the evaluations take place during the planning periods. When performing this sort of assessment by applying the DEA method, fine-grained information can be obtained by allowing management authorities (MA) to identify the benchmarks of inefficient operational programs (OPs) and provide information on the best practices that these OPs should undertake to become efficient. In this way, and differently from other methodologies and approaches that are specially used in ex-post and ex-ante policy evaluations (e.g., microeconomic studies, which use control groups, case study evaluation, and macroeconomic and econometric impact evaluations), DEA enables monitoring the efficiency of OPs’ implementation by considering the performance framework indicators (reported by the MS) during the programming period that is underway, allowing for the adoption of the required corrective actions to achieve efficiency. The performance framework consists of a group of indicators in each OP according to which the European Commission, in cooperation with the MS, evaluates the performance of the programs in each MS. Through this procedure, called the “performance review”, the achievements of the OPs’ priorities are evaluated according to the information obtainable from the annual implementation report presented by the MS. In the event of failing to achieve the targets set in the programs, the European Commission may apply financial rectifications. Furthermore, DEA may provide actual support in terms of the design of future cohesion policy instruments since it enables understanding the key achievements and shortcomings of the preceding implementation programming cycles, while also offering information on how to overcome the identified shortcomings. Finally, by coupling DEA with cluster analysis, MA can also exploit the differences among the performances of distinct regions’ categories.
Since SMEs are the keystone of the European economy, corresponding to 99% of businesses in the EU and around two-thirds of private-sector employment [12], and their impact on the environment is also relevant, their transition toward low-carbon practices is essential for reaching the EU’s target for reducing carbon emissions. Therefore, we have dedicated our analysis to the programs funded by the ERDF, which represent 70.5% of the European structural and investment (ESI) funds devoted to this topic.
Overall, the main research questions that we want to answer with our work are the following:
- (1)
- “Which factors require special attention for reaching an efficient implementation of the funds devoted to fostering an LCE in the EU?”
- (2)
- “Which OPs were more often viewed as benchmarks during the programming period under evaluation?”
- (3)
- “Were the OPs robustly efficient in the face of potential changes of the performance framework indicators used”?
- (4)
- “Which type of regions managed to attain higher LCE performance”?
The novelty of our work is threefold: (1) it proposes the use of the slack-based measure (SBM) DEA model, combined with cluster analysis, considering two inputs and two outputs to assess 102 programmes from 22 countries devoted to the promotion of an LCE in SMEs; (2) it allows evaluating these funds during their programming period, enabling countries to facilitate the adoption of policy measures to correct the inefficiencies identified, thus providing additional information that can be used in the intermediate monitoring and process evaluations; (3) it considers the distinct regional characteristics of the OPs, i.e., it accounts for the differences between the regions that have below 75% of the EU’s gross domestic product (GDP), which are eligible for considerably greater financial assistance from the cohesion policy (less developed regions), the regions just above this threshold, i.e., regions of transition (75% ≤ GDP ≤ 90%), and more developed regions (GDP > 90%), which are grouped into three distinct clusters.
This paper is structured as follows. Section 2 presents a literature review on the cohesion policy program evaluations that specifically address LCE concerns, also describing works that have applied DEA in the assessment of LCE efficiency in a broad context. Section 3 clarifies the key definitions and concepts regarding the methodology used to evaluate the implementation of the OPs under scrutiny. Section 4 describes the main assumptions considered in the choice of the input and output factors that are used in the efficiency evaluation of OPs, also providing some statistical information on the data used. Section 5 examines the results obtained and explores potential policy implications. Section 6 presents our conclusions and proposes potential recommendations based on the results obtained.
2. Literature Review
Ever since 2015, more than 1000 assessments have been conducted by EU MS, focusing on distinct funds, themes, and regions, monitoring the progress of implementation, and/or evaluating the impact of interventions, both referring to the 2007–2013 and 2014–2020 programming periods [13].
The number of evaluations conducted by MS differs broadly (see Figure 1). This is the result of considerable disparities in the amount and type of investment funding, the number of programs in each MS, and the methodology suggested in the assessment plans (see Figure 1). Besides, while some countries prefer to conduct a large number of smaller assessments, others prefer to conduct aggregate evaluations.
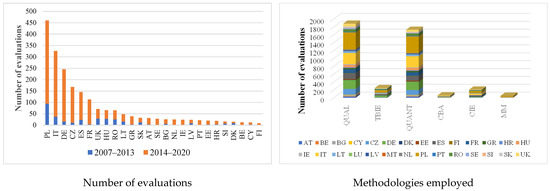
Figure 1.
Evaluations and methodologies employed by country since 2015 referring to both the 2007–2013 and 2014–2020 programming periods. Data available from: https://cohesiondata.ec.europa.eu/2014-2020-Evaluation/Cohesion-policy-programme-evaluations-2015-to-date/iz3t-u7bv (accessed on 23 March 2022). Note: TBIE—theory-based impact evaluation; QUAL—qualitative (other); QUANT—quantitative (other); CBA—cost benefit analysis; CIE—counterfactual impact evaluation; MM—macro modeling.
Most of these assessments are focused on implementation matters and evaluate progress regarding target achievement, being mainly concerned with the alignment of the projects and actions with the programs’ objectives and with the effectiveness and efficiency of their implementation. They also assess whether the existing funding is spent wisely or not and if the targets that were established, particularly those of the performance framework, are achieved. The impact assessments are performed later in the program cycle when most actions have already taken place and have also generated impacts.
The distribution of assessments across thematic objectives (TO) by country is depicted in Figure 2. As can be seen from Figure 2, most of the evaluations focus on social themes (TO 8, TO 9 and TO 10).

Figure 2.
Number of 2014–2020 evaluations conducted by country TO. Data available from: https://cohesiondata.ec.europa.eu/2014-2020-Evaluation/Cohesion-policy-programme-evaluations-2015-to-date/iz3t-u7bv (accessed on 23 March 2022). Note: TO 1—Research, technological development and innovation; TO 2—Information and communication technologies; TO 3—Competitiveness of SMEs; TO 4—Shift toward an LCE; TO 5—Climate change adaptation, risk prevention and management; TO 6—Preserving and protecting the environment and promoting resource efficiency; TO 7—Sustainable transport and key network infrastructures; TO 8—Employment and labor mobility; TO 9—Social inclusion, combating poverty and any discrimination; TO 10—Education, training and vocational training for skills and lifelong learning; TO 11—Enhancing the institutional capacity of public authorities and stakeholders, and efficient public administration.
Since the MS have dedicated about EUR 60 billion from European structural and investment (ESI) funds to the investment in LCE during 2014 to 2020 (more than twice the amount spent in this area during the previous funding period), our study will be devoted to the assessment of OPs within the framework of TO 4. In this context, Table A1 (available in Appendix A) lists the cohesion policy program evaluations completed by the EU MS, which specifically mention LCE concerns in their abstract summary from 2015 to the present.
Although an analysis of Table A1 suggests that the MS are using systematic methods in their assessments of TO 4, namely, desk research, monitoring data/data analysis, interviews, focus groups/facilitated workshops, surveys, and case studies, only a few assessments (mainly devoted to impact evaluations) consider more robust methods (such as statistical methods or other techniques), showing that despite the commitment of MS to enhancing the evaluation of cohesion policy, there is still room for improvement, in terms of the methodological approaches that can be employed.
For example, none of the reports reviewed in Table A1 apply the DEA method in their assessments. When performing an efficiency evaluation using the DEA method, MA will be capable of identifying the OP benchmarks, throughout the programming period, in terms of best practices and the necessary adjustments that need to be made regarding the group of indicators of the performance framework that will enable inefficient OPs to become efficient. Besides, the DEA method has also been used in the assessment of LCE efficiency at national, regional and sectoral levels—see Table 1. Most of the studies reviewed in Table 1 use the SBM-DEA model but do not account for the robustness assessment or uncertainty handling of the results obtained. In addition, to the best of our knowledge, the SBM-DEA method has not been employed for the evaluation of the implementation of OPs under the LCE theme. Hence, we will specifically address the efficiency assessment of these sorts of OPs through the application of the SBM-DEA method, combined with cluster analysis, and we will also perform robustness and sensitivity analyses of the results obtained.

Table 1.
Studies that use DEA regarding LCE efficiency.
3. Methodology
In this work, we use the DEA model proposed by Tone, known as SBM [21]. In comparison to the Charnes-Cooper-Rhodes (CCR) and Banker-Charnes-Cooper (BCC) models (see [22,23]), this model provides a more comprehensive efficiency assessment tool because it is non-radial (assuming that inputs and outputs can vary in a non-proportional manner), and it can be input-, output- and non-oriented. Unlike radial models, which disregard slacks, the SBM model provides information on the enhancements required for the values of each inefficient decision-making unit (DMU)’s input and output, respectively. Differently from the additive model [24], which is also a non-radial efficiency measure model, the SBM model allows computing an efficiency score based on the slacks. Besides this, the SBM model can be coupled with clustering analysis by grouping DMUs according to certain characteristics, to evaluate the DMUs’ efficiency based on the cluster frontier, thus reducing the impact of DMUs’ heterogeneity on efficiency [25,26,27].
3.1. The SBM Output-Oriented Model
Consider the set of DMUs , where X = [xij, i = 1, 2, …, m, j = 1, 2, …, n] is the (m × n) matrix of inputs, Y = [yrj, r = 1, 2, …, s, j = 1, 2, …, n] is the vector of outputs (s × n) and the rows of these matrices, corresponding to the inputs and outputs of DMUk, are respectively given by and , with T denoting the transposing of a vector. The SBM output-oriented model can be given as [27]:
Model (1) employs the constant returns to scale (CRS) assumption. To consider variable returns to scale (VRS), it is only necessary to add the constraint to model (1).
In this context, the scale efficiency (σk) of DMUk can be given as [27]:
where and correspond to the efficiency scores of DMUk, based on the SBM model under CRS and VRS, respectively. The value of σk ranges between 0 and 1, with a larger value indicating a better scale condition.
Definition 1.
A DMUk is SBM-output-efficient if. This condition is equivalent to. However, it is possible that.
Let and . Tone [28] suggested the following SBM output-oriented model to evaluate the super-efficiency of DMUk:
The super-SBM-output-oriented model assesses the efficiency of an efficient DMU regarding the nearest point on the frontier except itself [28,29].
The optimal value of the objective function of model (3) is greater than or equal to 1, i.e., ≥ 1. Nevertheless, the super-efficiency for DMUk will be 1 even if DMUk is inefficient. Thus, to determine whether DMUk is inefficient or not, both models (1) and (3) must be solved. If DMUk is efficient according to model (1), model (3) should be used to obtain its super-efficiency score.
3.2. The SBM Model with Cluster Benchmarking
Traditional DEA models assume that all DMUs have similar characteristics. Therefore, all DMUs are considered to provide the reference set to construct meta-frontiers. In reality, DMUs are not always homogeneous, thus affecting the accuracy of DEA findings [30]. Hence, clustering benchmarking can be useful to deal with heterogeneous DMUs [25,26]. Cluster benchmarking is a technique used for separating a set of DMUs into groups (i.e., clusters) with specific characteristics. The clusters can be defined by using a clustering method (in the field of statistics) applicable to the problem under evaluation or provided exogenously, using experts’ knowledge, or established internally according to the degree of scale efficiency [27]. The DMUs that belong to the same cluster are more alike than those that belong to different clusters [26]. The main goal is to take advantage of the homogeneity of DMUs in the same cluster and the heterogeneity of DMUs in distinct clusters. To perform the efficiency assessment regarding the best practices according to the corresponding clusters, the production frontiers need to be built separately. By comparing the results of the non-grouped DEA model (i.e., by considering all DMUs as a reference set) and the results of self-benchmarking after grouping, the technology gap ratio (TGR) can be obtained. The meta-frontier and the cluster frontiers are obtained considering the output-oriented version of the SBM model (see Model (1)). The TGRk of DMUk is then calculated as [31]:
where is the SBM-output-efficiency value of DMUk, computed according to the meta-frontier under VRS, and is the SBM-output-efficiency value of DMUk obtained according to the cluster frontier under VRS.
The value of the TGR may identify the gap between the cluster frontier and the meta-frontier. It is used to evaluate the technical efficiency gap of the same DMU, according to distinct frontiers. Besides this, TGR can further indicate the need for separating different groups [31]. The lower the TGR value is, the bigger the requirement of grouping will be, and vice versa. Since ≥ , the value of TGRk varies between 0 and 1 [25,26]. A TGRk closer to 1 suggests that there is a small gap between the meta-frontier and the cluster frontier. The meta-frontier shows the underlying technical level of the entire assessed group of individuals, and the cluster frontier depicts the real technical level of each cluster. For example, if we assume that = 0.6 and = 0.8, this implies that the maximum output that could be produced by the DMUk, which belongs to the cluster under analysis, is 75% of the output that is feasible when using the meta-frontier as a benchmark. The higher the value of TGRk, the smaller the gap between the meta-frontier and the cluster frontier and the smaller the gap between the technology used by the DMU and the technology frontier.
Expression (4) allows us to obtain the following decomposition of the efficiency of DMUk for a particular input–output combination:
Expression (5) shows that the efficiency of DMUk, measured according to the meta-frontier (expressing the current state of knowledge), can be split into the product of the efficiency obtained for the cluster frontier (following the current state of knowledge and the characteristics of the cluster under analysis) and the TGR for the cluster under analysis (which evaluates how close the cluster frontier is to the meta-frontier). Finally, since both clusters and scale efficiencies might significantly influence the outcomes attained, Expression (5) can be further decomposed into:
where is the efficiency value of DMUk obtained according to the cluster frontier under CRS and is the scale efficiency found for the cluster under evaluation.
Hence, if , then DMUk has no scale demerits, and its slacks are imputed to itself [27]. For example, if = 0.25, then 75% of the slacks are ascribed to the DMU’s scale demerits.
4. Data and Assumptions
We involved the stakeholders in the choice of a pre-selected set of indicators (the pre-selected set of indicators presented to the stakeholders was based on the scientific literature and on the set of common indicators used by the European Commission in the evaluation of TO 4), by conducting a facilitated workshop on the topic “Evaluating the Co-financed Intervention Policies in Enterprises” with specific policymakers and MA. Besides this, we performed a separate evaluation of regional and national programs, which were grouped into clusters according to the categories of the regions under analysis (i.e., less developed regions, regions of transition and more developed regions). The values considered are cumulative values from different years released on the 19th of November 2021 since these are the most updated data available for the achievement indicators. In our assessment, we have only studied the programs with no missing information (i.e., programs with missing data were eliminated), leading to the consideration of 22 countries and 102 programs (the DMUs).
The input and output factors considered for performing an efficiency assessment of the implementation of the ESI funds devoted to LCE interventions in SMEs were selected from the list of common indicators that are legally required by the EU [32] and are described below (see also Table 2).
Table 2.
Inputs and outputs selected.
4.1. Financial Absorption Capacity
According to [33], an efficiency assessment of the deployment of EU structural funds should specifically involve consideration of the capacity of absorption of EU funds by a given region/group of regions/countries. The financial absorption capacity corresponds to the capacity of co-financing by the MS [34]. A higher financial absorption capacity means lower dependency on EU co-financing of the country/region. Besides this, a rise in the EU co-financing rate relieves the burden on the national budget by reducing the MS’s initial budgeted contribution to the OP but also diminishes the OP’s total value. This indicates that the scale (number or size) of the interventions will be lowered as well, unless the MS keeps investing the funds originally envisioned at the national level. As a result, this may have a negative effect on the aims and outcomes that the OPs may accomplish, which, in turn, impacts the value that the awarded EU funds can deliver [35]. Therefore, the “percentage of EU co-financing”, which measures the weight of EU financing on the total financing received (including the national financing), is used as a proxy to measure the financial absorption capacity. To maximize this, the percentage of EU co-financing in total financing should be minimized and, therefore, should be considered as an input [8].
4.2. The Pace of the Programs’ Implementation
Since its inception, efforts have been made to evaluate and improve the implementation of the cohesion policy [36]. In fact, the goal of enhancing financial performance, or spending capacity, in MS and regions implementing OPs is fundamental. Although the pace of implementation is only one indicator of effectiveness, the extent to which MS and MA are capable of spending their allocated funding effectively and efficiently provides a basic method for assessing the implementation progress.
The assessment of financial implementation is critical because deferred or irregular financial performance in the first half of the programming period generates pressures on MA that may result in a negative effect on efficient and effective OP implementation and closure [36].
Therefore, the financial execution of structural funds, which is a necessary condition for effective policy implementation, should also be incorporated into the analysis, particularly when addressing the pace of the programs’ implementation [37]. In this framework, costs that are not eligible or in agreement with the applicable eligibility rules cannot be claimed. These must be validated by an accredited controller; this is the body or person accountable for validating, at the national level, that the co-financed products and services have been delivered, that the related expenditures have been paid and that a particular project conforms to the applicable EU program and national rules. On the one hand, the “total eligible spending” refers to those eligible costs reported by the selected projects that have been validated by this controller. Hence, the higher its value, the higher each project’s financial execution, and, thus, it is used herein as an output. On the other hand, the “eligible costs decided” refer to those costs that have financial resources assigned to the projects selected for funding (project pipeline). Therefore, these should be minimized (and perceived as inputs), so that the pace of the programs’ implementation is further enhanced.
4.3. Energy and Climate Change
TO 4 encourages the transition to an LCE. This goal is driven first and foremost by the climate agenda, which seeks to reduce the harmful impacts of anthropogenic GHG emissions. The scope is largely focused on a shift that necessitates both physical changes (lower net emissions from a technical infrastructure) and behavioral changes (energy savings), both of which are supported by new technologies and solutions [39].
The investment priority devoted to SMEs (investment priority 4b) is focused on promoting energy efficiency and renewable use, with two types of intervention [38,39].
For energy efficiency measures, the values are computed according to the amount of primary energy saved through the adoption of the supported operations in a given year (either one year after project completion or the calendar year after project completion) [39]. The saved energy is expected to replace non-renewable energy generation. The MS’s total GHG emission per unit of non-renewable energy output is used to calculate the GHG effect of non-renewable energy [39].
In the case of renewable energy production, the estimated values are computed according to the quantity of primary energy produced by the supported facilities in a particular year (either one year after project completion or the calendar year after project completion) [38]. Renewable energy is expected to be GHG-free [39].
Either way, “GHG reduction” is an indicator that is specifically calculated for interventions directly aiming to increase renewable energy production or to decrease energy consumption through energy-saving measures. This indicator should be maximized and is employed as an output.
Data on these indicators are given in Table A2 in Appendix B.
From an analysis of Table 3, it might be established that the average EU co-financing support was 60.77%, 78.672% for the less developed regions, 61.43% for the regions of transition and 49.10% for the more developed regions, respectively. The overall average financial execution rate (i.e., the ratio between the total eligible spending and the total eligible cost) is low (32.33%) and it is even lower for the regions of transition (31.2%), presenting slightly higher values (but still below 50%) for the more developed regions and less developed regions, with values of 39.6% and 39.2%, respectively. Finally, the highest average decrease of GHG is attained (in decreasing order of magnitude) for the regions of transition, followed by the less developed and more developed regions.
Table 3.
Descriptive statistics of the inputs and outputs.
A requirement of DEA refers to input and output factors that should hold an isotonic relationship, which can be validated by correlation analysis [40]. There is a need to guarantee that the link between inputs and outputs is not inconsistent. Increasing the value of any input whilst holding other factors constant should not diminish any output but should rather lead to an expansion in the value of at least one output. If the correlation between input and output factors is positive (and significant), this indicates that the factors verify an isotonic relationship. In this case, since the normality assumption for the application of the tests for the significance of Pearson’s correlation is not verified, we opted for obtaining the Spearman correlation coefficients and the corresponding significance tests—see Table 4. The results obtained corroborate the isotonic relationship of the inputs and outputs used in the analysis.
Table 4.
Correlation matrix.
5. Discussion of Results
The results were computed with the MaxDEA 8 Ultra software. The values of the TGR, together with the technical efficiencies (CRS and VRS) obtained for the distinct region categories and the meta-frontier, were computed for all OPs. Basic descriptive statistics for these measures are shown in Table 5.
Table 5.
Descriptive statistics of the results obtained for the OPs.
Figure 3 depicts the efficiency scores based on the meta- and cluster frontiers, respectively.
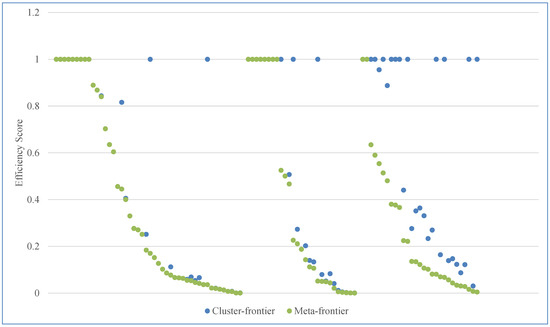
Figure 3.
Efficiency scores of 102 OPs on meta- and cluster frontiers. Note: Efficiency scores are presented from the left to the right for the more developed, transition and less developed regions, respectively.
It is worth noting that the cluster frontiers of more developed regions and transition regions were almost tangential to the meta-frontier. The average values of the TGR vary from 0.392 (for less developed regions) to 0.896 (for more developed regions), suggesting the existence of a huge gap between the two frontiers, particularly in the case of the less developed regions (based on the cluster frontier, the number of efficient DMUs—score equals to 1—increased from 2 to 13). Overall, the number of OPs considered to be efficient increased from 19 (meta-frontier) to 35 (cluster frontier)—see Figure 4.

Figure 4.
Number of OPs at different subintervals of super-efficiency scores, based on cluster- and meta-frontiers.
This result is mostly influenced by the TGR reached by LCE OPs in less developed regions, which produce, on average, only about 39.2% of the potential output, given the technology available for this type of OP as a whole (22 countries are represented)—see Table 5. Nevertheless, more developed regions produce, on average, 89.6% of the potential outputs (Table 5), whereas the regions of transition produce, on average, 77% of the potential outputs (Table 5). Figure 4 shows the number of OPs at different subintervals of super-efficiency scores, based on cluster- and meta-frontiers, respectively. According to the cluster frontiers, 35 OPs were relatively efficient, suggesting that 34.31% of these were maximizing their outputs. Overall, more developed regions and regions of transition show higher room-for-improvement potentials of 57% and 51%, respectively, while less developed regions had a smaller room for improvement of 48%. Besides, on average, about 10%, of the adjustments required to make the non-efficient OPs of less developed regions efficient are due to scale demerits, whereas 16% and 14% are attained for the regions of transition and more developed regions, respectively.
From an analysis of Figure 5, it can be ascertained that the difference in the average EU co-financing between efficient and inefficient OPs was not significant. Although the mean funds devoted to the eligible cost of efficient OPs (EUR 1,126,456,826.26) were slightly higher than that of inefficient ones (EUR 881,248,217.61), the mean eligible spending of efficient OPs (EUR 477,458,910.63) was substantially higher than that of inefficient ones (EUR 283,346,601.70). Furthermore, the mean reduction of GHG emissions of efficient OPs was 248% higher than that attained by inefficient OPs.
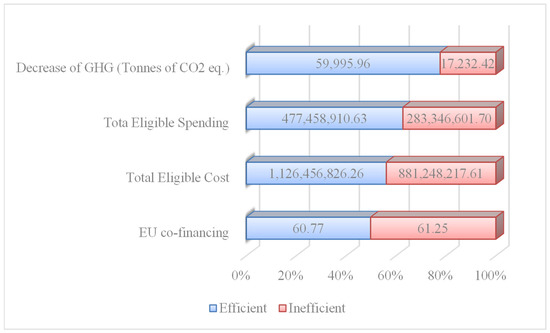
Figure 5.
Average input and output values for efficient and inefficient OPs.
5.1. Potential Improvements
The SBM model allows us to identify in inefficient DMUs the potential improvements that inputs and outputs should undergo to become efficient. These outcomes are illustrated in Figure 6, Figure 7 and Figure 8, sorted both by operational program and by region category. The decrease in GHG emissions has the greatest improvement potential, which could improve by about 514% (i.e., the reduction of GHG emissions can increase on average from 16,719 to 102,577 tonnes of CO2 eq.) according to the current input levels. Either way, the regions of transition and the more developed regions show the highest room-for-improvement potentials of 641% and 553%, respectively, whereas the lowest improvement potential belongs to the less developed regions, i.e., 278%. The pace of the programs’ implementation also shows an overall room for improvement (27%), particularly for the regions of transition (49%), followed by more developed and less developed regions, with potentials for improvement of 20% and 18%, respectively. Under the current output level, there was almost no input surplus, although more developed regions show better potential for improving their dependence on EU co-financing (−7%) and eligible costs (−8%). Hence, to foster an LCE, OPs managers should focus on solving problems that further enhance both GHG reduction and the pace of the programs’ implementation.
Figure 6.
Potential improvement of each input for every inefficient OP.
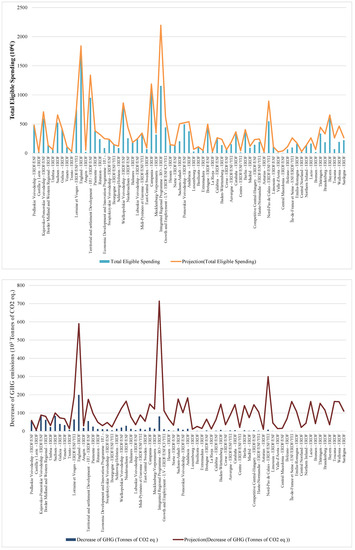
Figure 7.
Potential improvement of each output for every inefficient OP.
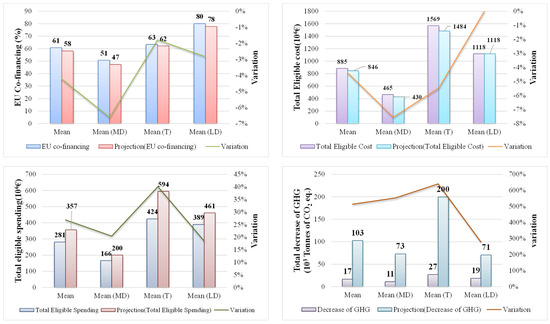
Figure 8.
Average potential improvement of each input and output for every region category. Note: T—transition regions; MD—more developed regions; LD—less developed regions.
5.2. Robustness Analysis
Traditional DEA methods use crisp values for both the inputs and outputs. Nevertheless, in real-world problems, the values used to instantiate the input and output data are occasionally subject to uncertainty. In this context, imprecise or vague data can be conveyed within interval ranges, as ordinal (rank-order) data or as fuzzy numbers [41]. Out of the approaches available in the literature that include the applications of fuzzy set theory in DEA, the α-level approach is possibly the most popular one. This approach consists of converting the fuzzy DEA model into a pair of parametric programs to find the lower and upper bounds of the α-level of the membership functions of the efficiency scores. The MaxDEA software converts the DEA model that has fuzzy inputs/outputs with bounded intervals into a pair of standard DEA models, so that the lower and upper boundaries of the efficiency scores are computed.
This sort of analysis is particularly important to evaluate the robustness of the results obtained, particularly if the programs are still underway. Hence, it is possible to anticipate the impact that potential changes on the output levels might have on the efficiency scores of OPs, given their current levels of input. In particular, we consider that the perturbations in the value of each factor are within an interval range. This interval is found by applying a common tolerance to the output factors, such that , where L and U designate the lower and upper boundaries, respectively. Besides this, we simultaneously consider data perturbations according to a worst-case scenario and a best-case scenario. While the former presumes increased outputs for all other DMUs and decreased outputs for the DMU under assessment (i.e., the efficiency of DMUk declines and the efficiency of all the other DMUs improve), the latter supposes the reverse situation. In this context, a DMU is robust to changes in its output factors if it remains efficient (or inefficient), and it thus can be stated as robustly efficient (or robustly inefficient) for the tolerance considered.
If we consider a potential change of the outputs within the tolerance of δ = 5% with the current inputs, 27 programs remain robustly efficient (9, 10 and 8 belong to more developed, transition, and less developed regions, respectively), 59 remain robustly inefficient and the remaining 16 are potentially efficient—see Figure 9. For a tolerance of δ = 10%, 25 programs remain robustly efficient (8, 10 and 7 belong to more developed, transition, and less developed regions, respectively), whereas 51 become robustly inefficient and 26 become potentially efficient. Overall, if the outputs suffer an increase from 5% to 10%, the potential for improvement increases, particularly for less developed regions, from 3% to 17%, whereas for the regions of transition, it just increases from 9% to 10%. Finally, with this change in outputs, more developed regions also have a high room-for-improvement value from 12% to 33%—see Figure 10. Table 6 provides some characteristics of the robustly efficient OPs for both tolerances. From an analysis of this table, it can be seen that the three OPs that are more often viewed as benchmarks in their corresponding clusters are also those more often viewed as benchmarks in the meta-frontier (these are OPs from Ireland, Italy, and Spain). Besides this, it can also be concluded that less developed regions are the ones that usually prefer to perform more intermediate assessments (see, e.g., the cases of the OPs from Poland and Lithuania). There is only one operational program belonging to a less developed region (see the case of Lithuania) that also serves as a benchmark for the other programs in the meta-frontier (but this is just one time). Finally, it can also be established that despite the variety of the number of evaluations conducted by each MS for each robustly efficient operational program, most of them perform some kind of evaluation. Specifically, the majority of MS perform monitoring (43) and process (34) evaluations, with only a few (6) presenting impact evaluations.

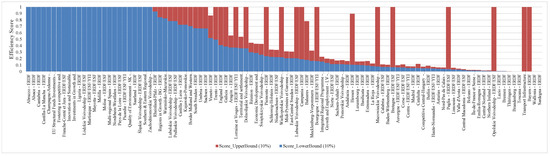
Figure 9.
Upper-bound and lower-bound efficiency scores for each OP, according to different tolerances.
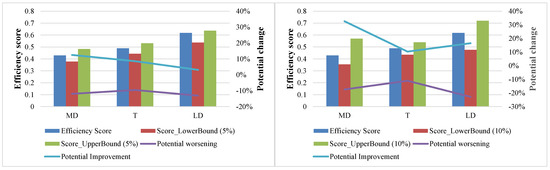
Figure 10.
Average upper bound and lower bound efficiency scores for each region category. Note: T—transition regions; MD—more developed regions; LD—less developed regions.
Table 6.
Some characteristics of the robustly efficient OPs for = 5% and = 10%.
5.3. Sensitivity Analysis
Since the SBM-DEA approach is a non-parametric method, a distinct approach is usually used to perform sensitivity analysis. This consists of eliminating one factor of evaluation (input or output) at a time and assessing the level of change attained thereby in terms of efficiency [42].
In addition, because the SBM-DEA model used in the assessment of the OPs is output-oriented, we have considered two simple regression models in which the dependent variables are the scores obtained when omitting one output at a time, and the independent variable is the original score. Through these models, it is possible to obtain the slope and the corresponding coefficient of determination (or r-square). The sensitivity of efficiency to the changes in the variables (i.e., outputs) can thus be identified by the gap between the value 1 and the slope of the simple regression function [25,43], meaning that the sensitivity of efficiency to changes in the outputs increases with this gap.
The results of the sensitivity analysis are presented in Figure 11 and Table 7. The factor that shows higher impacts on efficiency is GHG reduction, since the omission of this variable leads to the highest value of |1-slope|, 0.590, whereas the total eligible spending has a smaller impact on efficiency. These results suggest that the type of interventions targeted for funding are critical for producing desirable results regarding an LCE.
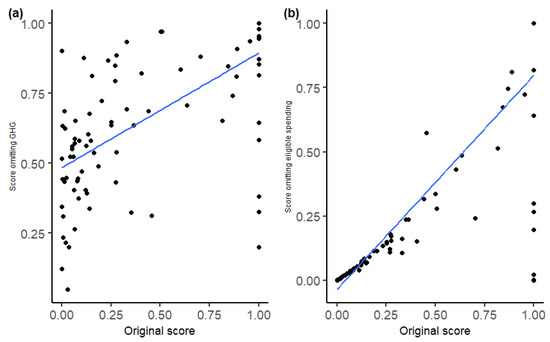
Figure 11.
Sensitivity analysis for GHG reduction (a) and total eligible spending (b). The y-axis of each graph represents the recalculated efficiency by omitting one variable at a time, and the x-axis represents the original efficiency score. The solid blue lines represent the lines of the best fit.
Table 7.
Sensitivity analysis results.
5.4. Policy Implications
Although 50% of the OPs remain robustly inefficient for both tolerances, from the analysis of Table 8 (further information is obtainable from Table A3 and Table A4 in Appendix C and Appendix D, respectively), it can be concluded that 73% of the inefficient OPs do not need adjustments in EU co-financing. Nevertheless, there are at least four OPs (from more developed regions) that require a meaningful reduction of EU co-financing (of between 34% and 54%) to become efficient. Particularly in such cases, the management structures should consider reprogramming the OPs to reallocate EU co-funding from more developed regions to less developed regions. In terms of the funding assigned to eligible costs, 88% of inefficient OPs do not require adjustments; however, there are four funds (3 from more developed regions and 1 from a region of transition) that require a reduction of funding of between 20% and 32% (see Table A3 and Table A4). Then again, MA should have enough flexibility to decide how to change the coverage of the funding, thus contemplating other less developed regions and/or other investment priorities, if needed. One of the critical issues that preclude OPs’ efficiency is their implementation pace. There are 11 OPs that need to more than double their performance and 7 that need to increase it by more than 75%. In these cases, it is important to understand the true reasons behind the numbers. Some OPs evaluations suggest that some firms have withdrawn their subsidies, probably because of their difficulties in obtaining bank credit for co-financing. In such situations, the MA should be able to support firms in finding other sources of funding, e.g., venture capital funds, business angels and crowdfunding, also facilitating the conditions for bringing other institutional investors. If none of these possibilities is viable, funding should be transferred to regions or other investment priorities with more capacity to spend. Besides, to accelerate the implementation of the OPs, best practices from other countries need to be considered and bureaucratic requirements for accessing funding should be reduced. Management structures should find ways of making project implementation more efficient by promoting the simplification of procedures for preparing and submitting the application for payment requests. The reduction of the implementation failure rate should also involve additional opportunities for direct consultation and better support and guidance of applicants.
Table 8.
Policy implications and suggestions for inefficient OPs.
Finally, it can be ascertained that GHG emission reduction is actually the indicator that needs greater attention since 59 OPs need to improve their performance substantially in terms of this factor. Further analysis is required, namely, regarding the possibility of replacing or flanking the MA with a competent alternative body or even offering specific training and the exchange of best practices to improve the choice of the projects selected for funding. OPs should ensure better links between policy objectives, actions undertaken and indicators, and, if needed, promote greater involvement of key stakeholders in the planning phase.
Overall, the MA should monitor closely the execution of OPs, especially those indicators that have implementation delays, and revise the allocation of funding if needed.
6. Conclusions
This work aims to evaluate the efficiency of the implementation of structural funds in different OPs from distinct EU beneficiary countries and regions by using data provided by the European Commission. These data involve financial implementation and expected results (targets) in the field of LCEs for the 2014–2020 ESI funds devoted to SMEs under the ERDF. In addition to representing the latest reported information available, these data are well suited for use with non-parametric methods, such as DEA. The main advantage of using this type of approach is the richness of information that they can offer to MA regarding the inefficiency of the Ops, which are compared against their peers. Through DEA, the benchmarks of inefficient OPs are also identified and pertinent information can be obtained thereby regarding the best practices to follow to achieve greater efficiency.
Although DEA has indisputable advantages over other traditional approaches (e.g., microeconomic studies, which use control groups, and case study evaluation), there is still a lack of scholarly attention regarding its use in the framework of structural funds efficiency assessment. Therefore, one of the novelties of our research consists of using the SBM-DEA model, combined with cluster analysis, to evaluate the efficiency of the implementation of structural funds dedicated to the promotion of an LCE in SMEs.
The use of the SBM measure employed herein, besides identifying the benchmarks and the adjustments required (given by the slacks) to improve the implementation of these funds, also enables exploiting the differences between the distinct regions’ categories in a single model. This approach also involves the use of two approaches in the robustness assessment of the results obtained, something which is not usually performed even in other broader studies within the framework of LCE. This type of analysis is particularly relevant if the programs are still in progress, enabling MA to foresee the impact that potential adjustments on the output levels might have on the efficiency scores of OPs, given their levels of inputs.
Differently from other tools and methods that are specifically used for the ex-post or ex-ante evaluation of cohesion policies, the DEA method also enables us to evaluate the efficiency of OPs’ implementation during the programming period, so that the required policies can be adopted within the time needed for making the necessary adjustments during the time horizon in progress.
DEA models can easily be adjusted to evaluate other thematic objectives, as long as the rule of thumb established by [17] is retained, i.e., the number of DMUs under assessment should be at least the double of the number of input and output factors considered.
Overall, regarding the first research question (“Which factors require special attention for reaching an efficient implementation of the funds devoted to fostering an LCE in the EU?”), we were able to conclude that:
- (1)
- MA should pay special attention to GHG emission reduction, since 59 OPs need to further improve their performance substantially. In such cases, consideration should be given to the prospect of replacing or supplementing these MAs with a capable alternative organization/group of experts, or perhaps providing particular training and exchanging best practices to improve the selection of projects for funding.
- (2)
- The other main important factor that precludes OPs’ efficiency is their implementation rate. Specifically, there are 11 OPs that have to more than double their performance and 7 who must enhance it by more than 75%. Either way, it is vital to understand the reasons behind these numbers. There are evaluation reports that suggest that some enterprises have withdrawn their subsidies, most likely due to issues related to bank credit. In this context, MA should be able to assist enterprises in obtaining other funding sources, while also easing the criteria for bringing in other institutional investors. Furthermore, in order to expedite the implementation of the OPs, best practices from other countries should be explored, and bureaucratic barriers to getting financing should be minimized. Management structures should seek ways to improve project implementation by supporting the simplification of procedures for submitting payment requests, also providing enhanced assistance and guidance.
Concerning our second research question (“Which OPs were more often viewed as benchmarks during the programming period under evaluation?”), we were able to establish that:
- (1)
- The OPs more often viewed as benchmarks (either in the meta- or cluster frontiers) were, by decreasing order of importance, the “Southern and Eastern Regional Programme—IE—ERDF”, “Liguria—ERDF”, “Multi-regional Spain—ERDF”, “Pays de la Loire—ERDF/ESF”, “Investments in Growth and Employment—AT—ERDF and “Cantabria—ERDF”.
- (2)
- There is only one OP from a less developed region (see the case of Lithuania) that also serves as a benchmark (i.e., as a reference of best practices) for the other OPs in the meta-frontier (but just one time).
In what regards our third research question (“Were the OPs robustly efficient in the face of potential changes of the performance framework indicators used?”), we were able to find that:
- (1)
- 50% of LCE OPs were robustly inefficient for the tolerances considered in the analysis, highlighting the difficulty of further improving the efficiency of these OPs.
In terms of the fourth research question (“Which type of regions managed to attain higher LCE performance”?), we were able to ascertain that:
- (1)
- Our findings appear to support the apparent paradox of the EU Cohesion Policy, since the OPs which are more often viewed as benchmarks according to the meta-frontier belong to more developed regions. In fact, if we had not grouped our OPs according to the region type, we would only have 2 efficient OPs from the less developed regions (instead of the 13 obtained with the cluster frontier analysis).
- (2)
- The TGR reached by LCE OPs in less developed regions suggests that these produce, on average, only about 39.2%, of the potential output, given the technology available for this type of OPs in EU countries. Therefore, it appears that there is a positive association between the efficiency of the implementation of the OPs and the more advantageous socioeconomic circumstances of the regions where the OPs are implemented.
Finally, we are also aware that although the performance framework provides a group of common indicators, a match between the data gathered for the achievement indicators and the data from financial implementation is not fully possible. This is particularly true regarding the investment priority devoted to SMEs (investment priority 4b), which is focused on promoting energy efficiency and renewable energies, that has data for the achievement indicators, but it does not have data with that level of detail in the financial implementation. Moreover, the data reported is often lacking, thus leading to the consideration of a smaller number of indicators and OPs in our assessment.
Further research should be conducted to evaluate the efficiency of the implementation of other OPs in different TO, eventually considering other performance framework indicators.
Author Contributions
C.H.: Writing—original draft, final revision, methodology, data curation, conceptualization, validation, formal analysis, investigation, resources, project administration. C.V.: writing—original draft, data curation, statistical analysis and validation and revision. A.T.: revision. M.G.: revision. A.A.: organization of the workshop with the stakeholders involved in this study and revision. All authors have read and agreed to the published version of the manuscript.
Funding
This work received no external funding.
Acknowledgments
This work has been funded by the European Regional Development Fund within the framework of Portugal 2020—Programa Operacional Assistência Técnica (POAT 2020), under project POAT-01-6177-FEDER-000044 ADEPT: Avaliação de Políticas de Intervenção Cofinanciadas em Empresas. INESC Coimbra and CeBER are supported by the Portuguese Foundation for Science and Technology funds through Projects UID/MULTI/00308/2020 and UIDB/05037/2020, respectively.
Conflicts of Interest
The authors declare that they have no known competing financial interests or personal relationships that could have appeared to influence the work reported in this paper.
Appendix A. Literature Review
Table A1.
List of cohesion policy programme evaluations completed by the Member States mentioning LCE concerns from 2015 to date. Data available from: https://cohesiondata.ec.europa.eu/2014-2020-Evaluation/Cohesion-policy-programme-evaluations-2015-to-date/iz3t-u7bv (accessed on 19 November 2021).
Table A1.
List of cohesion policy programme evaluations completed by the Member States mentioning LCE concerns from 2015 to date. Data available from: https://cohesiondata.ec.europa.eu/2014-2020-Evaluation/Cohesion-policy-programme-evaluations-2015-to-date/iz3t-u7bv (accessed on 19 November 2021).
| Title in English | Date of Publication | Authors | Methods (a) | ||||||||||
|---|---|---|---|---|---|---|---|---|---|---|---|---|---|
| DR | LR | MD/DA | I | FG/FW | S | CS | B | E | SM | O | |||
| Impact evaluation of the Alpine Space Interreg Operational Programme (OP), 2014–2020 | 1 February 2020 | t33 (info@t33.it) | x | x | x | x | x | ||||||
| Evaluation of interventions to reduce CO2 emissions under the Investments in Growth and Employment OP, 2014–2020 | 1 June 2020 | Franziska Trebut and Gergard Bayer (office@oegut.at) | x | x | x | x | x | ||||||
| Preliminary evaluation of the implementation of territorial development under the Wallonia ERDF OP with a view to 2021–2027 | 1 March 2020 | Michaël Van Cutsem (michael.vancutsem@bdo.be), Thomas Gayzal, Marie Gavroy, Clément Poulain | x | x | x | x | x | x | |||||
| Analysis of the market situation for Partnership Agreement (PA) 3—“Supporting the shift toward an LCE” of the future Technology and Applications for Competitiveness OP, 2021–2027, in the Czech Republic | 1 September 2020 | Deloitte Advisory s.r.o. (https://www2.deloitte.com/cz/, accessed on 19 November 2021) | x | x | x | ||||||||
| Evaluation of Specific Objectives 3.1, 3.2 and 3.4 of the Enterprise and Innovation for Competitiveness OP, 2014–2020 | 1 June 2019 | Asociace pro evropské fondy; EUFC CZ; Evaluation Advisory CE; enovation s.r.o.; SANCHO PANZA (www.apef.cz; www.eufc.cz; www.eace.cz; www.enovation.cz; www.sanchopanza.cz, accessed on 19 November 2021) | x | x | x | x | x | x | |||||
| Assessment of contribution of the Bayern OP, 2014–2020 to climate change objectives | 1 June 2019 | Entera—Thomas Horlitz (horlitz@entera.de) and Karoline Pawletko—Ramboll (www.de.ramboll.com, accessed on 19 November 2021) | x | x | x | x | x | x | |||||
| Evaluation of Priority Axis 3 “Reduction of CO2 emissions” in the ERDF Berlin OP 2014–2020 | 1 June 2019 | IfS—Institut für Stadtforschung und Strukturpolitik GmbH (www.ifsberlin.de, accessed on 19 November 2021); MR (www.mr-regionalberatung.de, accessed on 19 November 2021)—Gesellschaft für Regionalberatung mbH (Michael Ridder) | x | x | x | ||||||||
| Monitoring and evaluation of achievements in transition towards a low carbon economy | 1 January 2019 | Dirección General de Fondos Europeos SG de Programación y Evaluación (www.dgfc.sepg.hacienda.gob.es, accessed on 19 November 2021) | x | x | |||||||||
| Mid-term evaluation—the France-Belgium-Netherlands-UK (Two Seas) Interreg OP, 2014–2020 | 1 October 2019 | T33 Srl (www.t33.it, accessed on 19 November 2021, info@t33.it) | x | x | x | x | |||||||
| Evaluation of the synergy and complementarity of the Bolzano EDRF OP 2014–2020 with the European Territorial Cooperation (ETC) OPs and programs directly managed by the EU | 1 December 2018 | CLAS (www.gruppoclas.com/it, accessed on 19 November 2021), PTS Group (www.ptsconsulting.it, accessed on 19 November 2021) and IRS—Istituto per la ricerca sociale (www.irsonline.it, accessed on 19 November 2021) | x | x | |||||||||
| Mid-term evaluation of the West-Nederland OP, 2014–2020: LCE | 1 October 2018 | Hans van der Zwan, Babette Beertema, William van den Bungelaar (www.erac.nl, accessed on 19 November 2021) | x | x | |||||||||
| Evaluation of the LCE priority under the Zuid-Nederland OP, 2014–2020 | 1 August 2018 | Andreas Ligtvoet, Annemieke van Barneveld-Biesma, Veerle Bastiaanssen, Alexander Buitenhuis, Chiel Scholten, Geert van der Veen (www.technopolis-group.com, accessed on 19 November 2021) | x | x | x | x | x | x | |||||
| Further analysis of low-carbon projects—Interim Evaluation Knowledge development and Innovation under the Noord and Oost-Nederland ERDF Ops, 2014–2020 | 1 March 2019 | Eelko Huizingh, Paul Elhorst, Evelien Croonen, Pedro de Faria, Anna-Lijsbeth Klijnstra (www.rug.nl, accessed on 19 November 2021) | x | x | x | x | |||||||
| Impact of cohesion policy 2007–2013 on energy in Poland | 1 April 2017 | FUNDEKO Korbel (biuro@fundeko.pl) | x | x | x | x | |||||||
| Improving energy efficiency in buildings in Małopolskie | 1 February 2018 | FUNDEKO Korbel (biuro@fundeko.pl) | x | x | x | ||||||||
| Evaluation of the criteria and system for selecting of projects within PA I and VII of the OP infrastructure and environment in Poland | 1 April 2017 | Zbigniew Dura, Marcin Pierzchała (IBC GROUP Central Europe Holding S. A., ul.) | x | x | x | x | x | ||||||
| Assessment of the energy advisory system for the public sector, housing and enterprises in the Infrastructure and Environment OP 2014–2020 | 1 December 2018 | Jan Frankowski, Magdalena Ośka, Andrzej Regulski, Henryk Kalinowski, Anna Matejczuk (imapp@imapp.pl, www.imapp.pl, accessed on 19 November 2021) | x | x | x | x | x | ||||||
| Evaluation of the contribution to the Sustainable Development Goals of the infrastructure and environment OPs 2007–2013 and 2014–2020 | 1 December 2018 | Michał Wolański, Paulina Kozłowska, Wiktor Mrozowski, Mateusz Pieróg, Maciej Pańczak (Wolański Ltd., ul. Stawki 8/7, 00-193 Warszawa, Poland) | x | x | x | x | x | x | x | ||||
| Evaluation of the effects of support for enterprises and their innovativeness and internationalization in Dolnośląskie in 2014–2020 | 1 June 2020 | Maciej Gajewski, Jan Szczucki, Robert Kubajek, Bogdan Pietrzak, Justyna Witkowska (www.pag-uniconsult.pl, accessed on 19 November 2021) | x | x | x | x | x | x | x | ||||
| Evaluation of measures for energy efficiency and the development of an LCE under the Warminsko-Mazurskie OP, 2014–2020 | 1 March 2021 | Openfield Sp. z o.o. (Ul. Ozimska 4/7, 45-0547 Opole) | x | x | x | x | x | x | x | ||||
| Evaluation of measures supporting the transition toward a low carbon economy Thematic Objective (TO) 4 in Portugal, 2014–2020 | 1 November 2020 | Heitor Gomes; Luís Carvalho; Sandra Primitivo (geral@cedru.com) | x | x | x | x | x | x | |||||
| Evaluation of interventions to promote energy efficiency and carbon reduction under a regional OP in 2014–2020 | 1 May 2019 | Aurel Rizescu—Lattanzio Advisory Spa (www.lattanziokibs.com/ro, accessed on 19 November 2021) | x | x | x | x | x | x | |||||
| Impact evaluation of the Northern Periphery and Arctic Program 2014–2020: Final Report | 1 January 2018 | Irene McMaster, Nathalie Wergles and Heidi Vironen (eprc@strath.ac.uk) | x | x | x | x | x | x | |||||
| Evaluation of the regional OPs, 2014–2020—regional analysis and national synthesis | 1 January 2019 | Sofia Nordmark and Lennart Svensson (University of Linköping) | x | x | x | x | x | ||||||
| Final report on the potential of the Green Fund (“Almi Invest Greentech”) to contribute to the transition to an LCE, 2014–2020 | 1 December 2019 | Sofia Avdeitchikova, Ylva Grauers Berggren, Elias Osvald and Klara Melin (sofia.avdeitchikova@oxfordresearch.se) | x | x | x | x | |||||||
| Evaluation of the 9 ERDF OPs, 2014–2020 supporting a shift towards an LCE | 1 July 2017 | Steffen Ovdahl (steffen.ovdahl@sweco.se), Stefan Wing, Robin Jacobsson, Sigfrid Grandström, Peter Sandén, and Charlotta Nicolaisen. | x | x | x | x | x | x | x | x | x | ||
| Internal evaluation of measurable indicators for the quality of environment OP, 2014–2020, in Slovakia | 1 June 2017 | Ministry of Environment of the Slovak Republic (www.minzp.sk, accessed on 19 November 2021) | x | x | |||||||||
(a) Note: DR—desk research; LR—literature review; MD/DA—monitoring data/data analysis; I—interviews; FG/FW—focus groups/facilitated workshops; S—surveys; CS—case studies; B—benchmarking; E—expert consultation; SM—statistical methods; O—other.
Appendix B. Data
Table A2.
Data on the Inputs and Outputs selected.
Table A2.
Data on the Inputs and Outputs selected.
| Programme Title | EU Co-Financing | Total Eligible Cost | Total Eligible Spending | Decrease of GHG (Tonnes of CO2 eq.) | Category of Region |
|---|---|---|---|---|---|
| Abruzzo—ERDF | 50.00 | 58,435,905.16 | 23,573,823.75 | 2395.45 | Transition |
| Alsace—ERDF | 30.00 | 231,302,603.01 | 116,074,653.91 | 4619.91 | More Developed |
| Andalucía—ERDF | 80.00 | 1,276,301,168.05 | 375,799,945.48 | 13,490.54 | Transition |
| Aragón—ERDF | 50.00 | 94,346,366.93 | 20,258,377.22 | 17,416.41 | More Developed |
| Asturias—ERDF | 80.00 | 36,223,858.64 | 15,699,574.85 | 280.92 | More Developed |
| Auvergne—ERDF/ESF/YEI | 60.00 | 554,074,868.90 | 153,806,290.19 | 3705.07 | Transition |
| Baden-Württemberg—ERDF | 50.00 | 578,928,844.39 | 137,061,688.75 | 6900 | More Developed |
| Baleares—ERDF | 50.00 | 365,837,743.28 | 185,235,780.01 | 12,338.87 | More Developed |
| Basilicata—ERDF | 62.50 | 363,636,759.00 | 102,885,834.86 | 1737.06 | Less Developed |
| Bayern—ERDF | 35.99 | 1,489,123,542.01 | 656,914,176.00 | 15 | More Developed |
| Berlin—ERDF | 50.00 | 1,281,973,954.43 | 404,884,612.59 | 4801.22 | More Developed |
| Bolzano—ERDF | 50.00 | 223,357,744.90 | 64,933,239.72 | 757.45 | More Developed |
| Border Midland and Western Regional—ERDF | 50.00 | 288,733,916.00 | 137,473,567.01 | 62,380 | More Developed |
| Bourgogne—ERDF/ESF/YEI | 40.00 | 257,301,058.57 | 147,431,832.16 | 4654.36 | More Developed |
| Brandenburg—ERDF | 80.00 | 747,726,966.11 | 188,043,412.46 | 125 | Transition |
| Bremen—ERDF | 50.00 | 128,134,049.98 | 20,082,132.84 | 157.9 | More Developed |
| Bretagne—ERDF/ESF | 40.00 | 956,575,435.68 | 498,853,604.34 | 3924.45 | More Developed |
| Calabria—ERDF/ESF | 75.98 | 865,981,985.93 | 252,708,880.03 | 2895.64 | Less Developed |
| Campania—ERDF | 75.00 | 2,581,969,750.27 | 1,052,167,965.62 | 20,060.42 | Less Developed |
| Cantabria—ERDF | 50.00 | 17,878,192.28 | 17,139,539.60 | 3597.8 | More Developed |
| Castilla y León—ERDF | 50.00 | 27,077,783.86 | 20,792,431.41 | 5568.76 | More Developed |
| Castilla-La Mancha—ERDF | 80.00 | 32,425,249.29 | 10,736,556.62 | 11,489.61 | Transition |
| Cataluña—ERDF | 50.00 | 935,507,025.20 | 365,748,886.64 | 5213.55 | More Developed |
| Central Macedonia—ERDF/ESF | 80.00 | 217,029,604.29 | 5,547,887.69 | 269.03 | Less Developed |
| Central Norrland—ERDF | 50.00 | 66,633,992.00 | 20,547,144.00 | 145 | More Developed |
| Centre—ERDF/ESF/YEI | 50.00 | 68,076,791.12 | 12,795,310.28 | 774.3 | More Developed |
| Champagne-Ardenne—ERDF/ESF/YEI | 26.45 | 524,966,127.44 | 238,275,581.37 | 5558.7 | More Developed |
| Competitive Central-Hungary—ERDF/ESF | 50.00 | 565,656,554.27 | 144,222,696.95 | 4828.37 | More Developed |
| Corse—ERDF/ESF | 53.08 | 217,562,453.39 | 60,907,875.69 | 1536.2 | Transition |
| Dolnośląskie Voivodeship—ERDF/ESF | 85.00 | 2,077,483,889.94 | 1,001,921,517.85 | 35,353.57 | Less Developed |
| East-Central Sweden—ERDF | 50.00 | 167,300,046.00 | 69,896,525.00 | 8197 | More Developed |
| Economic Development and Innovation Programme—HU—ERDF/ESF/YEI | 85.00 | 521,361,163.21 | 87,075,491.77 | 10,935.64 | Less Developed |
| Emilia-Romagna—ERDF | 50.00 | 399,488,241.22 | 158,682,757.85 | 907.33 | More Developed |
| England—ERDF | 63.33 | 4,642,737,123.00 | 1,787,619,774.00 | 198,850.62 | Less Developed/More Developed/Transition |
| EU Structural Funds Investments—LT—ERDF/ESF/CF/YEI | 85.00 | 3,453,293,426.71 | 1,600,903,860.74 | 200,179 | Less Developed |
| Extremadura—ERDF | 80.00 | 221,014,003.31 | 46,630,594.02 | 990.03 | Less Developed |
| Fostering a competitive and sustainable economy—MT—ERDF/CF | 80.00 | 180,885,601.00 | 106,654,988.00 | 44,352.4 | Transition |
| Franche-Comté et Jura—ERDF/ESF | 40.03 | 526,812,648.08 | 341,537,370.99 | 9936.57 | Transition |
| Galicia—ERDF | 80.00 | 733,832,501.10 | 407,429,217.52 | 39,545.5 | More Developed |
| Growth and Employment—LV—ERDF/ESF/CF/YEI | 85.00 | 1,694,042,534.42 | 443,556,816.84 | 10,412.53 | Less Developed |
| Haute-Normandie—ERDF/ESF/YEI | 41.70 | 577,677,222.44 | 191,323,395.28 | 3218.18 | More Developed |
| Hessen—ERDF | 50.00 | 275,490,829.50 | 144,135,404.19 | 5525 | More Developed |
| Île-de-France et Seine—ESF/ERDF/YEI | 50.00 | 727,058,778.62 | 98,478,325.98 | 1762.45 | More Developed |
| Innovation and Sustainable Growth in Businesses—DK—ERDF | 55.00 | 264,194,402.53 | 55,493,280.74 | 51,005 | More Developed/Transition |
| Integrated Regional Programme—RO—ERDF | 82.50 | 6,832,205,666.95 | 1,154,004,429.05 | 81,269.68 | Less Developed/More Developed |
| Investments in Growth and Employment—AT—ERDF | 29.46 | 1,128,573,111.15 | 417,572,433.82 | 138,916.85 | Transition |
| Kujawsko-Pomorskie Voivodeship—ERDF/ESF | 85.00 | 1,506,750,014.59 | 597,254,294.00 | 83,139.53 | Less Developed |
| La Rioja—ERDF | 50.00 | 42,761,456.75 | 15,312,628.51 | 689.86 | More Developed |
| Lazio—ERDF | 50.00 | 852,677,890.23 | 164,496,345.48 | 618.37 | More Developed |
| Liguria—ERDF | 50.00 | 182,199,178.64 | 97,149,519.87 | 59,721.06 | More Developed |
| Limousin—ERDF/ESF | 50.63 | 320,053,393.93 | 107,841,896.93 | 950.03 | Transition |
| Łódzkie Voivodeship—ERDF/ESF | 85.00 | 197,418,057.95 | 20,551,342.65 | 15,622.52 | Less Developed |
| Lorraine et Vosges—ERDF/ESF/YEI | 60.00 | 1,656,282,325.56 | 743,909,207.67 | 64,087.69 | Transition |
| Lubelskie Voivodeship—ERDF/ESF | 85.00 | 2,504,075,733.48 | 1,013,421,268.71 | 155,491.65 | Less Developed |
| Lubuskie Voivodeship—ERDF/ESF | 85.00 | 564,061,137.01 | 247,835,390.66 | 5565.09 | Less Developed |
| Luxembourg—ERDF | 40.00 | 132,573,817.46 | 28,265,374.98 | 838 | More Developed |
| Madrid—ERDF | 50.00 | 247,674,348.76 | 91,485,646.80 | 2529.5 | More Developed |
| Martinique—ERDF/ESF/YEI | 51.89 | 368,436,576.30 | 137,487,602.99 | 24,578.38 | Less Developed |
| Mayotte—ERDF/ESF | 65.03 | 189,846,837.09 | 99,045,806.41 | 2147.7 | Less Developed |
| Mazowieckie Voivodeship—ERDF/ESF | 80.00 | 2,145,555,296.34 | 1,006,723,930.61 | 3674.43 | More Developed |
| Mecklenburg-Vorpommern—ERDF | 80.00 | 789,161,637.01 | 317,802,200.05 | 13,824 | Transition |
| Melilla—ERDF | 80.00 | 32,171,439.92 | 27,959,444.29 | 3114.94 | Transition |
| Midi-Pyrénées et Garonne—ERDF/ESF/YEI | 38.23 | 810,136,128.58 | 330,097,528.66 | 12,915.45 | More Developed |
| Molise—ERDF/ESF | 55.00 | 39,965,455.00 | 8,325,490.89 | 328.3 | Transition |
| Multi-regional Spain—ERDF | 72.47 | 5,460,800,959.76 | 2,196,113,419.20 | 713,649.45 | Less Developed/More Developed/Transition |
| Niedersachsen—ERDF/ESF | 51.88 | 1,195,970,497.97 | 255,728,896.81 | 29,451.4 | Transition |
| Nord-Pas de Calais—ERDF/ESF/YEI | 48.86 | 2,295,271,228.26 | 546,428,560.00 | 8067.15 | Transition |
| Nordrhein-Westfalen—ERDF | 50.00 | 2,646,766,161.98 | 1,087,091,636.85 | 32,137.3 | More Developed |
| Norte—ERDF/ESF | 84.43 | 444,612,989.40 | 133,529,560.49 | 2648.16 | Less Developed |
| Northern Ireland—ERDF | 60.00 | 305,856,240.00 | 138,042,805.05 | 250 | Transition |
| Opolskie Voivodeship—ERDF/ESF | 85.00 | 773,590,071.60 | 399,584,835.80 | 218 | Less Developed |
| Pays de la Loire—ERDF/ESF | 27.41 | 833,267,673.38 | 523,893,731.83 | 16,470.43 | More Developed |
| Picardie—ERDF/ESF/YEI | 22.31 | 1,270,962,446.12 | 307,379,379.83 | 26,725.25 | More Developed/Transition |
| Piemonte—ERDF | 50.00 | 738,745,949.77 | 382,614,685.69 | 24,817.83 | More Developed |
| Podlaskie Voivodeship—ERDF/ESF | 85.00 | 1,002,566,230.14 | 473,030,923.16 | 54,876.63 | Less Developed |
| Pomorskie Voivodeship—ERDF/ESF | 85.00 | 1,486,316,708.43 | 494,299,792.10 | 7608.52 | Less Developed |
| Puglia—ERDF/ESF | 57.50 | 559,318,475.94 | 276,518,084.10 | 825.18 | Less Developed |
| Quality of Environment—SK—ERDF/CF | 60.74 | 3,268,602,896.66 | 1,497,980,442.01 | 143,827.12 | Less Developed |
| Regions in Growth—BG—ERDF | 85.00 | 576,761,289.61 | 292,362,688.54 | 32,926.77 | Less Developed |
| Réunion—ERDF | 58.40 | 782,421,299.34 | 240,342,060.27 | 11,874.11 | Less Developed |
| Rheinland-Pfalz—ERDF | 29.75 | 685,461,896.34 | 404,698,111.76 | 36,084.45 | More Developed |
| Saarland—ERDF | 39.03 | 136,365,278.30 | 69,140,448.05 | 9409 | More Developed |
| Sachsen—ERDF | 80.00 | 1,601,931,420.46 | 525,168,561.95 | 83,549.03 | More Developed |
| Sachsen-Anhalt—ERDF | 74.06 | 1,227,541,432.93 | 203,679,210.16 | 14,923.22 | Transition |
| Sardegna—ERDF | 50.00 | 768,276,720.88 | 223,563,933.80 | 20.64 | Transition |
| Schleswig-Holstein—ERDF | 50.00 | 253,158,401.59 | 88,233,312.12 | 12,939 | More Developed |
| Śląskie Voivodeship—ERDF/ESF | 85.00 | 617,775,673.81 | 104,185,493.52 | 55,332.55 | Less Developed |
| South Sweden—ERDF | 50.00 | 73,647,631.00 | 30,233,182.00 | 23,454 | More Developed |
| Southern and Eastern Regional Programme—IE—ERDF | 50.00 | 643,878,121.00 | 262,200,018.97 | 162,937 | More Developed |
| Świętokrzyskie Voivodeship—ERDF/ESF | 85.00 | 671,027,980.84 | 240,385,684.51 | 9459.71 | Less Developed |
| Territorial and settlement Development—HU—ERDF/ESF | 85.00 | 2,956,091,946.73 | 950,777,469.67 | 55,774.05 | Less Developed |
| Thüringen—ERDF | 80.00 | 1,036,387,583.36 | 337,366,169.48 | 358.6 | Transition |
| Toscana—ERDF | 50.00 | 943,317,579.60 | 69,225,135.69 | 55.05 | More Developed |
| Transport Infrastructure Environment and Sustainable Development—GR—ERDF/CF | 80.00 | 6,412,116,038.24 | 2,362,923,936.48 | 199 | Less Developed/More Developed/Transition |
| Trento—ERDF | 50.00 | 48,212,037.23 | 30,098,971.29 | 6202 | More Developed |
| Umbria—ERDF | 50.00 | 105,098,679.13 | 60,443,437.21 | 22,868.39 | More Developed |
| Valle d’Aosta—ERDF | 50.00 | 49,066,309.27 | 7,342,763.33 | 285.9 | More Developed |
| Veneto—ERDF | 50.00 | 221,403,382.53 | 101,376,473.12 | 33,354.22 | More Developed |
| Wallonia—ERDF | 40.00 | 1,246,557,134.92 | 193,582,687.49 | 37.16 | More Developed/Transition |
| Warmińsko-Mazurskie Voivodeship—ERDF/ESF | 85.00 | 1,159,197,959.15 | 550,551,004.38 | 68,741.28 | Less Developed |
| Wielkopolskie Voivodeship—ERDF/ESF | 85.00 | 2,014,023,770.84 | 861,478,246.23 | 19,997.43 | Less Developed |
| Zachodniomorskie Voivodeship—ERDF/ESF | 85.00 | 151,556,615.01 | 5,657,445.00 | 4837.92 | Less Developed |
Appendix C. Results
Table A3.
Results obtained per Operational Programme.
Table A3.
Results obtained per Operational Programme.
| DMU | Cluster | Score | Benchmark (Lambda) | Projection (EU Co-Financing) | Projection (Total Eligible Cost) | Projection (Total Eligible Spending) | Projection (Decrease of GHG (Tonnes of CO2 eq.) |
|---|---|---|---|---|---|---|---|
| Abruzzo—ERDF | MD | 1.00 | Abruzzo—ERDF(1.000000) | 50.00 | 58,435,905.16 | 23,573,823.75 | 2395.45 |
| Alsace—ERDF | T | 1.00 | Alsace—ERDF(1.000000) | 30.00 | 231,302,603.01 | 116,074,653.91 | 4619.91 |
| Andalucía—ERDF | MD | 0.13 | Fostering a competitive and sustainable economy—MT—ERDF/CF(0.792532); Multi-regional Spain—ERDF(0.207468) | 78.44 | 1,276,301,168.05 | 540,151,575.87 | 183,210.38 |
| Aragón—ERDF | T | 0.46 | Cantabria—ERDF(0.534641); Liguria—ERDF(0.465359) | 50.00 | 94,346,366.93 | 54,372,867.37 | 29,715.24 |
| Asturias—ERDF | T | 0.05 | Cantabria—ERDF(0.671044); South Sweden—ERDF(0.328956) | 50.00 | 36,223,858.64 | 21,446,765.93 | 10,129.61 |
| Auvergne—ERDF/ESF/YEI | MD | 0.08 | Fostering a competitive and sustainable economy—MT—ERDF/CF(0.159244); Innovation and Sustainable Growth in Businesses—DK—ERDF(0.782421); Multi-regional Spain—ERDF(0.058336) | 60.00 | 554,074,868.90 | 188,514,714.21 | 88,601.34 |
| Baden-Württemberg—ERDF | T | 0.09 | Liguria—ERDF(0.140681); Southern and Eastern Regional Programme—IE—ERDF(0.859319) | 50.00 | 578,928,844.39 | 238,980,613.58 | 148,416.52 |
| Baleares—ERDF | T | 0.27 | Liguria—ERDF(0.649681); Pays de la Loire—ERDF/ESF(0.115654); Southern and Eastern Regional Programme—IE—ERDF(0.234665) | 47.39 | 365,837,743.28 | 185,235,780.01 | 78,940.11 |
| Basilicata—ERDF | LD | 0.12 | Łódzkie Voivodeship—ERDF/ESF(0.201495); Martinique—ERDF/ESF/YEI(0.679553); Śląskie Voivodeship—ERDF/ESF(0.118952) | 62.50 | 363,636,759.00 | 109,964,213.88 | 26,432.11 |
| Bayern—ERDF | T | 0.00 | Nordrhein-Westfalen—ERDF(0.281744); Pays de la Loire—ERDF/ESF(0.620215); Southern and Eastern Regional Programme—IE—ERDF(0.098042) | 35.99 | 1,325,641,058.21 | 656,914,176.00 | 35,244.32 |
| Berlin—ERDF | T | 0.07 | Nordrhein-Westfalen—ERDF(0.172974); Southern and Eastern Regional Programme—IE—ERDF(0.827026) | 50.00 | 990,325,169.31 | 404,884,612.59 | 140,312.09 |
| Bolzano—ERDF | T | 0.02 | Liguria—ERDF(0.910850); Southern and Eastern Regional Programme—IE—ERDF(0.089150) | 50.00 | 223,357,744.90 | 111,863,732.02 | 68,922.74 |
| Border Midland and Western Regional—ERDF | T | 0.87 | Liguria—ERDF(0.773977); Pays de la Loire—ERDF/ESF(0.011536); Southern and Eastern Regional Programme—IE—ERDF(0.214487) | 49.74 | 288,733,916.00 | 137,473,567.01 | 81,360.59 |
| Bourgogne—ERDF/ESF/YEI | T | 0.33 | Alsace—ERDF(0.008601); Liguria—ERDF(0.260278); Pays de la Loire—ERDF/ESF(0.155244); Saarland—ERDF(0.575877) | 40.00 | 257,301,058.57 | 147,431,832.16 | 23,559.19 |
| Brandenburg—ERDF | MD | 0.00 | Fostering a competitive and sustainable economy—MT—ERDF/CF(0.892642); Multi-regional Spain—ERDF(0.107358) | 79.19 | 747,726,966.11 | 330,975,150.16 | 116,206.82 |
| Bremen—ERDF | T | 0.01 | Liguria—ERDF(0.501941); South Sweden—ERDF(0.498059) | 50.00 | 128,134,049.98 | 63,821,202.63 | 41,657.91 |
| Bretagne—ERDF/ESF | T | 0.11 | Mazowieckie Voivodeship—ERDF/ESF(0.071822); Nordrhein-Westfalen—ERDF(0.051408); Pays de la Loire—ERDF/ESF(0.537936); Southern and Eastern Regional Programme—IE—ERDF(0.338834) | 40.00 | 956,575,435.68 | 498,853,604.34 | 65,984.71 |
| Calabria—ERDF/ESF | LD | 0.09 | Lubelskie Voivodeship—ERDF/ESF(0.167584); Martinique—ERDF/ESF/YEI(0.272350); Śląskie Voivodeship—ERDF/ESF(0.560066) | 75.98 | 865,981,985.93 | 265,628,702.94 | 63,741.72 |
| Campania—ERDF | LD | 0.23 | EU Structural Funds Investments—LT—ERDF/ESF/CF/YEI(0.690196); Martinique—ERDF/ESF/YEI(0.280710); Quality of Environment—SK—ERDF/CF(0.029094) | 75.00 | 2,581,969,750.27 | 1,187,113,772.18 | 149,246.65 |
| Cantabria—ERDF | T | 1.00 | Cantabria—ERDF(1.000000) | 50.00 | 17,878,192.28 | 17,139,539.60 | 3597.80 |
| Castilla y León—ERDF | T | 0.89 | Cantabria—ERDF(0.944015); Liguria—ERDF(0.055985) | 50.00 | 27,077,783.86 | 21,618,937.86 | 6739.89 |
| Castilla-La Mancha—ERDF | MD | 1.00 | Castilla-La Mancha—ERDF(1.000000) | 80.00 | 32,425,249.29 | 10,736,556.62 | 11,489.61 |
| Cataluña—ERDF | T | 0.07 | Nordrhein-Westfalen—ERDF(0.125530); Southern and Eastern Regional Programme—IE—ERDF(0.874470) | 50.00 | 895,301,197.95 | 365,748,886.64 | 146,517.68 |
| Central Macedonia—ERDF/ESF | LD | 0.03 | Łódzkie Voivodeship—ERDF/ESF(0.826714); Martinique—ERDF/ESF/YEI(0.117160); Mayotte—ERDF/ESF(0.056126) | 80.00 | 217,029,604.29 | 38,657,163.22 | 15,915.50 |
| Central Norrland—ERDF | T | 0.01 | Cantabria—ERDF(0.125761); South Sweden—ERDF(0.874239) | 50.00 | 66,633,992.00 | 28,586,508.07 | 20,956.86 |
| Centre—ERDF/ESF/YEI | T | 0.07 | Cantabria—ERDF(0.694509); Liguria—ERDF(0.305491) | 50.00 | 68,076,791.12 | 41,581,876.47 | 20,742.96 |
| Champagne-Ardenne—ERDF/ESF/YEI | T | 1.00 | Champagne-Ardenne—ERDF/ESF/YEI(1.000000) | 26.45 | 524,966,127.44 | 238,275,581.37 | 5558.70 |
| Competitive Central-Hungary—ERDF/ESF | T | 0.06 | Liguria—ERDF(0.169428); Southern and Eastern Regional Programme—IE—ERDF(0.830572) | 50.00 | 565,656,554.27 | 234,235,761.90 | 145,449.28 |
| Corse—ERDF/ESF | MD | 0.08 | Abruzzo—ERDF(0.388718); Fostering a competitive and sustainable economy—MT—ERDF/CF(0.044763); Innovation and Sustainable Growth in Businesses—DK—ERDF(0.523622); Investments in Growth and Employment—AT—ERDF(0.042897) | 53.08 | 217,562,453.39 | 60,907,875.69 | 35,582.95 |
| Dolnośląskie Voivodeship—ERDF/ESF | LD | 1.00 | Dolnośląskie Voivodeship—ERDF/ESF(1.000000) | 85.00 | 2,077,483,889.94 | 1,001,921,517.85 | 35,353.57 |
| East-Central Sweden—ERDF | T | 0.25 | Cantabria—ERDF(0.090671); Liguria—ERDF(0.909329) | 50.00 | 167,300,046.00 | 89,894,942.50 | 54,632.31 |
| Economic Development and Innovation Programme—HU—ERDF/ESF/YEI | LD | 0.35 | Martinique—ERDF/ESF/YEI(0.265932); Regions in Growth—BG—ERDF(0.734068) | 76.20 | 521,361,163.21 | 251,176,507.70 | 30,706.67 |
| Emilia-Romagna—ERDF | T | 0.02 | Liguria—ERDF(0.529350); Southern and Eastern Regional Programme—IE—ERDF(0.470650) | 50.00 | 399,488,241.22 | 174,830,490.21 | 108,299.61 |
| England—ERDF | MD | 0.50 | Investments in Growth and Employment—AT—ERDF(0.074491); Multi-regional Spain—ERDF(0.807282); Picardie—ERDF/ESF/YEI(0.118227) | 63.33 | 4,642,737,123.00 | 1,840,328,863.93 | 589,624.10 |
| EU Structural Funds Investments—LT—ERDF/ESF/CF/YEI | LD | 1.00 | EU Structural Funds Investments—LT—ERDF/ESF/CF/YEI(1.000000) | 85.00 | 3,453,293,426.71 | 1,600,903,860.74 | 200,179.00 |
| Extremadura—ERDF | LD | 0.12 | Łódzkie Voivodeship—ERDF/ESF(0.737905); Martinique—ERDF/ESF/YEI(0.143235); Mayotte—ERDF/ESF(0.118860) | 77.88 | 221,014,003.31 | 46,630,594.02 | 15,303.69 |
| Fostering a competitive and sustainable economy—MT—ERDF/CF | MD | 1.00 | Fostering a competitive and sustainable economy—MT—ERDF/CF(1.000000) | 80.00 | 180,885,601.00 | 106,654,988.00 | 44,352.40 |
| Franche-Comté et Jura—ERDF/ESF | MD | 1.00 | Franche-Comté et Jura—ERDF/ESF(1.000000) | 40.03 | 526,812,648.08 | 341,537,370.99 | 9936.57 |
| Galicia—ERDF | T | 0.70 | Liguria—ERDF(0.044265); Pays de la Loire—ERDF/ESF(0.582877); Southern and Eastern Regional Programme—IE—ERDF(0.372858) | 36.83 | 733,832,501.10 | 407,429,217.52 | 72,996.11 |
| Growth and Employment—LV—ERDF/ESF/CF/YEI | LD | 0.16 | Lubelskie Voivodeship—ERDF/ESF(0.570570); Śląskie Voivodeship—ERDF/ESF(0.429430) | 85.00 | 1,694,042,534.42 | 622,968,456.13 | 112,480.36 |
| Haute-Normandie—ERDF/ESF/YEI | T | 0.06 | Alsace—ERDF(0.077960); Champagne-Ardenne—ERDF/ESF/YEI(0.286234); Southern and Eastern Regional Programme—IE—ERDF(0.635806) | 41.70 | 577,677,222.44 | 243,960,145.39 | 105,547.66 |
| Hessen—ERDF | T | 0.15 | Liguria—ERDF(0.826761); Pays de la Loire—ERDF/ESF(0.070283); Southern and Eastern Regional Programme—IE—ERDF(0.102955) | 48.41 | 275,490,829.50 | 144,135,404.19 | 67,307.89 |
| Île-de-France et Seine—ESF/ERDF/YEI | T | 0.02 | Southern and Eastern Regional Programme—IE—ERDF(1.000000) | 50.00 | 643,878,121.00 | 262,200,018.97 | 162,937.00 |
| Innovation and Sustainable Growth in Businesses—DK—ERDF | MD | 1.00 | Innovation and Sustainable Growth in Businesses—DK—ERDF(1.000000) | 55.00 | 264,194,402.53 | 55,493,280.74 | 51,005.00 |
| Integrated Regional Programme—RO—ERDF | MD | 0.19 | Multi-regional Spain—ERDF(1.000000) | 72.47 | 5,460,800,959.76 | 2,196,113,419.20 | 713,649.45 |
| Investments in Growth and Employment—AT—ERDF | MD | 1.00 | Investments in Growth and Employment—AT—ERDF(1.000000) | 29.46 | 1,128,573,111.15 | 417,572,433.82 | 138,916.85 |
| Kujawsko-Pomorskie Voivodeship—ERDF/ESF | LD | 0.89 | EU Structural Funds Investments—LT—ERDF/ESF/CF/YEI(0.151499); Warmińsko-Mazurskie Voivodeship—ERDF/ESF(0.848501) | 85.00 | 1,506,750,014.59 | 709,677,901.81 | 88,653.90 |
| La Rioja—ERDF | T | 0.10 | Cantabria—ERDF(0.553819); South Sweden—ERDF(0.446181) | 50.00 | 42,761,456.75 | 22,981,674.18 | 12,457.26 |
| Lazio—ERDF | T | 0.01 | Southern and Eastern Regional Programme—IE—ERDF(1.000000) | 50.00 | 643,878,121.00 | 262,200,018.97 | 162,937.00 |
| Liguria—ERDF | T | 1.00 | Liguria—ERDF(1.000000) | 50.00 | 182,199,178.64 | 97,149,519.87 | 59,721.06 |
| Limousin—ERDF/ESF | MD | 0.04 | Abruzzo—ERDF(0.407498); Fostering a competitive and sustainable economy—MT—ERDF/CF(0.079419); Innovation and Sustainable Growth in Businesses—DK—ERDF(0.343803); Investments in Growth and Employment—AT—ERDF(0.169279) | 50.63 | 320,053,393.93 | 107,841,896.93 | 45,550.01 |
| Łódzkie Voivodeship—ERDF/ESF | LD | 1.00 | Łódzkie Voivodeship—ERDF/ESF(1.000000) | 85.00 | 197,418,057.95 | 20,551,342.65 | 15,622.52 |
| Lorraine et Vosges—ERDF/ESF/YEI | MD | 0.51 | Fostering a competitive and sustainable economy—MT—ERDF/CF(0.211438); Franche-Comté et Jura—ERDF/ESF(0.544821); Multi-regional Spain—ERDF(0.243740) | 56.39 | 1,656,282,325.56 | 743,909,207.67 | 188,736.60 |
| Lubelskie Voivodeship—ERDF/ESF | LD | 1.00 | Lubelskie Voivodeship—ERDF/ESF(1.000000) | 85.00 | 2,504,075,733.48 | 1,013,421,268.71 | 155,491.65 |
| Lubuskie Voivodeship—ERDF/ESF | LD | 0.27 | Martinique—ERDF/ESF/YEI(0.092552); Regions in Growth—BG—ERDF(0.746997); Śląskie Voivodeship—ERDF/ESF(0.160451) | 81.94 | 564,061,137.01 | 247,835,390.66 | 35,749.14 |
| Luxembourg—ERDF | T | 0.13 | Liguria—ERDF(0.016400); Saarland—ERDF(0.911162); South Sweden—ERDF(0.072438) | 40.00 | 132,573,817.46 | 66,781,434.77 | 11,251.52 |
| Madrid—ERDF | T | 0.07 | Liguria—ERDF(0.858180); Southern and Eastern Regional Programme—IE—ERDF(0.141820) | 50.00 | 247,674,348.76 | 120,556,932.50 | 74,359.11 |
| Martinique—ERDF/ESF/YEI | LD | 1.00 | Martinique—ERDF/ESF/YEI(1.000000) | 51.89 | 368,436,576.30 | 137,487,602.99 | 24,578.38 |
| Mayotte—ERDF/ESF | LD | 1.00 | Mayotte—ERDF/ESF(1.000000) | 65.03 | 189,846,837.09 | 99,045,806.41 | 2147.70 |
| Mazowieckie Voivodeship—ERDF/ESF | T | 1.00 | Mazowieckie Voivodeship—ERDF/ESF(1.000000) | 80.00 | 2,145,555,296.34 | 1,006,723,930.61 | 3674.43 |
| Mecklenburg-Vorpommern—ERDF | MD | 0.20 | Fostering a competitive and sustainable economy—MT—ERDF/CF(0.884794); Multi-regional Spain—ERDF(0.115206) | 79.13 | 789,161,637.01 | 347,372,386.97 | 121,459.20 |
| Melilla—ERDF | MD | 1.00 | Melilla—ERDF(1.000000) | 80.00 | 32,171,439.92 | 27,959,444.29 | 3114.94 |
| Midi-Pyrénées et Garonne—ERDF/ESF/YEI | T | 0.25 | Rheinland-Pfalz—ERDF(0.581481); Southern and Eastern Regional Programme—IE—ERDF(0.418519) | 38.23 | 668,058,316.29 | 345,060,021.07 | 89,174.59 |
| Molise—ERDF/ESF | MD | 1.00 | Molise—ERDF/ESF(1.000000) | 55.00 | 39,965,455.00 | 8,325,490.89 | 328.30 |
| Multi-regional Spain—ERDF | MD | 1.00 | Multi-regional Spain—ERDF(1.000000) | 72.47 | 5,460,800,959.76 | 2,196,113,419.20 | 713,649.45 |
| Niedersachsen—ERDF/ESF | MD | 0.27 | Innovation and Sustainable Growth in Businesses—DK—ERDF(0.637307); Investments in Growth and Employment—AT—ERDF(0.219978); Multi-regional Spain—ERDF(0.142715) | 51.88 | 1,195,970,497.97 | 440,640,545.66 | 164,912.73 |
| Nord-Pas de Calais—ERDF/ESF/YEI | MD | 0.05 | Innovation and Sustainable Growth in Businesses—DK—ERDF(0.229098); Investments in Growth and Employment—AT—ERDF(0.455885); Multi-regional Spain—ERDF(0.315017) | 48.86 | 2,295,271,228.26 | 894,891,523.90 | 299,826.97 |
| Nordrhein-Westfalen—ERDF | T | 1.00 | Nordrhein-Westfalen—ERDF(1.000000) | 50.00 | 2,646,766,161.98 | 1,087,091,636.85 | 32,137.30 |
| Norte—ERDF/ESF | LD | 0.15 | Martinique—ERDF/ESF/YEI(0.688890); Regions in Growth—BG—ERDF(0.034024); Śląskie Voivodeship—ERDF/ESF(0.277086) | 62.19 | 444,612,989.40 | 133,529,560.49 | 33,383.97 |
| Northern Ireland—ERDF | MD | 0.01 | Abruzzo—ERDF(0.340753); Fostering a competitive and sustainable economy—MT—ERDF/CF(0.457151); Franche-Comté et Jura—ERDF/ESF(0.041259); Investments in Growth and Employment—AT—ERDF(0.160837) | 60.00 | 305,856,240.00 | 138,042,805.05 | 43,844.96 |
| Opolskie Voivodeship—ERDF/ESF | LD | 1.00 | Opolskie Voivodeship—ERDF/ESF(1.000000) | 85.00 | 773,590,071.60 | 399,584,835.80 | 218.00 |
| Pays de la Loire—ERDF/ESF | T | 1.00 | Pays de la Loire—ERDF/ESF(1.000000) | 27.41 | 833,267,673.38 | 523,893,731.83 | 16,470.43 |
| Picardie—ERDF/ESF/YEI | MD | 1.00 | Picardie—ERDF/ESF/YEI(1.000000) | 22.31 | 1,270,962,446.12 | 307,379,379.83 | 26,725.25 |
| Piemonte—ERDF | T | 0.41 | Mazowieckie Voivodeship—ERDF/ESF(0.008021); Pays de la Loire—ERDF/ESF(0.437317); Southern and Eastern Regional Programme—IE—ERDF(0.554663) | 40.36 | 738,745,949.77 | 382,614,685.69 | 97,607.33 |
| Podlaskie Voivodeship—ERDF/ESF | LD | 0.96 | Regions in Growth—BG—ERDF(0.268925); Warmińsko-Mazurskie Voivodeship—ERDF/ESF(0.731075) | 85.00 | 1,002,566,230.14 | 481,117,734.75 | 59,109.87 |
| Pomorskie Voivodeship—ERDF/ESF | LD | 0.14 | Lubelskie Voivodeship—ERDF/ESF(0.460447); Śląskie Voivodeship—ERDF/ESF(0.539553) | 85.00 | 1,486,316,708.43 | 522,840,297.06 | 101,450.50 |
| Puglia—ERDF/ESF | LD | 1.00 | Puglia—ERDF/ESF(1.000000) | 57.50 | 559,318,475.94 | 276,518,084.10 | 825.18 |
| Quality of Environment—SK—ERDF/CF | LD | 1.00 | Quality of Environment—SK—ERDF/CF(1.000000) | 60.74 | 3,268,602,896.66 | 1,497,980,442.01 | 143,827.12 |
| Regions in Growth—BG—ERDF | LD | 1.00 | Regions in Growth—BG—ERDF(1.000000) | 85.00 | 576,761,289.61 | 292,362,688.54 | 32,926.77 |
| Réunion—ERDF | LD | 0.36 | EU Structural Funds Investments—LT—ERDF/ESF/CF/YEI(0.128710); Martinique—ERDF/ESF/YEI(0.803383); Śląskie Voivodeship—ERDF/ESF(0.067907) | 58.40 | 782,421,299.34 | 323,582,897.44 | 49,268.41 |
| Rheinland-Pfalz—ERDF | T | 1.00 | Rheinland-Pfalz—ERDF(1.000000) | 29.75 | 685,461,896.34 | 404,698,111.76 | 36,084.45 |
| Saarland—ERDF | T | 1.00 | Saarland—ERDF(1.000000) | 39.03 | 136,365,278.30 | 69,140,448.05 | 9409.00 |
| Sachsen—ERDF | T | 0.82 | Nordrhein-Westfalen—ERDF(0.478336); Southern and Eastern Regional Programme—IE—ERDF(0.521664) | 50.00 | 1,601,931,420.46 | 656,775,312.27 | 100,370.80 |
| Sachsen-Anhalt—ERDF | MD | 0.14 | Fostering a competitive and sustainable economy—MT—ERDF/CF(0.625726); Innovation and Sustainable Growth in Businesses—DK—ERDF(0.178863); Multi-regional Spain—ERDF(0.195411) | 74.06 | 1,227,541,432.93 | 505,807,794.56 | 176,330.49 |
| Sardegna—ERDF | MD | 0.00 | Innovation and Sustainable Growth in Businesses—DK—ERDF(0.706787); Investments in Growth and Employment—AT—ERDF(0.235359); Multi-regional Spain—ERDF(0.057854) | 50.00 | 768,276,720.88 | 264,554,703.27 | 110,032.28 |
| Schleswig-Holstein—ERDF | T | 0.28 | Liguria—ERDF(0.846302); Southern and Eastern Regional Programme—IE—ERDF(0.153698) | 50.00 | 253,158,401.59 | 122,517,484.68 | 75,585.16 |
| Śląskie Voivodeship—ERDF/ESF | LD | 1.00 | Śląskie Voivodeship—ERDF/ESF(1.000000) | 85.00 | 617,775,673.81 | 104,185,493.52 | 55,332.55 |
| South Sweden—ERDF | T | 1.00 | South Sweden—ERDF(1.000000) | 50.00 | 73,647,631.00 | 30,233,182.00 | 23,454.00 |
| Southern and Eastern Regional Programme—IE—ERDF | T | 1.00 | Southern and Eastern Regional Programme—IE—ERDF(1.000000) | 50.00 | 643,878,121.00 | 262,200,018.97 | 162,937.00 |
| Świętokrzyskie Voivodeship—ERDF/ESF | LD | 0.33 | Regions in Growth—BG—ERDF(0.415771); Śląskie Voivodeship—ERDF/ESF(0.454377); Warmińsko-Mazurskie Voivodeship—ERDF/ESF(0.129852) | 85.00 | 671,027,980.84 | 240,385,684.51 | 47,758.03 |
| Territorial and settlement Development—HU—ERDF/ESF | LD | 0.44 | EU Structural Funds Investments—LT—ERDF/ESF/CF/YEI(0.824652); Śląskie Voivodeship—ERDF/ESF(0.175348) | 85.00 | 2,956,091,946.73 | 1,338,457,756.66 | 174,780.51 |
| Thüringen—ERDF | MD | 0.00 | Fostering a competitive and sustainable economy—MT—ERDF/CF(0.837971); Multi-regional Spain—ERDF(0.162029) | 78.78 | 1,036,387,583.36 | 445,208,867.84 | 152,798.26 |
| Toscana—ERDF | T | 0.00 | Southern and Eastern Regional Programme—IE—ERDF(1.000000) | 50.00 | 643,878,121.00 | 262,200,018.97 | 162,937.00 |
| Transport Infrastructure Environment and Sustainable Development—GR—ERDF/CF | MD | 1.00 | Transport Infrastructure Environment and Sustainable Development—GR—ERDF/CF(1.000000) | 80.00 | 6,412,116,038.24 | 2,362,923,936.48 | 199.00 |
| Trento—ERDF | T | 0.60 | Cantabria—ERDF(0.815399); Liguria—ERDF(0.184601) | 50.00 | 48,212,037.23 | 31,909,474.89 | 13,958.22 |
| Umbria—ERDF | T | 0.84 | Cantabria—ERDF(0.499362); Liguria—ERDF(0.493028); Pays de la Loire—ERDF/ESF(0.007611) | 49.83 | 105,098,679.13 | 60,443,437.21 | 31,366.08 |
| Valle d’Aosta—ERDF | T | 0.04 | Cantabria—ERDF(0.440767); South Sweden—ERDF(0.559233) | 50.00 | 49,066,309.27 | 24,461,938.04 | 14,702.04 |
| Veneto—ERDF | T | 0.63 | Liguria—ERDF(0.915083); Southern and Eastern Regional Programme—IE—ERDF(0.084917) | 50.00 | 221,403,382.53 | 111,165,046.30 | 68,485.81 |
| Wallonia—ERDF | MD | 0.00 | Innovation and Sustainable Growth in Businesses—DK—ERDF(0.274530); Investments in Growth and Employment—AT—ERDF(0.643461); Multi-regional Spain—ERDF(0.082009) | 40.00 | 1,246,557,134.92 | 464,027,310.33 | 161,915.68 |
| Warmińsko-Mazurskie Voivodeship—ERDF/ESF | LD | 1.00 | Warmińsko-Mazurskie Voivodeship—ERDF/ESF(1.000000) | 85.00 | 1,159,197,959.15 | 550,551,004.38 | 68,741.28 |
| Wielkopolskie Voivodeship—ERDF/ESF | LD | 0.28 | EU Structural Funds Investments—LT—ERDF/ESF/CF/YEI(0.468289); Śląskie Voivodeship—ERDF/ESF(0.405367); Warmińsko-Mazurskie Voivodeship—ERDF/ESF(0.126344) | 85.00 | 2,014,023,770.84 | 861,478,246.23 | 124,856.71 |
| Zachodniomorskie Voivodeship—ERDF/ESF | LD | 1.00 | Zachodniomorskie Voivodeship—ERDF/ESF(1.000000) | 85.00 | 151,556,615.01 | 5,657,445.00 | 4837.92 |
Appendix D. Policy Implications
Table A4.
Policy Implications and suggestions.
Table A4.
Policy Implications and suggestions.
| DMU | Cluster | Policy Implications | Suggestions | Policy Implications | Suggestions | Policy Implications | Suggestions | Policy Implications | Suggestions |
|---|---|---|---|---|---|---|---|---|---|
| Podlaskie Voivodeship—ERDF/ESF | LD | No adjustments required for EU co-financing | No suggestions | No adjustments required for eligible funding | No suggestions | Slightly improve implementation | Promote the simplification of procedures for preparing and submitting applications and for payment requests. | Need to finance projects that make a slight contribution to meeting climate-related challenges | Further invest in initiatives to reduce carbon dioxide emissions and mitigate the effects of climate change. |
| Castilla y León—ERDF | MD | No adjustments required for EU co-financing | No suggestions | No adjustments required for eligible funding | No suggestions | Slightly improve implementation | Promote the simplification of procedures for preparing and submitting applications and for payment requests. | Need to finance projects that make some contribution to meeting climate-related challenges | Focus on reducing current energy consumption of businesses; expand the types of renewable sources eligible for funding and define the rules for the joint use of the ERDF with other subsidies. |
| Kujawsko-Pomorskie Voivodeship—ERDF/ESF | LD | No adjustments required for EU co-financing | No suggestions | No adjustments required for eligible funding | No suggestions | Slightly improve implementation | Promote the simplification of procedures for preparing and submitting applications and for payment requests. | Need to finance projects that make a slight contribution to meeting climate-related challenges | Further invest in initiatives to reduce carbon dioxide emissions and mitigate the effects of climate change. |
| Border Midland and Western Regional—ERDF | MD | EU co-financing should be slightly reduced | Allow some flexibility in reallocation of EU co-funding between regions. | No adjustments required for eligible funding | No suggestions | No adjustments required for implementation | No suggestions | Need to finance projects that make some contribution to meeting climate-related challenges | Focus on reducing current energy consumption of businesses; expand the types of renewable sources eligible for funding and define the rules for the joint use of the ERDF with other subsidies. |
| Umbria—ERDF | MD | EU co-financing should be slightly reduced | Allow some flexibility in reallocation of EU co-funding between regions. | No adjustments required for eligible funding | No suggestions | No adjustments required for implementation | No suggestions | Need to finance projects that make some contribution to meeting climate-related challenges | Focus on reducing current energy consumption of businesses; expand the types of renewable sources eligible for funding and define the rules for the joint use of the ERDF with other subsidies. |
| Sachsen—ERDF | MD | EU co-financing should be reduced | Allow more flexibility in reallocation of EU co-funding between regions. | No adjustments required for eligible funding | No suggestions | Improve implementation | Better clarify the eligibility and selection criteria for each of the calls in order to reduce the failure rate of implementation. | Need to finance projects that make some contribution to meeting climate-related challenges | Focus on reducing current energy consumption of businesses; expand the types of renewable sources eligible for funding and define the rules for the joint use of the ERDF with other subsidies. |
| Galicia—ERDF | MD | EU co-financing should be moderately reduced | Reallocate EU co-funding to other regions. | No adjustments required for eligible funding | No suggestions | No adjustments required for implementation | No suggestions | Need to finance projects that make a large contribution to meeting climate-related challenges | Promote greater involvement of key stakeholders in the planning phase. |
| Veneto—ERDF | MD | No adjustments required for EU co-financing | No suggestions | No adjustments required for eligible funding | No suggestions | Slightly improve implementation | Promote the simplification of procedures for preparing and submitting applications and for payment requests. | Assess and change investment strategy. | Envisage specific training and exchange of best practice for managing bodies to improve the choice of the projects selected for funding. |
| Trento—ERDF | MD | No adjustments required for EU co-financing | No suggestions | No adjustments required for eligible funding | No suggestions | Slightly improve implementation | Promote the simplification of procedures for preparing and submitting applications and for payment requests. | Assess and change investment strategy. | Envisage specific training and exchange of best practice for managing bodies to improve the choice of the projects selected for funding. |
| Lorraine et Vosges—ERDF/ESF/YEI | T | EU co-financing should be slightly reduced | Allow some flexibility in reallocation of EU co-funding between regions. | No adjustments required for eligible funding | No suggestions | No adjustments required for Implementation | No suggestions | Assess and change investment strategy. | Envisage specific training and exchange of best practice for managing bodies to improve the choice of the projects selected for funding. |
| England—ERDF | T | No adjustments required for EU co-financing | No suggestions | No adjustments required for eligible funding | No suggestions | Slightly improve implementation | Promote the simplification of procedures for preparing and submitting applications and for payment requests. | Assess and change investment strategy. | Envisage specific training and exchange of best practice for managing bodies to improve the choice of the projects selected for funding. |
| Aragón—ERDF | MD | No adjustments required for EU co-financing | No suggestions | No adjustments required for eligible funding | No suggestions | Shift funding to regions or other investment priorities with more capacity to spend | Shift funding to regions or other investment priorities with more capacity to spend. | Need to finance projects that make a large contribution to meeting climate-related challenges | Promote greater involvement of key stakeholders in the planning phase. |
| Territorial and settlement Development—HU—ERDF/ESF | LD | No adjustments required for EU co-financing | No suggestions | No adjustments required for eligible funding | No suggestions | Moderately improve implementation | Create additional opportunities for direct consultation and increase the support and guidance given to applicants | Assess and change investment strategy. | Envisage specific training and exchange of best practice for managing bodies to improve the choice of the projects selected for funding. |
| Piemonte—ERDF | MD | EU co-financing should be slightly reduced | Allow some flexibility in reallocation of EU co-funding between regions. | No adjustments required for eligible funding | No suggestions | No adjustments required for Implementation | No suggestions | Assess and change investment strategy. | Envisage specific training and exchange of best practice for managing bodies to improve the choice of the projects selected for funding. |
| Réunion—ERDF | LD | No adjustments required for EU co-financing | No suggestions | No adjustments required for eligible funding | No suggestions | Improve implementation | Better clarify the eligibility and selection criteria for each of the calls in order to reduce the failure rate of implementation. | Assess and change investment strategy. | Envisage specific training and exchange of best practice for managing bodies to improve the choice of the projects selected for funding. |
| Economic Development and Innovation Programme—HU—ERDF/ESF/YEI | LD | EU co-financing should be slightly reduced | Allow some flexibility in reallocation of EU co-funding between regions. | No adjustments required for eligible funding | No suggestions | Shift funding to regions or other investment priorities with more capacity to spend | Shift funding to regions or other investment priorities with more capacity to spend. | Assess and change investment strategy. | Envisage specific training and exchange of best practice for managing bodies to improve the choice of the projects selected for funding. |
| Świętokrzyskie Voivodeship—ERDF/ESF | LD | No adjustments required for EU co-financing | No suggestions | No adjustments required for eligible funding | No suggestions | No adjustments required for implementation | No suggestions | Assess and change investment strategy. | Envisage specific training and exchange of best practice for managing bodies to improve the choice of the projects selected for funding. |
| Bourgogne—ERDF/ESF/YEI | MD | No adjustments required for EU co-financing | No suggestions | No adjustments required for eligible funding | No suggestions | No adjustments required for implementation | No suggestions | Assess and change investment strategy. | Envisage specific training and exchange of best practice for managing bodies to improve the choice of the projects selected for funding. |
| Schleswig-Holstein—ERDF | MD | No adjustments required for EU co-financing | No suggestions | No adjustments required for eligible funding | No suggestions | Improve implementation | Better clarify the eligibility and selection criteria for each of the calls in order to reduce the failure rate of implementation. | Assess and change investment strategy. | Envisage specific training and exchange of best practice for managing bodies to improve the choice of the projects selected for funding. |
| Wielkopolskie Voivodeship—ERDF/ESF | LD | No adjustments required for EU co-financing | No suggestions | No adjustments required for eligible funding | No suggestions | No adjustments required for Implementation | No suggestions | Assess and change investment strategy. | Envisage specific training and exchange of best practice for managing bodies to improve the choice of the projects selected for funding. |
| Niedersachsen—ERDF/ESF | T | No adjustments required for EU co-financing | No suggestions | No adjustments required for eligible funding | No suggestions | Strongly improve implementation | Envisage specific training and exchange of best practice for managing bodies to improve implementation. | Assess and change investment strategy. | Envisage specific training and exchange of best practice for managing bodies to improve the choice of the projects selected for funding. |
| Baleares—ERDF | MD | EU co-financing should be slightly reduced | Allow some flexibility in reallocation of EU co-funding between regions. | No adjustments required for eligible funding | No suggestions | No adjustments required for Implementation | No suggestions | Assess and change investment strategy. | Envisage specific training and exchange of best practice for managing bodies to improve the choice of the projects selected for funding. |
| Lubuskie Voivodeship—ERDF/ESF | LD | EU co-financing should be slightly reduced | Allow some flexibility in reallocation of EU co-funding between regions. | No adjustments required for eligible funding | No suggestions | No adjustments required for Implementation | No suggestions | Assess and change investment strategy. | Envisage specific training and exchange of best practice for managing bodies to improve the choice of the projects selected for funding. |
| Midi-Pyrénées et Garonne—ERDF/ESF/YEI | MD | No adjustments required for EU co-financing | No suggestions | Eligible funding should be slightly reduced | Allow some flexibility in reallocation of funding between regions and investment Priorities. | Slightly improve implementation | Promote the simplification of procedures for preparing and submitting applications and for payment requests. | Assess and change investment strategy. | Envisage specific training and exchange of best practice for managing bodies to improve the choice of the projects selected for funding. |
| East-Central Sweden—ERDF | MD | No adjustments required for EU co-financing | No suggestions | No adjustments required for Eligible funding | No suggestions | Improve implementation | Better clarity of the eligibility and selection criteria for each of the calls, in order to reduce the failure rate of implementation. | Assess and change investment strategy. | Envisage specific training and exchange of best practice for managing bodies to improve the choice of the projects selected for funding. |
| Campania—ERDF | LD | No adjustments required for EU co-financing | No suggestions | No adjustments required for eligible funding | No suggestions | Slightly improve implementation | Promote the simplification of procedures for preparing and submitting applications and for payment requests. | Assess and change investment strategy. | Envisage specific training and exchange of best practice for managing bodies to improve the choice of the projects selected for funding. |
| Mecklenburg-Vorpommern—ERDF | T | EU co-financing should be slightly reduced | Allow some flexibility in reallocation of EU co-funding between regions. | No adjustments required for eligible funding | No suggestions | Slightly improve implementation | Promote the simplification of procedures for preparing and submitting applications and for payment requests. | Assess and change investment strategy. | Envisage specific training and exchange of best practice for managing bodies to improve the choice of the projects selected for funding. |
| Integrated Regional Programme—RO—ERDF | T | EU co-financing should be slightly reduced | Allow some flexibility in reallocation of EU co-funding between regions. | Eligible funding should be reduced | Allow more flexibility in reallocation of funding between regions and Investment Priorities. | Strongly improve implementation | Envisage specific training and exchange of best practice for managing bodies to improve implementation. | Assess and change investment strategy. | Envisage specific training and exchange of best practice for managing bodies to improve the choice of the projects selected for funding. |
| Growth and Employment—LV—ERDF/ESF/CF/YEI | LD | No adjustments required for EU co-financing | No suggestions | No adjustments required for eligible funding | No suggestions | Moderately improve implementation | Create additional opportunities for direct consultation and increase the support and guidance given to applicants | Assess and change investment strategy. | Envisage specific training and exchange of best practice for managing bodies to improve the choice of the projects selected for funding. |
| Hessen—ERDF | MD | EU co-financing should be slightly reduced | Allow some flexibility in reallocation of EU co-funding between regions. | No adjustments required for eligible funding | No suggestions | No adjustments required for Implementation | No suggestions | Assess and change investment strategy. | Envisage specific training and exchange of best practice for managing bodies to improve the choice of the projects selected for funding. |
| Norte—ERDF/ESF | LD | EU co-financing should be reduced | Allow more flexibility in reallocation of EU co-funding between regions. | No adjustments required for eligible funding | No suggestions | No adjustments required for Implementation | No suggestions | Assess and change investment strategy. | Envisage specific training and exchange of best practice for managing bodies to improve the choice of the projects selected for funding. |
| Sachsen-Anhalt—ERDF | T | No adjustments required for EU co-financing | No suggestions | No adjustments required for eligible funding | No suggestions | Shift funding to regions or other investment priorities with more capacity to spend | Shift funding to regions or other investment priorities with more capacity to spend. | Assess and change investment strategy. | Envisage specific training and exchange of best practice for managing bodies to improve the choice of the projects selected for funding. |
| Pomorskie Voivodeship—ERDF/ESF | LD | No adjustments required for EU co-financing | No suggestions | No adjustments required for eligible funding | No suggestions | Slightly improve implementation | Promote the simplification of procedures for preparing and submitting applications and for payment requests. | Assess and change investment strategy. | Envisage specific training and exchange of best practice for managing bodies to improve the choice of the projects selected for funding. |
| Andalucía—ERDF | T | EU co-financing should be slightly reduced | Allow some flexibility in reallocation of EU co-funding between regions. | No adjustments required for eligible funding | No suggestions | Moderately improve implementation | Create additional opportunities for direct consultation and increase the support and guidance given to applicants | Assess and change investment strategy. | Envisage specific training and exchange of best practice for managing bodies to improve the choice of the projects selected for funding. |
| Luxembourg—ERDF | MD | No adjustments required for EU co-financing | No suggestions | No adjustments required for eligible funding | No suggestions | Shift funding to regions or other investment priorities with more capacity to spend | Shift funding to regions or other investment priorities with more capacity to spend. | Assess and change investment strategy. | Envisage specific training and exchange of best practice for managing bodies to improve the choice of the projects selected for funding. |
| Basilicata—ERDF | LD | No adjustments required for EU co-financing | No suggestions | No adjustments required for eligible funding | No suggestions | Slightly improve implementation | Promote the simplification of procedures for preparing and submitting applications and for payment requests. | Assess and change investment strategy. | Envisage specific training and exchange of best practice for managing bodies to improve the choice of the projects selected for funding. |
| Extremadura—ERDF | LD | EU co-financing should be slightly reduced | Allow some flexibility in reallocation of EU co-funding between regions. | No adjustments required for eligible funding | No suggestions | No adjustments required for Implementation | No suggestions | Assess and change investment strategy. | Envisage specific training and exchange of best practice for managing bodies to improve the choice of the projects selected for funding. |
| Bretagne—ERDF/ESF | MD | No adjustments required for EU co-financing | No suggestions | No adjustments required for eligible funding | No suggestions | No adjustments required for Implementation | No suggestions | Assess and change investment strategy. | Envisage specific training and exchange of best practice for managing bodies to improve the choice of the projects selected for funding. |
| La Rioja—ERDF | MD | No adjustments required for EU co-financing | No suggestions | No adjustments required for eligible funding | No suggestions | Moderately improve implementation | Create additional opportunities for direct consultation and increase the support and guidance given to applicants | Assess and change investment strategy. | Envisage specific training and exchange of best practice for managing bodies to improve the choice of the projects selected for funding. |
| Calabria—ERDF/ESF | LD | No adjustments required for EU co-financing | No suggestions | No adjustments required for eligible funding | No suggestions | Slightly improve implementation | Promote the simplification of procedures for preparing and submitting applications and for payment requests. | Assess and change investment strategy. | Envisage specific training and exchange of best practice for managing bodies to improve the choice of the projects selected for funding. |
| Baden-Württemberg—ERDF | MD | No adjustments required for EU co-financing | No suggestions | No adjustments required for eligible funding | No suggestions | Strongly improve implementation | Envisage specific training and exchange of best practice for managing bodies to improve implementation. | Assess and change investment strategy. | Envisage specific training and exchange of best practice for managing bodies to improve the choice of the projects selected for funding. |
| Corse—ERDF/ESF | T | No adjustments required for EU co-financing | No suggestions | No adjustments required for eligible funding | No suggestions | No adjustments required for Implementation | No suggestions | Assess and change investment strategy. | Envisage specific training and exchange of best practice for managing bodies to improve the choice of the projects selected for funding. |
| Auvergne—ERDF/ESF/YEI | T | No adjustments required for EU co-financing | No suggestions | No adjustments required for eligible funding | No suggestions | Improve implementation | Better clarify the eligibility and selection criteria for each of the calls in order to reduce the failure rate of implementation. | Assess and change investment strategy. | Envisage specific training and exchange of best practice for managing bodies to improve the choice of the projects selected for funding. |
| Cataluña—ERDF | MD | No adjustments required for EU co-financing | No suggestions | Eligible funding should be slightly reduced | Allow some flexibility in reallocation of funding between regions and Investment Priorities. | No adjustments required for Implementation | No suggestions | Assess and change investment strategy. | Envisage specific training and exchange of best practice for managing bodies to improve the choice of the projects selected for funding. |
| Centre—ERDF/ESF/YEI | MD | No adjustments required for EU co-financing | No suggestions | No adjustments required for eligible funding | No suggestions | Shift funding to regions or other investment priorities with more capacity to spend | Shift funding to regions or other investment priorities with more capacity to spend. | Assess and change investment strategy. | Envisage specific training and exchange of best practice for managing bodies to improve the choice of the projects selected for funding. |
| Berlin—ERDF | MD | No adjustments required for EU co-financing | No suggestions | Eligible funding should be reduced | Allow more flexibility in reallocation of funding between regions and Investment Priorities. | No adjustments required for Implementation | No suggestions | Assess and change investment strategy. | Envisage specific training and exchange of best practice for managing bodies to improve the choice of the projects selected for funding. |
| Madrid—ERDF | MD | No adjustments required for EU co-financing | No suggestions | No adjustments required for eligible funding | No suggestions | Improve implementation | Better clarify the eligibility and selection criteria for each of the calls in order to reduce the failure rate of implementation. | Assess and change investment strategy. | Envisage specific training and exchange of best practice for managing bodies to improve the choice of the projects selected for funding. |
| Competitive Central-Hungary—ERDF/ESF | MD | No adjustments required for EU co-financing | No suggestions | No adjustments required for eligible funding | No suggestions | Strongly improve implementation | Envisage specific training and exchange of best practice for managing bodies to improve implementation. | Assess and change investment strategy. | Envisage specific training and exchange of best practice for managing bodies to improve the choice of the projects selected for funding. |
| Haute-Normandie—ERDF/ESF/YEI | MD | No adjustments required for EU co-financing | No suggestions | No adjustments required for eligible funding | No suggestions | Improve implementation | Better clarify the eligibility and selection criteria for each of the calls in order to reduce the failure rate of implementation. | Assess and change investment strategy. | Envisage specific training and exchange of best practice for managing bodies to improve the choice of the projects selected for funding. |
| Asturias—ERDF | MD | EU co-financing should be reduced | Allow more flexibility in reallocation of EU co-funding between regions. | No adjustments required for eligible funding | No suggestions | Improve implementation | Better clarify the eligibility and selection criteria for each of the calls in order to reduce the failure rate of implementation. | Assess and change investment strategy. | Envisage specific training and exchange of best practice for managing bodies to improve the choice of the projects selected for funding. |
| Nord-Pas de Calais—ERDF/ESF/YEI | T | No adjustments required for EU co-financing | No suggestions | No adjustments required for eligible funding | No suggestions | Strongly improve implementation | Envisage specific training and exchange of best practice for managing bodies to improve implementation. | Assess and change investment strategy. | Envisage specific training and exchange of best practice for managing bodies to improve the choice of the projects selected for funding. |
| Limousin—ERDF/ESF | T | No adjustments required for EU co-financing | No suggestions | No adjustments required for eligible funding | No suggestions | No adjustments required for Implementation | No suggestions | Assess and change investment strategy. | Envisage specific training and exchange of best practice for managing bodies to improve the choice of the projects selected for funding. |
| Valle d’Aosta—ERDF | MD | No adjustments required for EU co-financing | No suggestions | No adjustments required for eligible funding | No suggestions | Shift funding to regions or other investment priorities with more capacity to spend | Shift funding to regions or other investment priorities with more capacity to spend. | Assess and change investment strategy. | Envisage specific training and exchange of best practice for managing bodies to improve the choice of the projects selected for funding. |
| Central Macedonia—ERDF/ESF | LD | No adjustments required for EU co-financing | No suggestions | No adjustments required for eligible funding | No suggestions | Shift funding to regions or other investment priorities with more capacity to spend | Shift funding to regions or other investment priorities with more capacity to spend. | Assess and change investment strategy. | Envisage specific training and exchange of best practice for managing bodies to improve the choice of the projects selected for funding. |
| Bolzano—ERDF | MD | No adjustments required for EU co-financing | No suggestions | No adjustments required for eligible funding | No suggestions | Strongly improve implementation | Envisage specific training and exchange of best practice for managing bodies to improve implementation. | Assess and change investment strategy. | Envisage specific training and exchange of best practice for managing bodies to improve the choice of the projects selected for funding. |
| Île-de-France et Seine—ESF/ERDF/YEI | MD | No adjustments required for EU co-financing | No suggestions | Eligible funding should be slightly reduced | Allow some flexibility in reallocation of funding between regions and Investment Priorities. | Shift funding to regions or other investment priorities with more capacity to spend | Shift funding to regions or other investment priorities with more capacity to spend. | Assess and change investment strategy. | Envisage specific training and exchange of best practice for managing bodies to improve the choice of the projects selected for funding. |
| Emilia-Romagna—ERDF | MD | No adjustments required for EU co-financing | No suggestions | No adjustments required for eligible funding | No suggestions | Slightly improve implementation | Promote the simplification of procedures for preparing and submitting applications and for payment requests. | Assess and change investment strategy. | Envisage specific training and exchange of best practice for managing bodies to improve the choice of the projects selected for funding. |
| Central Norrland—ERDF | MD | No adjustments required for EU co-financing | No suggestions | No adjustments required for eligible funding | No suggestions | Improve implementation | Better clarify the eligibility and selection criteria for each of the calls in order to reduce the failure rate of implementation. | Assess and change investment strategy. | Envisage specific training and exchange of best practice for managing bodies to improve the choice of the projects selected for funding. |
| Northern Ireland—ERDF | T | No adjustments required for EU co-financing | No suggestions | No adjustments required for eligible funding | No suggestions | No adjustments required for Implementation | No suggestions | Assess and change investment strategy. | Envisage specific training and exchange of best practice for managing bodies to improve the choice of the projects selected for funding. |
| Lazio—ERDF | MD | No adjustments required for EU co-financing | No suggestions | Eligible funding should be reduced | Allow more flexibility in reallocation of funding between regions and Investment Priorities. | Moderately improve implementation | Create additional opportunities for direct consultation and increase the support and guidance given to applicants | Assess and change investment strategy. | Envisage specific training and exchange of best practice for managing bodies to improve the choice of the projects selected for funding. |
| Bremen—ERDF | MD | No adjustments required for EU co-financing | No suggestions | No adjustments required for eligible funding | No suggestions | Shift funding to regions or other investment priorities with more capacity to spend | Shift funding to regions or other investment priorities with more capacity to spend. | Assess and change investment strategy. | Envisage specific training and exchange of best practice for managing bodies to improve the choice of the projects selected for funding. |
| Thüringen—ERDF | T | EU co-financing should be slightly reduced | Allow some flexibility in reallocation of EU co-funding between regions. | No adjustments required for eligible funding | No suggestions | Improve implementation | Better clarify the eligibility and selection criteria for each of the calls in order to reduce the failure rate of implementation. | Assess and change investment strategy. | Envisage specific training and exchange of best practice for managing bodies to improve the choice of the projects selected for funding. |
| Brandenburg—ERDF | T | EU co-financing should be slightly reduced | Allow some flexibility in reallocation of EU co-funding between regions. | No adjustments required for eligible funding | No suggestions | Strongly improve implementation | Envisage specific training and exchange of best practice for managing bodies to improve implementation. | Assess and change investment strategy. | Envisage specific training and exchange of best practice for managing bodies to improve the choice of the projects selected for funding. |
| Bayern—ERDF | MD | No adjustments required for EU co-financing | No suggestions | Eligible funding should be slightly reduced | Allow some flexibility in reallocation of funding between regions and Investment Priorities. | No adjustments required for Implementation | No suggestions | Assess and change investment strategy. | Envisage specific training and exchange of best practice for managing bodies to improve the choice of the projects selected for funding. |
| Toscana—ERDF | MD | No adjustments required for EU co-financing | No suggestions | Eligible funding should be reduced | Allow more flexibility in reallocation of funding between regions and Investment Priorities. | Shift funding to regions or other investment priorities with more capacity to spend | Shift funding to regions or other investment priorities with more capacity to spend. | Assess and change investment strategy. | Envisage specific training and exchange of best practice for managing bodies to improve the choice of the projects selected for funding. |
| Wallonia—ERDF | T | No adjustments required for EU co-financing | No suggestions | No adjustments required for eligible funding | No suggestions | Shift funding to regions or other investment priorities with more capacity to spend | Shift funding to regions or other investment priorities with more capacity to spend. | Assess and change investment strategy. | Envisage specific training and exchange of best practice for managing bodies to improve the choice of the projects selected for funding. |
| Sardegna—ERDF | T | No adjustments required for EU co-financing | No suggestions | No adjustments required for eligible funding | No suggestions | Slightly improve implementation | Promote the simplification of procedures for preparing and submitting applications and for payment requests. | Assess and change investment strategy. | Envisage specific training and exchange of best practice for managing bodies to improve the choice of the projects selected for funding. |
References
- Levy, C.A. Low Carbon Economy A Knowledge Economy Programme Report. The Work Foundation. 2010. Available online: https://citeseerx.ist.psu.edu/viewdoc/download?doi=10.1.1.620.4765&rep=rep1&type=pdf (accessed on 2 January 2022).
- Lopez-Rodriguez, J.; Faiña, J. Rhomolo and other methodologies to assess: The European Cohesion Policy. Investig. Reg. 2014, 29, 5–13. Available online: https://www.redalyc.org/articulo.oa?id=28932224001 (accessed on 2 January 2022).
- Marzinotto, B. The growth effects of EU cohesion policy: A meta-analysis. Bruegel Work. Pap. 2012, 14. Available online: http://bruegel.org/wp-content/uploads/imported/publications/WP_2012_14_cohesion__2_.pdf (accessed on 2 January 2022).
- Berkowitz, P.; Monfort, P.; Pieńkowski, J. Unpacking the growth impacts of European Union Cohesion Policy: Transmission channels from Cohesion Policy into economic growth. Reg. Stud. 2020, 54, 60–71. [Google Scholar] [CrossRef]
- Durlauf, S. The rise and fall of cross-country growth regressions. Hist. Political Econ. 2009, 41, 315–333. [Google Scholar] [CrossRef] [Green Version]
- Wostner, P.; Šlander, S. The Effectiveness of EU Cohesion Policy Revisited: Are EU Funds Really Additional? European Policies Research Centre. 2019. Available online: https://www.researchgate.net/profile/Peter_Wostner/publication/228427571_The_effectiveness_of_EU_cohesion_policy_revisited_are_EU_funds_really_additional/links/0c96052af0d2e434f1000000/The-effectiveness-of-EU-cohesion-policy-revisited-are-EU-funds-really-additional.pdf (accessed on 2 January 2022).
- Polverari, L.; Bachtler, J. Balance of Competences Cohesion Review: Literature Review on EU Cohesion Policy. Final Report to the Department for Business, Innovation and Skills. 2014. Available online: http://www.eprc-strath.eu/uploads/news/EPRC_BoC_CP_FINAL_18072014.pdf (accessed on 2 January 2022).
- Gouveia, M.C.; Henriques, C.O.; Costa, P. Evaluating the efficiency of structural funds: An application in the competitiveness of SMEs across different EU beneficiary regions. Omega 2021, 101, 102265. [Google Scholar] [CrossRef]
- Athanassopoulos, A. Assessing the comparative spatial disadvantage (CSD) of regions in the European Union using non-radial data envelopment analysis methods. Eur. J. Oper. Res. 1996, 94, 439–452. [Google Scholar] [CrossRef]
- Kutan, A.M.; Yigit, T.M. European integration, productivity growth and real convergence. Eur. Econ. Rev. 2007, 51, 1370–1395. [Google Scholar] [CrossRef] [Green Version]
- Gómez-García, J.; Enguix, M.D.R.M.; Gómez-Gallego, J.C. Estimation of the efficiency of structural funds: A parametric and nonparametric approach. Appl. Econ. 2012, 44, 3935–3954. [Google Scholar] [CrossRef]
- European Economic and Social Committee. Assessment of the Effectiveness of the EU SME Policies 2007–2015. 2017. Available online: https://www.eesc.europa.eu/sites/default/files/resources/docs/qe-02-17-762-en-n.pdf (accessed on 19 December 2021).
- European Commission. Evaluation of Cohesion Policy in the Member States. 2021. Available online: https://cohesiondata.ec.europa.eu/stories/s/suip-d9qs (accessed on 19 December 2021).
- Liu, X.; Liu, J. Measurement of low carbon economy efficiency with a three-stage data envelopment analysis: A comparison of the largest twenty CO2 emitting countries. Int. J. Environ. Res. Public Health 2016, 13, 1116. [Google Scholar] [CrossRef]
- Zhang, J.; Zeng, W.; Wang, J.; Yang, F.; Jiang, H. Regional low-carbon economy efficiency in China: Analysis based on the Super-SBM model with CO2 emissions. J. Clean. Prod. 2017, 163, 202–211. [Google Scholar] [CrossRef]
- Meng, M.; Fu, Y.; Wang, L. Low-carbon economy efficiency analysis of China’s provinces based on a range-adjusted measure and data envelopment analysis model. J. Clean. Prod. 2018, 199, 643–650. [Google Scholar] [CrossRef]
- Zha, J.; He, L.; Liu, Y.; Shao, Y. Evaluation on development efficiency of low-carbon tourism economy: A case study of Hubei Province, China. Socio-Econ. Plan. Sci. 2019, 66, 47–57. [Google Scholar] [CrossRef]
- Zhang, Y.; Shen, L.; Shuai, C.; Tan, Y.; Ren, Y.; Wu, Y. Is the low-carbon economy efficient in terms of sustainable development? A global perspective. Sustain. Dev. 2019, 27, 130–152. [Google Scholar] [CrossRef] [Green Version]
- Chen, Y.; Liu, S.; Wu, H.; Zhang, X.; Zhou, Q. How can Belt and Road countries contribute to glocal low-carbon development? J. Clean. Prod. 2020, 256, 120717. [Google Scholar] [CrossRef]
- Zhang, Y.; Wang, W.; Liang, L.; Wang, D.; Cui, X.; Wei, W. Spatial-temporal pattern evolution and driving factors of China’s energy efficiency under low-carbon economy. Sci. Total Environ. 2020, 739, 140197. [Google Scholar] [CrossRef]
- Tone, K. A slacks-based measure of efficiency in data envelopment analysis. Eur. J. Oper. Res. 2001, 130, 498–509. [Google Scholar] [CrossRef] [Green Version]
- Banker, R.D.; Charnes, A.; Cooper, W.W. Some models for estimating technical and scale inefficiencies in data envelopment analysis. Manag. Sci. 1984, 30, 1078–1092. [Google Scholar] [CrossRef] [Green Version]
- Charnes, A.; Cooper, W.W.; Rhodes, E. Measuring the efficiency of decision making units. Eur. J. Oper. Res. 1978, 2, 429–444. [Google Scholar] [CrossRef]
- Charnes, A.; Cooper, W.W.; Golany, B.; Seiford, L.; Stutz, J. Foundations of data envelopment analysis for Pareto-Koopmans efficient empirical production functions. J. Econom. 1985, 30, 91–107. [Google Scholar] [CrossRef]
- Cheng, P.; Jin, Q.; Jiang, H.; Hua, M.; Ye, Z. Efficiency assessment of rural domestic sewage treatment facilities by a slacked-based DEA model. J. Clean. Prod. 2020, 267, 122111. [Google Scholar] [CrossRef]
- Jiang, H.; Hua, M.; Zhang, J.; Cheng, P.; Ye, Z.; Huang, M.; Jin, Q. Sustainability efficiency assessment of wastewater treatment plants in China: A Data Envelopment Analysis Based on Cluster Benchmarking. J. Clean. Prod. 2020, 244, 118729. [Google Scholar] [CrossRef]
- Tone, K.; Tsutsui, M. How to deal with non-convex frontiers in Data Envelopment Analysis. J. Optim. Theory Appl. 2015, 166, 1002–1028. [Google Scholar] [CrossRef]
- Tone, K. A Slacks-Based Measure of Super-Efficiency in Data Envelopment Analysis. Eur. J. Oper. Res. 2002, 143, 32–41. [Google Scholar] [CrossRef] [Green Version]
- Lee, H.S. An integrated model for SBM and Super-SBM DEA models. J. Oper. Res. Soc. 2021, 72, 1174–1182. [Google Scholar] [CrossRef]
- Corton, M.L.; Berg, S.V. Benchmarking central American water utilities. Util. Policy 2009, 17, 267–275. [Google Scholar] [CrossRef] [Green Version]
- Battese, G.E.; Rao, D.P.; O’Donnell, C.J. A metafrontier production function for estimation of technical efficiencies and technology gaps for firms operating under different technologies. J. Product. Anal. 2004, 21, 91–103. [Google Scholar] [CrossRef]
- European Commission. Guidance Document on Monitoring and Evaluation; European Cohesion Fund, European Regional Development Fund. Concepts and Recommendations. 2014. Available online: https://ec.europa.eu/regional_policy/sources/docgener/informat/2014/guidance_monitoring_evaluation_en.pdf (accessed on 23 March 2022).
- Kersan-Škabić, I.; Tijanić, L. Regional abrorption capacity of EU funds. Econ. Res. -Ekon. Istraživanja 2017, 30, 1192–1208. [Google Scholar] [CrossRef]
- Wostner, P. Micro-Efficiency of the EU Cohesion Policy. 2008. Available online: https://papers.ssrn.com/sol3/papers.cfm?abstract_id=1083477 (accessed on 23 March 2022).
- European Court of Auditors. Commission’s and Member States’ Actions in the Last Years of the 2007–2013 Programmes Tackled Low Absorption but Had Insufficient Focus on Results. Special Report no 17/2018. Available online: https://www.eca.europa.eu/Lists/ECADocuments/SR18_17/SR_ABSORPTION_EN.pdf (accessed on 23 March 2022).
- Bachtler, J.; Ferry, M.; Gal, F. Financial Implementation of European Structural and Investment Funds. 2018. Available online: https://www.europarl.europa.eu/RegData/etudes/STUD/2018/621785/IPOL_STU(2018)621785_EN.pdf (accessed on 23 March 2022).
- Bubbico, R.L.; De Michelis, N. The financial execution of Structural Funds. Reg. Focus Work. Pap. 2011, 3, 1–8. [Google Scholar]
- Pilecki, B. Regional operational programs 2014–2020 as a financial instrument supporting low-carbon economy in Poland on the example of the West Pomeranian Voivodeship. Eur. J. Serv. Manag. 2018, 27, 211–216. [Google Scholar] [CrossRef]
- Gramillano, A.; Celotti, P.; Familiari, G.; Schuh, B.; Nordstrom, M. Development of a System of Common Indicators for European Regional Development Fund and Cohesion Fund Interventions after 2020. Study for the DG for Regional and Urban Policy, European Commission. Study Prep. Dir.-Gen. Reg. Urban Policy Eur. Comm. 2018, 10, 279688. [Google Scholar]
- Golany, B.; Roll, Y. An application procedure for DEA. Omega 1989, 17, 237–250. [Google Scholar] [CrossRef]
- Emrouznejad, A.; Hatami-Marbini, A.; Tavana, M. A taxonomy and review of the fuzzy data envelopment analysis literature: Two decades in the making. Eur. J. Oper. Res. 2011, 214, 457–472. [Google Scholar] [CrossRef]
- Hughes, A.; Yaisawarng, S. Sensitivity and dimensionality tests of DEA efficiency scores. Eur. J. Oper. Res. 2004, 154, 410–422. [Google Scholar] [CrossRef]
- Hu, W.; Guo, Y.; Tian, J.; Chen, L. Eco-efficiency of centralized wastewater treatment plants in industrial parks: A slack-based data envelopment analysis. Resour. Conserv. Recycl. 2019, 141, 176–186. [Google Scholar] [CrossRef]
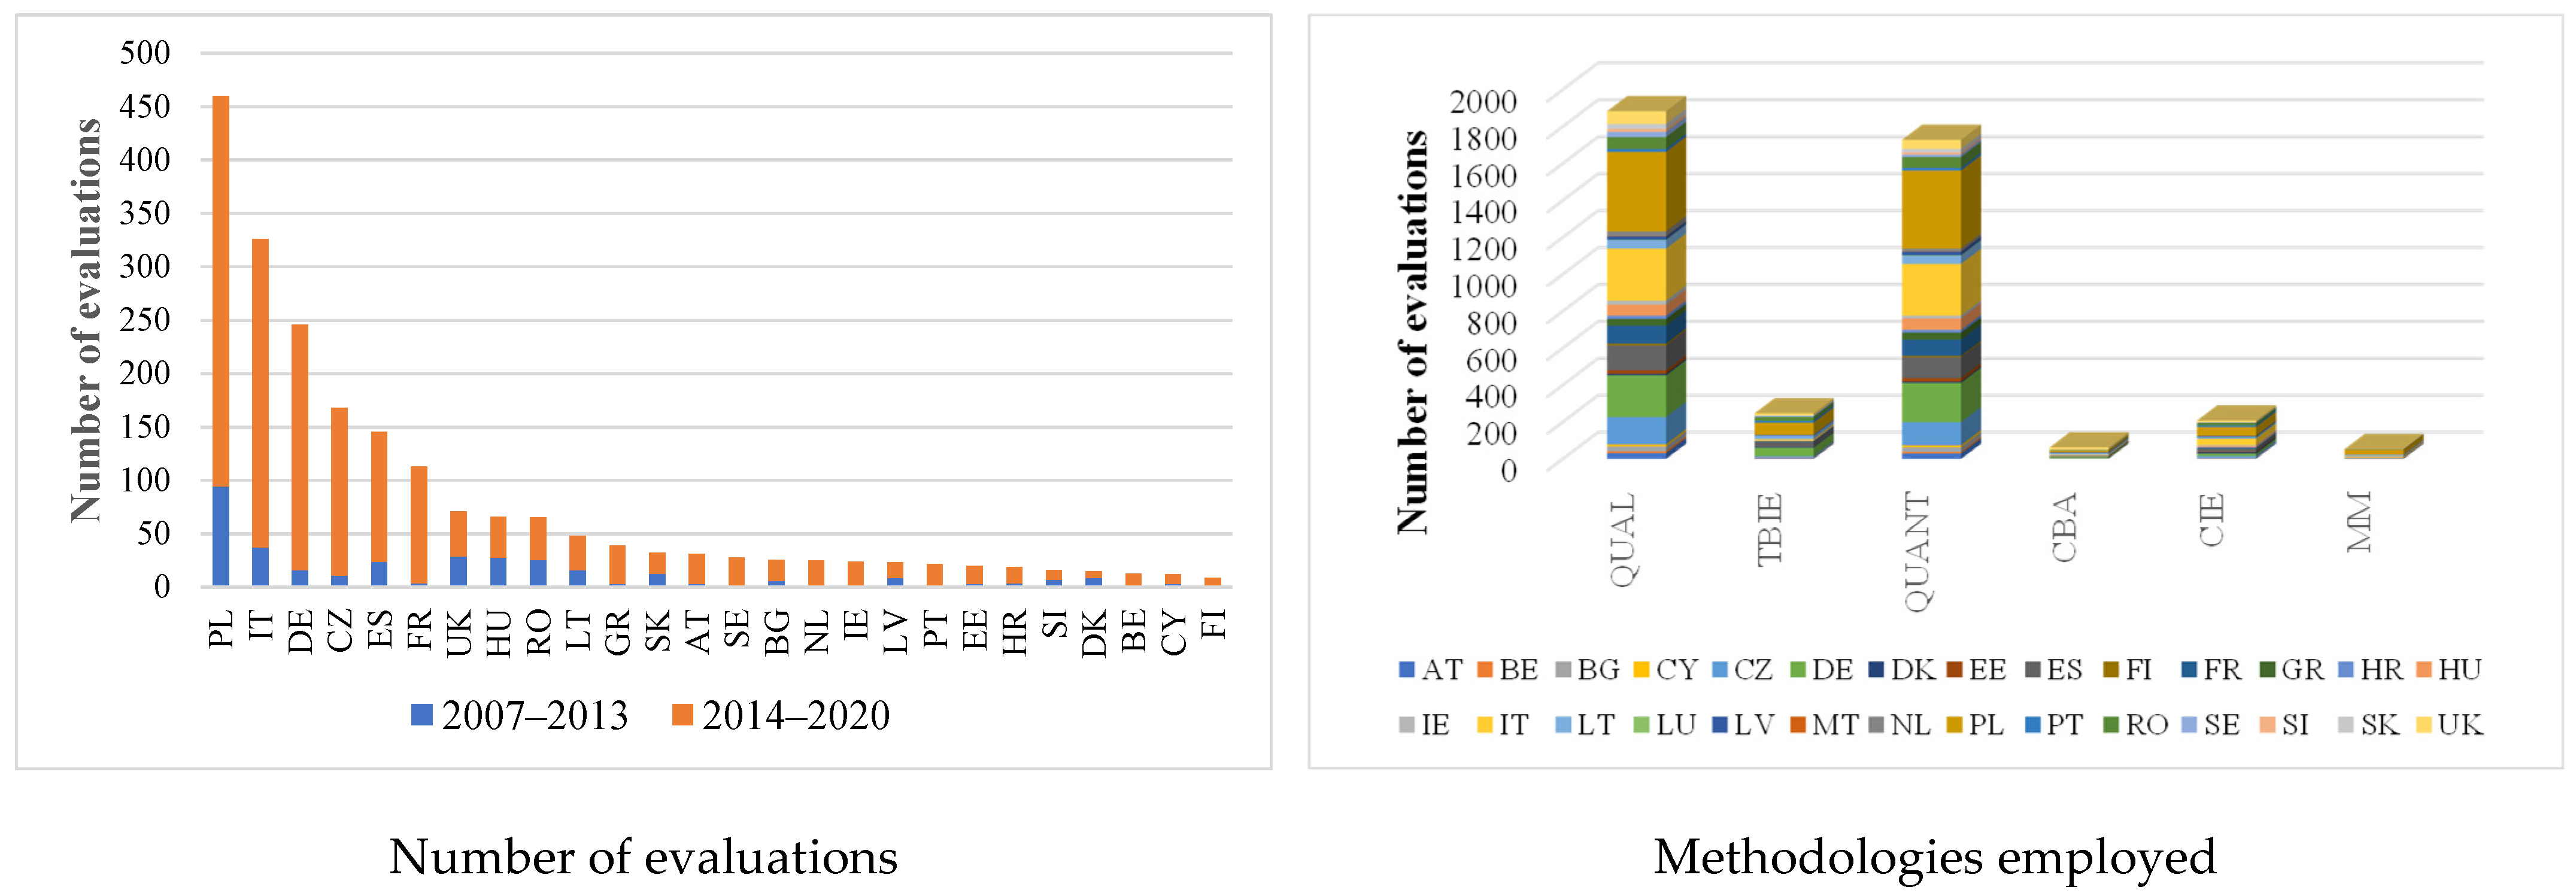
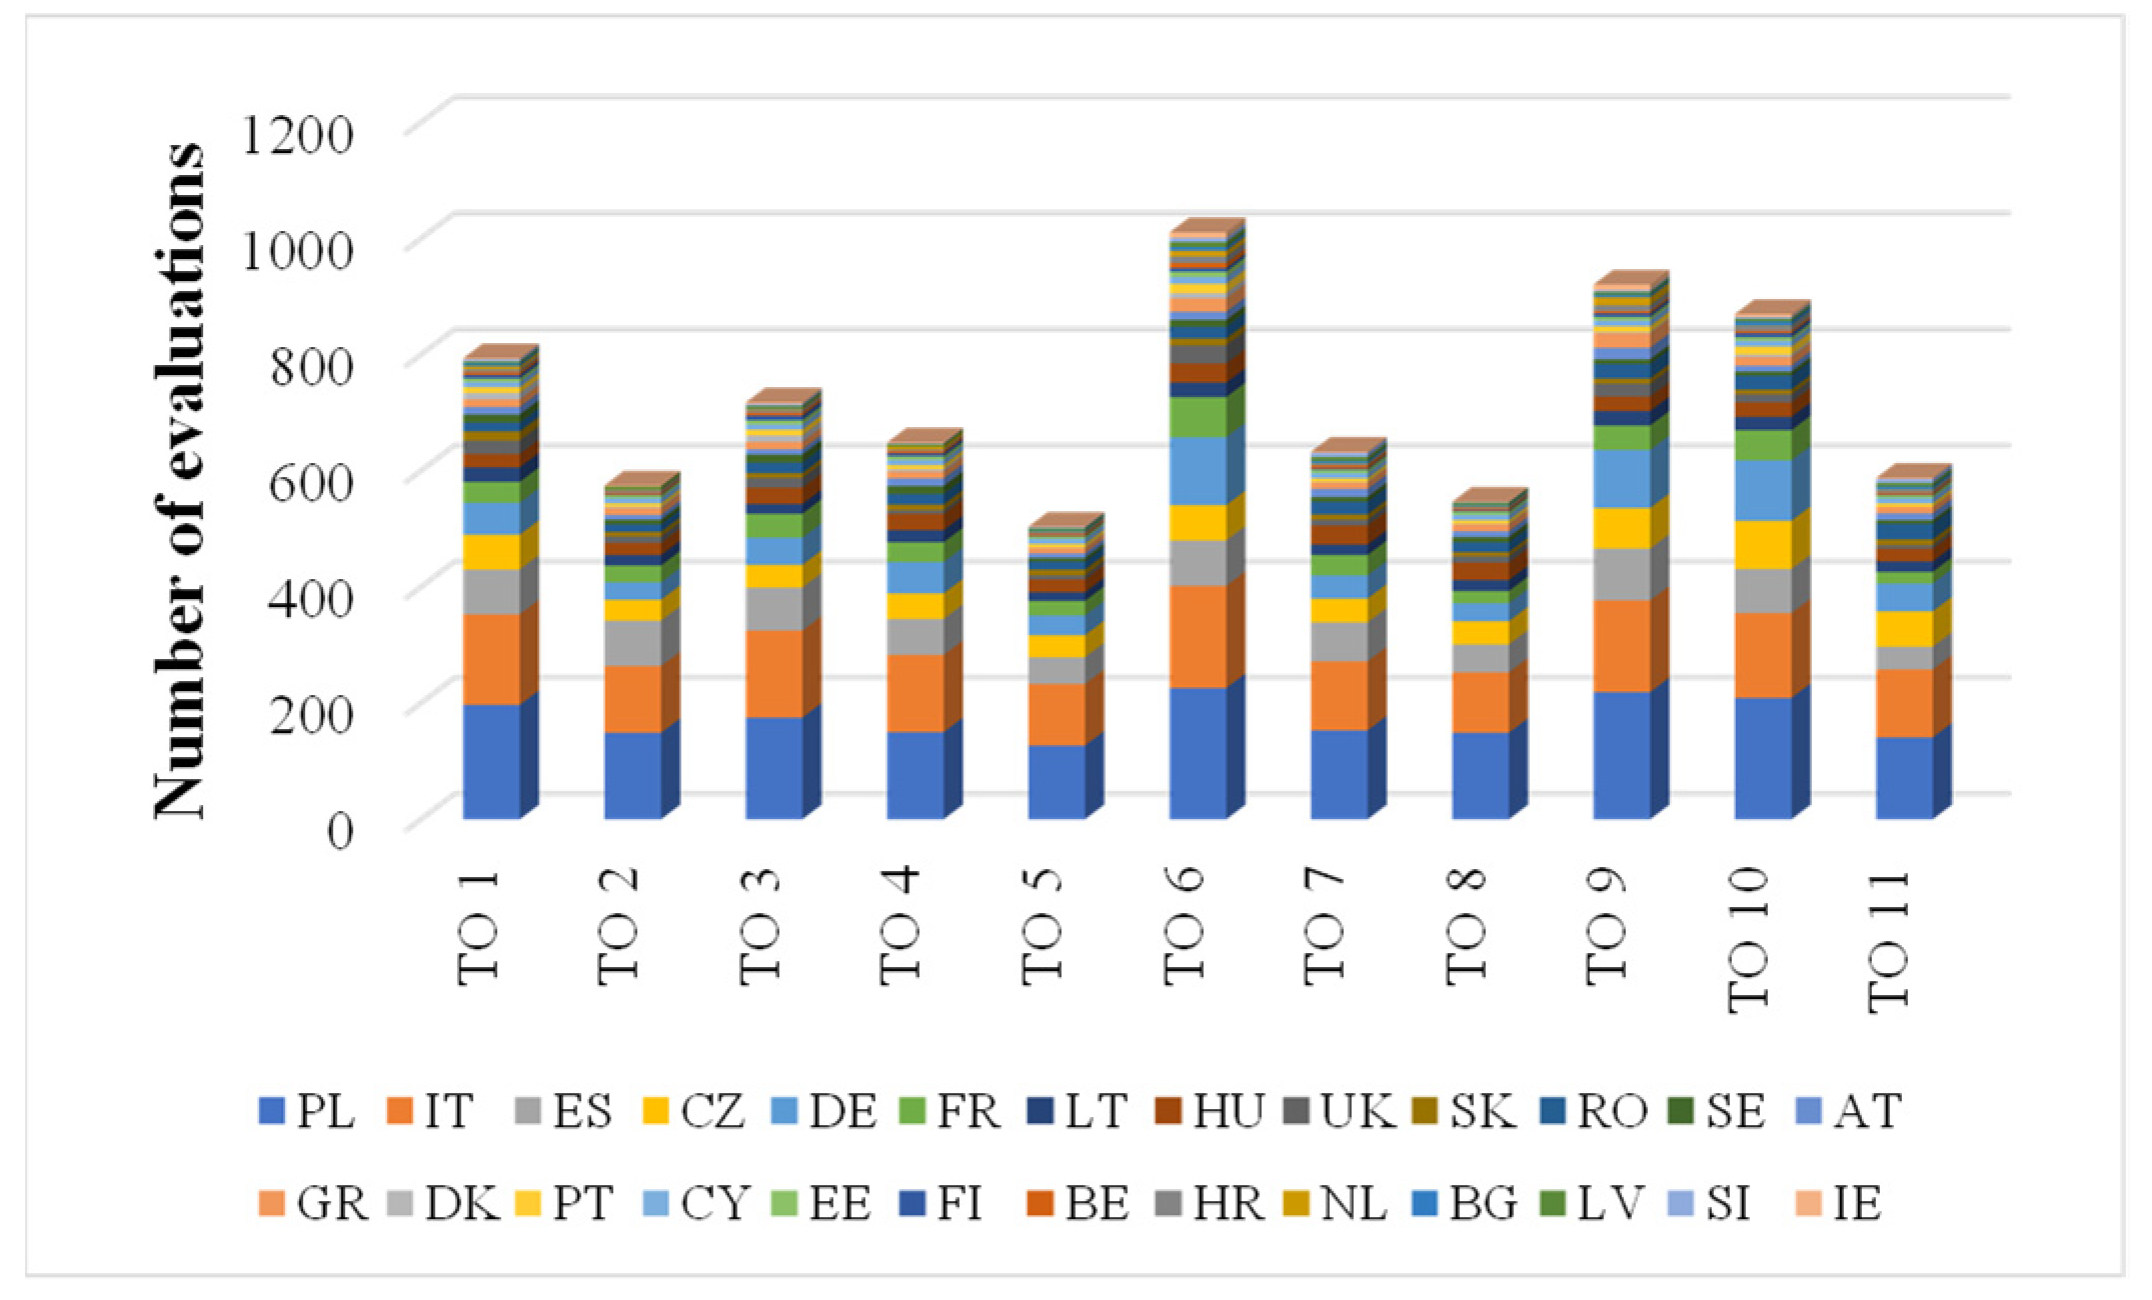
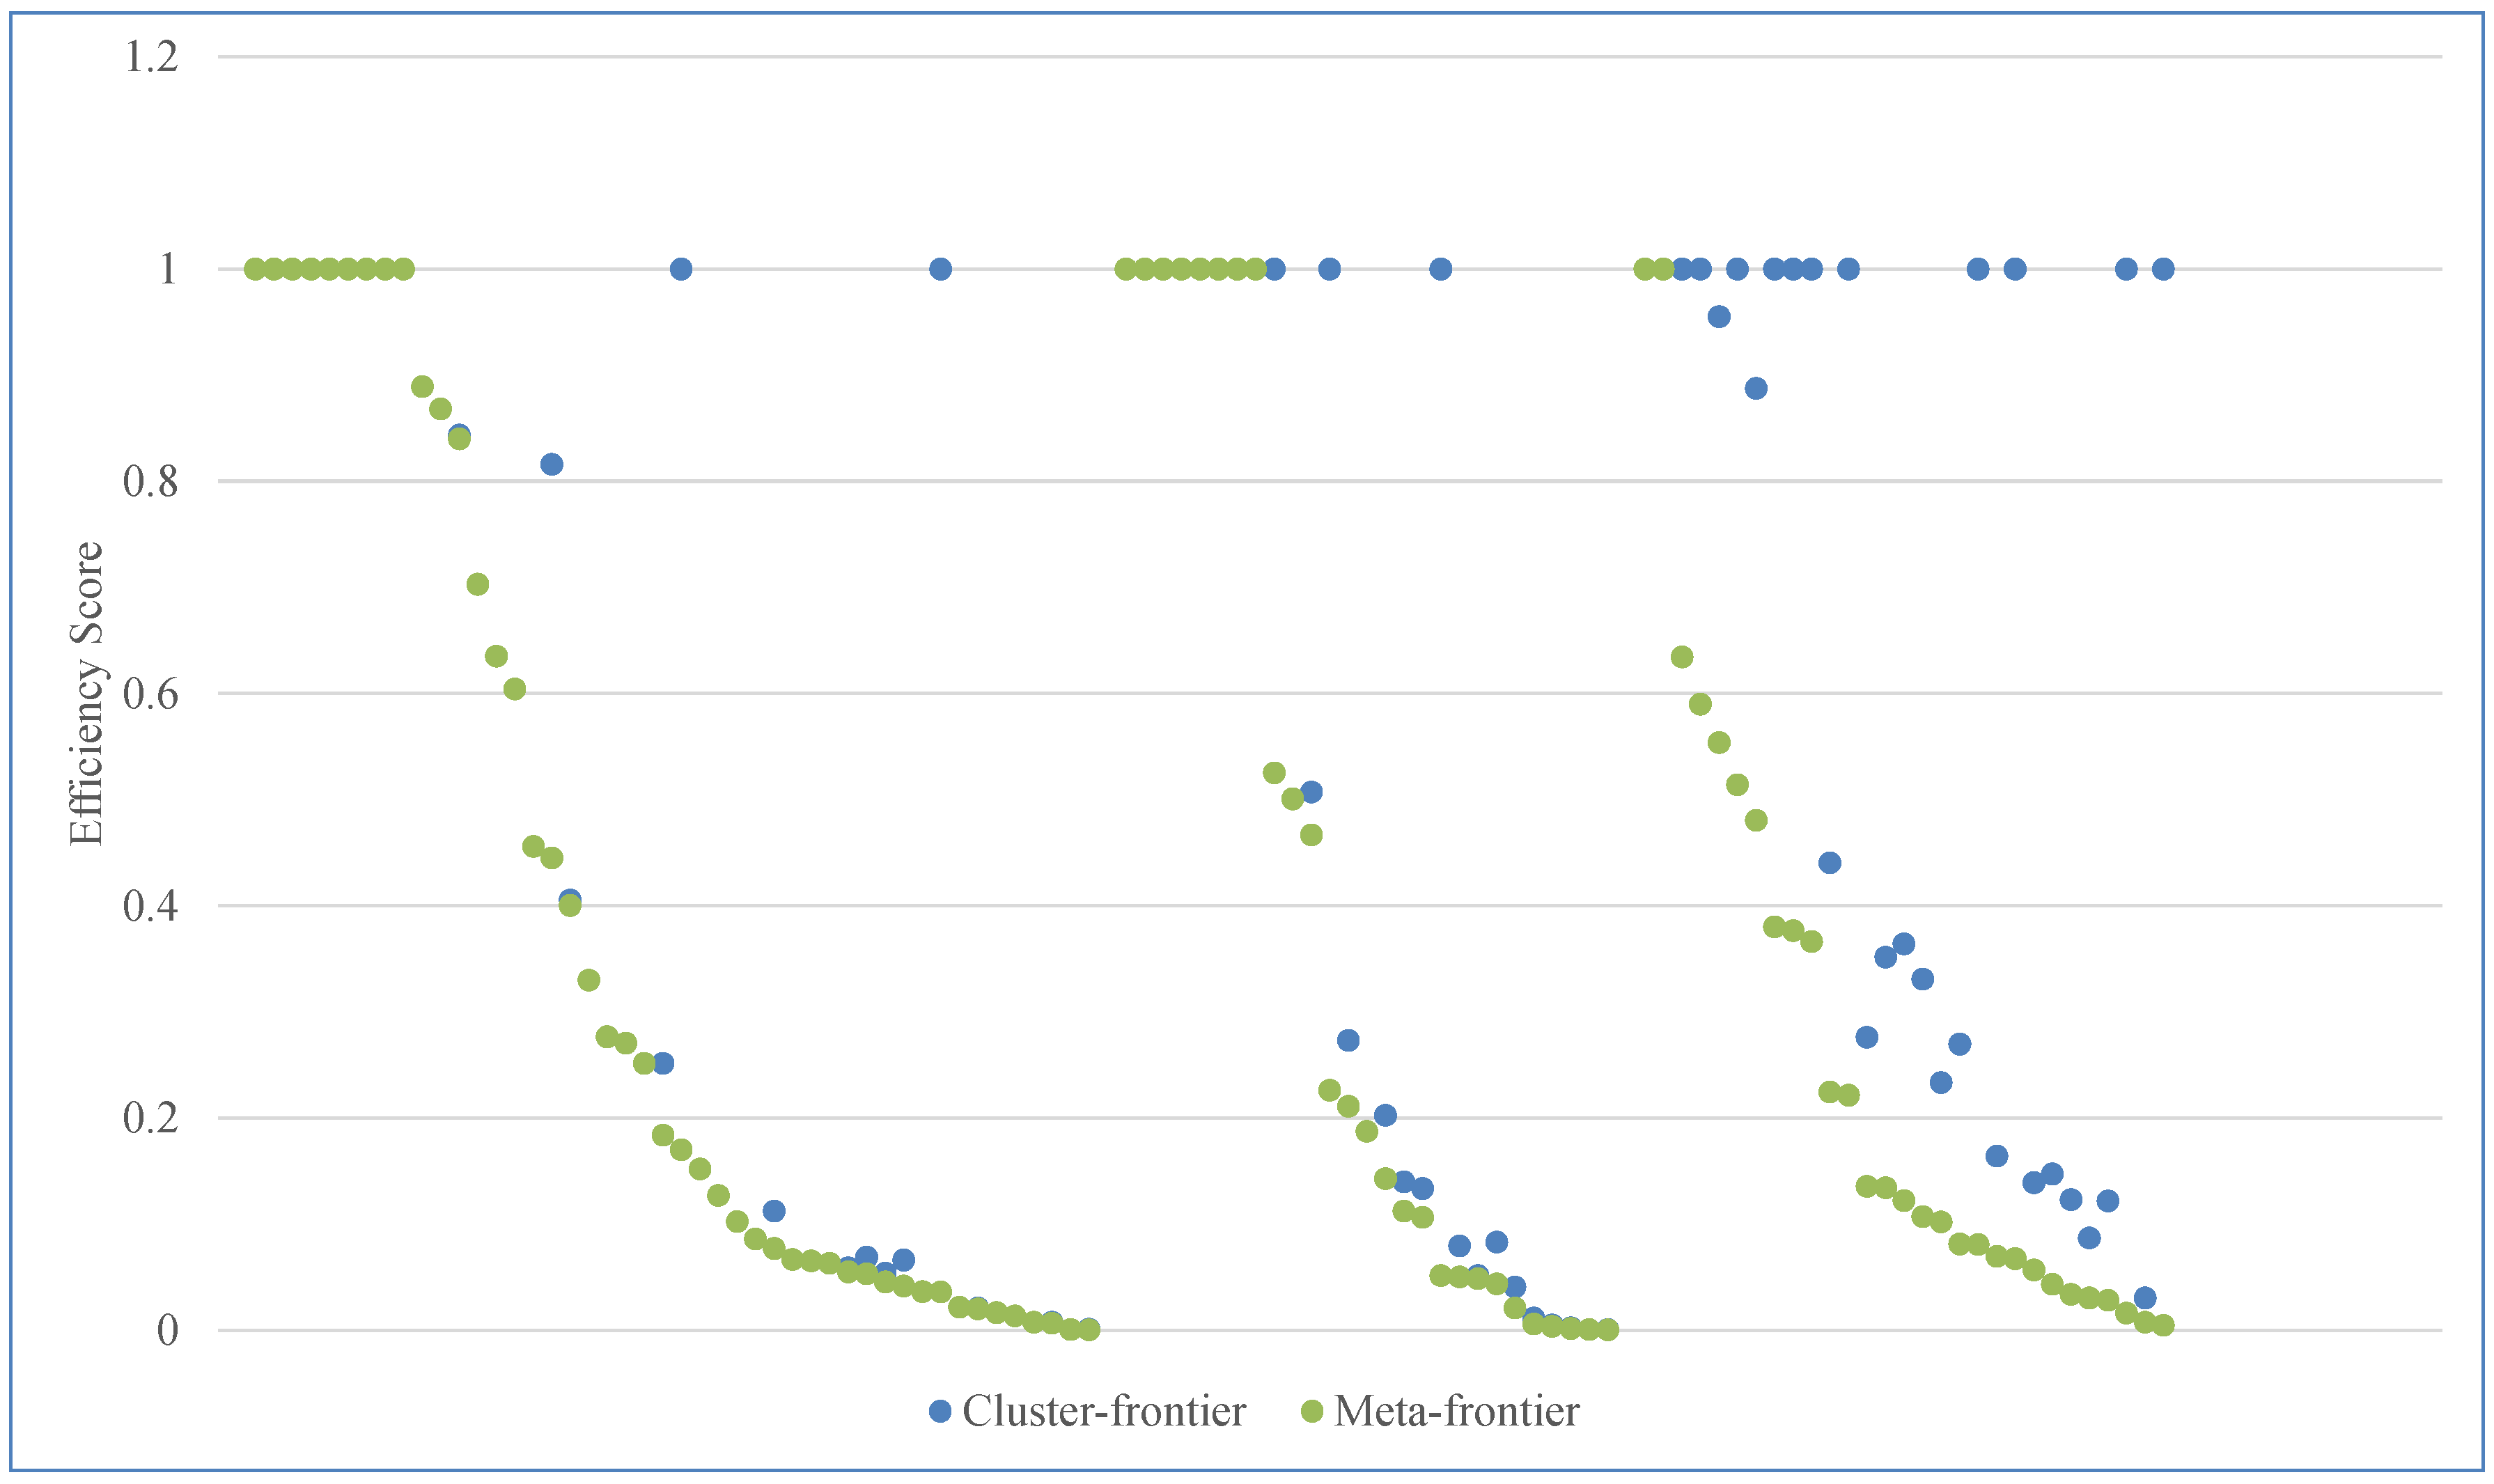
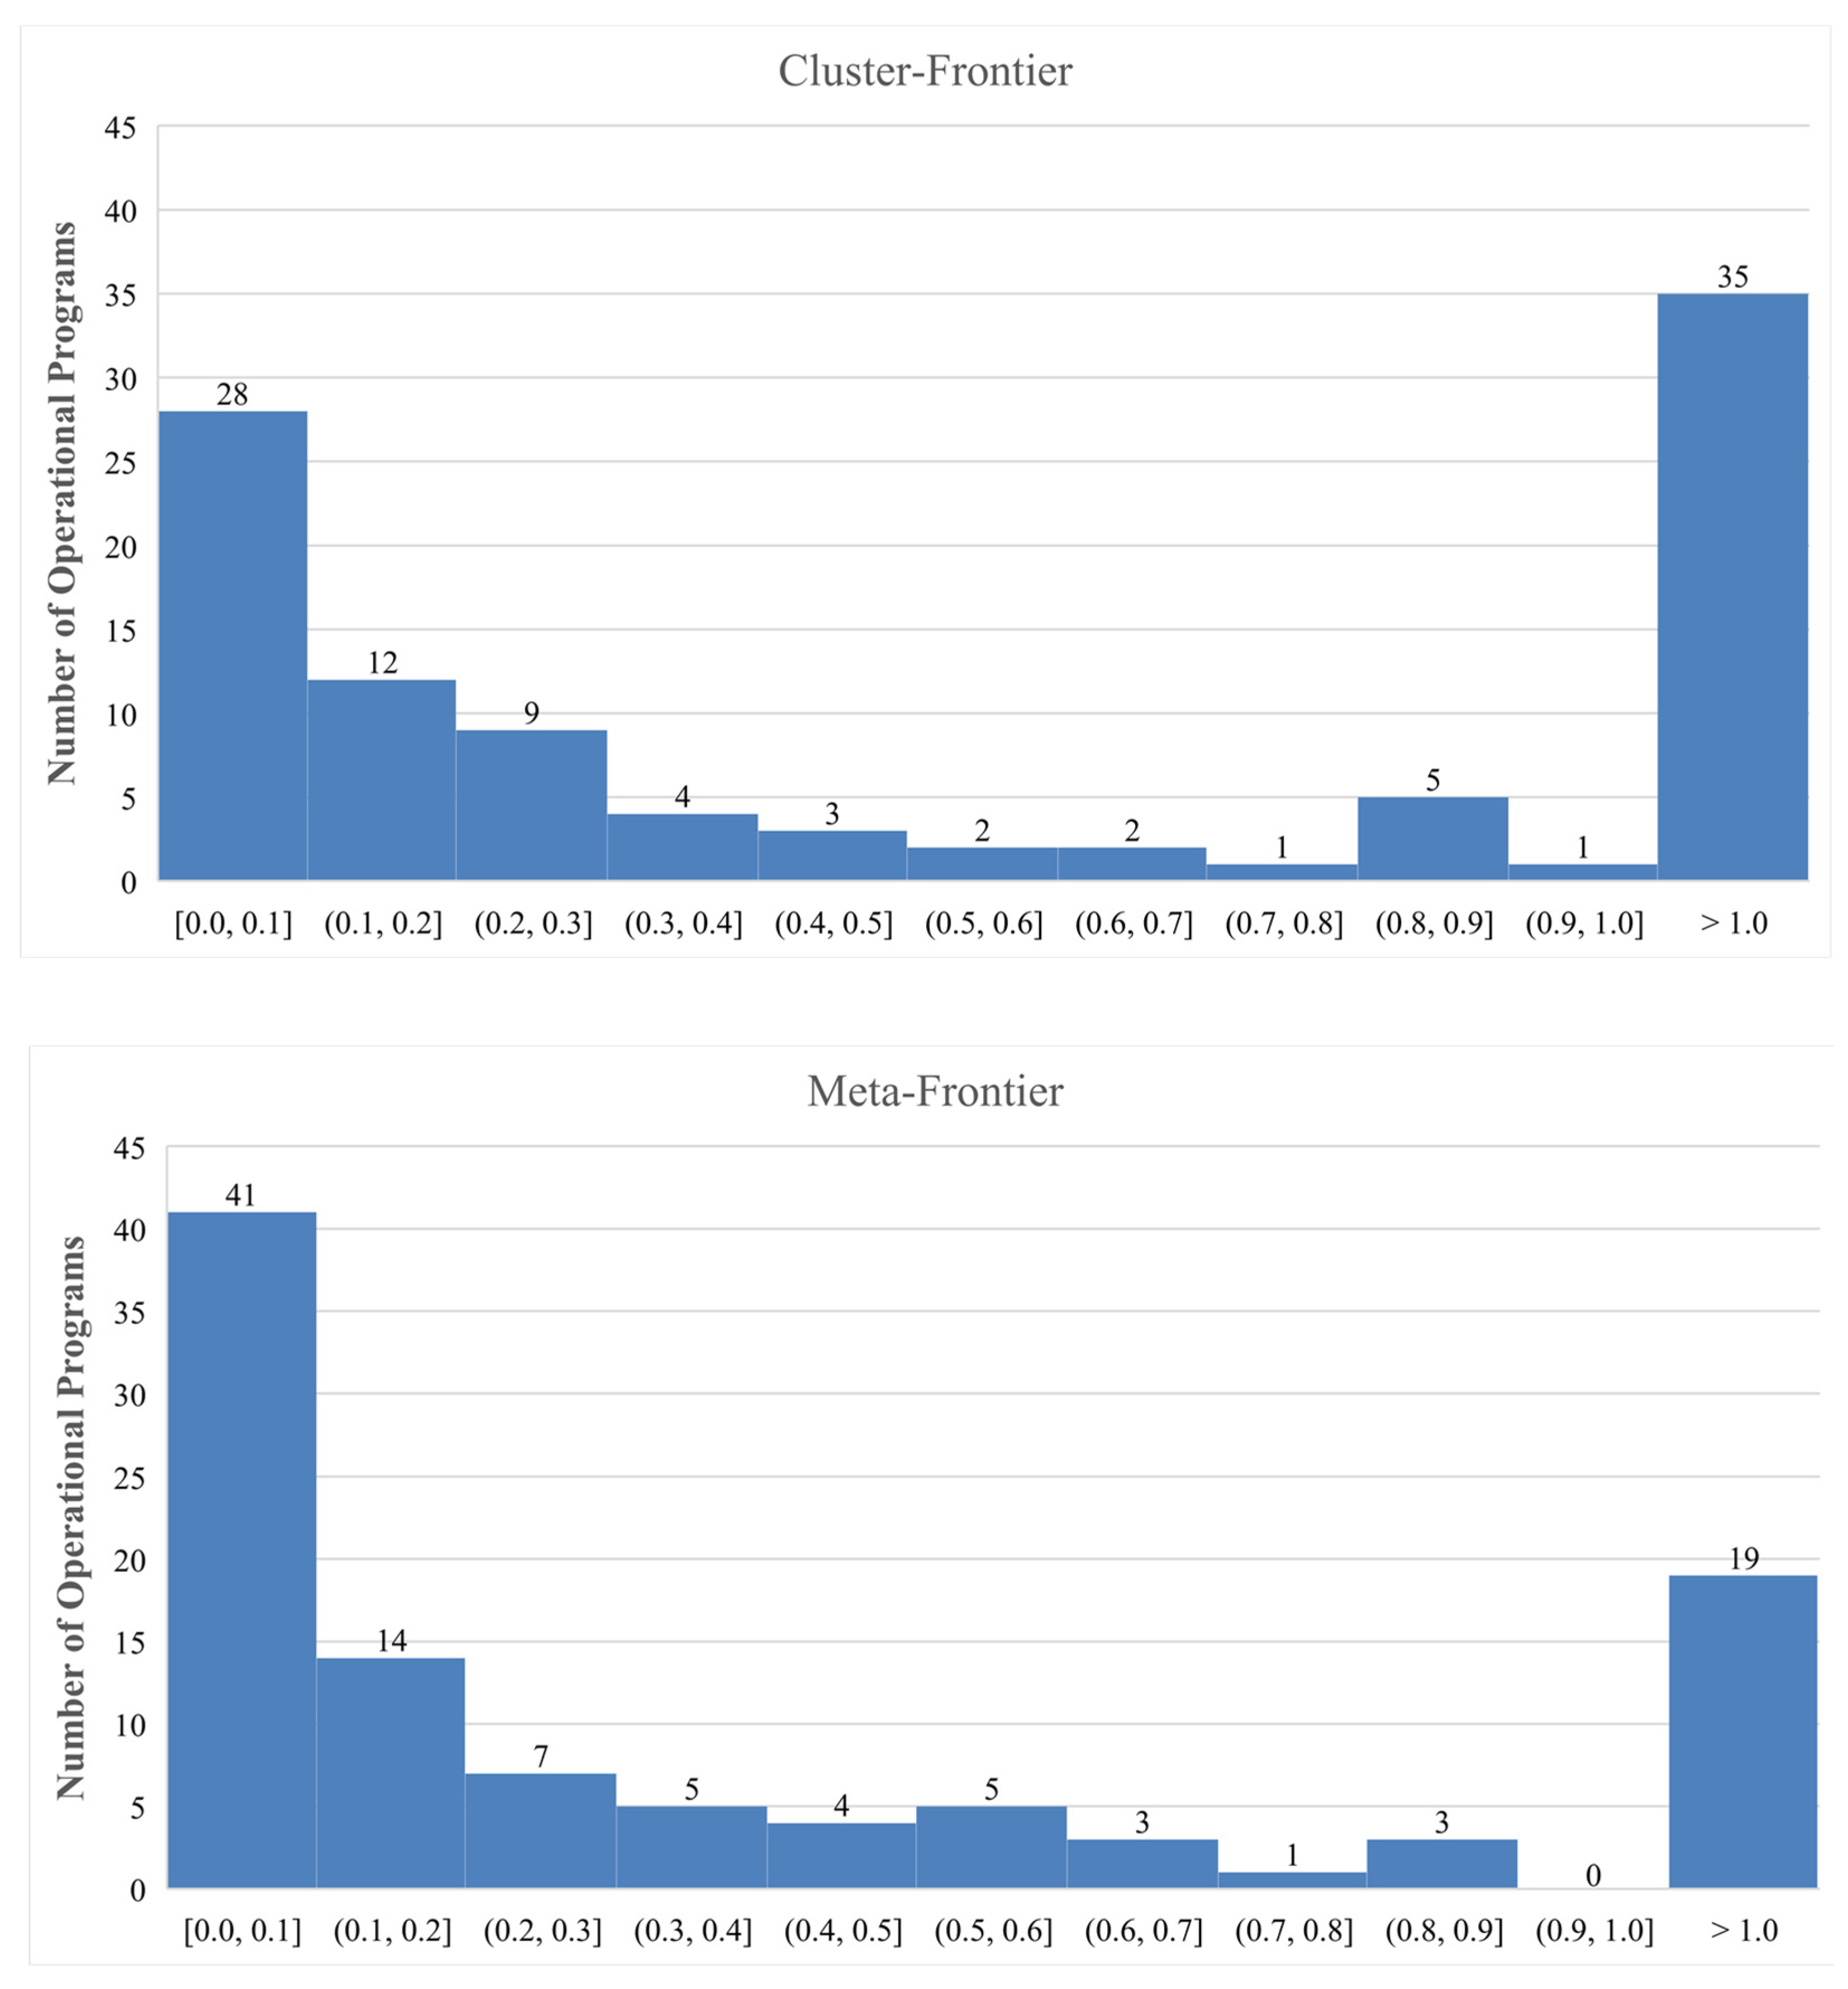
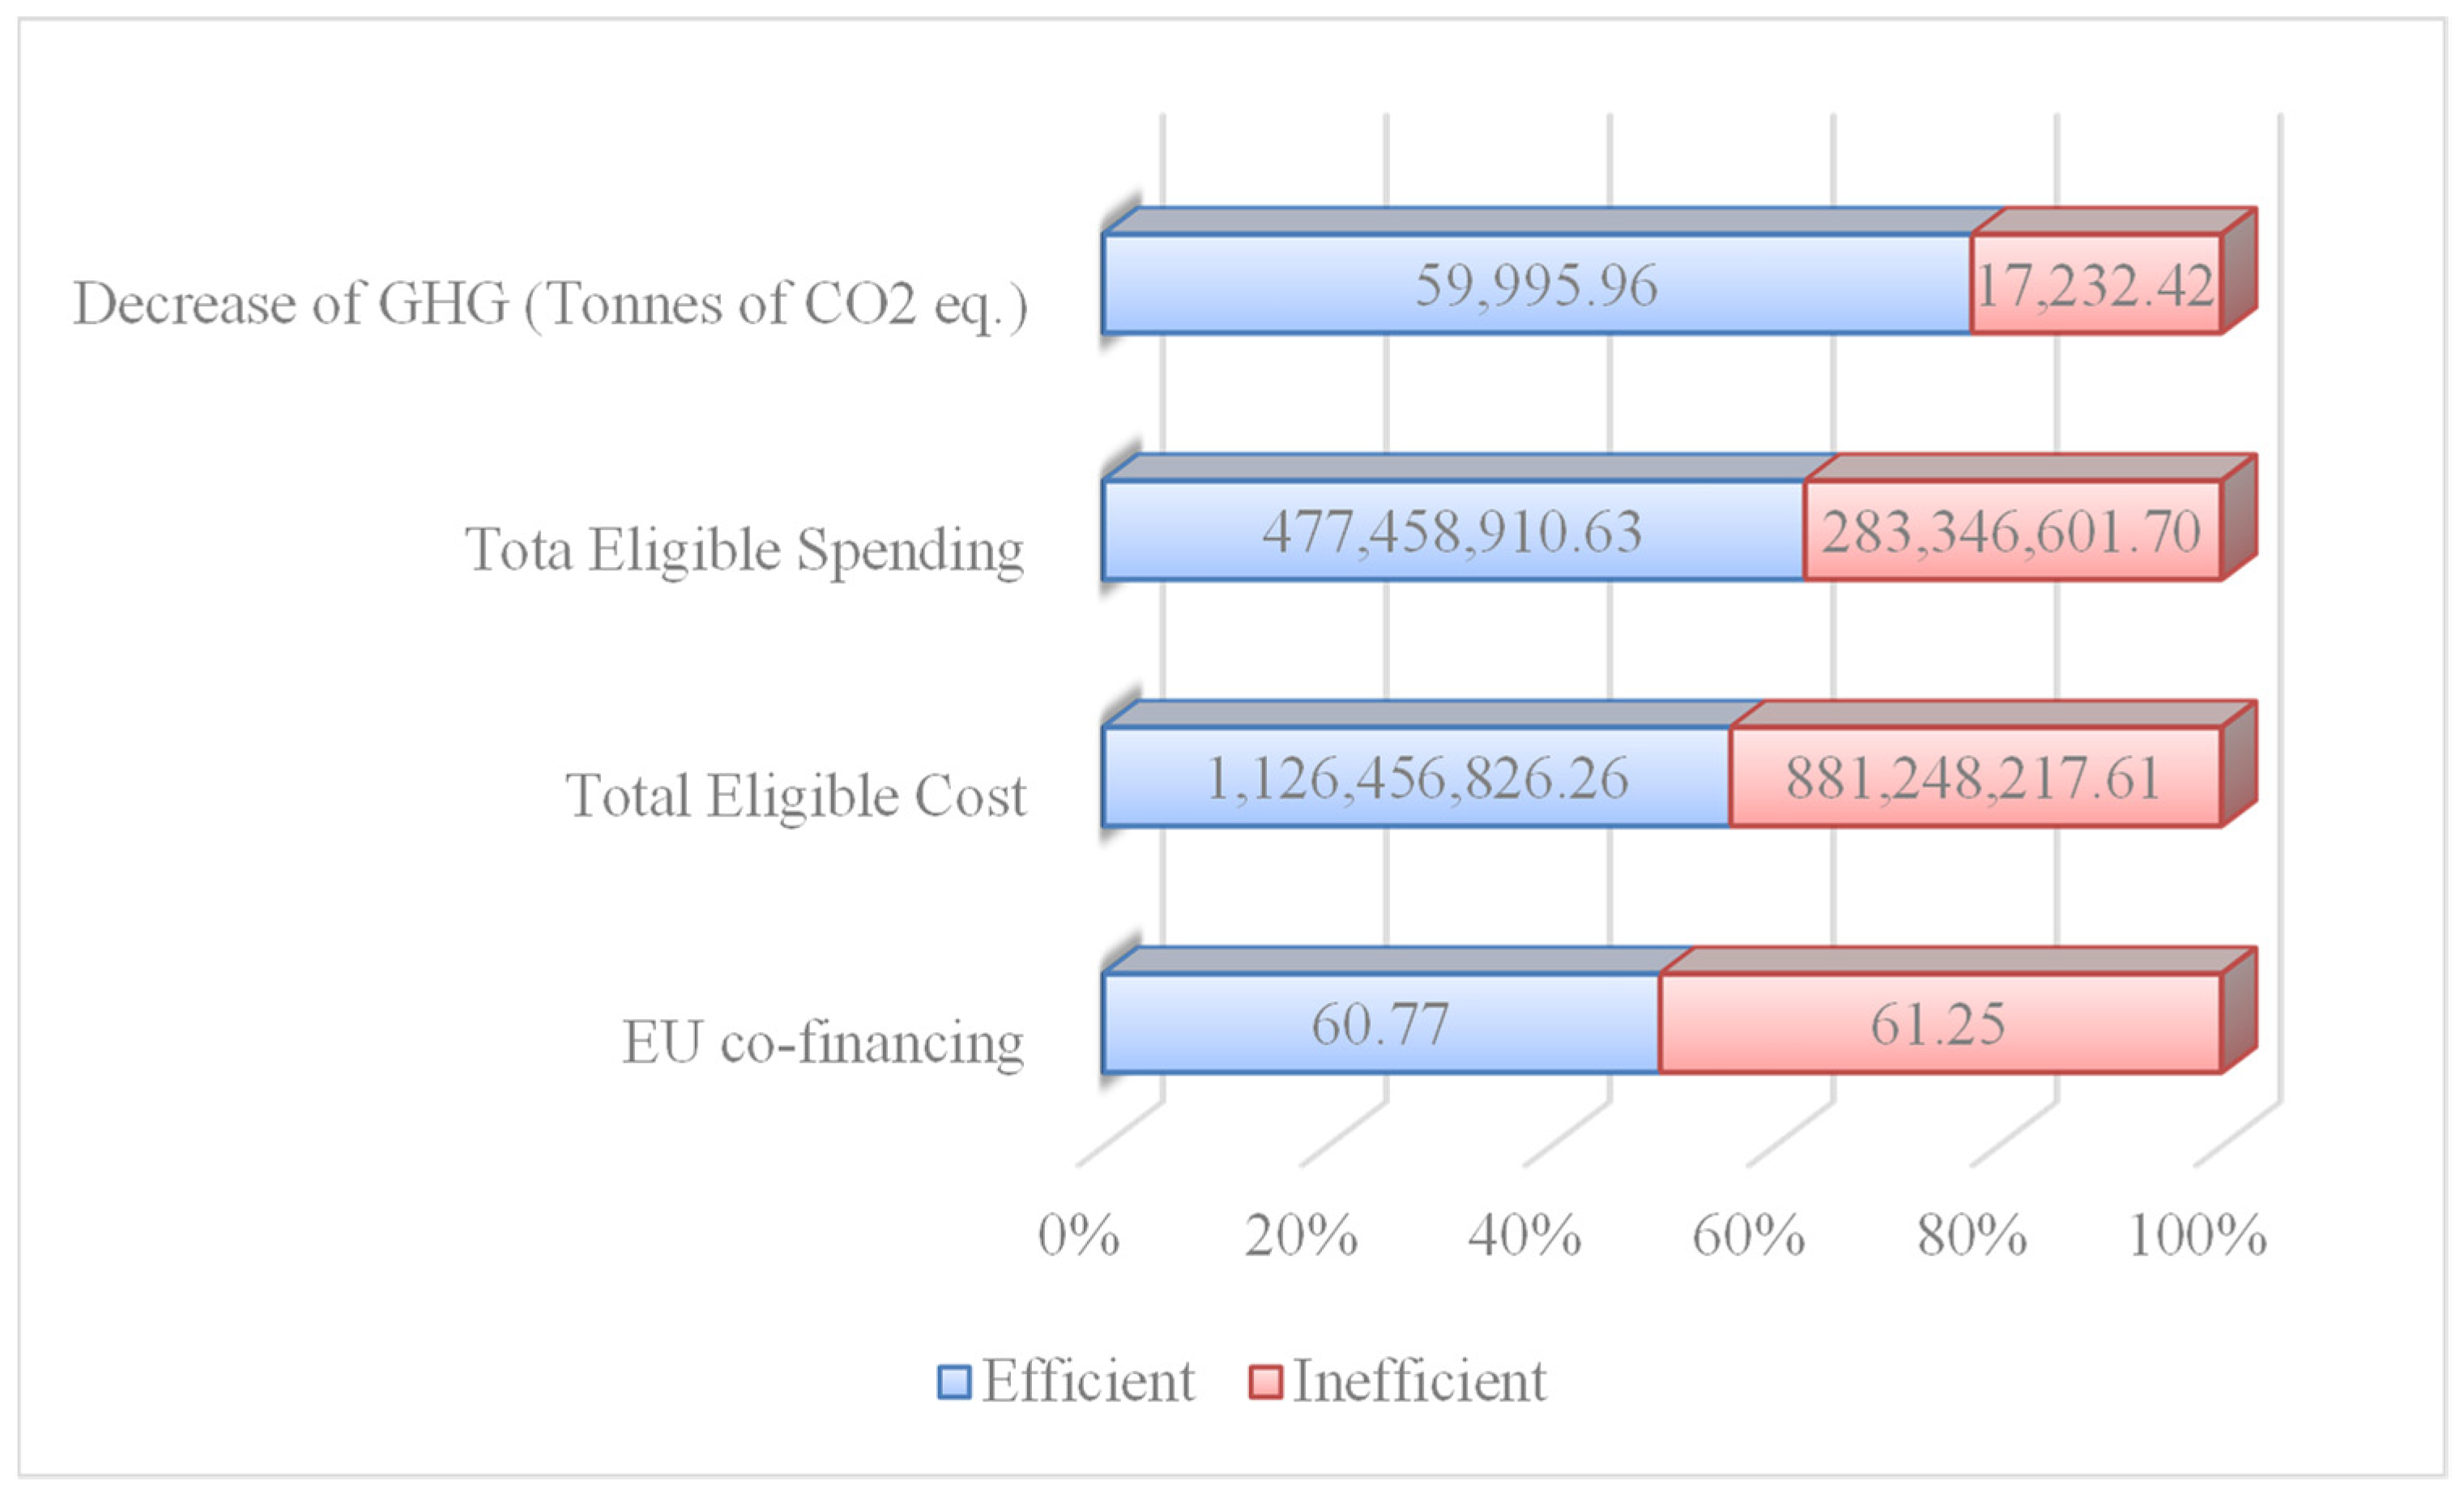
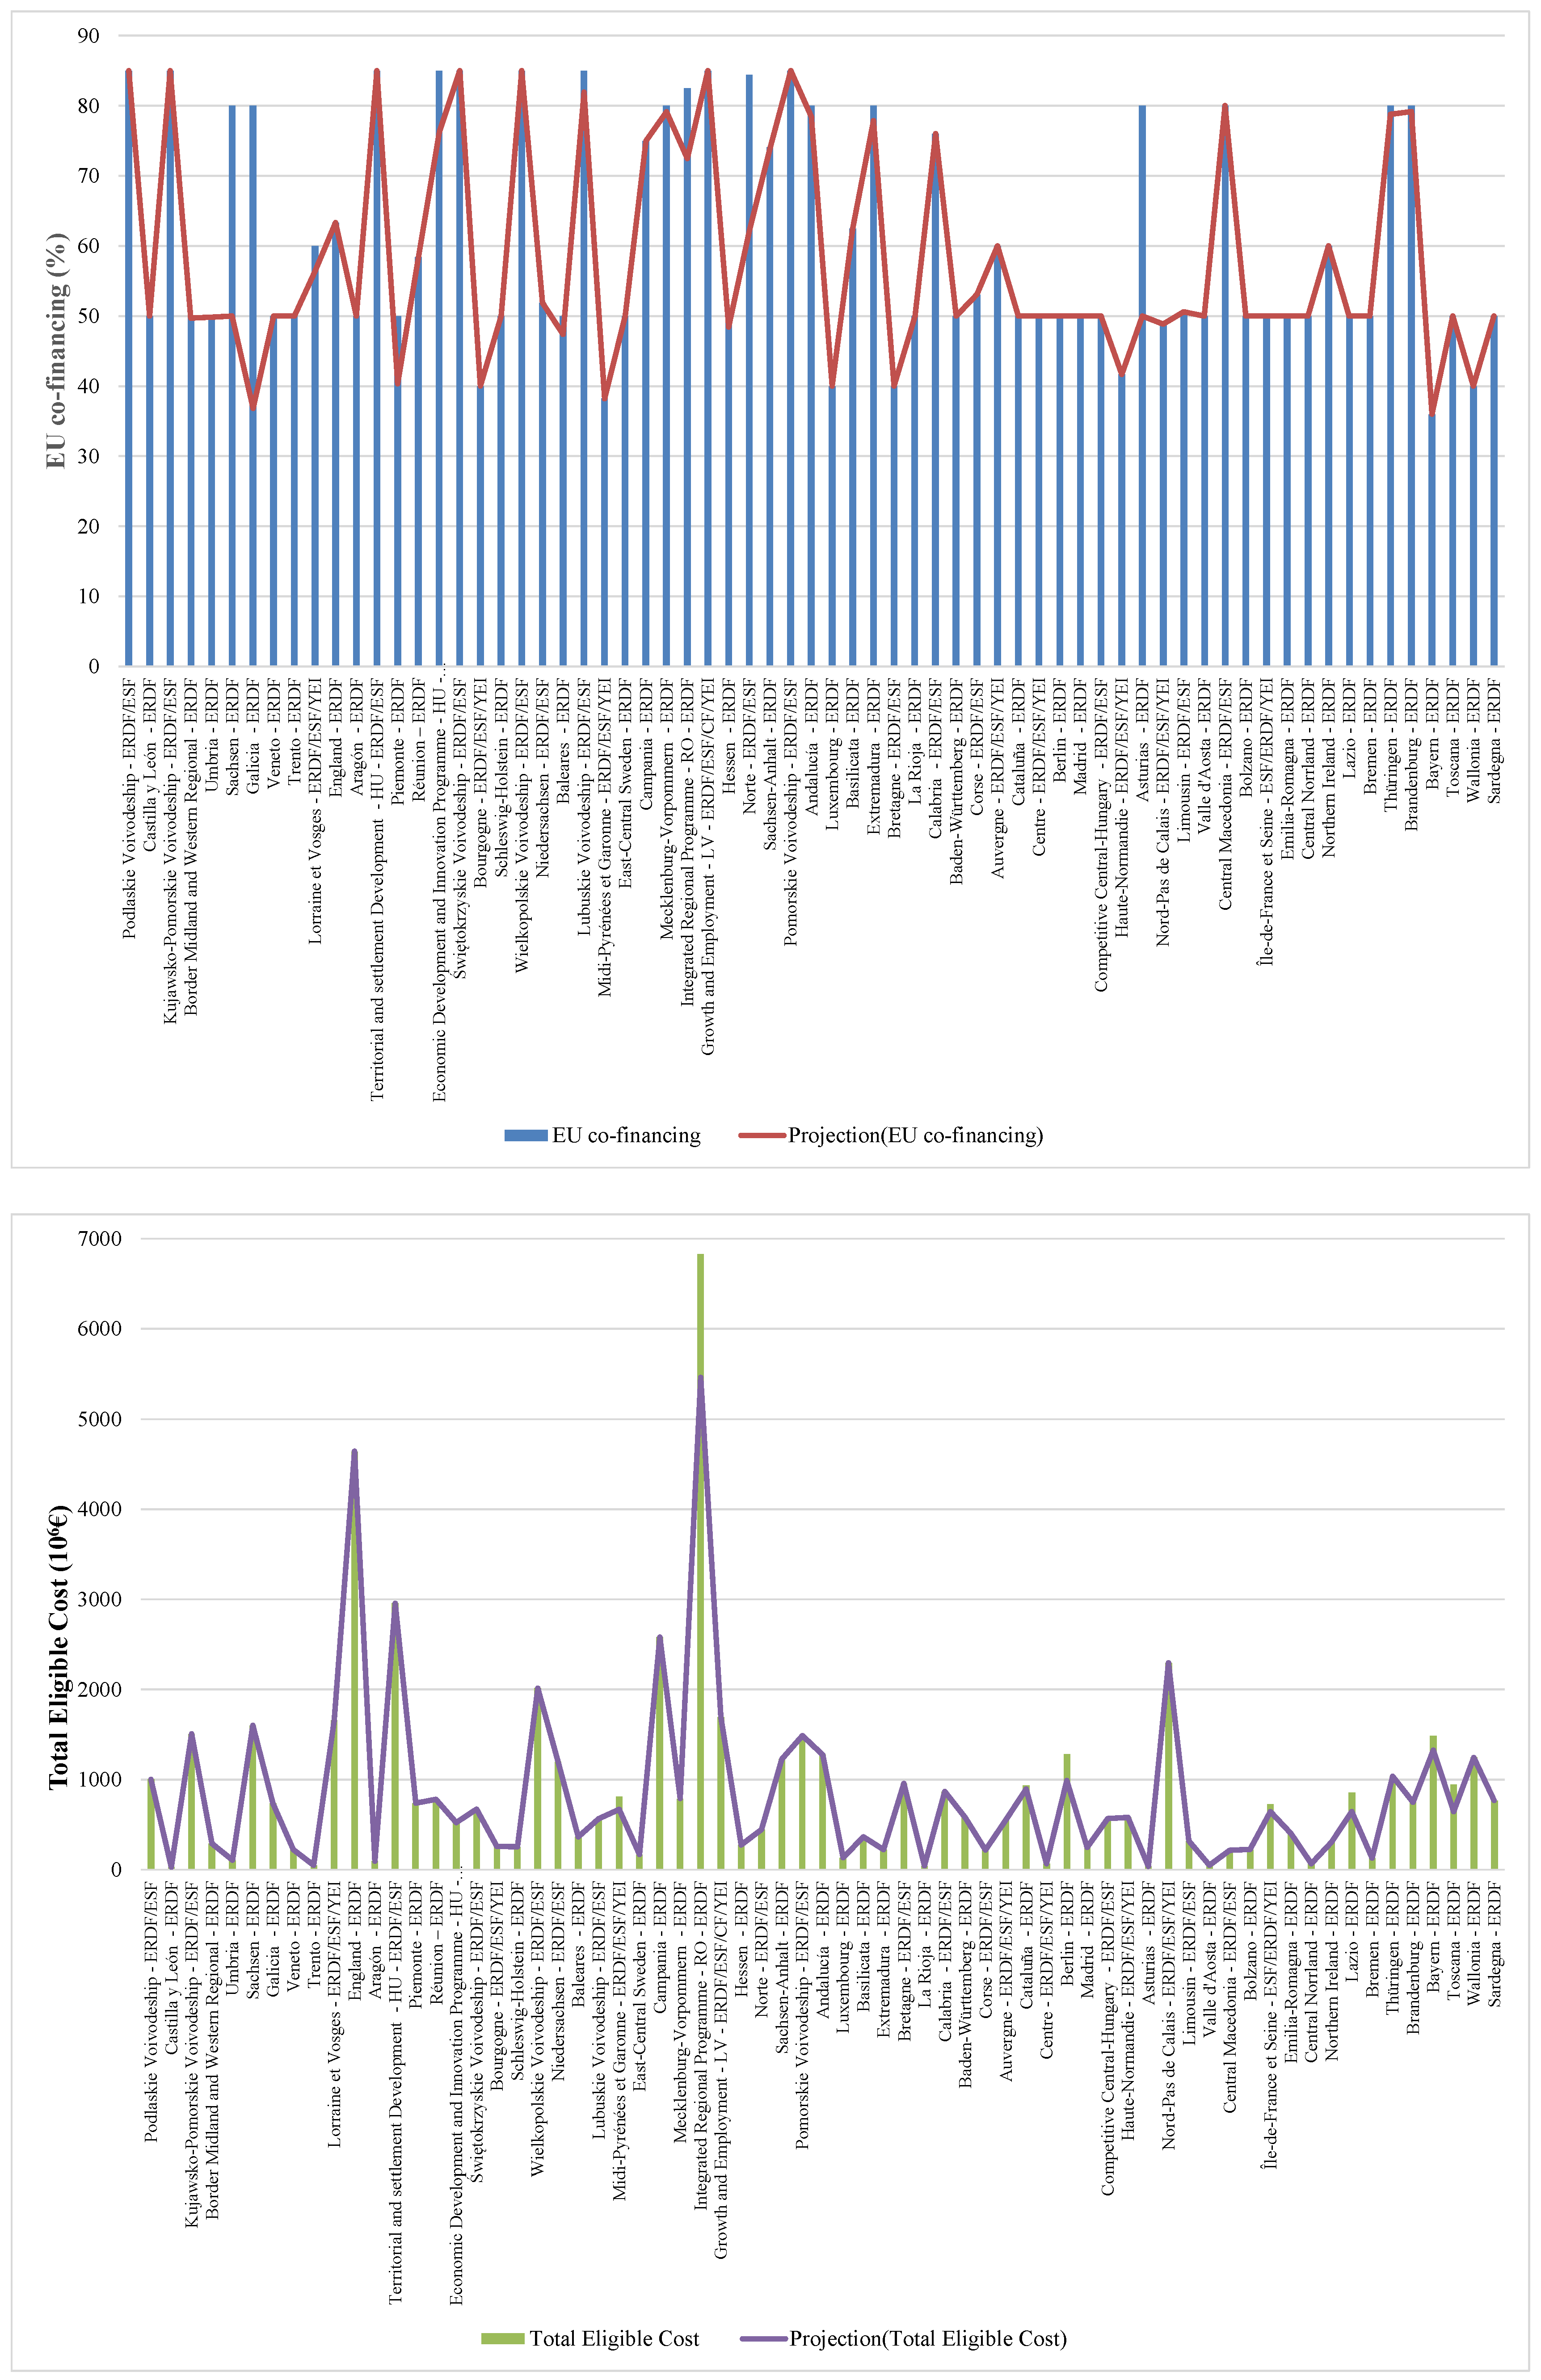
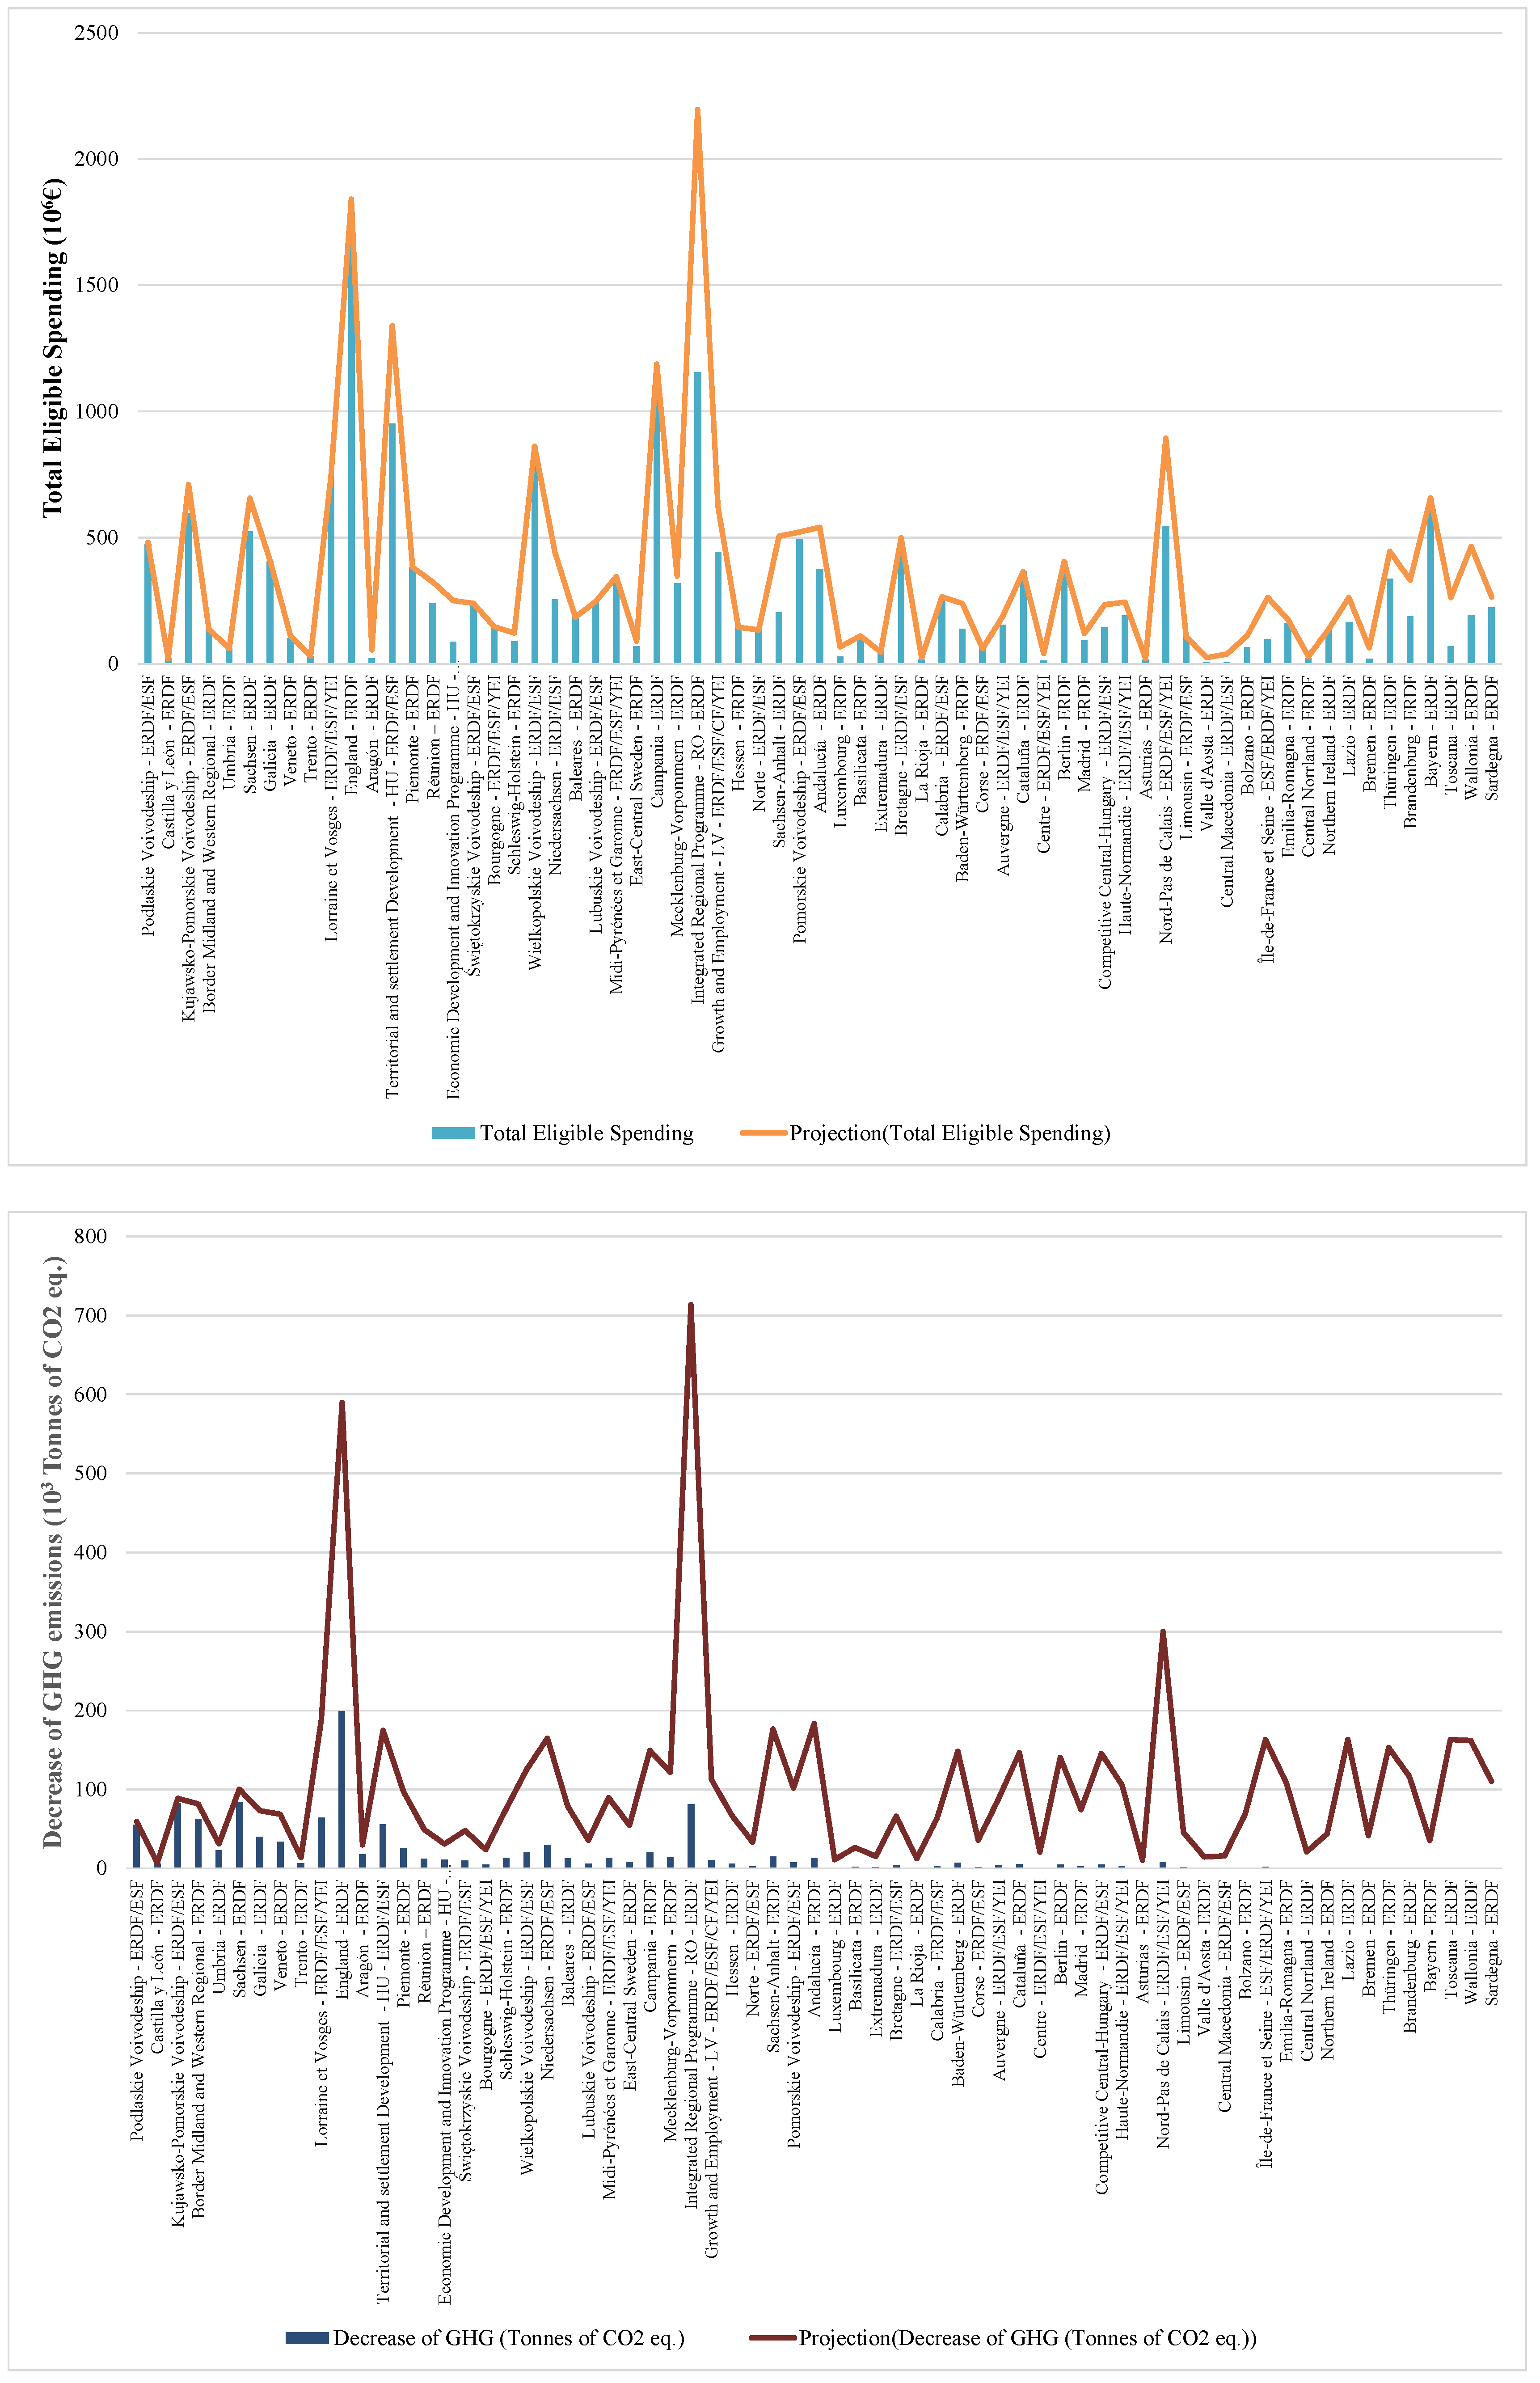
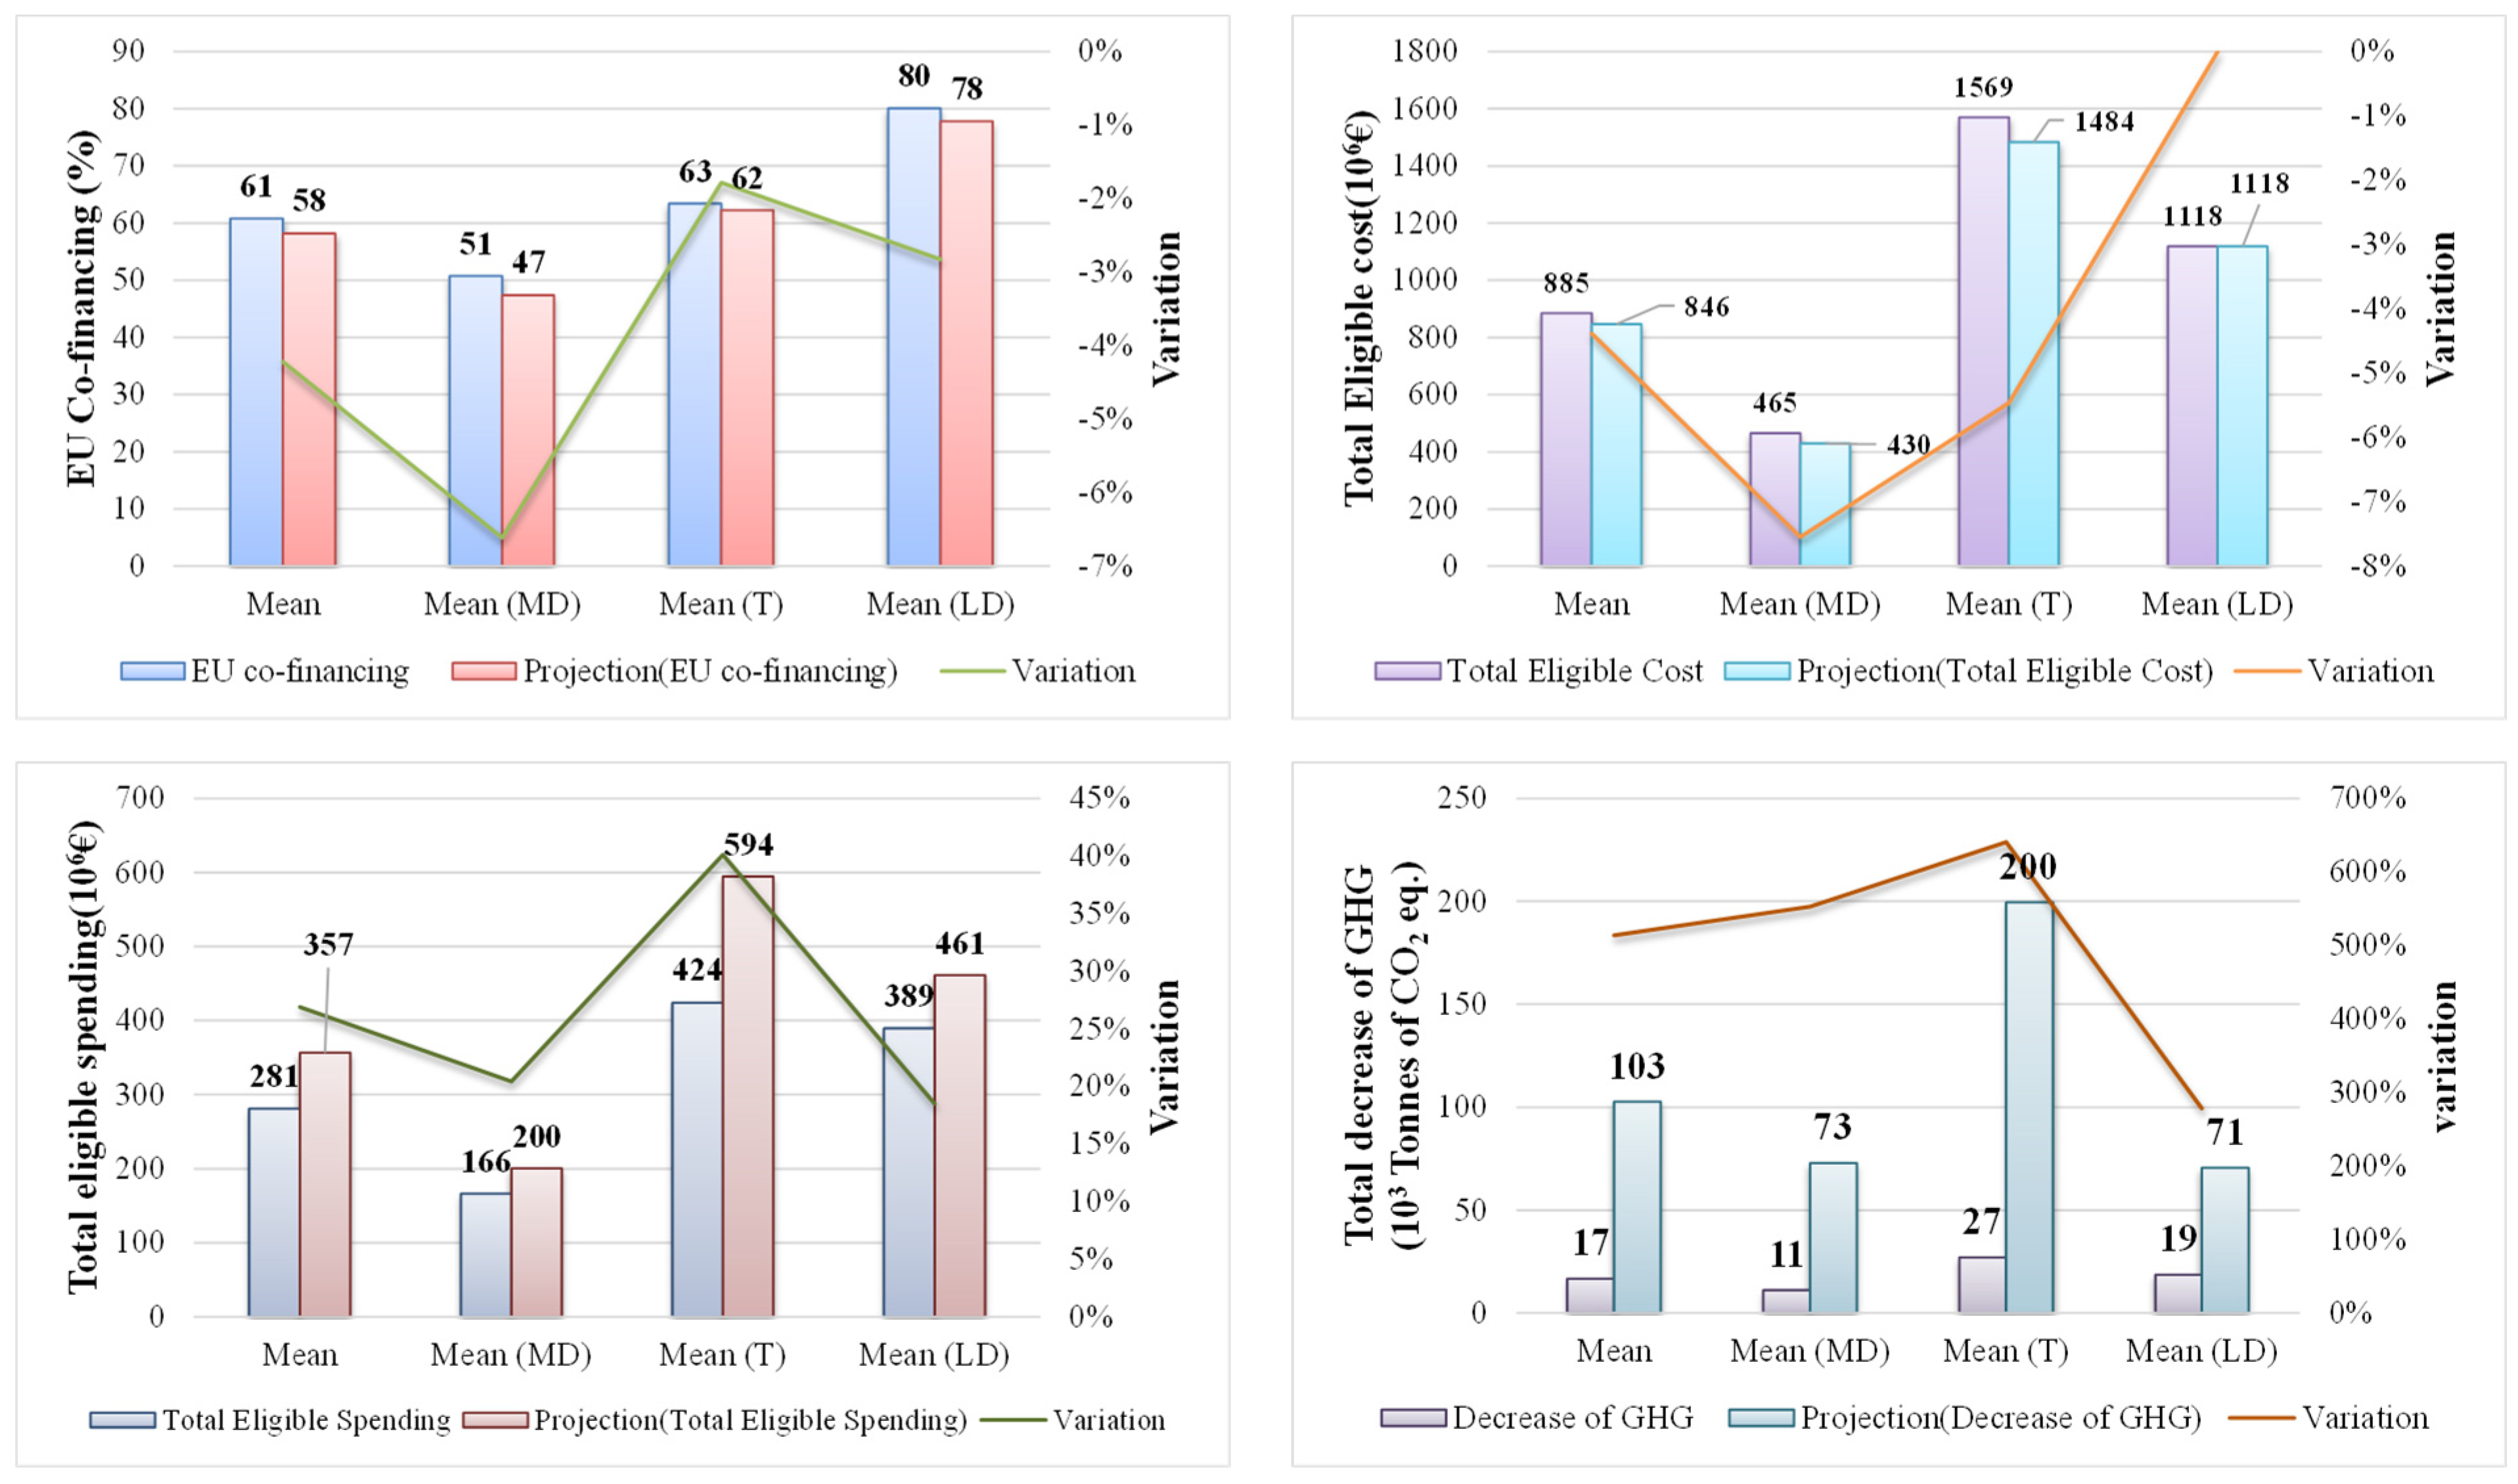
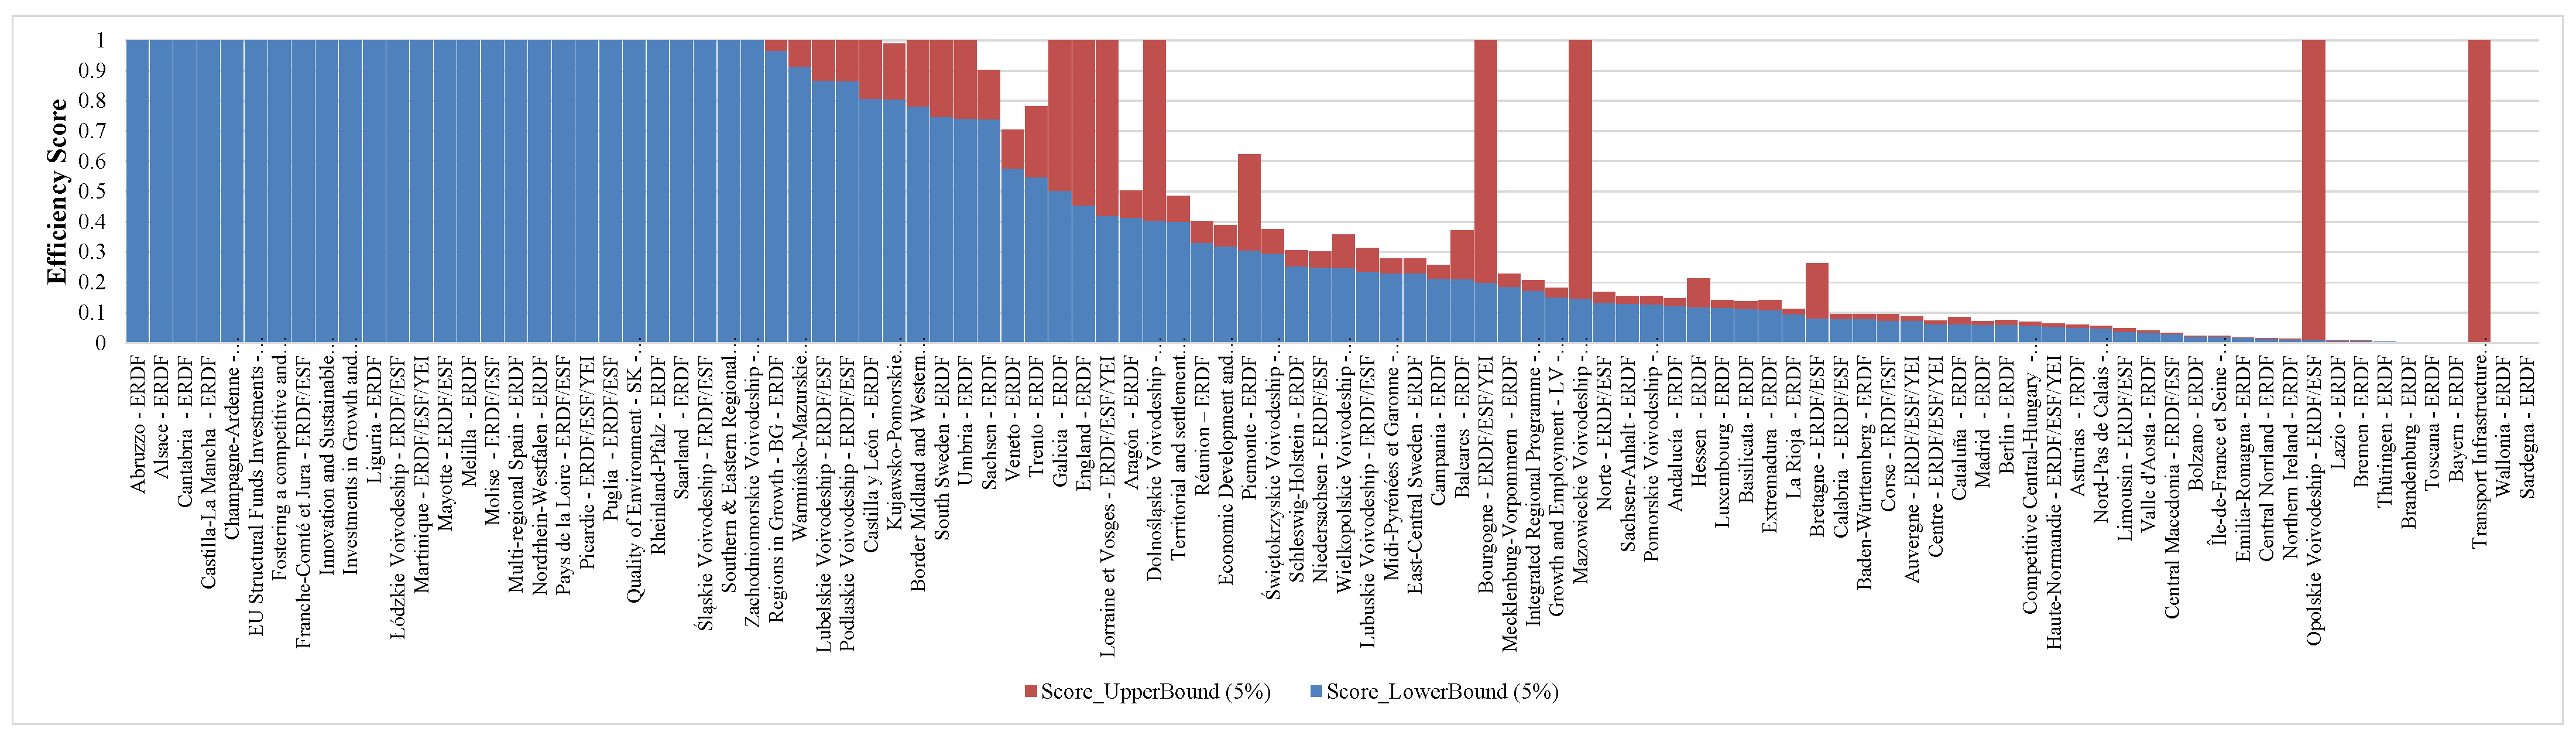

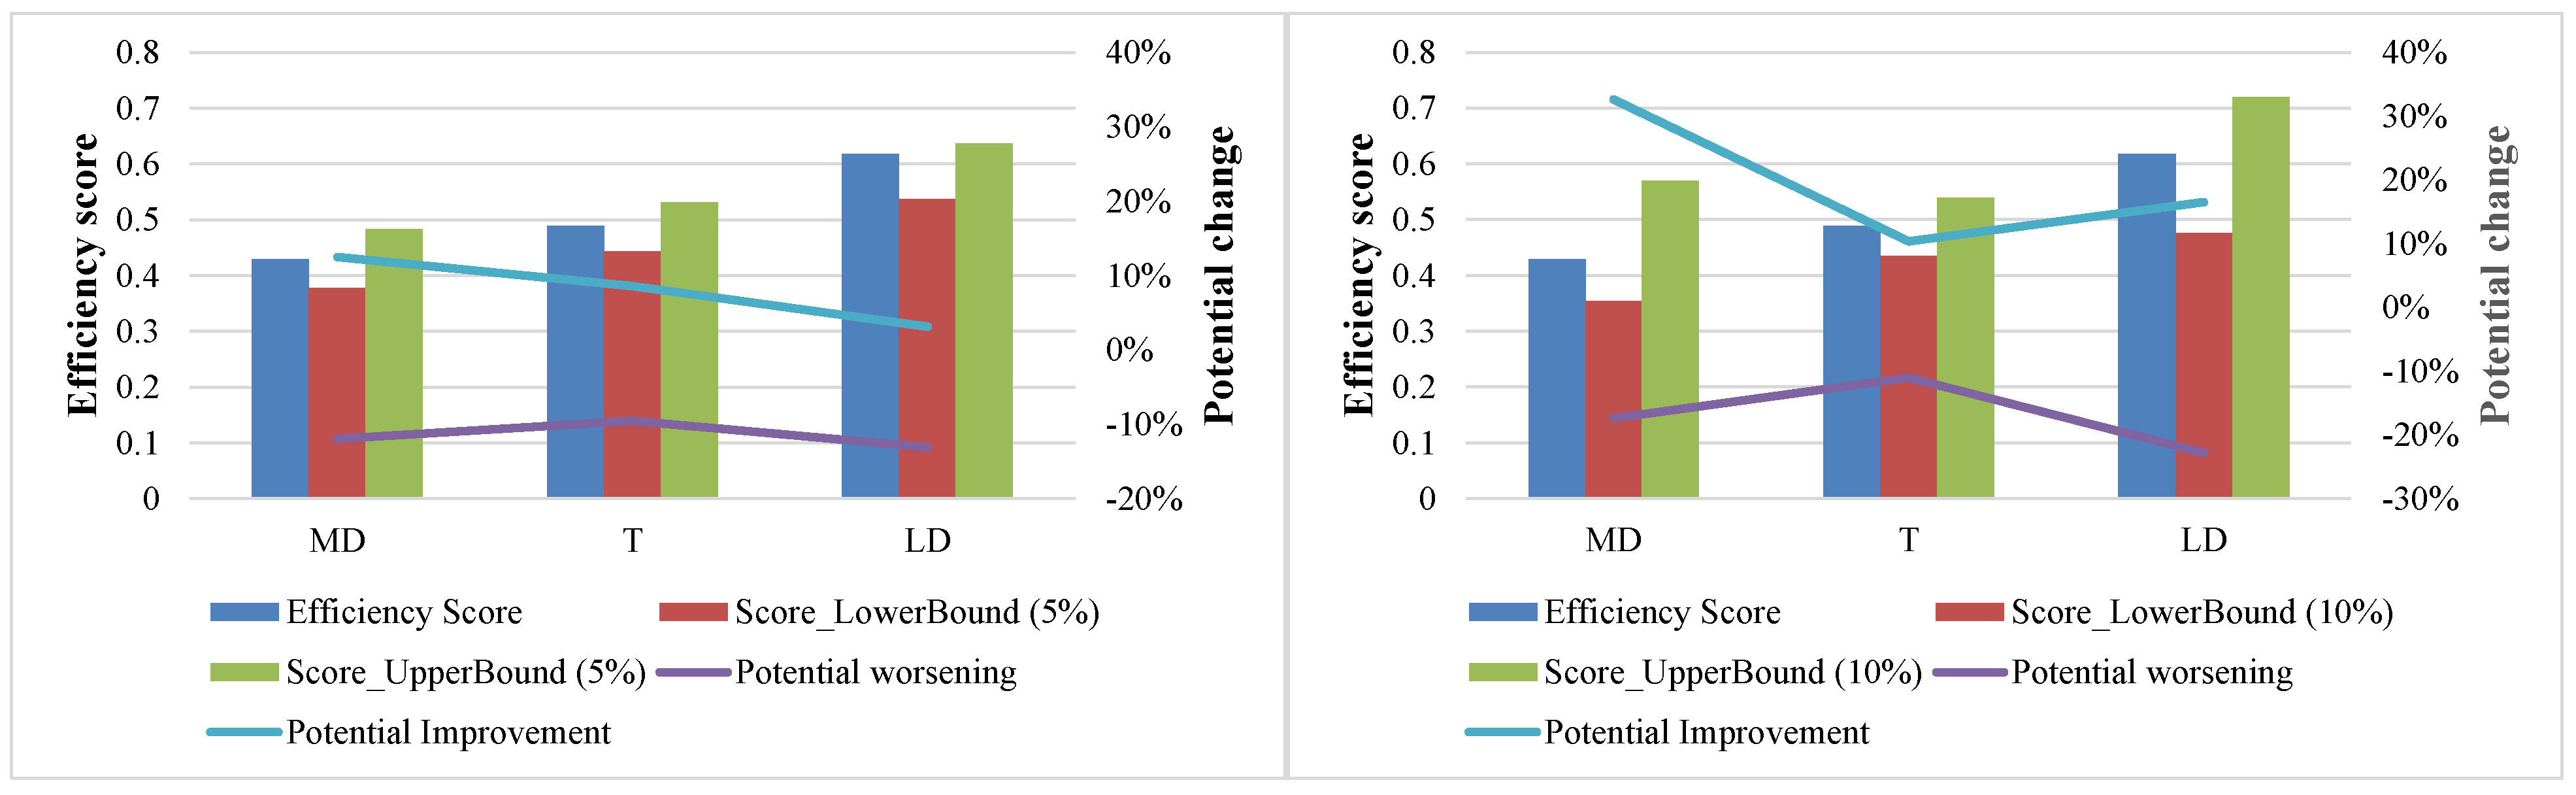
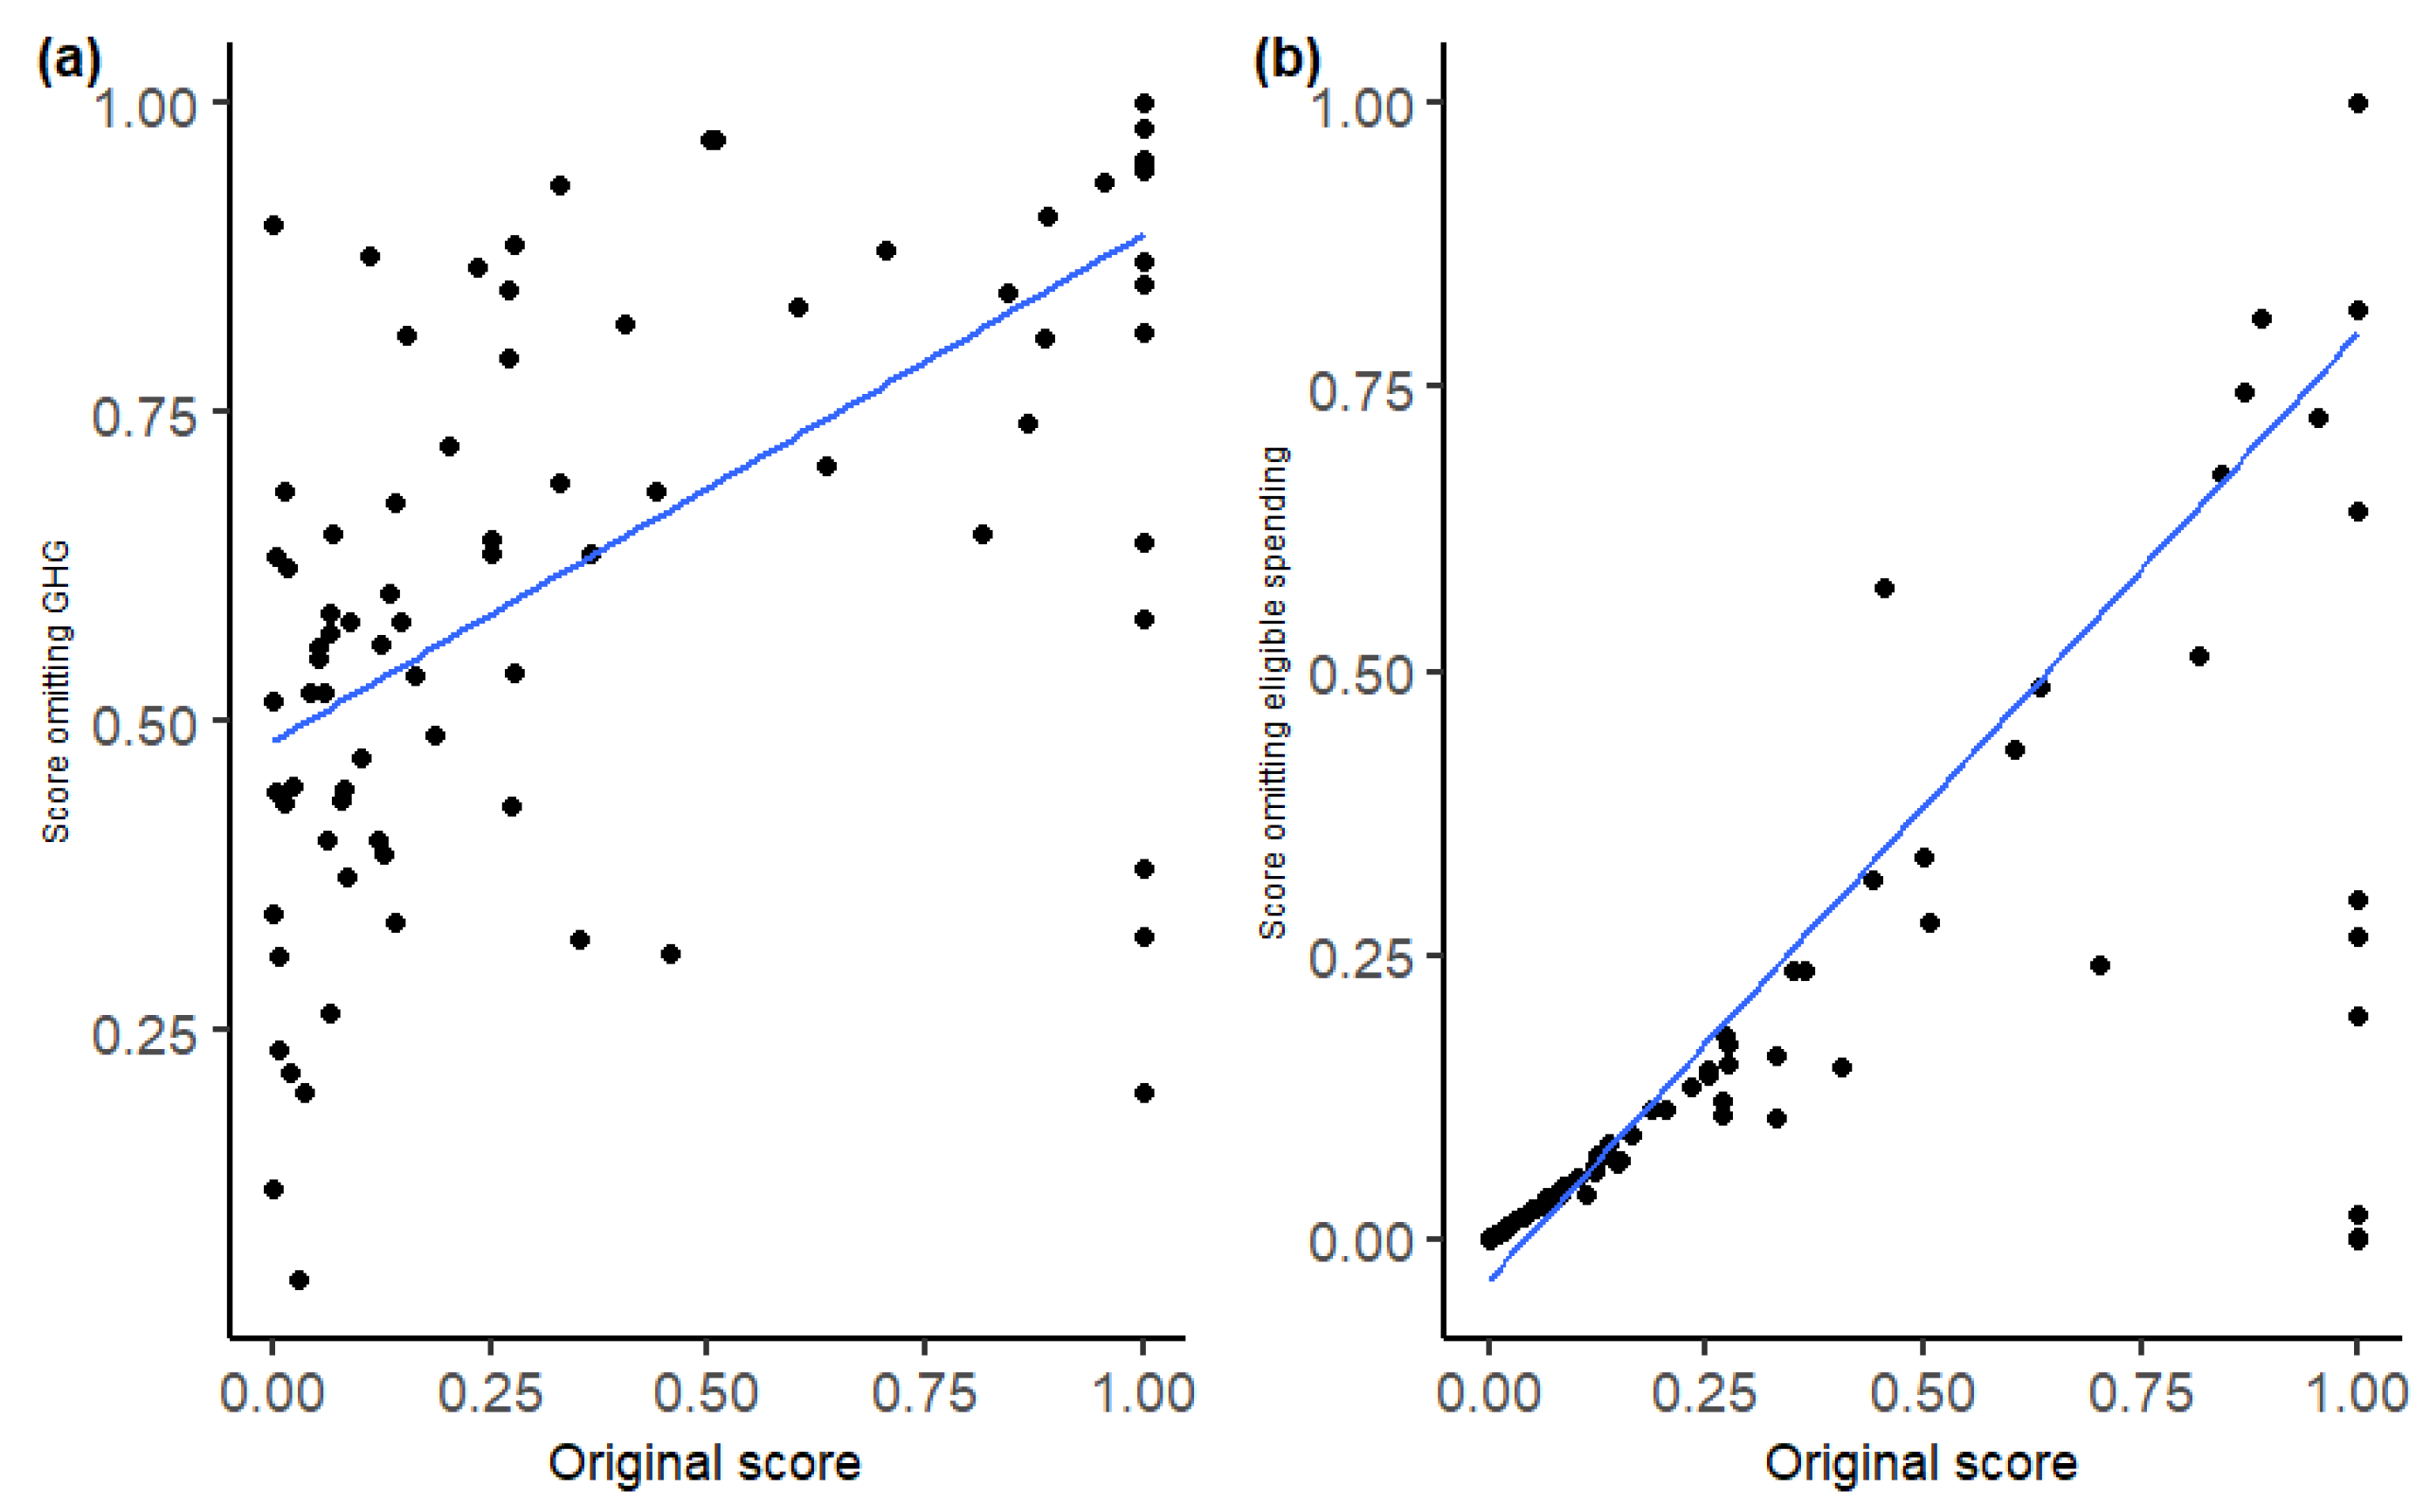
Publisher’s Note: MDPI stays neutral with regard to jurisdictional claims in published maps and institutional affiliations. |
© 2022 by the authors. Licensee MDPI, Basel, Switzerland. This article is an open access article distributed under the terms and conditions of the Creative Commons Attribution (CC BY) license (https://creativecommons.org/licenses/by/4.0/).