Abstract
This paper explores greenhouse gas emission intensity and economy of centralized and on-site wet waste disposal mode, while comprehensively evaluating the two modes for decision-making. Based on the fieldwork in Shanghai’s 20 campuses of 15 universities, multiple scenarios that can reflect the different levels of technology and management in reality, were set for the following studies. The greenhouse gas emissions generated from centralized and on-site disposal modes of wet waste were calculated in two emission scenarios using Life Cycle Assessment, Life Cycle Inventory, and the IPCC 2006 method. Additionally, the continuous cost input from the universities for the two disposal modes was analyzed in three cost-input scenarios using the Net Present Value method. Furthermore, a comprehensive evaluation of the two modes was also conducted by using Analytic Hierarchy Process and Fuzzy Comprehensive Evaluation under the five main factors of greenhouse gas emission—control, economy, stability, education and innovation, and bargaining power for municipal sanitation departments. The results revealed that the centralized disposal mode is superior to the on-site disposal mode in terms of greenhouse gas emission control and economy. The centralized disposal mode is a more rational choice due to the better comprehensive evaluation performance. It was also emphasized that the construction of the wet waste disposal system is so complicated that the academic community and the policymakers may have to pay more attention to the integration of system design, industrial development, and other aspects of wet waste disposal.
1. Introduction
First, it is necessary to define and explain three important concepts to help readers clearly understand the following contents of this paper.
Wet waste—Since China has not yet formed a unified definition or category, “wet waste” in this paper refers to “food waste, leftovers, expired food, melon peel and fruit stone, flowers and plants, Chinese medicine residue, and other perishable household waste”. The definition is taken from Shanghai Regulations for The Management of Household Waste [1], and the reasons are listed as follows:
- The term “wet waste” and its definition are used in the study region of Shanghai, which is a natural fit for the study;
- This definition has a broad representation, which can effectively satisfy the division of high moisture and high organic components from household waste across China. For example, the municipal definition of “food waste” in Beijing (the capital of China) is as follows: “perishable household waste including vegetable, melon and fruit peel, leftovers and wasted food, as well as residues, processing wastes, and waste edible oils produced by enterprises and public institutions in food processing and catering services” [2]. It is obvious that the definition adopted by Beijing is highly consistent with that adopted by Shanghai;
- As the first basis for compulsory classification of household waste in China, Shanghai’s regulations have demonstrative value and long-term effectiveness.
Centralized disposal refers to wet waste disposal where the wet waste is collected at the source, then transferred, transported, and concentrated to large-scale anaerobic digestion disposal plants by the municipal sanitation department.
On-site disposal refers to wet waste disposal where the wet waste is not transported and concentrated by the municipal sanitation department after its collection at the source, but is directly disposed of by small-scale aerobic composting equipment. Although the technology of the on-site disposal equipment includes aerobic composting, physical crushing-extrusion-dehydration, biological reduction, etc. [3,4], the most widely used technology that conforms to the current concept of green development is aerobic composting. Additionally, according to the investigation, there is almost no pilot project of on-site disposal using the technology of anaerobic digestion in Shanghai.
Carbon Peak and Carbon Neutrality—these are two goals of the greenhouse gas (GHG) emission control for China, which were announced at the general debate of the 75th Session of the United Nations General Assembly. Carbon Peak and Carbon Neutrality refer to reducing the GHG emissions progressively after they peak by 2030 and achieving GHG neutrality by 2060, respectively. The word “Carbon” refers to not only CO2 but all seven anthropogenic GHGs defined by the United Nations Framework Convention on Climate Change (UNFCCC), including CH4, N2O, etc. [5,6].
At present, wet waste disposal in Shanghai plays a critical role in municipal management due to the implementation of compulsory source classification of household waste. In 2021, the amount of the wet waste separated reached 10,311 tons per day, an increase of 89% over 2019, but the city’s total disposal capacity of wet waste was only 8030 tons per day [7]. To balance the increasing disposal demand and inadequate disposal capacity, Shanghai is building new large-scale centralized disposal projects while experimenting with small-scale on-site disposal in schools, communities, and other social entities.
However, a series of new policies and new development goals require Shanghai’s wet waste disposal system, which is under construction, to be rethought. China introduced the goals of Carbon Peak and Carbon Neutrality, which highlighted the reduction of greenhouse gas (GHG) emissions and the promotion of eco-friendly development. The GHG emissions from wet waste disposal are estimated to account for about 6% of society’s total GHG discharge [8], thus the GHG emissions control in the industry of wet waste disposal is important. However, affected by the past idea of “disposal capacity first”, the construction of the wet waste disposal system prioritizes disposal capacity, which results in the GHG emission control not being regarded as an important factor. Additionally, many pilot projects of the on-site disposal heavily rely on subsidies from the government. This places a big burden on the municipal public spending impacted by the COVID-19 pandemic and the fiscal-taxation change, while the economy of those on-site projects without the subsidies is not clear. Besides, Shanghai is making an effort to achieve delicacy management. The fieldwork suggested that each social entity’s preference for the wet waste disposal mode is affected by other factors such as the availability of land resources, the stability of disposal equipment, the value of environmental education, etc. Hence, there is a need for the evaluation within multiple factors to help the decision-makers select the wet waste disposal mode with the greatest social utility.
On the basis of an analysis of the present situation, this paper aims to provide a scientific basis for further policymaking related to the construction of the wet waste disposal system. Based on the fieldwork, this paper focuses on the overall 20 campuses of 15 universities in Shanghai that participated in the pilot project of on-site wet waste disposal. The hypothetical situation where the universities selected the centralized wet waste disposal mode was added to compare with the on-site one. The GHG emissions (including emissions from energy consumption, CH4 and N2O escaping, and GHG emission savings) from both modes were calculated, and the cumulative cost input for the universities as investors on the two modes was analyzed. By setting multiple scenarios, this paper provides the respective lower limit and upper limit of GHG emissions and cost input, which can better reflect the differences caused by the different levels of technology and management. Besides, combining two methods, a comprehensive evaluation for the two modes was conducted under the consideration of GHG emission control, economy, and other factors.
2. Literature Review
2.1. Accounting of GHG Emissions from the Wet Waste Disposal
Chen et al. established the Life Cycle Assessment (LCA) framework and Life Cycle Inventory (LCI) formation, to investigate the GHG emissions under three wet waste disposal modes in Shanghai pilot communities: mixed collection-incineration, separate collection-centralized aerobic composting, and separate collection-anaerobic digestion-biogas for power generation [9]. Zhan et al. used the accounting method of the IPCC National Greenhouse Gas Inventory Guidelines 2006 and the LCA to study the carbon emission and resource re-utilization of wet waste disposal under the mode of mixed collection-incineration and separate collection-on-site aerobic composting from three pilot communities in Putuo District, Shanghai [10]. Ghosh et al. used the IPCC method, the First-Order Decay (FOD) method, and so forth to estimate CH4 emissions and energy reuse potentials from the landfill of household waste in Delhi, India [11], and Du et al. used similar methods and ideas to quantify CH4 emissions from municipal solid waste landfills in China over 10 years from 2003 to 2013 [12]. Taking two different disposal paths of the high organic components of household waste: landfill and anaerobic digestion, Liu et al. performed the LCA and sensitivity analysis for the GHG emissions [13]. Turner et al. investigated the process of household waste recycling after source separation, contributing the data of GHG emission factor as close to ISO 14040 as possible to the industry [14]. Some studies showed that the amount of GHG emissions from the transportation of household waste is too small to have a significant impact on the overall results [9,13,15], and can even be omitted in the study [16] so waste disposal researchers would pay more attention to the optimization of transportation routes other than transportation emission control [17,18,19]. Some studies also omitted the calculation of GHG emissions for sewage treatment in the wet waste disposal process [16,20].
In summary, first, China’s domestic and foreign research on the accounting of GHG emissions from the disposal process of household waste, including wet waste, is mainly based on the LCA method system. In that case, the process of disposal will be disassembled and refined. Therefore, the core of the study is to clarify the input and output of material and energy flow on the LCA system boundary, and the flow’s transfer among the subdivisions in the LCA system. Second, for the specific calculation of GHG emissions, almost all the research used the method from IPCC 2006 National Greenhouse Gas Inventory Guidelines (IPCC 2006) [21], or the fine-tuning method based on the IPCC 2006. Third, many studies omitted the accounting of GHG emissions from transportation and secondary sewage treatment, which makes the results less systematic and weakens the effectiveness of LCA and LCI. Finally, for most studies, each calculation parameter was a single value, resulting in a single value for emission amount and re-utilized product amount as well. While high-quality data and rigorous calculations can guarantee that single-value results are representative of reality, they are weak in explaining the uncertainty and volatility of reality, which have difficulty reflecting the difference caused by different technology levels and management skills in actual activities.
2.2. Economy of Wet Waste Disposal Mode
Wang evaluated the whole anaerobic digestion process of the wet waste disposal project under the Build-Operate-Transfer (BOT) operation mode; the aspects of economy, Net Present Value (NPV) and Internal Return Rate (IRR) were used to highlight the time value of all kinds of funds in the life cycle of the project [22]. By investigating the situation of household waste disposal in a city in Guangdong province, China, Chen et al. analyzed and compared the environmental and economic factors of landfill and incineration under the BOT operation mode. Cost and income accounting were carried out in terms of the three aspects of investment, operation cost, and fund recovery [23]. Focusing on a Chinese city, He analyzed the unit cost and profit of the large-size household waste disposal according to the disposal process, and pointed out the uncertainty risk of the transportation cost and disposal cost [24]. Jia studied the effect of compulsory classification of household waste in Shanghai and calculated the incremental cost and benefit of the full link from the source classification to the end disposal [25]. Xiao et al. summarized the management mode adopted by Shanghai after the implementation of the compulsory classification of household waste and disassembled the cost of waste disposal from the source to the end according to the disposal process. It was pointed out that the large increase of management cost is due to the increase of the propaganda investment and disposal cost [26]. Mayer et al. analyzed and compared the marginal costs of high organic waste under three disposal modes of anaerobic digestion, hydrothermal carbonization, and incineration by calculating Levelized Costs of Exergy (LCOE). The results showed that the anaerobic digestion mode was the most economical [27]. Zheng et al. investigated more than 10 Chinese enterprises that produced equipment for on-site wet waste disposal, then concluded that the land occupation per unit disposal capacity is inversely related to the disposal capacity of equipment, and the energy consumption per unit disposal capacity is negatively related to the capacity of equipment [28].
For the economic problem of waste disposal, studies have shown that cost–benefit is an effective cut-in perspective, which can not only explore the cost and revenue of each node in the full link from collection to disposal with sufficient data, but also make it possible to focus only on the front and rear changes of funds and regard the intermediate specific capital flowing as a “black” box when it is difficult to obtain detailed operational information about the project. Besides, the method that can combine the discount rate, depreciation rate, and other time-related factors, such as NPV, can make the result better reflect the economy of waste disposal as a long-term activity affected by ongoing time. It is also worth noting that with the improvement of equipment’s disposal capacity, the marginal incremental cost of land use, power consumption, and other peripheral resources has a decreasing trend.
2.3. Comprehensive Evaluation Method
For things affected by multiple factors, in order to reflect the scientific nature, fairness, and systematicity of their evaluation, it is necessary to adopt a comprehensive evaluation method that can organically combine multiple factors.
Li et al. sorted and summarized the literature related to comprehensive evaluation methods, and introduced the basic principles, advantages, and disadvantages of each method [29]. Zhou established an evaluation model based on the life cycle idea to study the application of waste disposal technology, in which the weight was calculated by the combination of Analytic Hierarchy Process (AHP) and Entropy Weigh (EW), and the ranking of schemes evaluated was carried out with the help of Technique for Order of Preference by Similarity to Ideal Solution (TOPSIS) [30]. Li used Fuzzy Comprehensive Evaluation (FCE) to evaluate the disposal of household waste, which included four indexes: environmental factor, social factor, economic factor, and technical factor [31]. Based on the theory and method of fuzzy mathematics, Huang et al. made a comprehensive evaluation of the different disposal paths of household waste [32]. Zhang et al. evaluated different disposal modes of household waste by using AHP and FCE [33]. Wang et al. combined AHP, EC and FCE to evaluate the water environment carrying capacity of nine cities in the Guangdong–Hong Kong–Macao Greater Bay Area [34]. Based on AHP and FCE, Yu et al. evaluated the performance of Public–Private Partnership (PPP) projects of urban water environmental management [35].
It can be concluded that these comprehensive methods are suitable for the evaluation of complicated scenarios which are greatly influenced by subjective judgment and many influencing factors. Therefore, the comprehensive evaluation methods are also suitable for this paper studying the evaluation and selection of wet waste disposal modes under multiple main factors. Currently, two or more comprehensive evaluation methods are often used together by academics, because each method has its own advantages and limitations, which means they can be applied to different stages of evaluation. Aiming at the comprehensive evaluation of different environmental management schemes, the AHP is widely used to determine the weight of influencing factors to give full play to its advantage of being good at quantifying the importance of influencing factors, and the FCE is usually used to conduct the final evaluation according to the evaluators’ subjective scores.
3. Materials and Methods
3.1. Research Subject
Based on fieldwork, the research subject of this paper is the overall 20 campuses of 15 universities in Shanghai which participated in the pilot projects of on-site wet waste disposal. To compare the centralized and on-site disposal, the hypothetical simulation of the universities selecting the centralized mode was added.
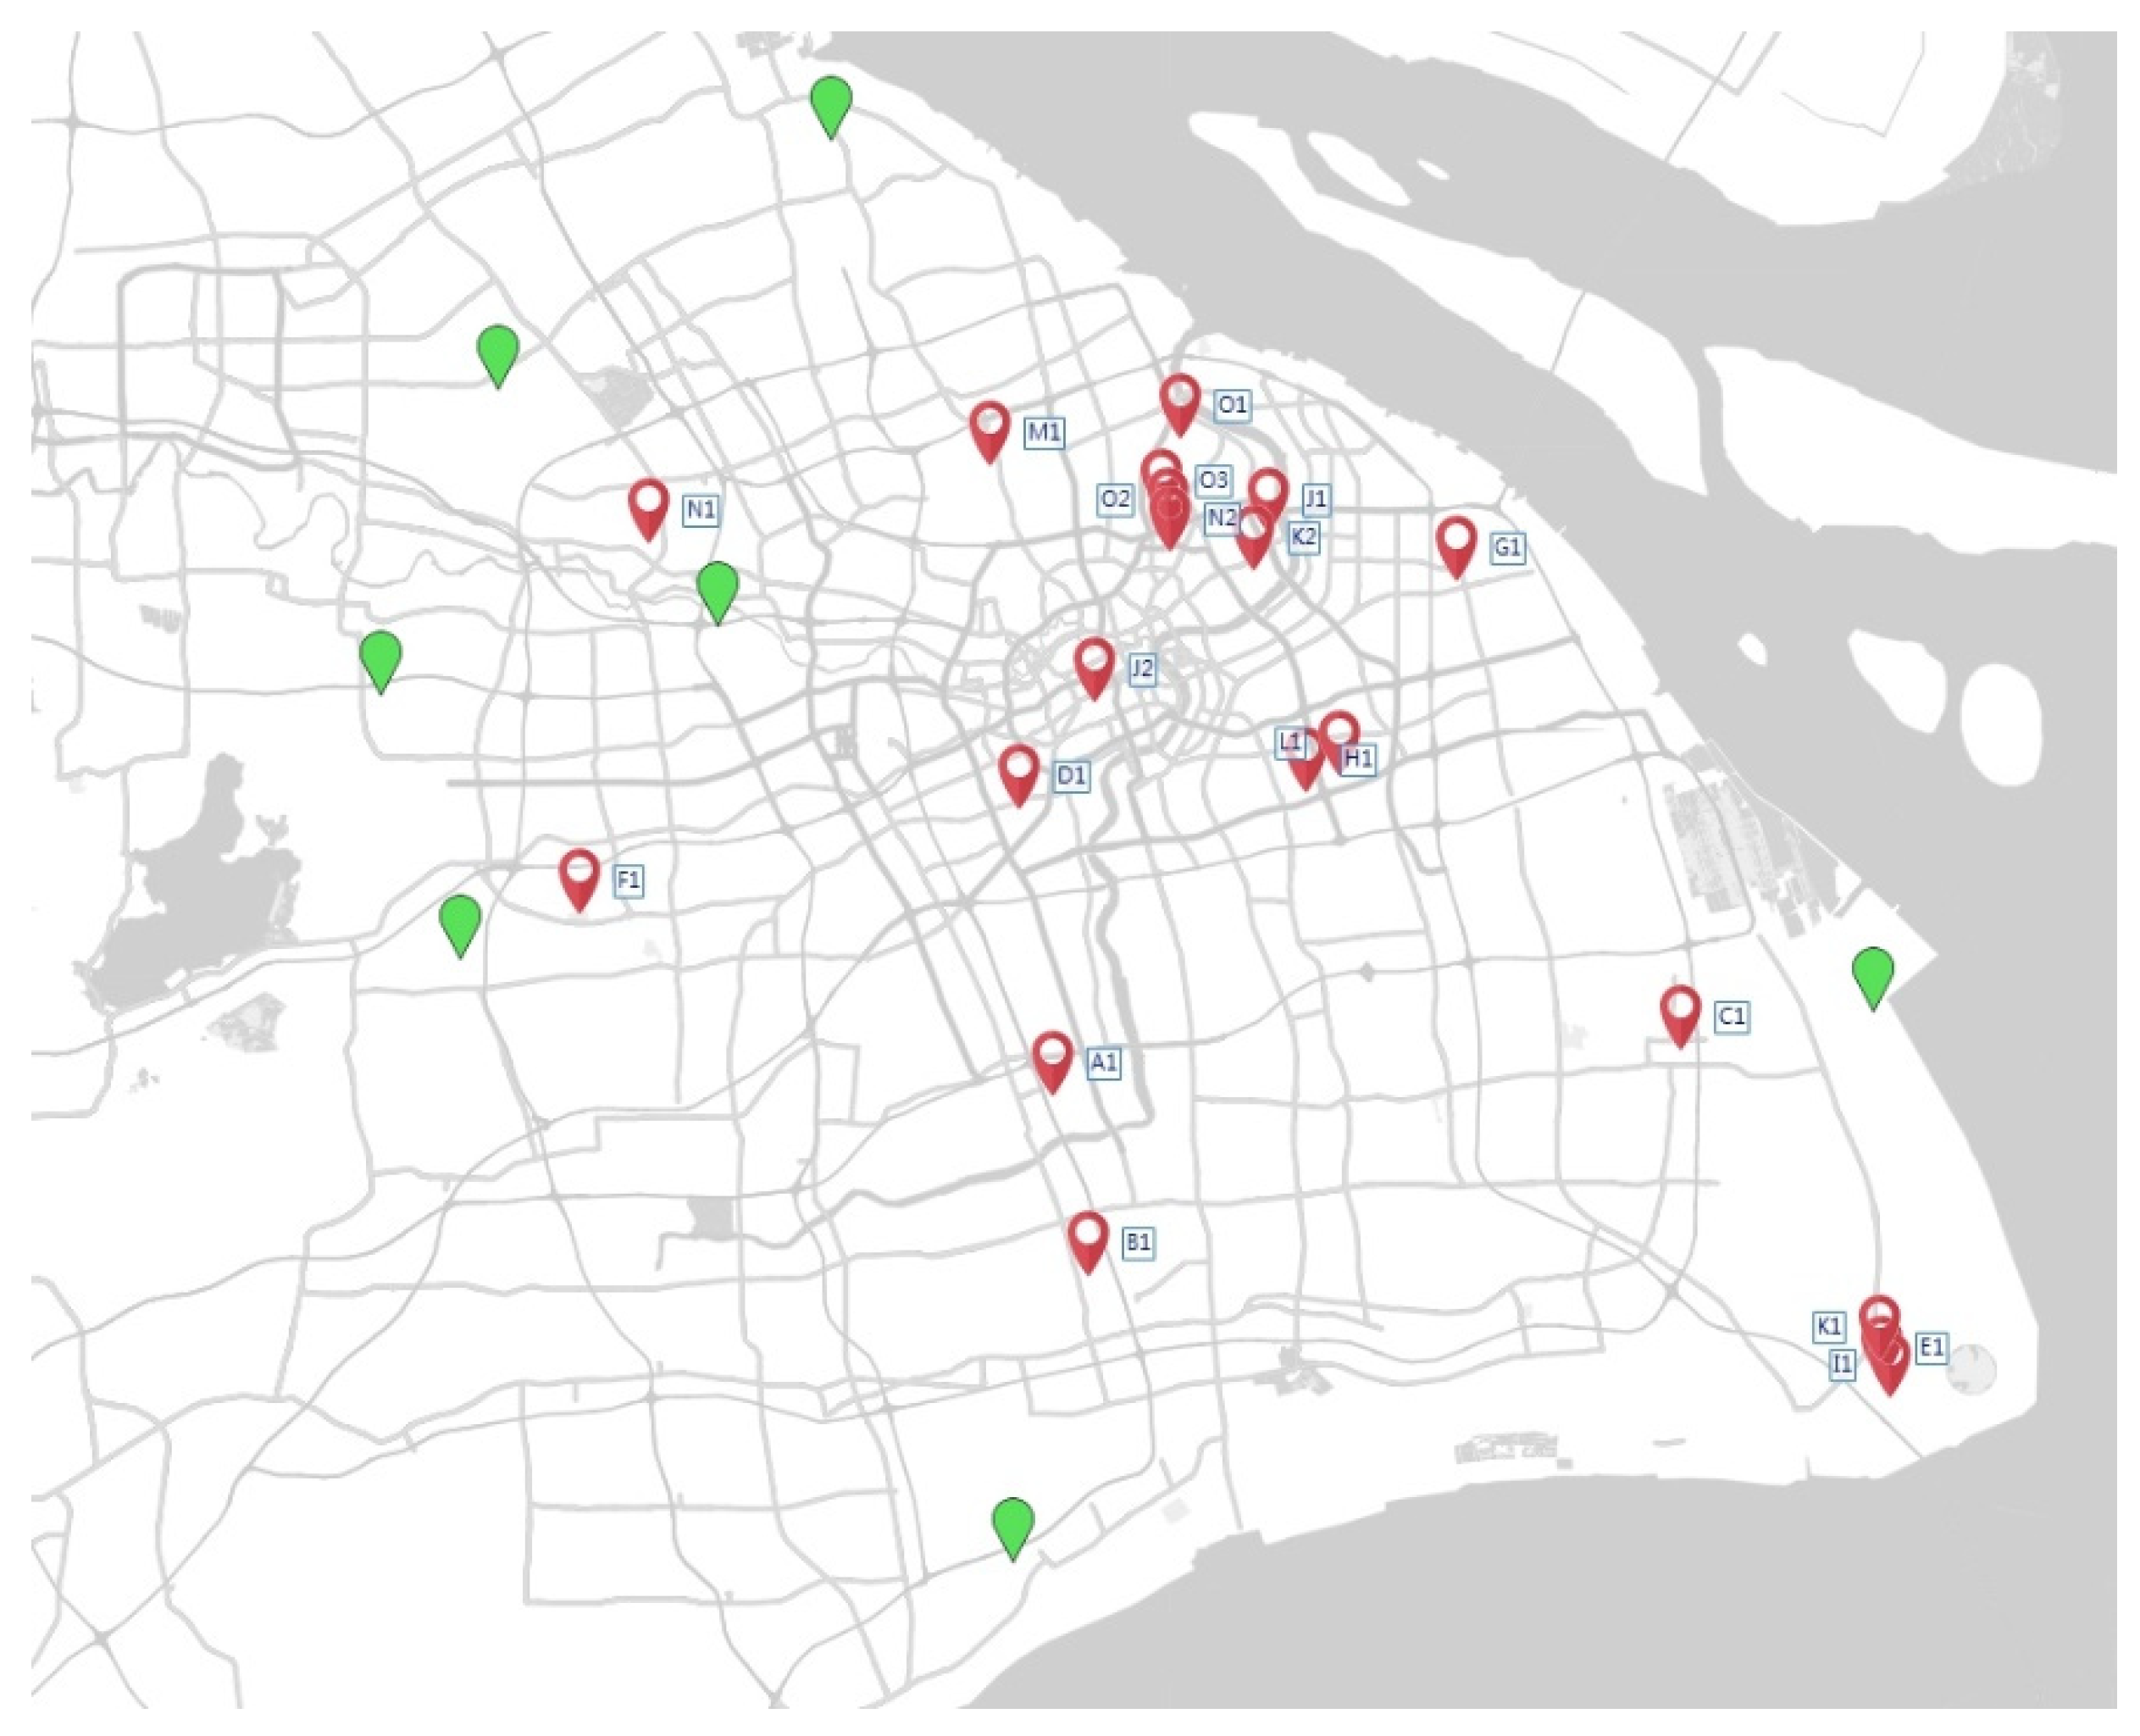
Figure 1 shows the locations of the universities and the centralized disposal plants in Shanghai. There are 307,303 students and faculty in total that generate wet waste of about 125,994.23 kg per day. The innate advantages of launching on-site wet waste disposal at universities include the strong sense of social responsibility, relatively abundant funds, strong environmental education atmosphere, large population density, complicated components of wet waste testing the performance of equipment effectively, and more green lands available for re-utilized fertilizer.
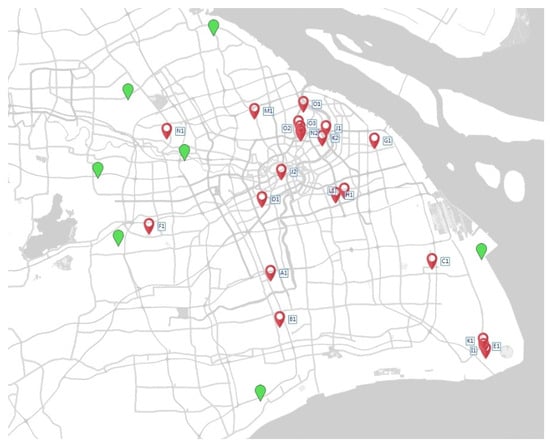
Figure 1.
The locations of the universities and the centralized disposal plants in Shanghai. Each red and green mark, respectively, represents a university and a centralized disposal plant. The letter represents the university, and the number presents the campus attributed to the university.
The university population characteristics, lifestyles, and management styles are not fundamentally different from those of other social entities. The composition of wet waste from universities is broadly representative because of its high complexity, and the geographical location across multiple Shanghai administrative districts also fully reflects the situation of wet waste transportation. Thus, the findings and conclusions of the study can be extended to other social entities such as primary and secondary schools, enterprises, residential communities, etc., as well as other cities.
The information about the universities and the on-site disposal projects is shown in Appendix A (Table A1).
3.2. Data Source
The data and information of equipment parameter, service condition, power consumption, disposal process, operational cost, user’s attitude tendency, etc. come from the fieldwork including a field investigation and in-depth interview, which were supported by the universities, Shanghai Municipal Education Commission, Shanghai Landscaping and City Appearance Administrative Bureau, Shanghai Municipal Waste Management Office, and equipment manufacturers. The distance of transportation between the universities and centralized disposal plants is measured manually by Gaode Map. The industry data, such as the emission factor of the electricity grid, comes from the Shanghai official report and standard. Data that cannot be collected in reality come from peer-reviewed scientific studies and the IPCC 2006 default.
To reflect the differences in GHG emissions, which resulted from different levels of technology and management, there are two sets of data for most of the parameters which involve calculation, representing the most advantageous and the most disadvantageous GHG emission control scenario. There are also three sets of economic parameters for on-site disposal, representing the most advantageous, medium, and least advantageous costs, respectively, to illustrate the differences in costs caused by factors such as the different prices for equipment and the maturation of the re-utilization market.
3.3. Research Methods
3.3.1. Accounting of GHG Emissions
For a systematic and complete depiction of GHG emissions, the LCA system boundary and LCI for centralized and on-site disposal mode of wet waste were established. And the IPCC 2006 method was used to specifically calculate the emissions of each disposal mode under two scenarios which are most advantageous and most disadvantageous to the GHG emission control (or reduction).
In this paper, there are several categories of GHG emissions. The reasons for the categorization are that, first, according to the instruction from National Development and Reform Commission of China, the main paths to achieving Carbon Peak and Carbon Neutrality include building a clean and low-carbon energy system, promoting energy saving and GHG emission reduction in priority areas, etc. [36]. Thus, the specific calculation of emissions from energy consumption is considered. Second, as mentioned at the beginning, Carbon Peak and Carbon Neutrality include the reduction of non-CO2 GHGs. And the disposal of wet waste emits non-CO2 GHGs represented by CH4 and N2O during the process. These request this study to include the emission of CH4 and N2O [37,38]. Third, both centralized and on-site disposal convert wet waste into re-utilized products such as biogas-electricity, fertilizer, etc. These re-utilized products can replace similar products produced by the drive of fossil energy to reduce the anthropogenic GHG emissions for the whole society [39,40,41]. Therefore, the GHG emission saving effect from re-utilized products, which is important for Carbon Peak and Carbon Neutrality, is considered in this study as well. For all those reasons, the inventories of GHG emissions are divided into three categories: emissions from energy consumption (CO2 emissions caused by chemical production, and fossil fuel and power consumption), emissions from CH4 or N2O (non-CO2 emissions), and emission savings (GHG compensation by re-utilized products). This categorization is also widely used in other research [9,16,42].
In IPCC 2006, the general method for calculating anthropogenic GHG emissions is to multiply information about the extent of human activity by a coefficient that quantifies emissions per unit activity. The former is called Activity Data (AD), and the latter is called Emission Factor (EF) [43]. Thus, the formula for calculating GHG emissions is generally as follows:
According to IPCC 2006, the CO2 converted from the organic material of wet waste and the microorganism is ignored due to biogenic origin. This idea was applied by many other researchers. In this case, only CO2 emissions from energy consumption are included.
3.3.2. Economic Analysis
Since wet waste disposal requires long-term continuous investment, based on the universities as the sole funder without any subsidy, the NPV method was used to estimate the long-term cumulative cost input of universities for each disposal mode. Especially, there are three scenarios for on-site disposal which are most advantageous, medium, and most disadvantageous to cost input control, respectively.
The formula for calculating the cumulative NPV is as follows:
where is the net cash flow in period, is the initial investment, is the project life, is the discount rate.
If the initial investment is regarded as the net cash flow in year zero, the Formula (2) can be rewritten as follows:
3.3.3. Comprehensive Evaluation within Multiple Factors
According to the fieldwork, GHG emission control, economy, stability, education and innovation, and bargaining power for municipal sanitation departments are designated as the five main factors influencing the evaluation for wet waste disposal modes. The interpretations of stability, education and innovation, and bargaining power for municipal sanitation departments are as follows:
Stability indicates the ability of the wet waste disposal mode to consistently meet disposal demand. It depends on the failure rate of disposal equipment and supporting facilities, tolerance to the purity of wet waste, aging speed, and redundancy disposal ability to deal with risks.
The pilot universities believe that on-site disposal has the value of environmental education and the value of innovative construction of ecological civilization. The facility of on-site disposal at those universities has not only become the teaching and scientific research bases for teachers and students of Environment, Biology, etc., but also as a relatively novel mode of household waste disposal, has played an important role in promoting waste classification, reduction of leftovers, separation of tableware and waste, etc.
The pilot on-site disposal can also be used as a reason, based on the depth interviews of the universities, to limit price increase when negotiating with the municipal sanitation department for wet waste disposal charge, since there is still a large amount of wet waste generated in campus beyond the capacity of pilot on-site disposal and other household waste needing to be taken away by the municipal sanitation department.
Due to the subjectivity and fuzziness of decision-making when social entities are selecting the disposal mode, the AHP was used to determine the weight of each factor, and FCE was used to evaluate and compare the modes.
The steps in the AHP to determine the weight of factors are as follows:
First, a pairwise comparison matrix is constructed based on the importance of each factor to the decision-making objective. The quantification of importance is based on the scale of 1–9 (Table 1) proposed by Saaty [44,45].

Table 1.
The AHP scale for pairwise factors.
Assuming that there are factors, according to the scale above to quantify the importance, the constructed pairwise comparison matrix is as follows:
where is the quantified importance of i-th factor relative to the j-th factor. and are reciprocal.
Second, based on the pairwise comparison matrix, the weight of factors can be derived by the formula as follows:
where is the weight of the i-th factor.
The weight vector for factors with fuzziness can be expressed as follows:
Finally, it is necessary to check the consistency rate (CR) of the pairwise comparison matrix for the reliability of the weights. The check formula is as follows:
where is the largest eigenvalue of pairwise comparison matrix , is the consistency index shown in Table 2. When , the outcome of weights is reliable.
Table 2.
The number of factors n and RI.
Following the weight determination, the steps to evaluate a scheme within multiple factors by FCE are as follows:
First, the factor vector and evaluation-result vector are constructed as follows:
where is the m-th factor, is the n-th evaluation-result which can be defined by grades, comments, values, levels, etc.
Second, if the membership (0~1) of the m-th factor in vector to the 1st evaluation-result in vector is , then all evaluation-results of the single m-th factor can be represented by a fuzzy vector as follows:
The fuzzy comprehensive evaluation matrix , which is composed by fuzzy vectors of single-factor evaluation-results , is as follows:
where is the membership of the m-th factor to the n-th evaluation result.
Third, considering the differences in the importance of each factor, FCE needs to transform the weight vector (from AHP) which is related to into fuzzy vector which is related to , that is as follows:
where is a synthetic operator for the comprehensive evaluation, which is generally the matrix multiplication.
Finally, the final evaluation result of the scheme is the evaluation result corresponding to the maximum membership value in vector .
In this paper, the evaluation result for disposal modes is defined by “Good” and “Bad”. The membership is from 0 to 1, and the sum of all memberships for each main factor is equal to 1. If a disposal mode has a significant advantage for a certain main factor, then the score for the “Good” evaluation result of this disposal mode is 1, and the score for the “Bad” evaluation result of another disposal mode is 1. If no disposal mode has a significant advantage for a certain main factor, the score depends on the situation.
4. Results
4.1. Analysis of GHG Emissions Accounting
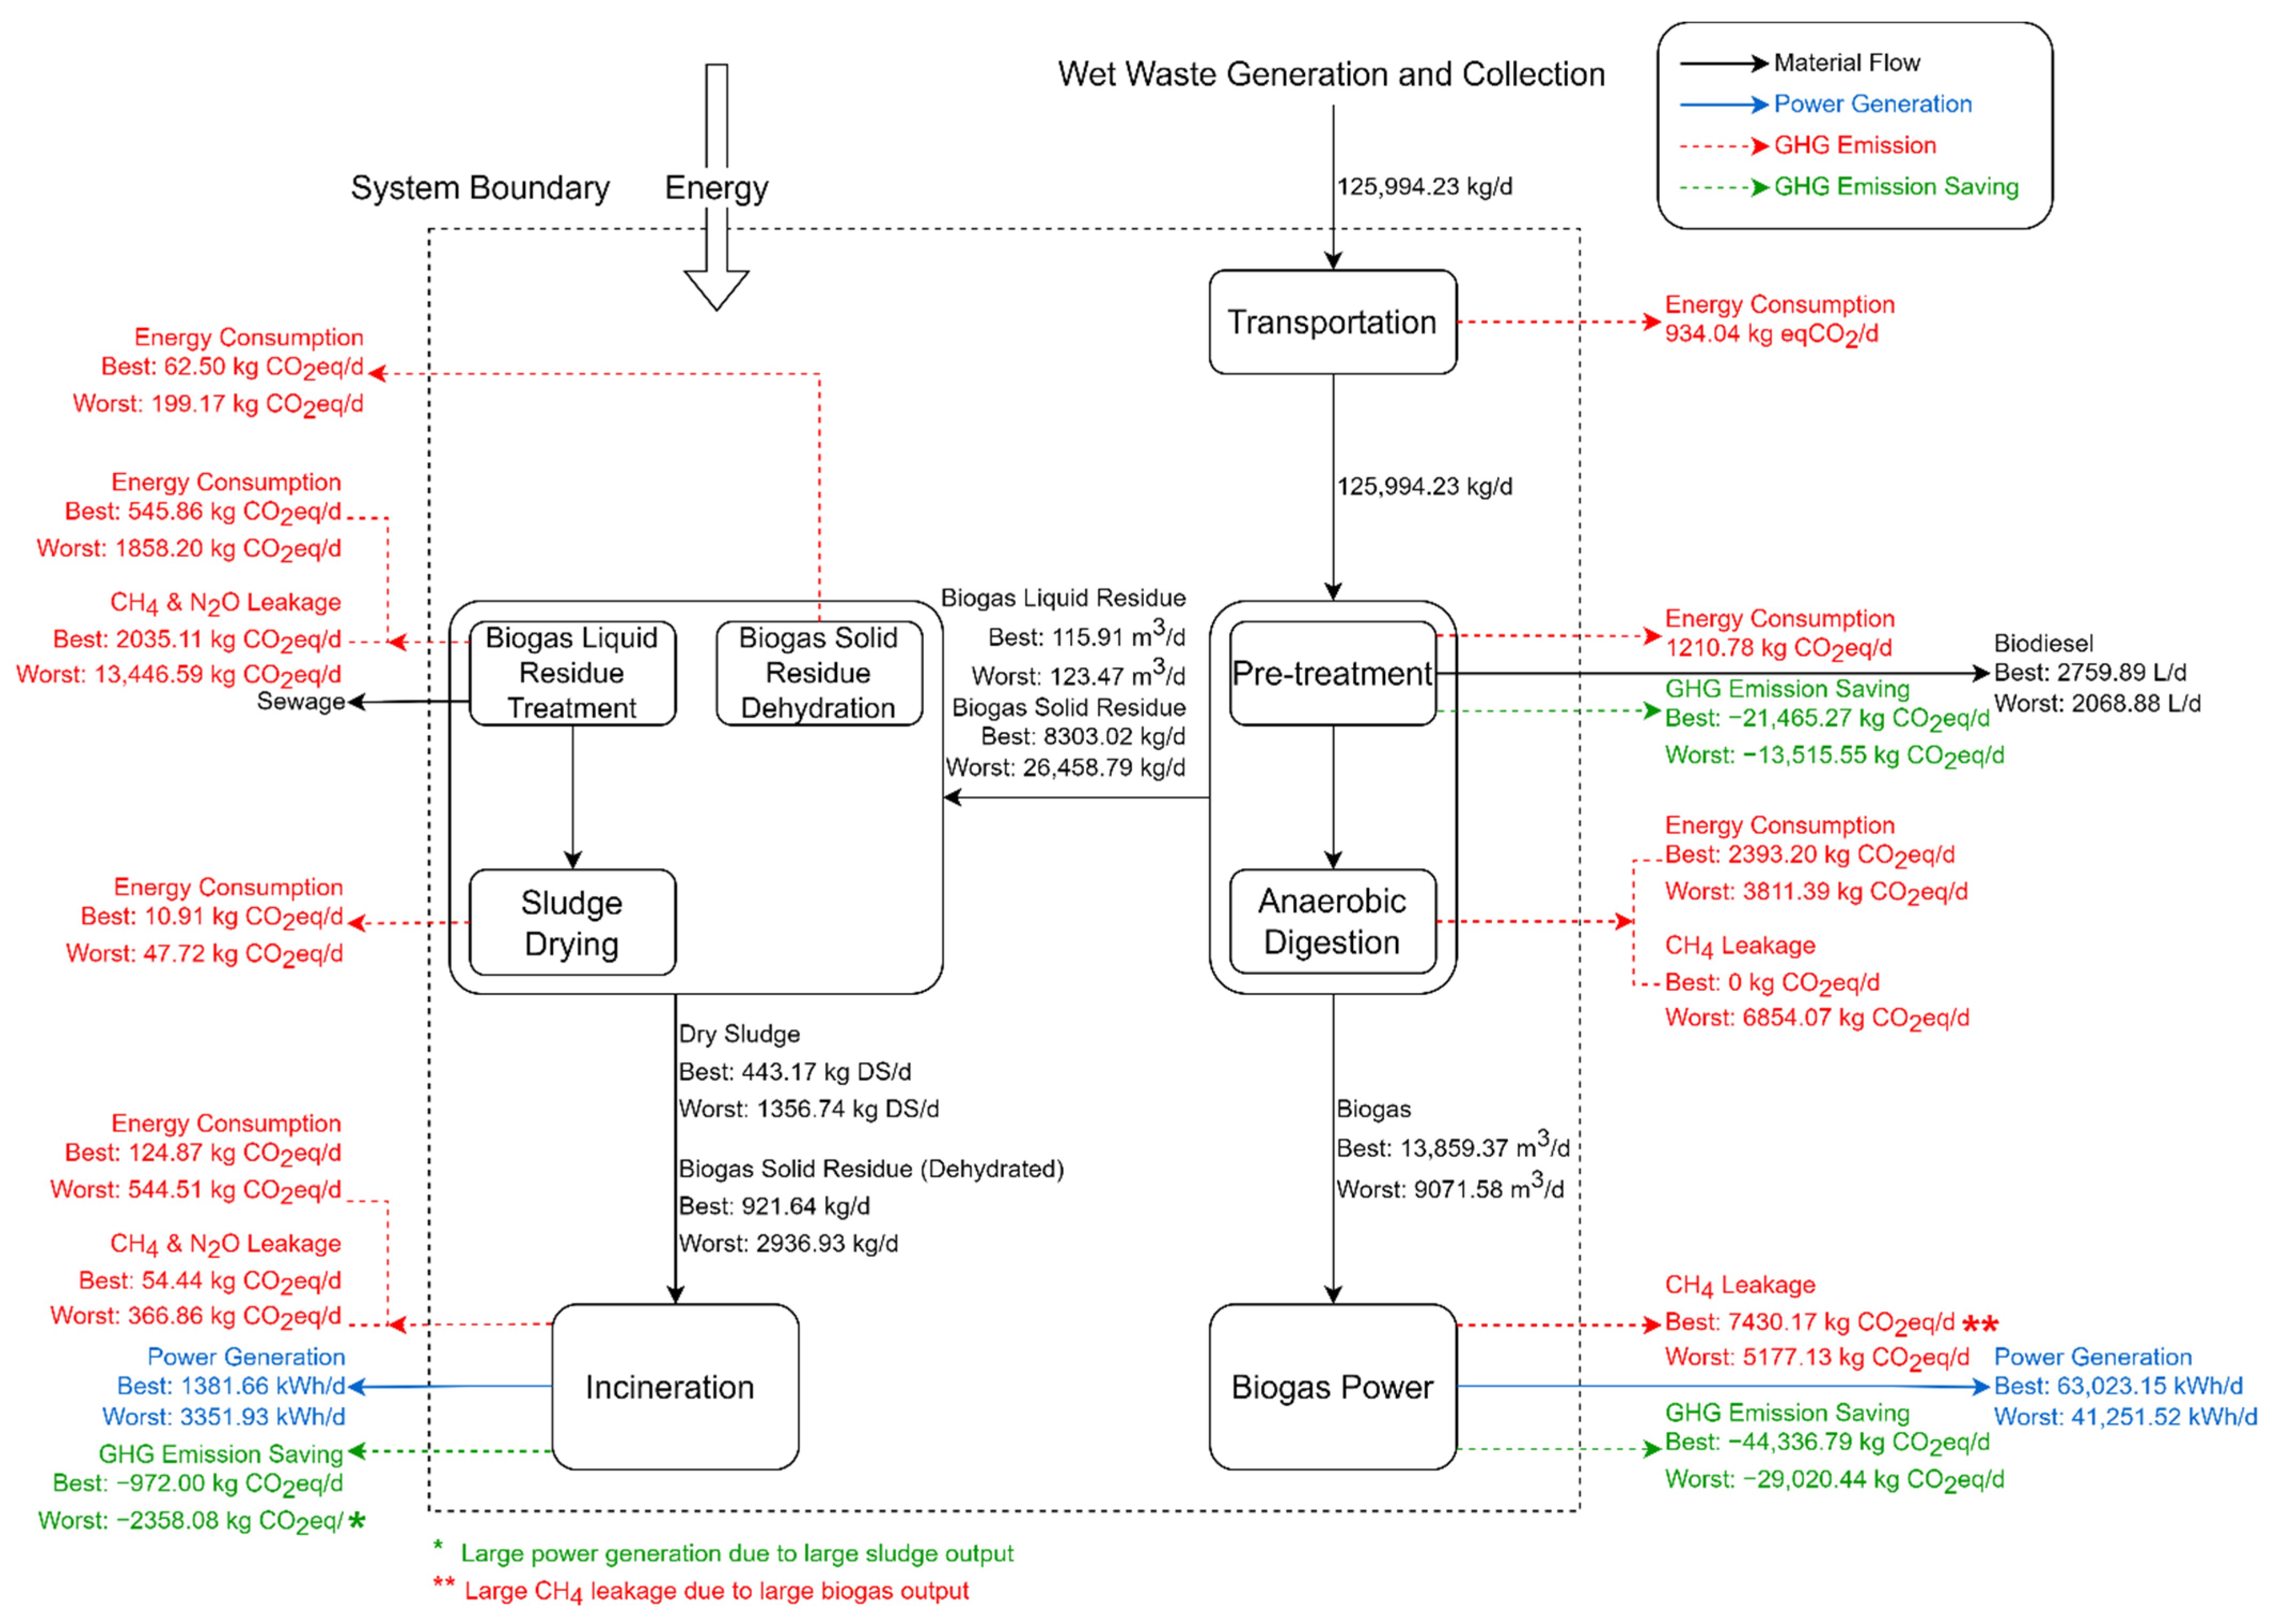
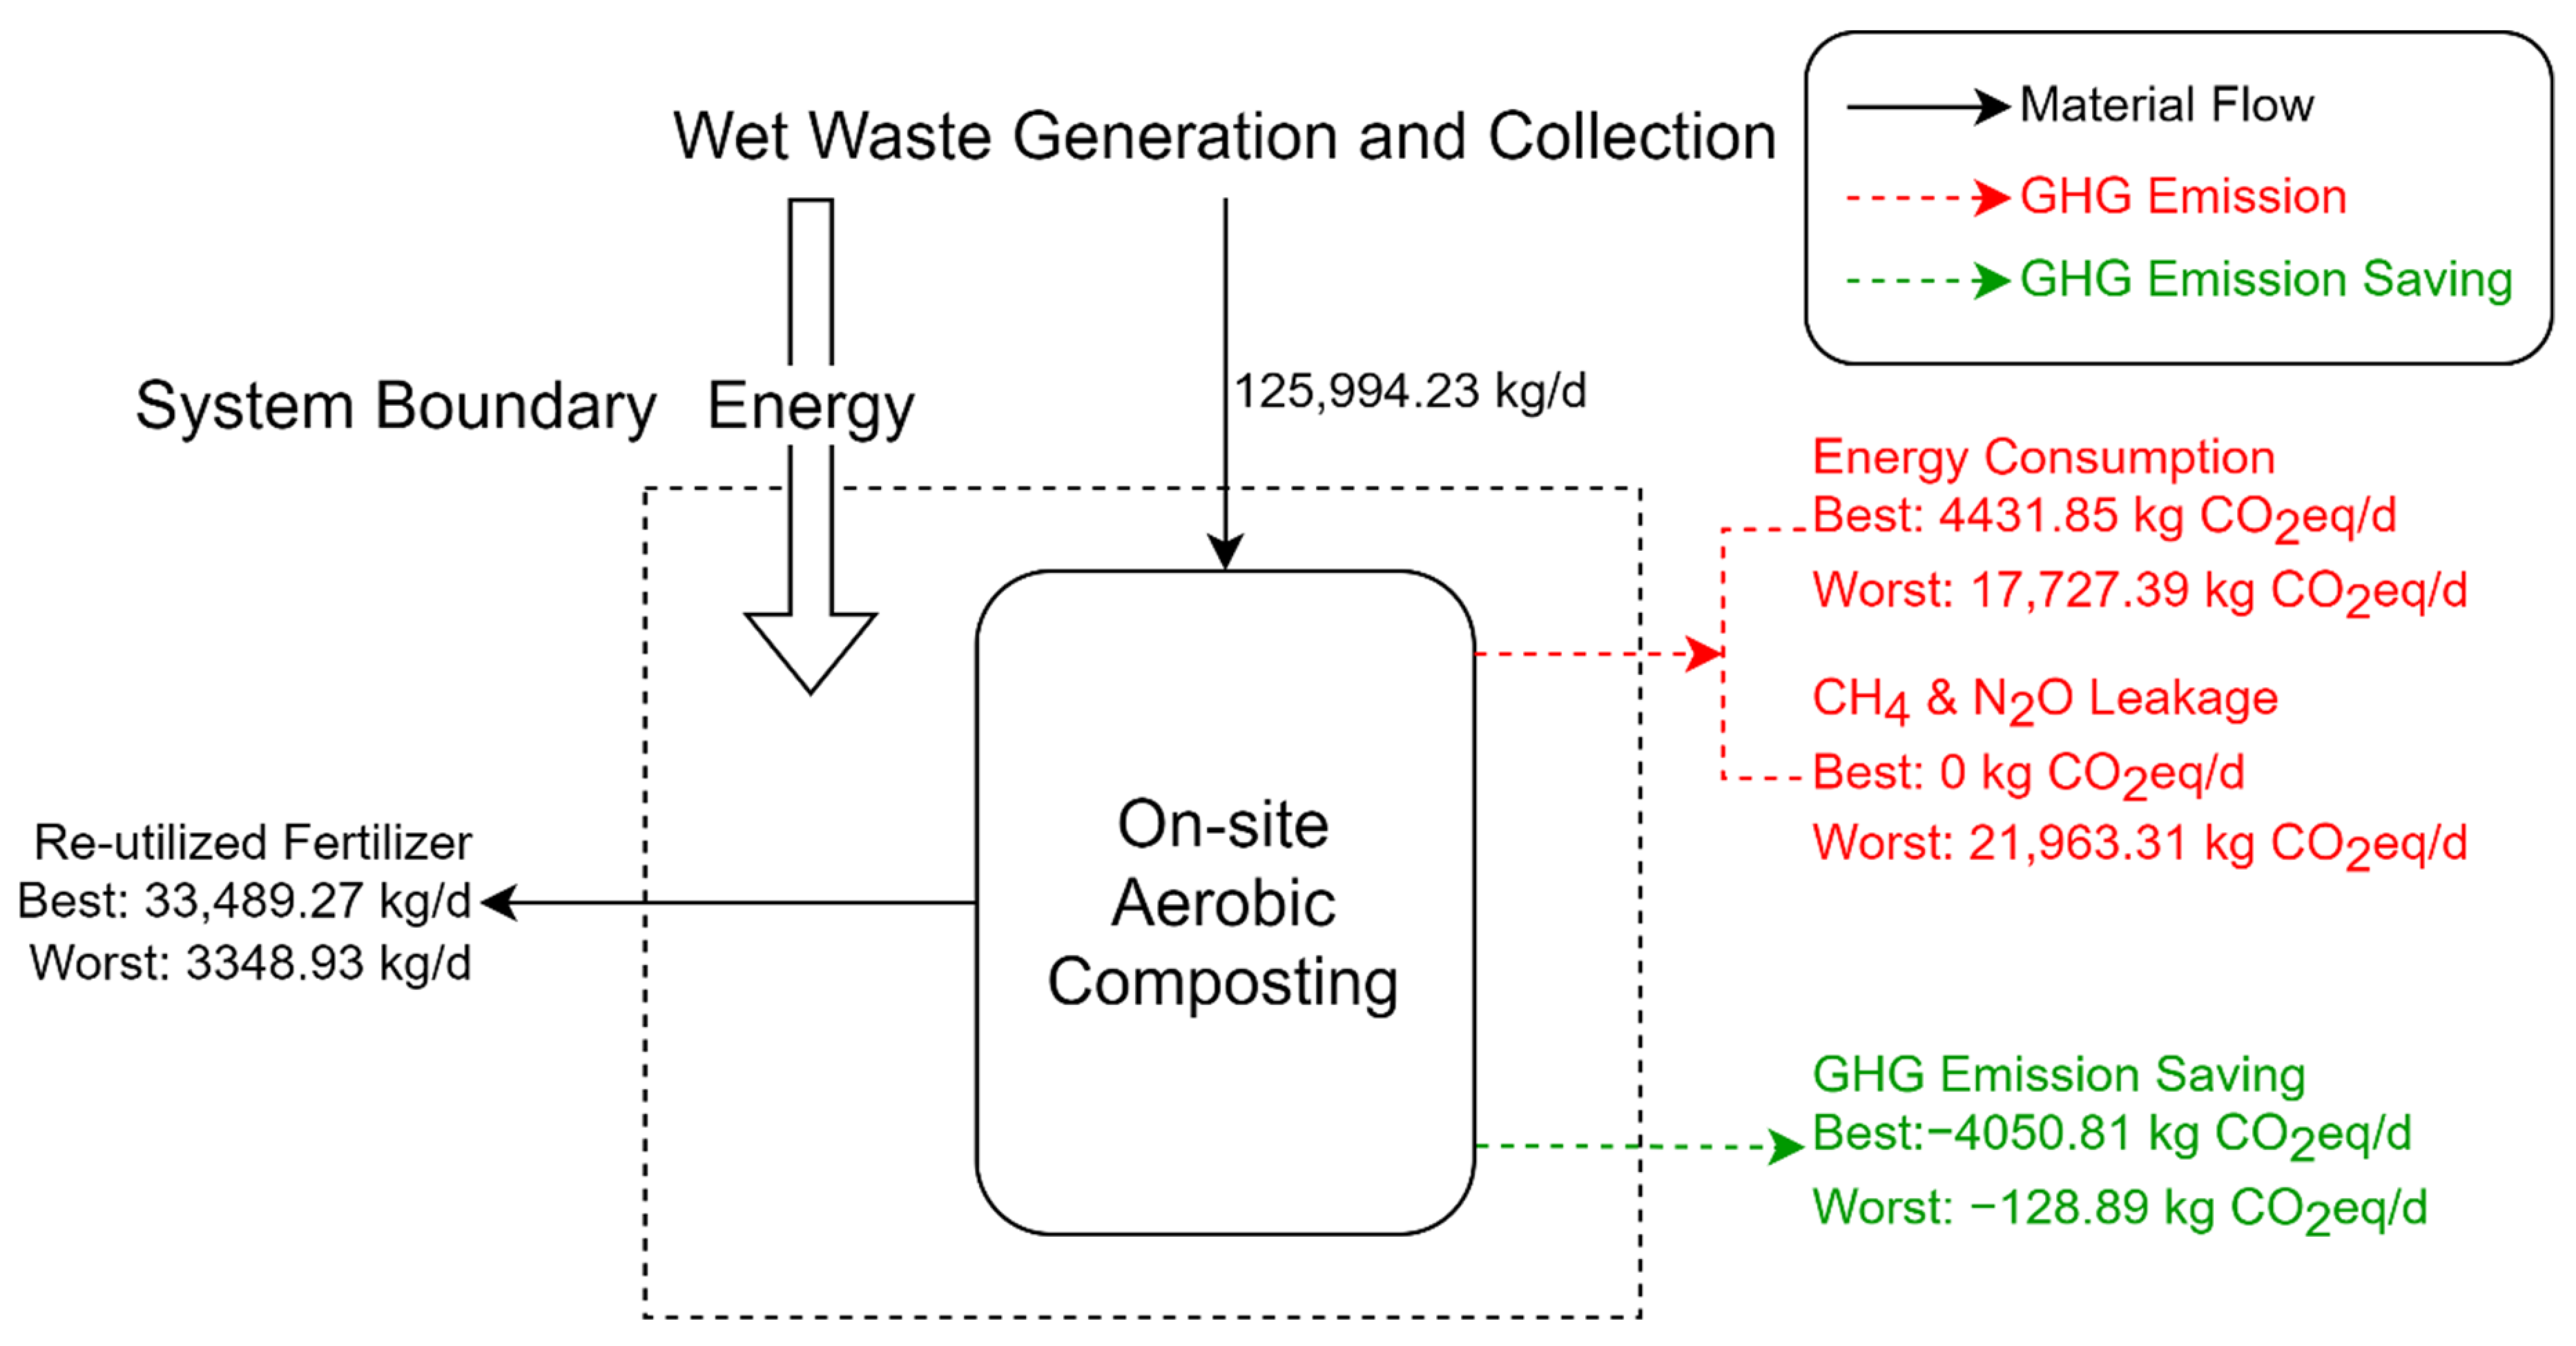
The LCA system boundary and LCI of the two wet waste disposal modes are shown in Figure 2 and Figure 3. The material flow begins with the generation and collection of wet garbage on campus, then goes through each functional unit of the disposal process. The labels “Best” and “Worst” in all figures indicate the outcomes of two scenarios which are most advantageous and most disadvantageous to the GHG emission control, respectively. All GHG emissions are measured in CO2 equivalent.

Figure 2.
The LCA system boundary and LCI of the centralized wet waste disposal mode.

Figure 3.
The LCA system boundary and LCI of the on-site wet waste disposal mode.
The summarized inventories of the GHG emissions and re-utilized products are shown in Table 3 and Table 4.
Table 3.
The inventories of the GHG emissions and re-utilized products for centralized wet waste disposal mode.
Table 4.
The inventories of the GHG emissions and re-utilized products for on-site wet waste disposal mode.
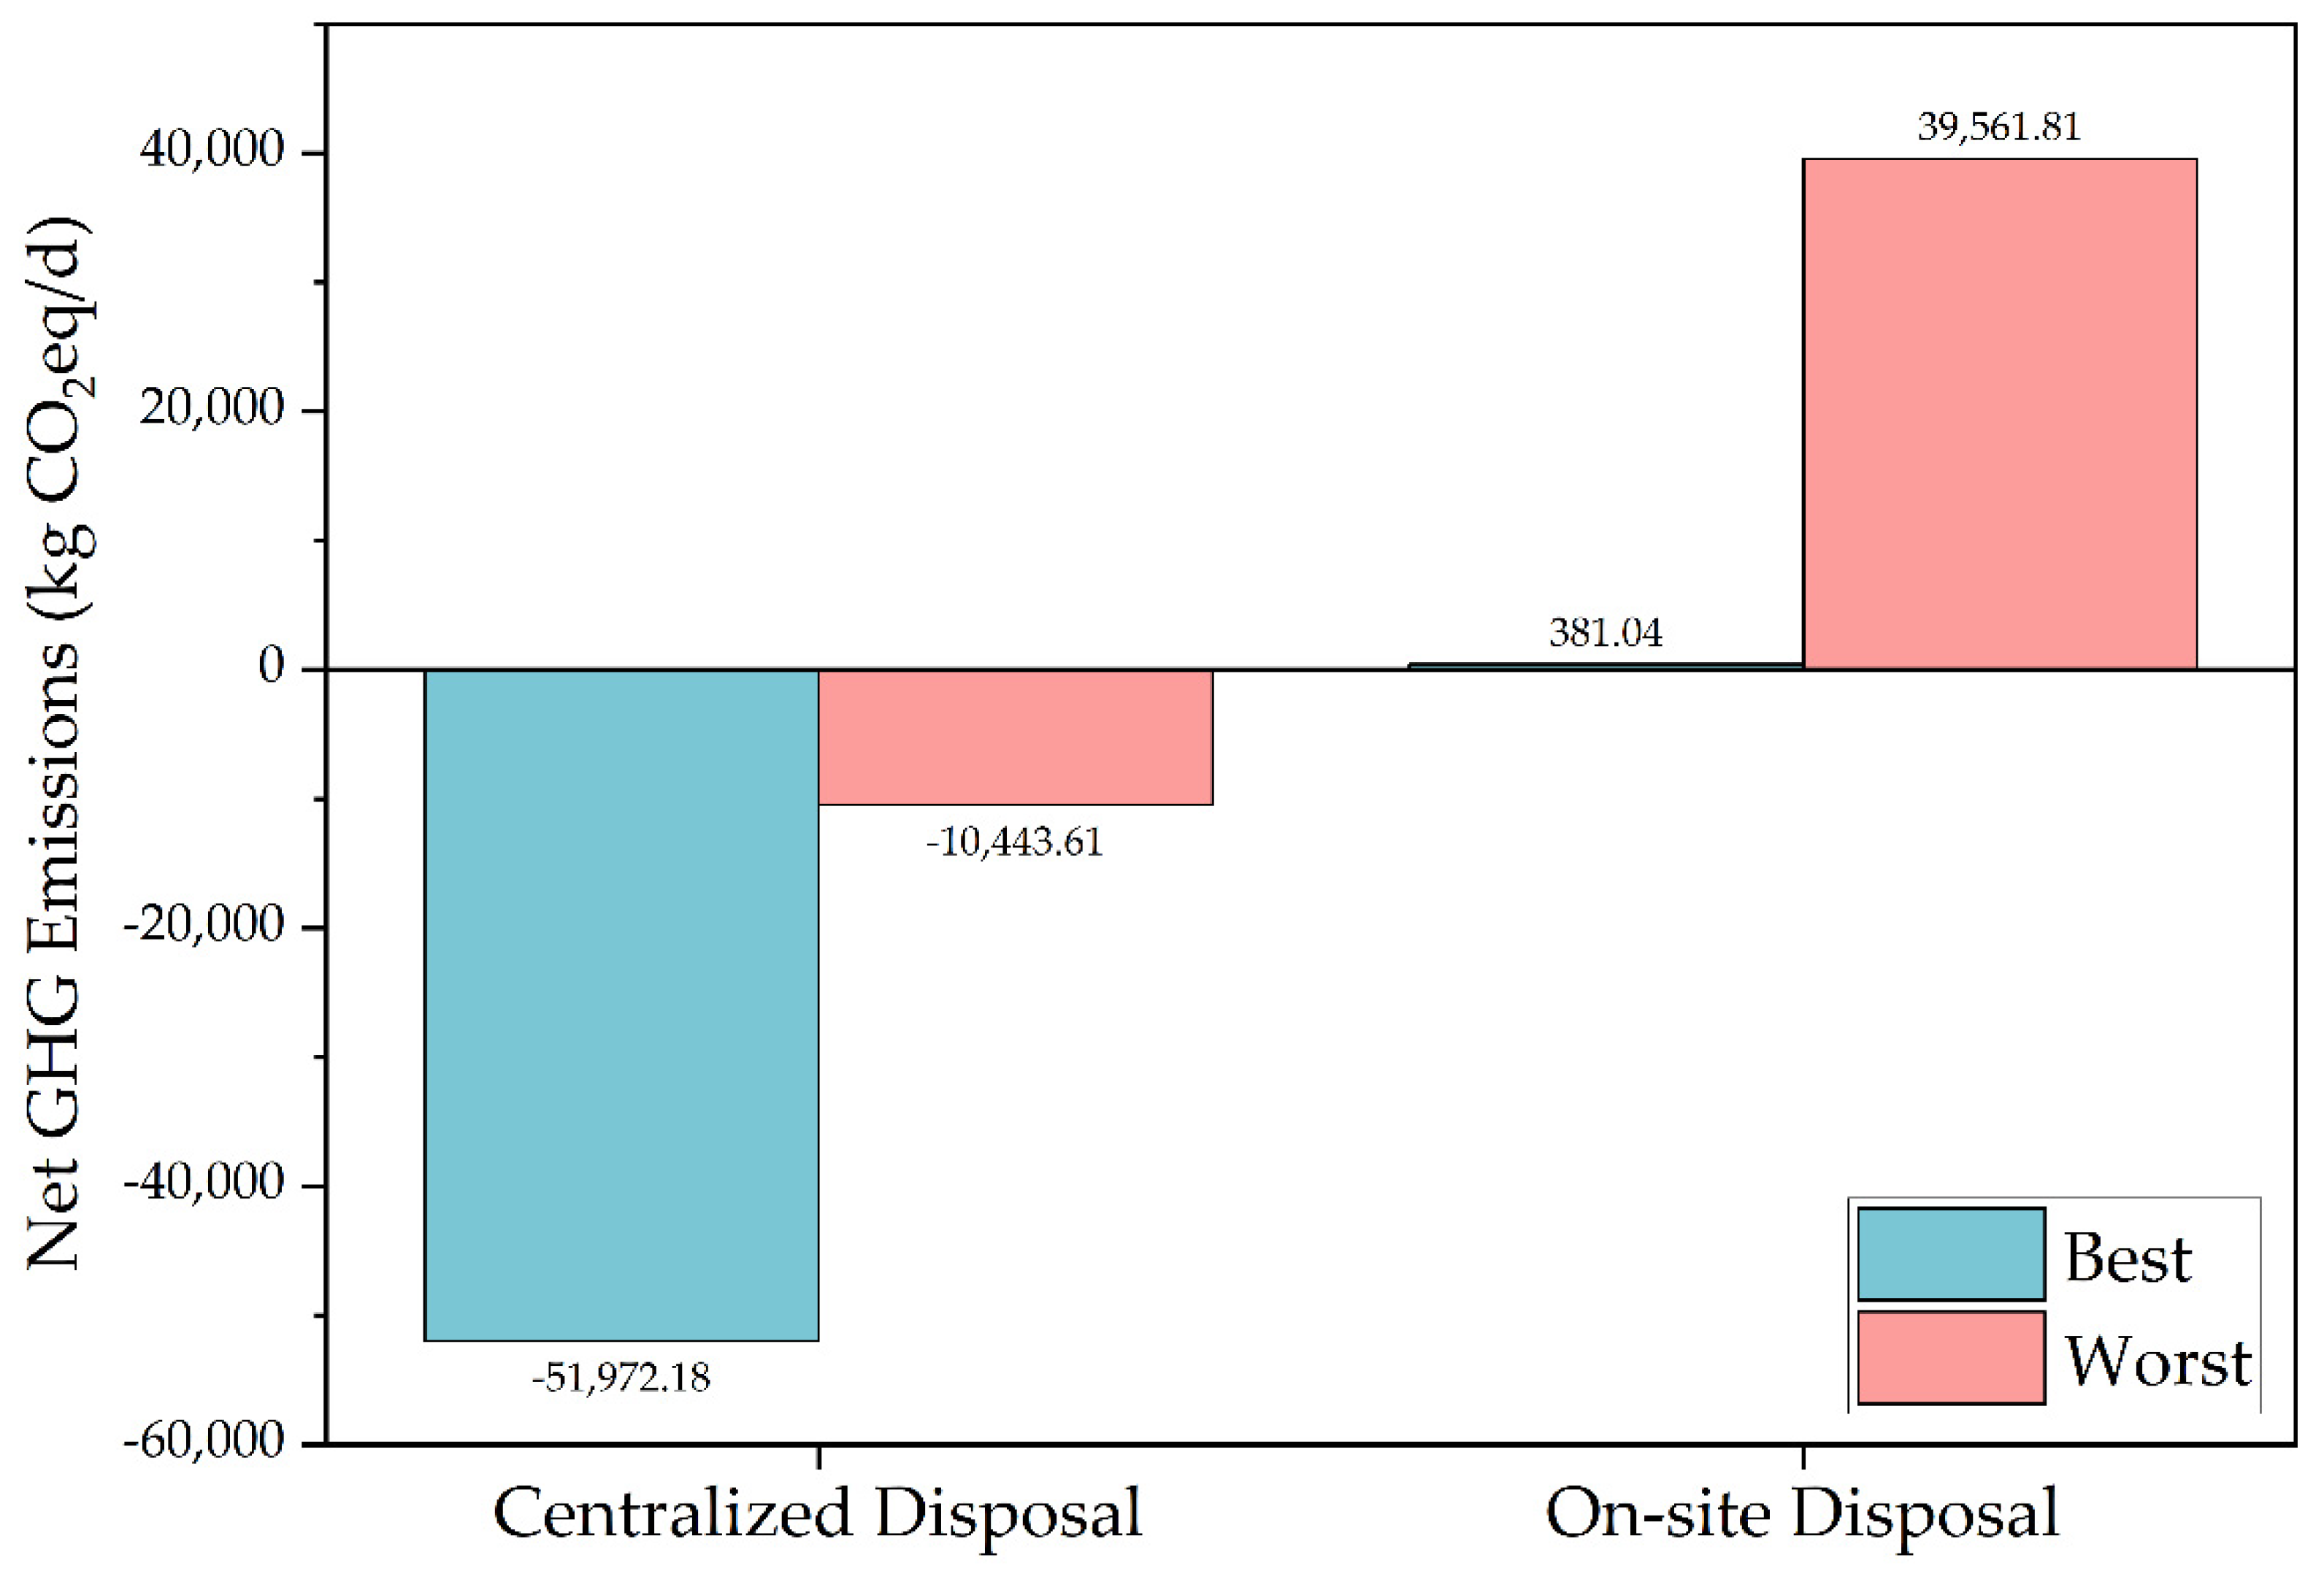
Figure 4 shows the net GHG emissions of centralized and on-site wet waste disposal. The net GHG emissions are the algebraic sum of three categories of GHG emissions, where the amount of emission from energy consumption and CH4 or N2O is a negative value, and the amount of GHG emission savings is a positive value. The net GHG emissions of the centralized disposal in the most advantageous and most disadvantageous scenarios are −51,972.18 kg CO2eq/d and −10,443.61 kg CO2eq/d, respectively. Correspondingly, for on-site disposal, the net GHG emissions are 381.04 kg CO2eq/d and 39,561.81 kg CO2eq/d, respectively.
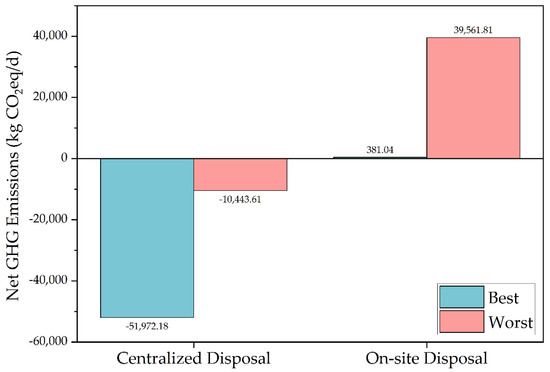
Figure 4.
The net GHG emissions of centralized and on-site wet waste disposal.
This result means that for GHG emissions control or reduction, the performance of centralized disposal is much better than that of on-site disposal. Even in the most disadvantageous scenario, the centralized disposal is much superior to the on-site disposal that is in the most advantageous scenario. Besides, on-site disposal always contributes a positive net volume of GHG emissions to the environment no matter which scenario it is in, which means on-site cannot achieve substantial GHG reduction.
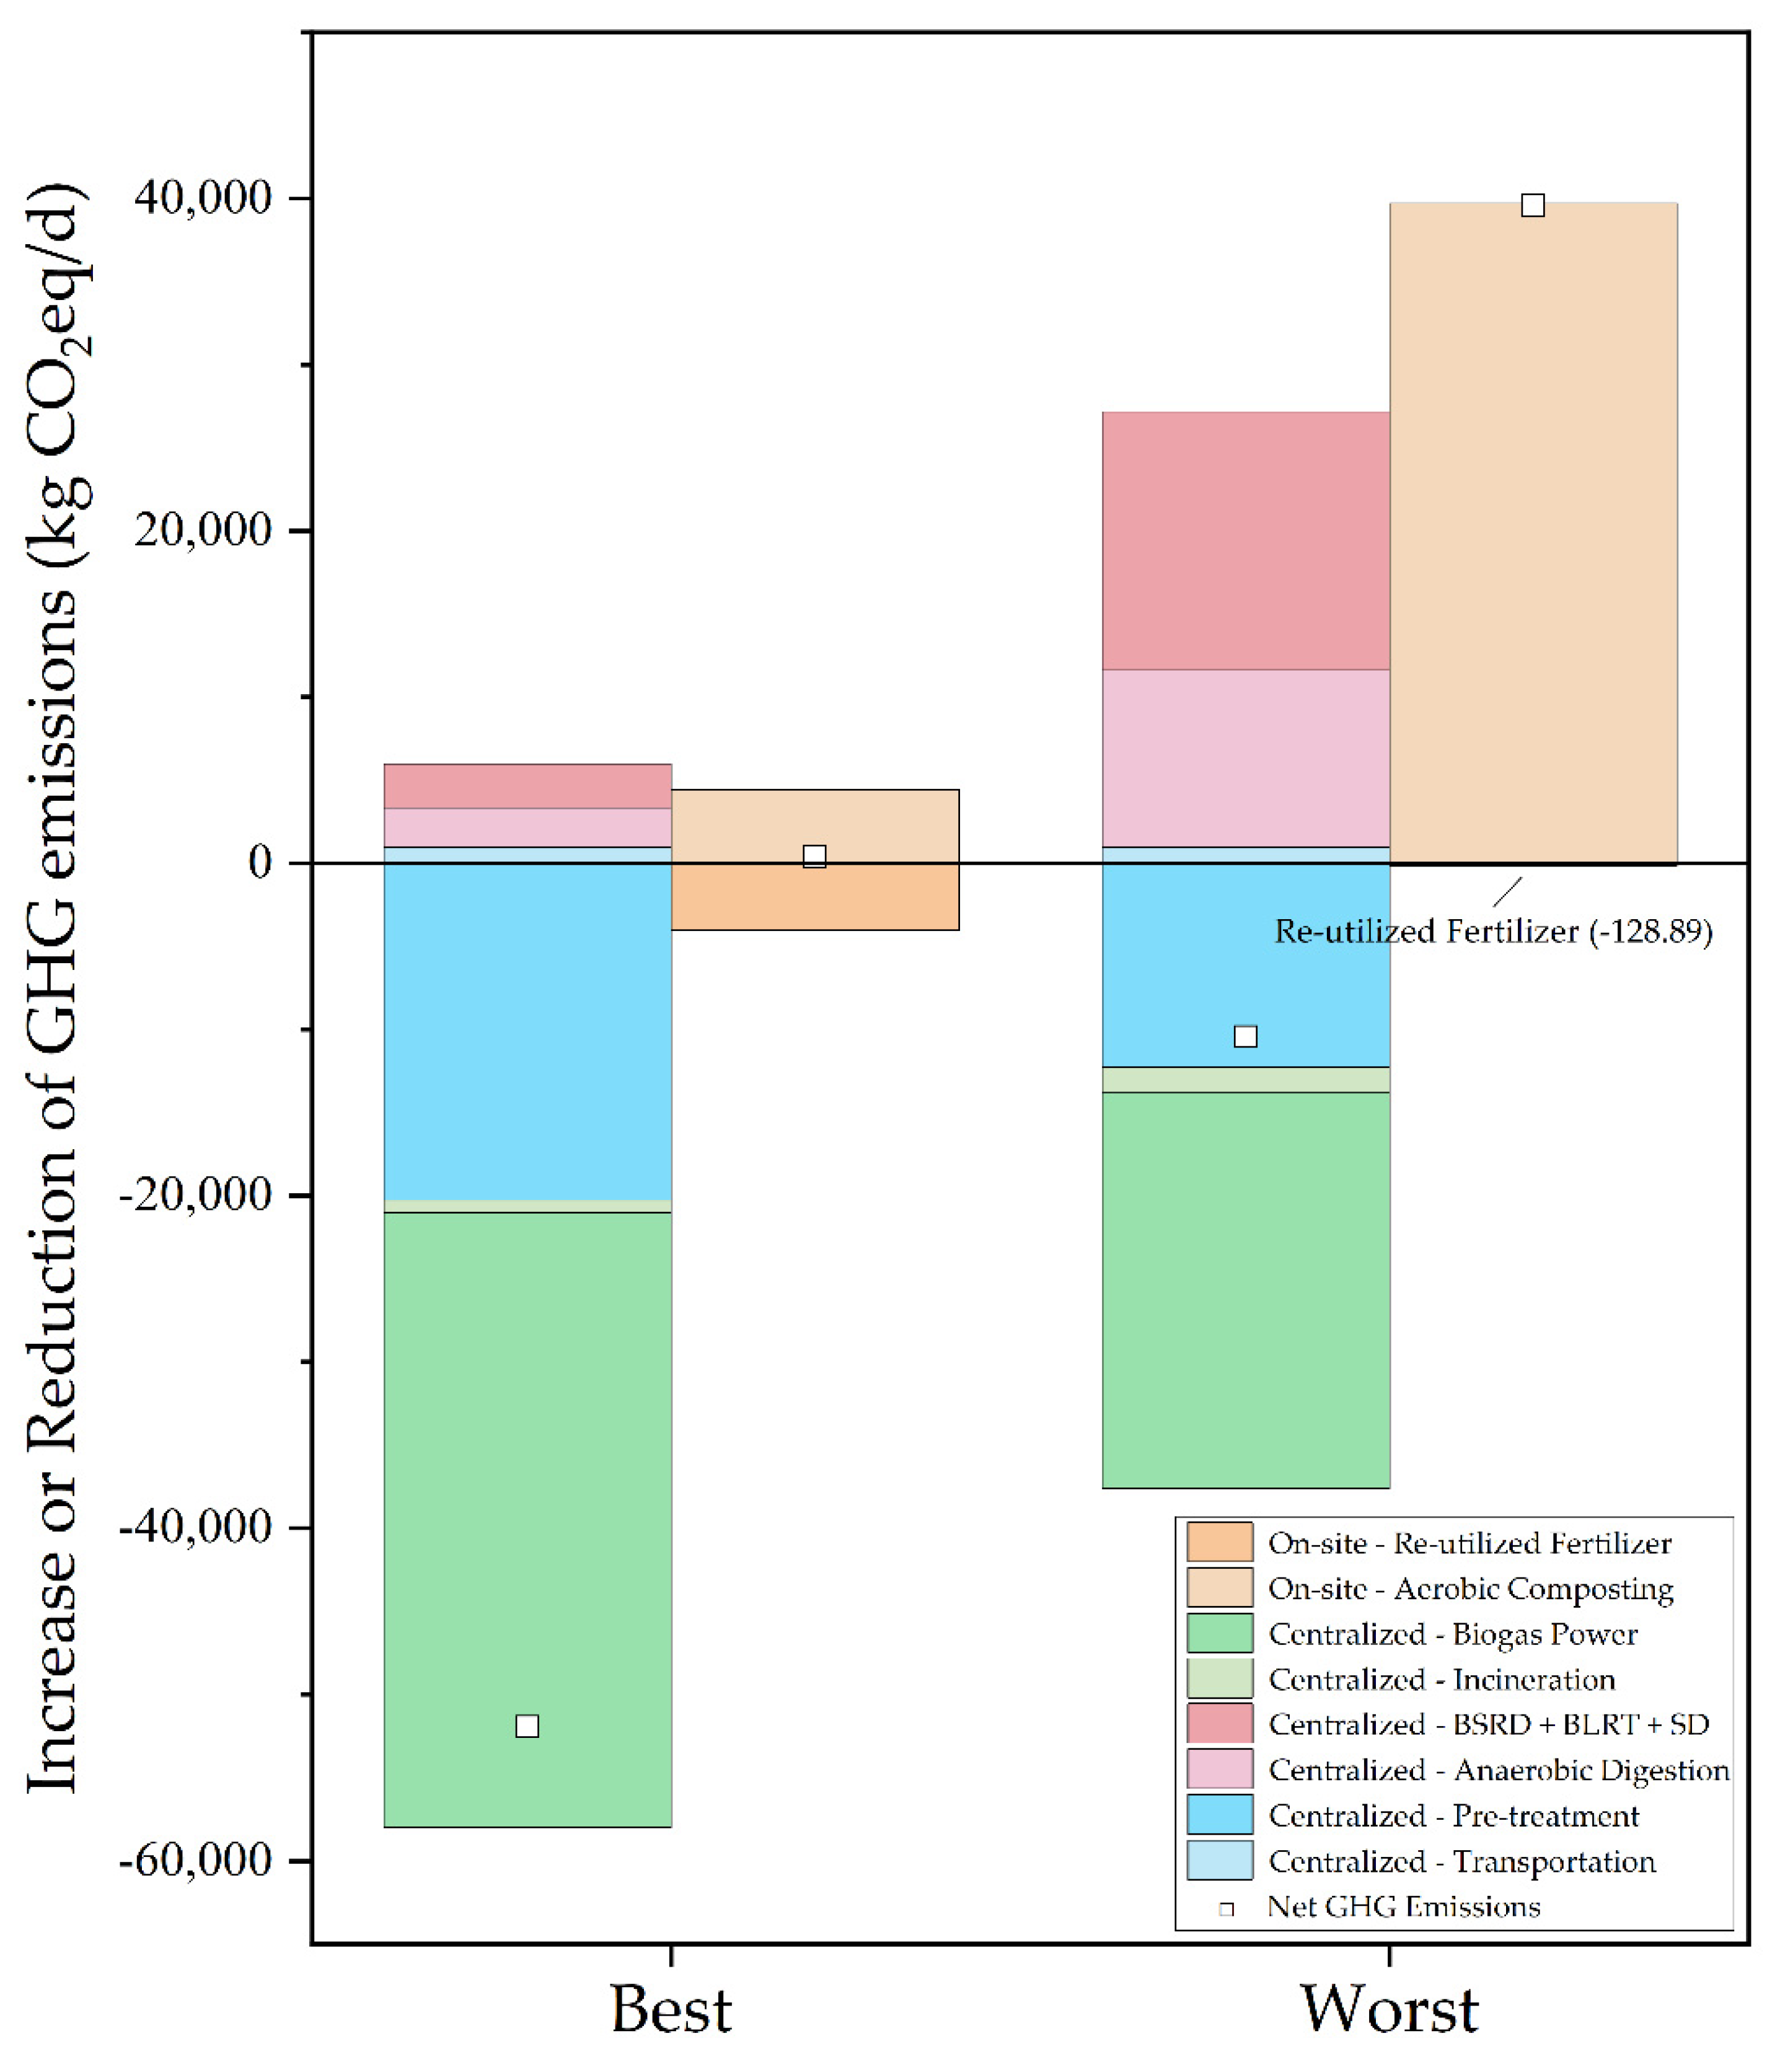
Figure 5 shows the increase and the reduction contribution of GHG emissions from each functional unit. Biogas solid residue dehydration, biogas liquid residue treatment, and sludge drying in centralized disposal are regarded as one unit, and the replacement of chemical fertilizer by re-utilized fertilizer in on-site disposal is regarded as a separate unit.
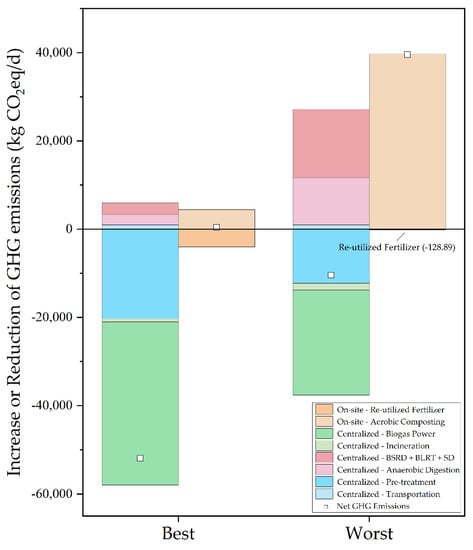
Figure 5.
The increase or reduction of the GHG emissions from each functional unit.
The biodiesel and biogas from centralized disposal contribute great value to GHG emission savings: they can be transformed to electricity 30,512.11 kWh/d and 63,023.15 kWh/d, respectively, in the best situation, and 19,211.87 kWh/d and 41,251.52 kWh/d, respectively, in the worst situation. Biogas solid residue dehydration, biogas liquid residue treatment, sludge drying, and anaerobic digestion together contribute the main GHG emissions for centralized disposal, due to the relatively large energy consumption and CH4 or N2O escaping.
The aerobic composting may cause immense GHG emissions, which are 4431.85 kg CO2eq/d in the most advantageous scenario, and 39,690.70 kg CO2eq/d in the most disadvantageous scenario. The latter is nearly nine times larger than the former. In that case, the GHG emissions saving from re-utilized fertilizer is offset. In the best situation, re-utilized fertilizer contributes 4050.81 kg CO2eq/d to GHG emission savings, which means that on-site disposal hardly reaches a balance between the GHGs’ output and input for the environment. The results suggest that on-site disposal equipment needs high-level management to prevent CH4 and N2O from escaping, or on-site disposal projects may become an intensive GHG emission source.
4.2. Analysis of Economy
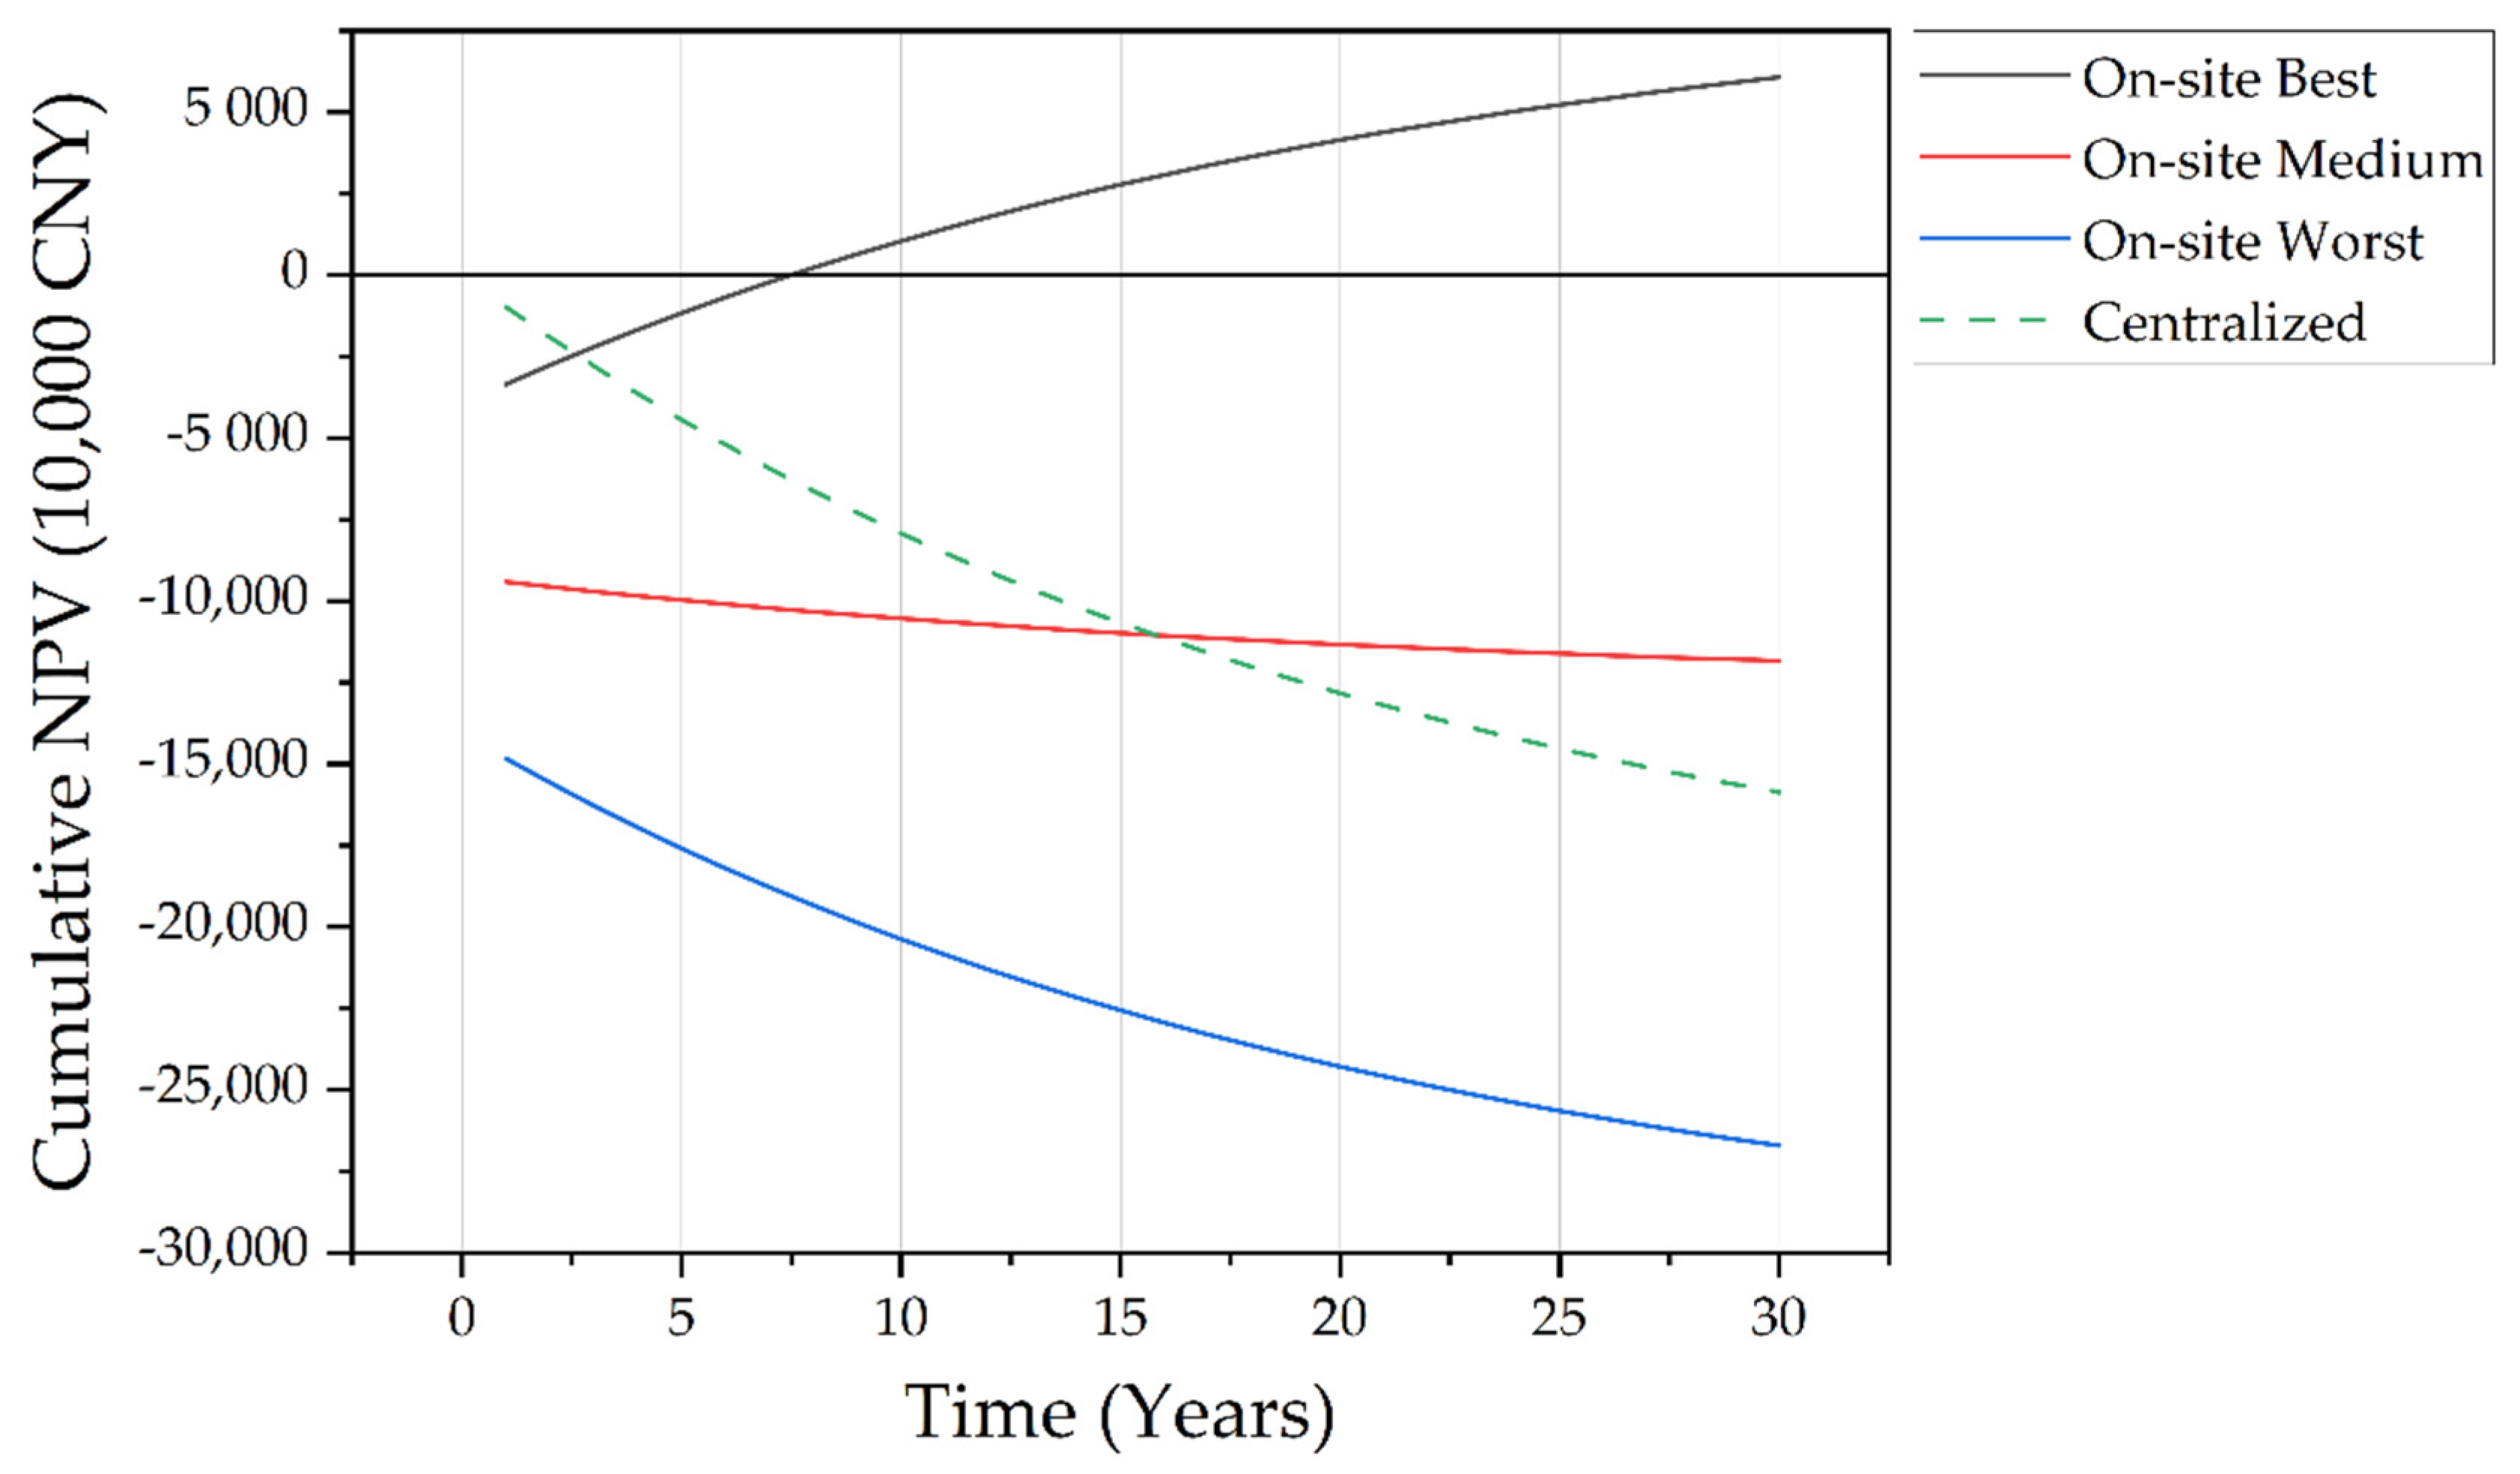
The cumulative NPVs of cost input on centralized and on-site wet waste disposal are shown in Figure 6. The “Best”, “Medium”, and “Worst” in the legend indicate the outcomes of three scenarios which are most advantageous, medium, and most disadvantageous to cost control of on-site disposal, respectively. Since the design life of on-site disposal equipment is about ten years, the cumulative NPV of the first ten years is the main concern. For on-site disposal, the area between the best and worst NPV curves is the “possible domain”, which means all possible situations of the universities’ cost input of selecting on-site disposal under the influence of different equipment prices, market maturity, etc.
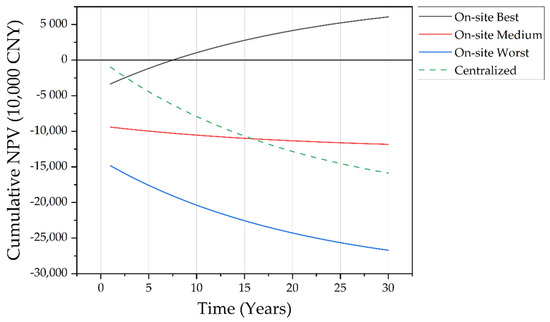
Figure 6.
The cumulative NPVs of cost input on centralized and on-site wet waste disposal. The discount rate used in the calculation is 4.9%, which is an interest rate for loans of more than five years from the People’s Bank of China. According to the fieldwork, the charge of centralized disposal paid by the universities is usually 54 CNY per bucket (240 L) which is about 0.225 CNY per kilogram wet waste, the charge is assumed to be constant in the calculation.
In the most advantageous scenario, if the universities all select the on-site disposal, the cost input in the first two years is not as ideal as the centralized disposal, but from the third year, the on-site disposal will be more economical than the centralized disposal. By the eighth year, it is possible to “recoup” from the benefits of re-utilized fertilizer, and this time point is at the end of the life of most on-site disposal equipment.
The cumulative NPV of on-site disposal in the medium scenario tends not to change greatly over time, which means that the benefits from the re-utilized fertilizer can offset a large part of the continuous operational costs. Under the circumstances, on-site disposal is equal to centralized disposal in cumulative NPV after sixteen years, but this length of time is well beyond the working life of most on-site disposal equipment.
It is obvious that, for the universities as a whole, over a ten-year evaluation period, whether the on-site disposal is superior to the centralized disposal in terms of cost input depends on whether the overall operation situation is in the upper part of the “possible domain”. If the universities cannot achieve excellent cost control in the phase of fixed assets increase and continuous operation, it would be a safer option to select the centralized disposal mode.
4.3. Comprehensive Evaluation of Centralized and On-Site Disposal Mode
Based on the fieldwork and subjective judgment, the pairwise comparison matrix of the five main factors including GHG emissions control (GHGEC), economy, stability, education and innovation (EI), and bargaining power for municipal sanitation departments (BPMSD) is shown in Figure 7. The importance of each factor compared to another factor can be introduced by the AHP scale, for example, GHGEC is as important as EI, while GHGEC is slightly more important than BPMSD.
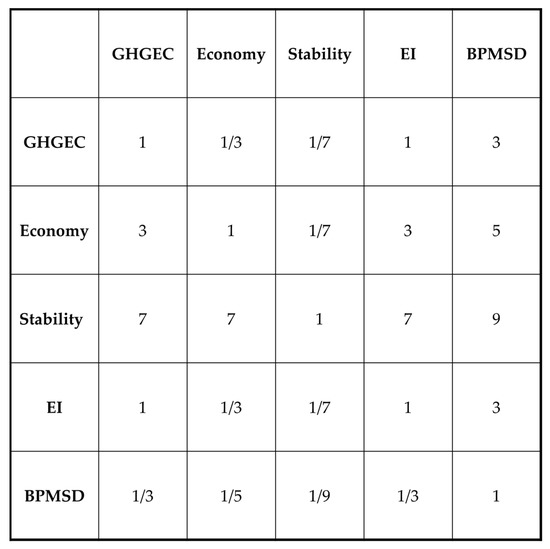
Figure 7.
The pairwise comparison matrix of the five main factors.
The consistency of the pairwise comparison matrix is checked, CR = 0.0539 < 0.1, thus the results of factor importance are reliable.
Table 5 shows the weight of each main factor and the corresponding priority sorted by the weight. The weights of the factors of GHGEC, economy, stability, EI, and BPMSD are 0.6005, 0.0871, 0.1860, 0.0393, and 0.0871, respectively. The priority sorting indicates that, for the universities, the overall importance of the five main factors influencing the selection of waste wet disposal mode in descending order is: GHGEC > stability > economy = BPMSD > EI.
Table 5.
The weight and priority of each main factor.
The fuzzy comprehensive evaluation matrixes of the two disposal modes are shown in Figure 8. The membership for each factor in FCE is based on the following:
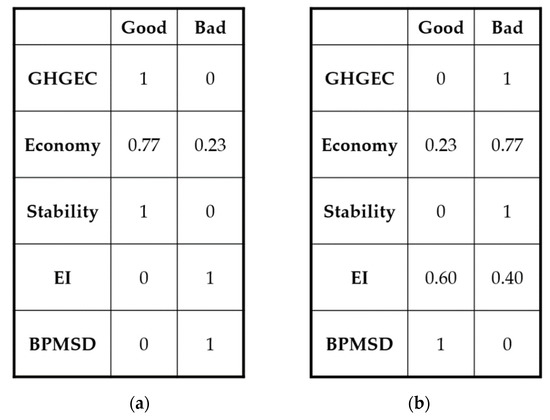
Figure 8.
The fuzzy comprehensive evaluation matrix of (a) centralized disposal mode and (b) on-site disposal mod.
- For GHGEC, according to the previous accounting and analysis, centralized disposal has significant advantages over on-site disposal. Therefore, the memberships of centralized mode to “Good” and “Bad” are 1 and 0, respectively. The memberships of on-site disposal to “Good” and “Bad” are 0 and 1, respectively;
- For economy, according to the previous cumulative NPV results, with a ten-year operational period, the score is determined by the ratio of the area between the centralized disposal curve and the best on-site disposal curve in “possible domain” to the area of the whole “possible domain”. Based on the calculation, the memberships of centralized mode to “Good” and “Bad” are 0.77 and 0.23, respectively. The memberships of on-site disposal to “Good” and “Bad” are 0.23 and 0.77, respectively;
- For stability, according to the fieldwork, a large amount of the on-site disposal equipment was not available due to failure, which accounted for 37.5% of all equipment. In this case, the universities have no choice but to call the municipal sanitation department for transferring disposal. However, centralized disposal relies on large-scale disposal plants which hardly fail to operate for some reason. Hence, centralized disposal has significant advantages over on-site disposal. The memberships of centralized mode to “Good” and “Bad” are 1 and 0, respectively. The memberships of on-site disposal to “Good” and “Bad” are 0 and 1, respectively;
- For the EI, according to the fieldwork, universities believe that on-site disposal has a good value of environmental education and innovative construction of an environmentally friendly society. Besides, although on-site disposal shows a high potential for GHG emissions and the high possibility of cost input, it can continue to play an educational role as a negative example. Compared with on-site disposal, centralized disposal has no obvious function of education and innovation. Therefore, the memberships of centralized mode to “Good” and “Bad” are 0 and 1, respectively. The memberships of on-site disposal to “Good” and “Bad” are given 0.60 and 0.40, respectively;
- For BPMSD, only by selecting on-site disposal can universities have additional bargaining power for municipal sanitation department, so on-site disposal has significant advantages over centralized disposal. Therefore, the memberships of centralized mode to “Good” and “Bad” are 1 and 0, respectively. The memberships of on-site disposal to “Good” and “Bad” are 0 and 1, respectively.
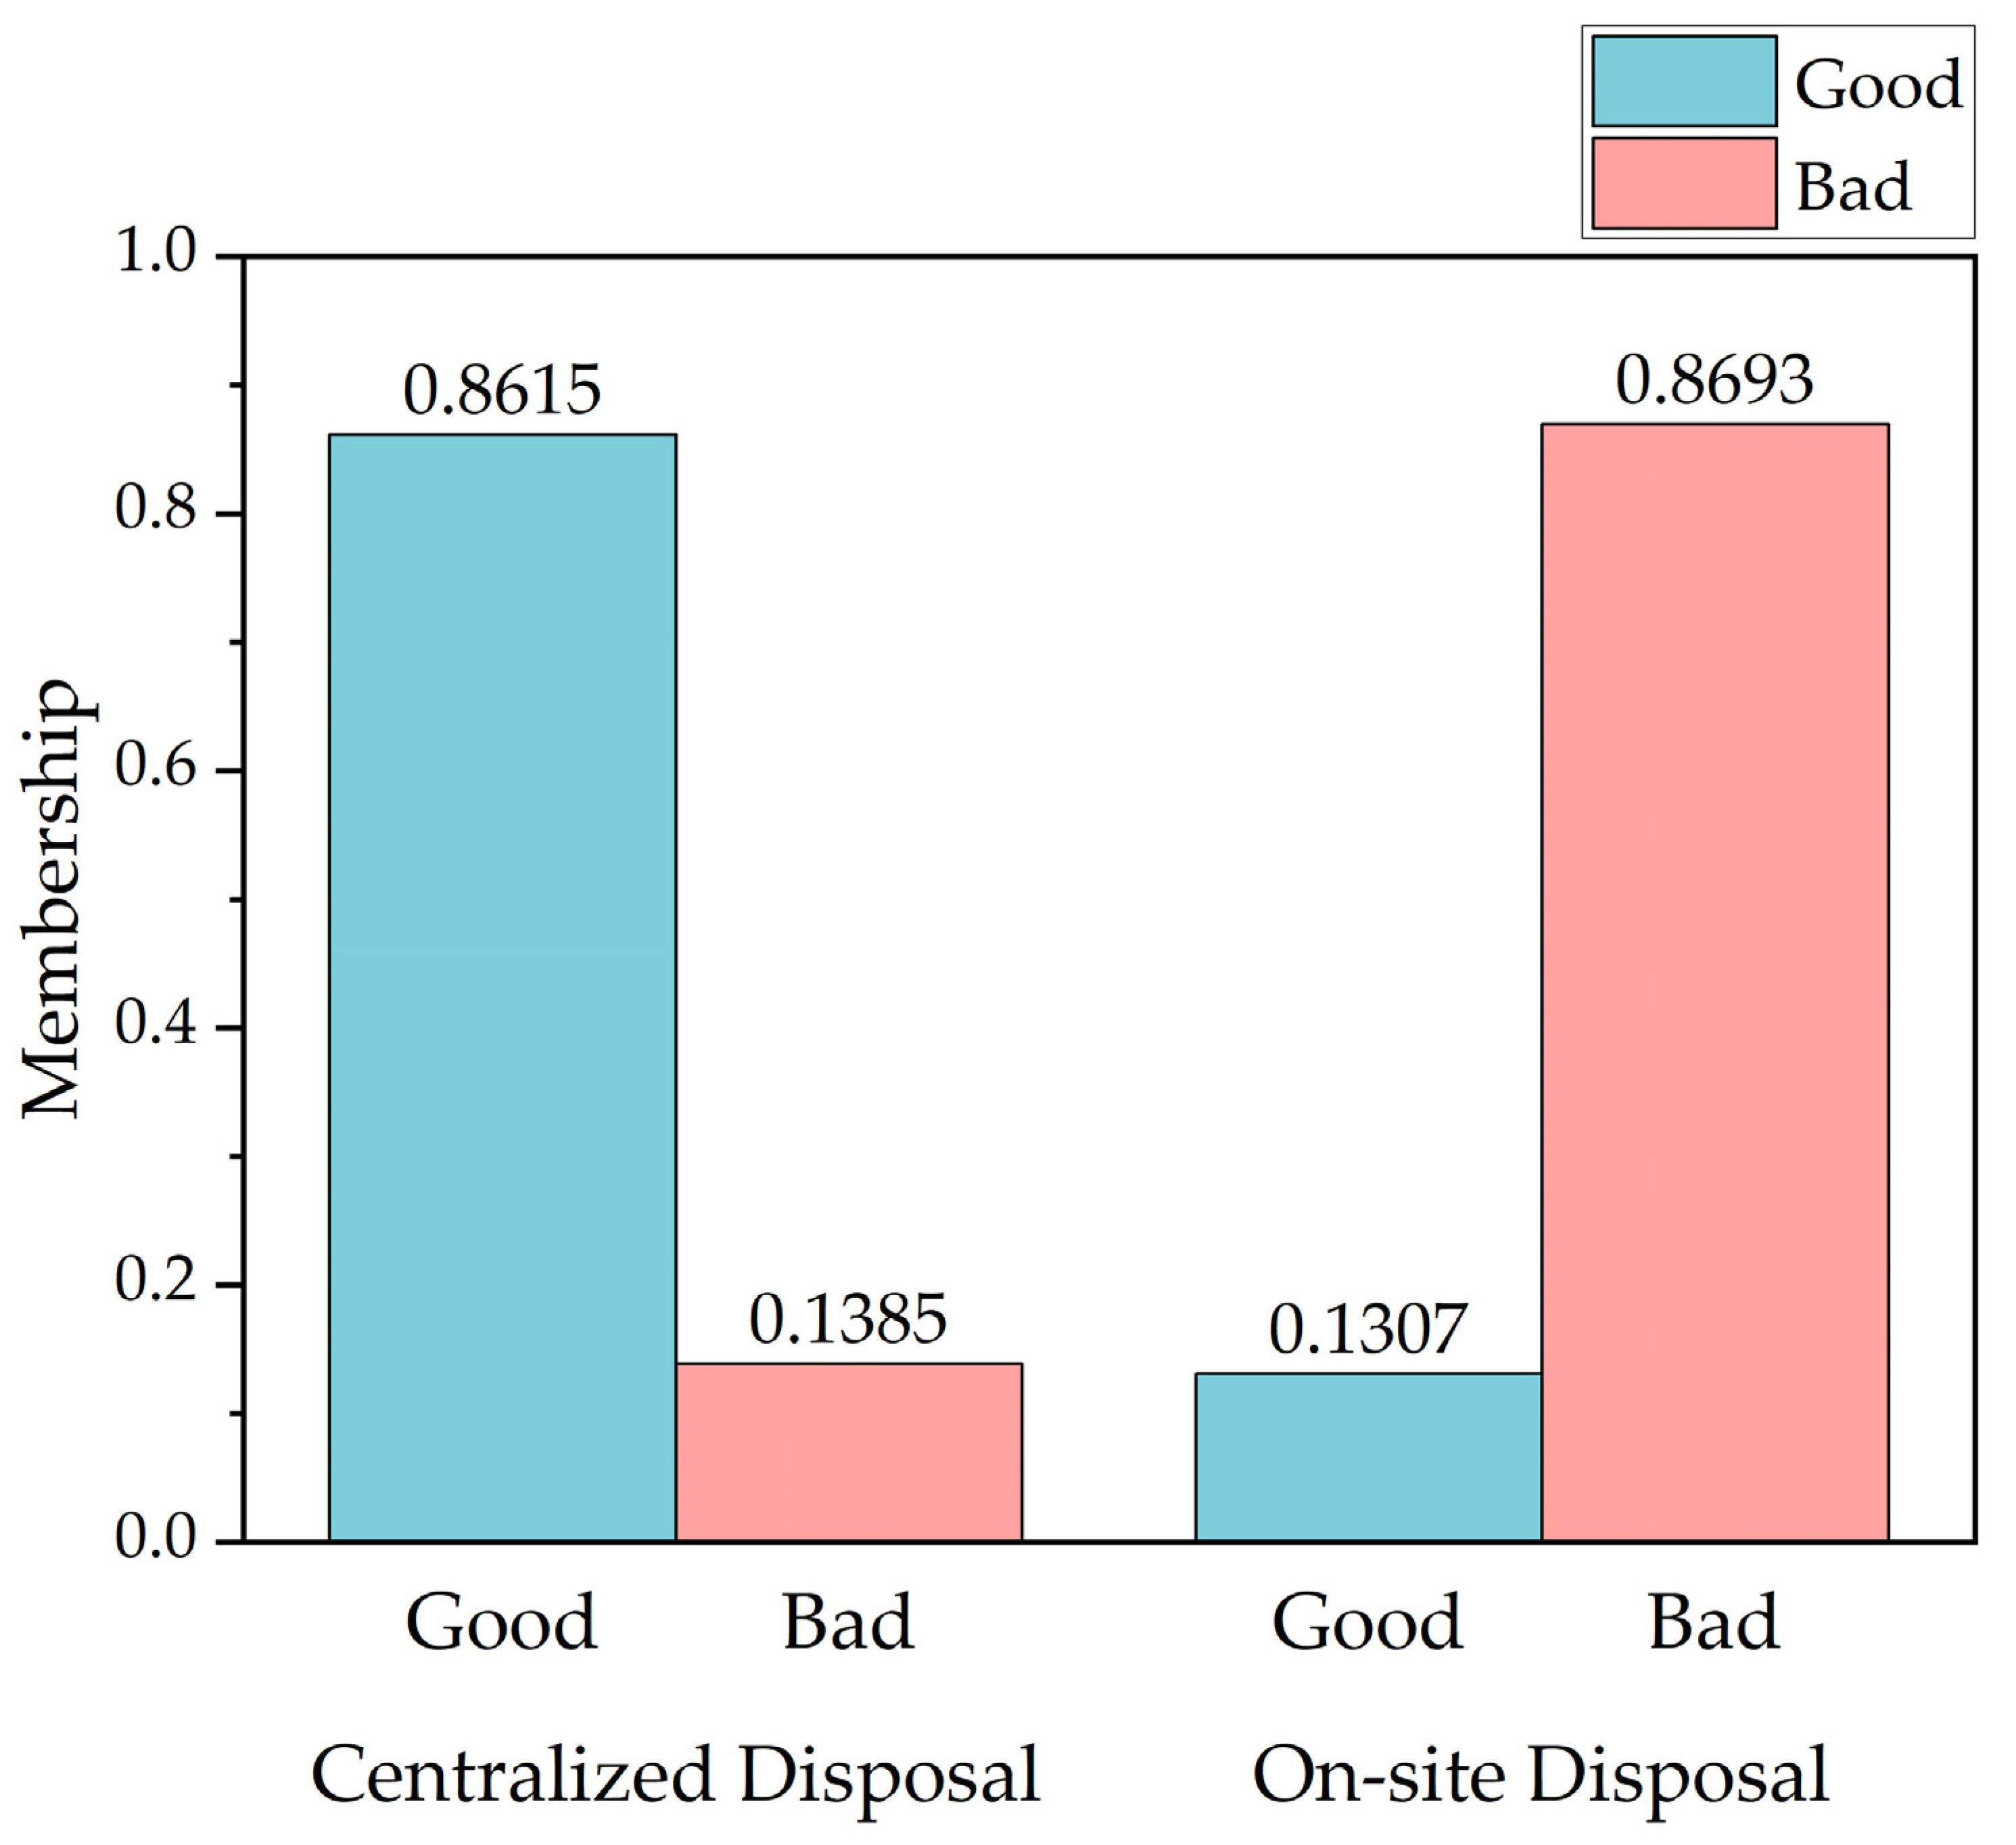
Figure 9 shows the final evaluation results (final memberships) after the combination of the fuzzy comprehensive evaluation matrix and the weight of each main factor. The final memberships of centralized disposal mode to “Good” and “Bad” are 0.8615 and 0.1385, respectively. The final memberships of on-site disposal mode to “Good” and “Bad” are 0.1307 and 0.8693, respectively. Therefore, the final evaluation result of centralized disposal belongs to “Good” and the final evaluation result of on-site disposal belongs to “Bad”. This indicates that the centralized disposal mode of wet waste is a more rational choice.

Figure 9.
The final membership to the evaluation-result of the centralized disposal and on-site disposal of wet waste.
5. Discussion and Conclusions
The GHG emission intensity and economy of centralized and on-site wet waste disposal modes are examined in this paper. Furthermore, a comprehensive evaluation for the two-modes selection was conducted. The discussions and conclusions are as follows:
The centralized waste wet disposal mode is much better than the on-site one in terms of GHG emission reduction. This can be interpreted in two ways. First, the centralized disposal mode is supported by mature technology and sound management, which maintains not only a high upper limit for the ability to control GHG emissions, but also a high lower limit for that. This inference is supported by other research [20,42,46]. Second, the aerobic composting used by the on-site disposal mode is a technology with naturally high GHG emission potential, since even the on-site disposal in the best scenario cannot achieve a positive net GHG emission value. Furthermore, the CH4 and N2O emissions of the on-site disposal in the worst situation are nearly nine times larger than that in the best situation. This may be caused by the different levels of anti-GHG-escaping measures, which have been observed in the fieldwork, and by the negligence of staff in GHG escaping control such as piling up the compost at will, which has also been observed. Thus, it is necessary for the existing on-site disposal projects to strengthen the control of GHG escape to prevent the aerobic composting facilities from becoming the “lighthouse of GHG emission”.
From the perspective of cost control, it is a more secure way for social entities to select the centralized disposal operated and supported by the municipal sanitation department. Within a ten-year time span, although the centralized disposal cannot return the capital, its total cost input is less than that of on-site disposal in most cases. However, once the municipal sanitation department raises the disposal charge, the outcome may be changed a lot. This is possible since municipal finance has been impacted by the COVID-19 pandemic and the fiscal-taxation change, while recently the proposal of a universal charging system for household waste disposal has been widely discussed. Additionally, for on-site disposal without subsidies, equipment and re-utilized product price accounts for a significant influence on the total cost input. The combination of a low equipment price and a high re-utilized fertilizer price may make the wet waste disposal profitable. However, to meet the two conditions is a big challenge for the social entities since it depends on not only the inherent elements such as the bargaining power, but also on external opportunities such as the maturity of the re-utilized product market. Moreover, according to Shanghai’s administration, when wet waste is disposed of by the centralized mode, most of the incineration ash or residues are landfilled for an economic reason. Although researchers are always trying to develop technologies for re-utilizing incineration residues such as making building materials, for now landfill is still the most economical and efficient option for the administration. Thus, it is necessary to acknowledge that re-ultized fertilizer from on-site disposal has more circular-economy value than incineration residues from centralized disposal. It also means that there is a waste of end product for centralized disposal, which could be a potential optimization perspective for revenue in the future.
This study suggests that the centralized disposal is a more rational choice than the on-site disposal when multiple factors are considered. Compared to the on-site disposal, the centralized disposal has higher memberships to all three most important factors including GHG emission control, stability, and economy. These three factors can be regarded as universal factors, then be applied to all kinds of social entities. Thus, even though the study focuses on the universities, the superiority of centralized disposal is widely applicable. Additionally, the weight priority order implies that, on the premise of satisfying the demand of wet waste disposal, the GHG emission intensity and the stable performance of disposal function should be prioritized, while the economic factors such as cost input could be slightly less important. However, the comprehensive evaluation for the two disposal modes was limited by the absence of a systematic survey and more evaluation-results. Further research could be conducted based on a more detailed survey and a multi-evaluation-result set.
The combination of on-site wet waste disposal and anaerobic digestion in Chinese cities may be a topic worth studying, although there is no real case of the combination in Shanghai. Anaerobic digestion has the advantage of lowering GHG emissions, while on-site disposal has the advantage of being quick to deploy, thus the combination of both may facilitate the wet waste disposal after household waste classification. In China, there was a short-lived trend that small-scale anaerobic digestion projects were deployed in rural areas [47,48,49,50], but not in cities. Due to the relatively high technical threshold, the small-scale equipment of anaerobic digestion is mainly imported from abroad, and the local suppliers are few in the market [51]. However, there are many cases of small-scale anaerobic digestion for on-site wet waste disposal in the cities of developed countries [52,53,54]; these suggest that the combination of on-site wet waste disposal and anaerobic digestion may be possible in Chinese cities. Therefore, further research could focus on the technology development of small-scale anaerobic digestion for wet waste disposal, while dealing with the potential coordination problem with municipal management, for the better disposal of wet waste in Chinese cities. There is another key finding of this paper, that is, the synergy of wet waste disposal policies should be strengthened. A good environmental management policy usually has strong synergy, which deals with two or more issues. However, although the on-site disposal is an efficient way to re-utilize resources, it will likely exacerbate the GHG emissions. The adoption of centralized disposal is beneficial to the goals of Carbon Peak and Carbon Neutrality, it neither meets the disposal demand in a short time due to the long construction period, nor promotes innovation and public participation in the construction of ecological civilization. Therefore, considering there are still several years before the time limit to Carbon Peak, a disposal system, where the centralized projects are completed as quickly as possible and the on-site projects are deployed as half-way solutions, might be advisable. Due to the complexity of the wet waste disposal issue, the academic community and policy-making departments are suggested to pay more attention to the integration of system design, industrial development, and other aspects related to wet waste disposal.
Author Contributions
Conceptualization, J.Z. and Z.Z.; methodology, J.Z.; software, J.Z.; validation, J.Z. and Z.Z.; formal analysis, J.Z.; investigation, J.Z. and Z.Z.; resources, J.Z. and Z.Z.; data curation, J.Z.; writing—original draft preparation, J.Z.; writing—review and editing, J.Z. and Z.Z.; visualization, J.Z.; supervision, Z.Z.; project administration, Z.Z.; funding acquisition, Z.Z. All authors have read and agreed to the published version of the manuscript.
Funding
This research received no external funding.
Institutional Review Board Statement
Not applicable.
Informed Consent Statement
Not applicable.
Data Availability Statement
Not applicable.
Acknowledgments
Thanks to Shanghai Municipal Education Commission, Shanghai Landscaping & City Appearance Administrative Bureau, Shanghai Municipal Waste Management Office, and each investigated university for their support.
Conflicts of Interest
The authors declare no conflict of interest.
Appendix A
Table A1.
The overview of wet waste on-site disposal in Shanghai pilot universities.
Table A1.
The overview of wet waste on-site disposal in Shanghai pilot universities.
| University | Campus | Number of Equipment | Number of Equipment in Service | Disposal Capacity (t/d) | One-Time Acquisition Cost (10,000 CNY) | Acquisition Costs of Unit Disposal Capacity [10,000 CNY/(t/d)] | Start Year of Use |
|---|---|---|---|---|---|---|---|
| A | A1 | 3 (Type I) | 0 | 3 | 120 | — | 2015 |
| 1 (Type II) | — | 2 | 60 | ||||
| B | B1 | 1 | 1 | 0.2 | 6.8 | — | 2020 |
| C | C1 | 1 | 1 | 0.3 | 33 | 110 | 2014 |
| D | D1 | 1 | 1 | 1.5 | — | — | 2019 |
| E | E1 | 1 | 1 | 0.5 | 73 | 146 | 2015 |
| F | F1 | 1 | — | 0.5 | In 2020, the market price of a same-brand and same-type equipment with the capacity of 2 t/d is 685,000 CNY. | Not be investigated | |
| G | G1 | 1 | 1 | 0.5 | 38 | 76 | 2018 |
| H | H1 | 1 | 1 | 0.6 | 58 | 96.7 | 2020 |
| I | I1 | 2 | 1 | 0.8 | 38 | — | 2012 |
| J | J1 | 1 | 0 | 1 | — | — | Under construction |
| J2 | 1 | 1 | 0.3 | — | — | 2020 | |
| K | K1 | 1 | 1 | 0.5 | — | — | 2020 |
| K2 | 1 | 0 | 0.5 | — | — | Under construction | |
| L | L1 | 2 | 2 | 0.6 | 60 | 50 | 2018 |
| M | M1 | 1 | 0 | 0.2 | 4.8 | — | 2020 |
| N | N1 | 2 | 1 | 0.84 | — | — | 2012 |
| N2 | 2 | 2 | 0.65 | — | — | — | |
| O | O1 | 1 | 1 | 1.5 | 100+ (estimated) | 66.7 | 2020 |
| O2 | 1 | 0 | 2 | 46 | 23 | ||
| O3 | 1 | 0 | 3 | — | — | ||
Table A2.
The parameters and data used in the calculation of GHG emission (Part 1). The labels “Best” and “Worst” in the table indicate the value corresponding to two emission scenarios which are most advantageous and most disadvantageous to the GHG emission control, respectively (the same below).
Table A2.
The parameters and data used in the calculation of GHG emission (Part 1). The labels “Best” and “Worst” in the table indicate the value corresponding to two emission scenarios which are most advantageous and most disadvantageous to the GHG emission control, respectively (the same below).
| Parameter | Value | Unit | Source | |
|---|---|---|---|---|
| Total wet waste yield | 125,994.23 | kg waste/d | Fieldwork & Calculation | |
| Fuel consumption of transportation vehicle | 0.000125 | L/kg·km | [9,39,55,56] | |
| Average transportation distance | 21.49 | km | Measurement on Gaode Map | |
| Density of diesel fuel | 0.86 | kg/L | [57] | |
| Emission Factor of Diesel | 3.209 | kg CO2/kg diesel | [57] | |
| Factor of crude oil extraction | Best | 0.023 | kg/kg waste | [58] |
| Worst | 0.017 | [59] | ||
| Conversion efficiency of crude oil to biodiesel | 0.85 | [60] | ||
| Density of biodiesel | 0.88 | kg/L | [61] | |
| Heat value of biodiesel | Best | 39,800 | kJ/L | [62] |
| Worst | 33,430 | [61] | ||
| Electricity consumption of pre-treatment | 0.01366 | kWh/kg waste | [58] | |
| Emission factor of electricity | 0.7035 | kg CO2/kWh | [57] | |
| Electricity consumption of anaerobic digestion equipment | Best | 0.027 | kWh/kg waste | [63] |
| Worst | 0.043 | |||
| CH4 emission factor of anaerobic digestion | Best | 0 | kg CH4/kg waste | [21] |
| Worst | 0.002 | |||
| Non-fossil-source CH4 GWP-100 | 27.2 | [21] | ||
| Factor of biogas solid residue generation (undehydrated) | Best | 0.0659 | kg/kg waste | [58] |
| Worst | 0.21 | [42] | ||
| Water content of undehydrated biogas solid residue | 90% | [42,58,64] | ||
| Water content of dehydrated biogas solid residue | 10% | |||
| Electricity consumption of dehydration equipment | 0.0107 | kWh/kg wet biogas residue | [64] | |
| Heat value of dehydrated biogas solid residue | 15,000 | kJ/kg | [65] | |
| Conversion efficiency of heat to electricity | Best | 25% | [9,10] | |
| Worst | 20% | |||
Table A3.
The parameters and data used in the calculation of GHG emission (Part 2).
Table A3.
The parameters and data used in the calculation of GHG emission (Part 2).
| Parameter | Value | Unit | Source | |
|---|---|---|---|---|
| Factor of biogas liquid residue (BLR) generation | Best | 0.00092 | m3/kg waste | [42] |
| Worst | 0.00098 | [9] | ||
| BOD concentration of BLR | Best | - | kg/m3 | |
| Worst | 8.2 | [9] | ||
| COD concentration of BLR | Best | 7.08 | kg/m3 | [66] |
| Worst | - | |||
| General ratio of BOD/COD concentration | 0.45 | Industry experience | ||
| Ratio of Maximum CH4 production in BLR treatment | 0.6 | kg CH4/kg | [21] | |
| Correction factor of CH4 | 0.165 | [67] | ||
| Total nitrogen concentration of BLR | Best | 1.99 | kg/m3 | [9] |
| Worst | 4.78 | [68] | ||
| Emission factor of N2O in nitrogen removal process | Best | 0.005 | kg/kg TN | [67] |
| Worst | 0.035 | [10] | ||
| N2O GWP-100 | 273 | [21] | ||
| Electricity consumption of BLR treatment equipment | Best | 0.13 | kWh/m3 | [69] |
| Worst | 0.3 | [70] | ||
| Factor of dry sludge generation | Best | 1.2 | kg/kg BOD | [70] |
| Worst | 1.34 | [9] | ||
| Factor of chemical PAC addition | 0.05 | kg/kg dry sludge | [9] | |
| Emission factor of chemical PAC | 22.7 | kg CO2/kg PAC | [70] | |
| Factor of chemical PAM addition | Best | 0.003 | kg/kg dry sludge | [9] |
| Worst | 0.007 | |||
| Emission factor of chemical PAM | 1.5 | kg CO2/kg PAM | [70] | |
| Factor of chemical lime addition | Best | 0.1 | kg/kg dry sludge | [71] |
| Worst | 0.3 | [9] | ||
| Emission factor of lime | 0.683 | kg CO2/kg lime | [67] | |
Table A4.
The parameters and data used in the calculation of GHG emission (Part 3).
Table A4.
The parameters and data used in the calculation of GHG emission (Part 3).
| Parameter | Value | Unit | Source | |
|---|---|---|---|---|
| Electricity consumption of sludge drying | Best | 0.035 | kWh/kg | [72] |
| Worst | 0.05 | [71] | ||
| Electricity consumption of dry sludge incineration | Best | 0.275 | kWh/kg | [73] |
| Worst | 0.4 | [71] | ||
| Natural gas consumption of dry sludge incineration | Best | 0.027 | Nm3/kg | [74] |
| Worst | 0.04 | |||
| Emission factor of natural gas | 2.184 | kg CO2/Nm3 | [57] | |
| NaOH consumption of dry sludge incineration | Best | 0.018 | kg/kg dry sludge | [71] |
| Worst | 0.02 | [73] | ||
| Emission factor of NaOH | Best | 1.12 | kg CO2/kg | [75] |
| Worst | 1.17 | [76] | ||
| Ca(OH)2 consumption of dry sludge incineration | 0.00941 | kg/kg dry sludge | [71] | |
| Emission factor of Ca(OH)2 | 0.975 | kg CO2/kg | [76] | |
| Heat value of dry sludge | Best | 13,700 | kJ/kg | [76] |
| Worst | 12,000 | [77] | ||
| CH4 emission factor of dry sludge incineration | Best | 0 | kg/kg dry sludge | [21] |
| Worst | 0.00000485 | |||
| N2O emission factor of dry sludge incineration | Best | 0.00045 | kg/kg dry sludge | [21] |
| Worst | 0.00099 | |||
| Factor of biogas generation | Best | 0.11 | m3/kg waste | [42] |
| Worst | 0.072 | [39] | ||
| Rate of biogas leakage | 5% | Industry experience | ||
| Percentage of CH4 in biogas | 60% | Industry experience | ||
| Density of CH4 (normal temperature and pressure) | 1.9763 | kg/m3 | [78] | |
| Heat value of CH4 | 35,900 | kJ/m3 | [79] | |
| Conversion efficiency of CH4 to electricity | 80% | [16] | ||
Table A5.
The parameters and data used in the calculation of GHG emission (Part 4).
Table A5.
The parameters and data used in the calculation of GHG emission (Part 4).
| Parameter | Value | Unit | Source | |
|---|---|---|---|---|
| Electricity consumption of aerobic composting equipment | Best | 0.05 | kWh/kg waste | Fieldwork |
| Worst | 0.2 | |||
| CH4 Emission factor of aerobic composting | Best | 0 | kg/kg waste | [21] |
| Worst | 0.004 | |||
| N2O Emission factor of aerobic composting | Best | 0 | kg/kg waste | [21] |
| Worst | 0.00024 | |||
| Percentage of organic component in wet waste | 88.60% | [10] | ||
| Factor of re-utilized fertilizer generation | Best | 0.3 | Fieldwork | |
| Worst | 0.03 | |||
| Mass ratio of nitrogen in re-utilized fertilizer | Best | 0.0308 | [10] | |
| Worst | 0.014 | [80] | ||
| Mass ratio of urea to nitrogen | 4.29 | General Standard | ||
| Efficiency of re-utilized fertilizer | Best | 100% | Fieldwork | |
| Worst | 70% | |||
Table A6.
The parameters and data used in the calculation of NPV. The labels “Best”, “Middle”, and “Worst” in this table indicate the value corresponding to three cost-input scenarios which are most advantageous, medium, and most disadvantageous to cost control of on-site disposal, respectively.
Table A6.
The parameters and data used in the calculation of NPV. The labels “Best”, “Middle”, and “Worst” in this table indicate the value corresponding to three cost-input scenarios which are most advantageous, medium, and most disadvantageous to cost control of on-site disposal, respectively.
| Parameter | Value | Unit | Source | |
|---|---|---|---|---|
| Average price of equipment unit disposal capacity | Best | 230 | CNY/kg waste | Fieldwork |
| Middle | 620 | |||
| Worst | 970 | |||
| Construction expense of site and support facilities | Best | 100 | CNY/kg | Fieldwork |
| Middle | 150 | |||
| Worst | 200 | |||
| Comprehensive electricity consumption of disposal capacity per ton | Best | 20,000 | kWh/a | Fieldwork |
| Middle | 25,000 | |||
| Worst | 30,000 | |||
| Price of electricity | 0.641 | CNY/kWh | Shanghai official | |
| Strain and maintenance expense of disposal capacity per ton | Best | 10,000 | CNY/a | Fieldwork |
| Middle | 20,000 | |||
| Worst | 30,000 | |||
| Additional labor salary of disposal capacity per ton | Best | 0 | CNY/m | Fieldwork & Estimation |
| Middle | 1000 | |||
| Worst | 2000 | |||
| Re-utilized fertilizer yield | Best | 33,489.27 | kg fertilizer/d | This study |
| Middle | 18,419.10 | |||
| Worst | 3348.93 | |||
| Average market price of re-utilized fertilizer in operation period | Best | 0.8 | CNY/kg fertilizer | Fieldwork & Estimation |
| Middle | 0.65 | |||
| Worst | 0.57 | |||
| Wet waste charge for municipal sanitation | 0.225 | CNY/kg waste | Fieldwork | |
| Discount rate | 4.9% | People’s Bank of China-Interest rates for loans over five years | ||
References
- Shanghai Landscaping & City Appearance Administrative Bureau. Shanghai Regulations for the Management of Household Waste. Available online: https://lhsr.sh.gov.cn/srhw2/20190219/0039-493B7F9F-3C6E-4F7B-A8CA-37BD5F0CAF96.html (accessed on 10 March 2022).
- Beijing Municipal Commission of Housing and Urban-Rural Development. Beijing Regulations for The Management of Household Waste. Available online: http://zjw.beijing.gov.cn/bjjs/xxgk/fgwj3/fggz/dfxfg50/10965024/index.shtml (accessed on 10 March 2022).
- Zhu, Y. Current Situation and Suggestions of On-Site Disposal of Urban Food Waste A Case Study of Guangzhou. Resour. Econ. Environ. Prot. 2021, 7, 128–130. [Google Scholar]
- Chen, Z.; Zhang, Y.; Ling, F.; Wu, Z.; Wang, Z. Status of Waste Biochemical Processors in Shanghai. Environ. Sanit. Eng. 2014, 22, 33–36, 41. [Google Scholar]
- UNFCCC. Doha Amendment to the Kyoto Protocol; UNFCCC: Rio de Janeiro, Brazil; New York, NY, USA, 2012. [Google Scholar]
- UNFCCC. Kyoto Protocol to the United Nations Framework Convention on Climate Change; UNFCCC: Rio de Janeiro, Brazil; New York, NY, USA, 1998. [Google Scholar]
- Shanghai Landscaping & City Appearance Administrative Bureau. Waste Classification Has Become a “New Fashion” for Shanghai Citizens. Available online: http://www.gov.cn/xinwen/2021-08/19/content_5632255.htm (accessed on 10 March 2022).
- Tim, S.; Richard, W.; Craig, H.; Janet, R.; Emily, M.; Institute, W.R. Creating a Sustainable Food Future: A Menu of Solutions to Feed Nearly 10 Billion People by 2050; World Resource Institute: Washington, DC, USA, 2019. [Google Scholar]
- Chen, S.; Huang, J.; Xiao, T.; Gao, J.; Bai, J.; Luo, W.; Dong, B. Carbon emissions under different domestic waste treatment modes induced by garbage classification: Case study in pilot communities in Shanghai, China. Sci. Total Environ. 2020, 717, 137193. [Google Scholar] [CrossRef] [PubMed]
- Zhan, Y.; Huang, J.; Luo, W.; Dong, B.; Xu, H.; Huang, Y. Full chain carbon footprint analysis of garbage disposal process before and after food waste in-situ reduction treatment in Shanghai pilot communities. Chin. J. Environ. Eng. 2020, 14, 1075–1083. [Google Scholar]
- Ghosh, P.; Shah, G.; Chandra, R.; Sahota, S.; Kumar, H.; Vijay, V.K.; Thakur, I.S. Assessment of methane emissions and energy recovery potential from the municipal solid waste landfills of Delhi, India. Bioresour. Technol. 2018, 272, 611–615. [Google Scholar] [CrossRef]
- Du, M.; Peng, C.; Wang, X.; Chen, H.; Wang, M.; Zhu, Q. Quantification of methane emissions from municipal solid waste landfills in China during the past decade. Renew. Sustain. Energy Rev. 2017, 78, 272–279. [Google Scholar] [CrossRef]
- Liu, Y.; Ni, Z.; Kong, X.; Liu, J. Greenhouse gas emissions from municipal solid waste with a high organic fraction under different management scenarios. J. Clean. Prod. 2017, 147, 451–457. [Google Scholar] [CrossRef]
- Turner, D.A.; Williams, I.D.; Kemp, S. Greenhouse gas emission factors for recycling of source-segregated waste materials. Resour. Conserv. Recycl. 2015, 105, 186–197. [Google Scholar] [CrossRef] [Green Version]
- Chen, Y.-C.; Lo, S.-L. Evaluation of greenhouse gas emissions for several municipal solid waste management strategies. J. Clean. Prod. 2016, 113, 606–612. [Google Scholar] [CrossRef]
- Bian, X.; Gong, H.; Yan, Z.; Wang, K. Comparison of carbon emission estimation among different “collection-disposal” modes for food waste. Chin. J. Environ. Eng. 2019, 13, 449–456. [Google Scholar]
- Bing, X.; de Keizer, M.; Bloemhof-Ruwaard, J.M.; van der Vorst, J.G. Vehicle routing for the eco-efficient collection of household plastic waste. Waste Manag. 2014, 34, 719–729. [Google Scholar] [CrossRef] [PubMed]
- Tavares, G.; Zsigraiova, Z.; Semiao, V.; Carvalho, M. Optimisation of MSW collection routes for minimum fuel consumption using 3D GIS modelling. Waste Manag. 2009, 29, 1176–1185. [Google Scholar] [CrossRef] [PubMed]
- Lv, J.; Dong, H.; Geng, Y.; Li, H. Optimization of recyclable MSW recycling network: A Chinese case of Shanghai. Waste Manag. 2020, 102, 763–772. [Google Scholar] [CrossRef] [PubMed]
- Liu, Y.; Chen, S.; Chen, A.Y.; Lou, Z. Variations of GHG emission patterns from waste disposal processes in megacity Shanghai from 2005 to 2015. J. Clean. Prod. 2021, 295, 126338. [Google Scholar] [CrossRef]
- IPCC (Intergovernmental Panel on Climate Change). Forest Lands. In Intergovernmental Panel on Climate Change Guidelines for National Greenhouse Gas Inventories; Institute for Global Environmental Strategies (IGES): Hayama, Japan, 2006; p. 83. Available online: https://www.ipcc-nggip.iges.or.jp/public/2006gl/ (accessed on 21 November 2021).
- Wang, T. Study on Comprehensive Assessment of Whole Process for Food Waste Anaerobic Digestion. Master’s Thesis, Zhejiang University, Hangzhou, China, 2021. [Google Scholar]
- Chen, Q.; Yang, L.; Wang, S.; Zhao, Q.; Chen, W. Environmental and Economic Analysis on Sanitary Landfill and Incineration of Domestic Waste under BOT Mode. Environ. Sanit. Eng. 2013, 21, 61–64. [Google Scholar]
- He, Z. Economic analysis of large-size garbage disposal in a city. China Resour. Compr. Util. 2017, 35, 50–54. [Google Scholar]
- Jia, H. Incremental Cost-Benefit Analysis of Forced Waste Classification in S City. Master’s Thesis, Jiangsu University of Science and Technology, Zhenjiang, China, 2020. [Google Scholar]
- Xiao, S.; Dong, H.; Geng, Y.; Francisco, M.-J.; Pan, H.; Wu, F. An overview of the municipal solid waste management modes and innovations in Shanghai, China. Environ. Sci. Pollut. Res. 2020, 27, 29943–29953. [Google Scholar] [CrossRef]
- Mayer, F.; Bhandari, R.; Gäth, S.A. Life cycle assessment on the treatment of organic waste streams by anaerobic digestion, hydrothermal carbonization and incineration. Waste Manag. 2021, 130, 93–106. [Google Scholar] [CrossRef]
- Zheng, W.; Chen, Z.; Ma, H.; Gao, B. Analysis on Current Situation and Suggestions of Kitchen Waste In-situ Treatment Technology. Sichuan Environ. 2021, 40, 235–240. [Google Scholar]
- Li, H.; Zhu, J. Review on the research progress of comprehensive evaluation methods. Stat. Decis. 2012, 9, 7–11. [Google Scholar]
- Zhou, Z. Study on the Application of Sustainability Assessment Method Based on Life Cycle Theory in Waste Treatment Technology. Ph.D. Thesis, Zhejiang University, Hangzhou, China, 2020. [Google Scholar]
- Li, D. Fuzzy Comprehensive Evaluation of Different Municipal Solid Waste Treatment Methods. Master’s Thesis, Tsinghua University, Beijing, China, 2014. [Google Scholar]
- Huang, F.; Tao, J. Comprehensive evaluation of disposal method for household refuse by fuzzy mathematics. Environ. Eng. 2000, 3, 54–61. [Google Scholar]
- Zhang, Y.; Huang, D. Evaluation of MSW Disposal Pattern Based on AHP and Fuzzy Methods. Math. Pract. Theory 2014, 44, 55–61. [Google Scholar]
- Wang, X.; Zhang, S.; Liu, L. Fuzzy Comprehensive Evaluation of Water Environmental Carrying Capacity Based on AHP-Entropy Method. Environ. Sci. Technol. 2021, 44, 206–212. [Google Scholar]
- Yu, Z.; Ma, D.; Fan, X.; Wang, J. Research on the Performance Evaluation of PPP Project of Urban Water Environment Treatment Based on AHP and Fuzzy Comprehensive Evaluation. Ecol. Econ. 2020, 36, 190–194. [Google Scholar]
- National Development and Reform Commission. Efforts to Promote the Achievement of Carbon Peaking and Carbon Neutrality Goals. Available online: https://www.ndrc.gov.cn/wsdwhfz/202111/t20211111_1303691.html?code=&state=123 (accessed on 13 April 2022).
- Seo, S.; Aramaki, T.; Hwang, Y.; Hanaki, K. Environmental Impact of Solid Waste Treatment Methods in Korea. J. Environ. Eng. 2004, 130, 81–89. [Google Scholar] [CrossRef]
- Chen, T.-C.; Lin, C.-F. Greenhouse gases emissions from waste management practices using Life Cycle Inventory model. J. Hazard. Mater. 2008, 155, 23–31. [Google Scholar] [CrossRef]
- Yu, Q.; Li, H. Life cycle environmental performance of two restaurant food waste management strategies at Shenzhen, China. J. Mater. Cycles Waste Manag. 2021, 23, 826–839. [Google Scholar] [CrossRef]
- Guo, H.; Zhao, Y.; Damgaard, A.; Wang, Q.; Lu, W.; Wang, H.; Christensen, T.H. Material flow analysis of alternative biorefinery systems for managing Chinese food waste. Resour. Conserv. Recycl. 2019, 149, 197–209. [Google Scholar] [CrossRef]
- Guven, H.; Wang, Z.; Eriksson, O. Evaluation of future food waste management alternatives in Istanbul from the life cycle assessment perspective. J. Clean. Prod. 2019, 239, 117999. [Google Scholar] [CrossRef]
- Li, H.; Zhou, Y.; Liu, J.; Sun, G. Comprehensive comparison and optimal strategies of food waste treatment modes. Chin. J. Environ. Eng. 2021, 15, 2398–2408. [Google Scholar]
- IPCC. 2019 Refinement to the 2006 IPCC Guidelines for National Greenhouse Gas Inventories, Volume 1, General Guidance and Reporting. Available online: https://www.ipcc-nggip.iges.or.jp/public/2006gl/vol1.html (accessed on 21 November 2021).
- Saaty, T.L. Decision-Making with the AHP: Why is the Principal Eigenvector Necessary? Eur. J. Oper. Res. 2001, 145, 85–91. [Google Scholar] [CrossRef]
- Saaty, T.L. How to Make a Decision: The Analytic Hierarchy Process. Eur. J. Oper. Res. 1990, 48, 2–26. [Google Scholar] [CrossRef]
- Lian, H.; Wang, D. Research on the contribution of township waste classification to carbon emission reduction. China Population. Resour. Environ. 2019, 29, 70–78. [Google Scholar]
- Wang, Y.; Fu, L.; Yang, G.; Yuan, C.; Li, M.; Yao, L. Biogas production of rural organic wastes during anaerobic digestion. J. Agro-Environ. Sci. 2016, 35, 1173–1179. [Google Scholar] [CrossRef]
- Yang, T.; Li, Y.; Gao, J.; Huang, C.; Chen, B.; Zhang, L.; Wang, X.; Zhao, Y.; Xi, B.; Li, X. Performance of dry anaerobic technology in the co-digestion of rural organic solid wastes in China. Energy 2015, 93, 2497–2502. [Google Scholar] [CrossRef]
- Fu, Y.; Luo, T.; Mei, Z.; Li, J.; Qiu, K.; Ge, Y. Dry Anaerobic Digestion Technologies for Agricultural Straw and Acceptability in China. Sustainability 2018, 10, 4588. [Google Scholar] [CrossRef] [Green Version]
- Li, Z.; Qin, X.; Li, G.; Zhong, W.; Liu, C.; Li, N.; Chen, X.; Yang, J. Classified collecting and sorting disposal of rural solid waste. Environ. Eng. 2014, 32, 85–88. [Google Scholar] [CrossRef]
- Lü, F.; Zhang, H.; Hao, L.; Shao, L.; He, P. Analysis on the Treatment Technology of Organic Fraction of Municipal Solid Waste in the Neighborhood or On-Site. Environ. Sanit. Eng. 2020, 28, 1–7. [Google Scholar]
- Auer, A.; Burgt, N.H.V.; Abram, F.; Barry, G.; Fenton, O.; Markey, B.K.; Nolan, S.; Richards, K.; Bolton, D.; De Waal, T.; et al. Agricultural anaerobic digestion power plants in Ireland and Germany: Policy and practice. J. Sci. Food Agric. 2016, 97, 719–723. [Google Scholar] [CrossRef]
- O’Connor, S.; Ehimen, E.; Pillai, S.; Black, A.; Tormey, D.; Bartlett, J. Biogas production from small-scale anaerobic digestion plants on European farms. Renew. Sustain. Energy Rev. 2021, 139, 110580. [Google Scholar] [CrossRef]
- Walker, M.; Theaker, H.; Yaman, R.; Poggio, D.; Nimmo, W.; Bywater, A.; Blanch, G.; Pourkashanian, M. Assessment of micro-scale anaerobic digestion for management of urban organic waste: A case study in London, UK. Waste Manag. 2017, 61, 258–268. [Google Scholar] [CrossRef] [PubMed]
- Dong, J.; Ni, M.; Chi, Y.; Zou, D.; Fu, C. Life cycle and economic assessment of source-separated MSW collection with regard to greenhouse gas emissions: A case study in China. Environ. Sci. Pollut. Res. 2013, 20, 5512–5524. [Google Scholar] [CrossRef] [PubMed]
- Huang, W.; Zhang, X. Life cycle assessment of vehicle biogas production for anaerobic fermentation of municipal waste based on hybrid modeling. J. Beijing Jiaotong Univ. 2015, 39, 49–54. [Google Scholar]
- Shanghai Municipal Bureau of Ecology and Environment. Shanghai Municipal Bureau of Ecology and Environment on the Issuance of the “Shanghai Low Carbon Demonstration Creation Work Plan”. Available online: https://sthj.sh.gov.cn/hbzhywpt2025/20210809/84f0532090784cfa953e0b071071ccd3.html (accessed on 9 October 2011).
- Chen, T.; Qiu, X.; Feng, H.; Yin, J.; Shen, D. Solid digestate disposal strategies to reduce the environmental impact and energy consumption of food waste-based biogas systems. Bioresour. Technol. 2021, 325, 124706. [Google Scholar] [CrossRef]
- Zhou, J.-H.; Chen, F. An example of a typical kitchen waste comprehensive treatment project in China. Environ. Eng. 2020, 38, 47–51. [Google Scholar] [CrossRef]
- Wen, Z.; Wang, Y.; De Clercq, D. What is the true value of food waste? A case study of technology integration in urban food waste treatment in Suzhou City, China. J. Clean. Prod. 2016, 118, 88–96. [Google Scholar] [CrossRef]
- Liu, W.; Zhang, W. Physico-chemical indexes and quality standard of biodiesel. Energy Eng. 2006, 1, 7–15. [Google Scholar]
- Sheet, E.A.E. Effect of preheating waste cooking oil on biodiesel production and properties. Energy Sources Part A Recover. Util. Environ. Eff. 2017, 40, 207–213. [Google Scholar] [CrossRef]
- Hao, X.; Zhou, P.; Cao, D. Analyses of disposal methods and carbon emissions of food wastes. Chin. J. Environ. Eng. 2017, 11, 673–682. [Google Scholar]
- Jin, Y.; Chen, T.; Chen, X.; Yu, Z. Life-cycle assessment of energy consumption and environmental impact of an integrated food waste-based biogas plant. Appl. Energy 2015, 151, 227–236. [Google Scholar] [CrossRef]
- Kratzeisen, M.; Starcevic, N.; Martinov, M.; Maurer, C.; Müller, J. Applicability of biogas digestate as solid fuel. Fuel 2010, 89, 2544–2548. [Google Scholar] [CrossRef]
- Yu, Y.; Li, P.; Zhang, J.; Li, J.; Yu, R. Comprehensive insights into the organic fractions on solid–liquid separation performance of anaerobic digestates from food waste. Sci. Total Environ. 2021, 800, 149608. [Google Scholar] [CrossRef] [PubMed]
- National Development and Reform Commission. Guidelines for the Preparation of Provincial Greenhouse Gas Inventories (Trial). Available online: http://www.cbcsd.org.cn/sjk/nengyuan/standard/home/20140113/download/shengjiwenshiqiti.pdf (accessed on 21 October 2011).
- Wang, X.; Wang, W.; Zhou, B.; Xu, M.; Wu, Z.; Liang, J.; Zhou, L. Improving solid–liquid separation performance of anaerobic digestate from food waste by thermally activated persulfate oxidation. J. Hazard. Mater. 2020, 398, 122989. [Google Scholar] [CrossRef] [PubMed]
- Wang, H.; Yang, Y.; Keller, A.A.; Li, X.; Feng, S.; Dong, Y.-N.; Li, F. Comparative analysis of energy intensity and carbon emissions in wastewater treatment in USA, Germany, China and South Africa. Appl. Energy 2016, 184, 873–881. [Google Scholar] [CrossRef] [Green Version]
- Chai, C.; Zhang, D.; Yu, Y.; Feng, Y.; Wong, M.S. Carbon Footprint Analyses of Mainstream Wastewater Treatment Technologies under Different Sludge Treatment Scenarios in China. Water 2015, 7, 918–938. [Google Scholar] [CrossRef]
- Ci, H.; Wang, X.; Dong, B. Carbon Footprint Analysis of Different Sludge Drying and Incineration Processes. Water Purif. Technol. 2021, 40, 72–82, 99. [Google Scholar] [CrossRef]
- Li, H.; Jin, Y.; Li, Y. Carbon Emission and Low-carbon Strategies of Sewage Sludge Treatment. J. Civ. Archit. Environ. Eng. 2011, 33, 117–121. [Google Scholar]
- Xu, C.; Chen, W.; Hong, J. Life-cycle environmental and economic assessment of sewage sludge treatment in China. J. Clean. Prod. 2014, 67, 79–87. [Google Scholar] [CrossRef]
- Hu, W.; Qiu, F.; Lu, J. Influence of Anaerobic Digestion of Sludge on Drying and Incineration in Bailonggang Wastewater Treatment Plant. China Water Wastewater 2019, 35, 32–35. [Google Scholar] [CrossRef]
- City of Winnipeg; VEOLIA. WSTP South End Plant Process Selection Report. Available online: https://www.winnipeg.ca/finance/findata/matmgt/documents/2012/682-2012/682-2012_Appendix_H-WSTP_South_End_Plant_Process_Selection_Report/PSR_rev%20final.pdf (accessed on 12 November 2021).
- Ji, S. Study on Carbon Emission and Optimization Strategy of Sludge Drying and Incineration Process. Environ. Sci. Technol. 2019, 32, 49–53. [Google Scholar] [CrossRef]
- Hao, X.; Chen, Q.; Li, J.; Jiang, H. Ultimate Approach to Handle Excess Sludge: Incineration and Drying. China Water Wastewater 2019, 35, 35–42. [Google Scholar] [CrossRef]
- Gas Encyclopedia. Methane | Gas Encyclopedia Air Liquide. Available online: https://encyclopedia.airliquide.com/methane (accessed on 25 December 2021).
- Thermal-Fluids Central. Heat of Combustion. Available online: http://www.thermalfluidscentral.org/encyclopedia/index.php/Heat_of_Combustion (accessed on 25 December 2021).
- Yang, Y.; Xi, B.; Li, H.; Wei, Z.; Yang, Z.; Zhang, X. Study on the Change of Physicochemical Characteristics of Food Wastes During Aerobic Composting. Res. Environ. Sci. 2007, 20, 72–77. [Google Scholar]


Publisher’s Note: MDPI stays neutral with regard to jurisdictional claims in published maps and institutional affiliations. |
© 2022 by the authors. Licensee MDPI, Basel, Switzerland. This article is an open access article distributed under the terms and conditions of the Creative Commons Attribution (CC BY) license (https://creativecommons.org/licenses/by/4.0/).