Article

Research on the Potential of Forestry’s Carbon-Neutral Contribution in China from 2021 to 2060

1
School of Ecology and Nature Conservation, Beijing Forestry University, Beijing 100083, China
2
School of Agriculture and Food Sciences, The University of Queensland, Brisbane, QLD 4072, Australia
3
Industrial Development Planning Institute, National Forestry and Grassland Administration, Beijing 100013, China
4
China Architecture Design and Research Group, China National Engineering Research Center for Human Settlement, Beijing 100120, China
5
Asia Pacific School of Business Administration, Jilin University of Finance and Economics, Changchun 130117, China
*
Author to whom correspondence should be addressed.
Sustainability 2022, 14(9), 5444; https://doi.org/10.3390/su14095444
Submission received: 17 March 2022 / Revised: 19 April 2022 / Accepted: 27 April 2022 / Published: 30 April 2022

Abstract

:
Forest ecosystems play a crucial role in mitigating climate change. To assess and quantify the specific emissions reduction benefits of forest carbon sequestration, this study used a combination of backpropagation neural networks, biomass conversion factor method, and logistic models to predict the carbon-neutral contribution from existing forests, planned afforestation, and forest tending activities in China from 2021 to 2060. The results showed that (1) the emissions reduction contribution of forestry pathways in China was 7.91% (8588.61 MtCO2) at the carbon peak stage and 8.71% (24,932.73 MtCO2) at the carbon-neutral stage; (2) the southwest was the main contributing region, while the east and north lagged; (3) afforestation activities made the largest emission reduction contribution during the forecast period, while the contribution of existing forests continued to decline; and (4) carbon sequestration contribution by different forest origins was comparable during the carbon peak, while the contribution of plantation forests was expected to surpass that of natural forests during the carbon-neutral period. In order to maximize the benefits of the carbon-neutral pathway of forestry, it is necessary to enhance the policy frameworks related to forestry activities, forestry financial investment systems, and sustainable forest management systems to maximize the potential of this sector. Furthermore, more focus should be placed on reduction sectors to ensure the timely achievement of carbon goals and boost sustainable development in the context of climate change.

1. Introduction

Since the ratification of the Paris Agreement within the United Nations Framework Convention on Climate Change (UNFCCC), the reduction in greenhouse gas emissions has been a major topic of discussion in the countries that signed the agreement and in the international community. Among the many pathways to tackle climate change, nature-based solutions (NbSs), such as forest tending, afforestation, and reforestation, have attracted much attention, as the forests have absorbed about 20% of the CO2 from fossil fuel combustion and industrial activities in the 30 years [1,2]. The total amount of carbon emissions that China produced in the last decade was 101,905.30 million tons (Mt) [3]. As a key member of the UNFCCC, China proposed a carbon neutrality target by 2060 at the 75th UN General Assembly and emphasized the importance of forest ecosystems in reducing emissions [4].
China has the fastest-growing forest area in the world [5]. Over the past few decades, the Chinese government has undertaken several forestry projects that have resulted in an average annual forest growth of 1.94 million hectares (ha) over the period 2010–2020 [5,6]. According to the statistics of the 9th National Forest Inventory (NFI), the existing forest area has reached 220,446,200 ha, with a carbon stock of 9186 Mt [7]. In the context of rapid forestry development, many scholars have used national forest inventory data to forecast the potential of forest carbon stock. The obtained results show that forest carbon stocks will reach between 11,125.76 Terrogram (Tg) of C and 15,841.73 TgC in 2050 (excluding Hong Kong, Macao, and Taiwan) [8,9,10]. However, the results of these projections take into account only the carbon storage generated from existing forests and new plantations but do not include those from forest-tending activities.
According to the National Forest Management Plan (2016–2050) [11], forest-tending activities will be implemented on 271,750,000 ha across the country from 2020 to 2050. Moreover, there has been little discussion regarding the phased model of reducing forestry-driven emissions under China’s dual goals to improve its forest quality and area. It is therefore important to consider the impact of such large-scale forest-tending to properly estimate the future carbon sequestration potential of China’s forest resources. In particular, it is necessary to estimate such contributions in the context of the policy roadmap.
This study combined the method of continuous biomass expansion factor and logistic growth modeling [8,12] in order to predict the carbon sequestration potential of forest resources in different regions and origins across the country. This method can accurately reflect the relationships between above-ground biomass density and forest age compared to other methods and can be applied to estimate carbon storage at the national level [13]. To further investigate the specific contribution of Chinese forest resources in each emissions reduction scenario from 2021 to 2060, a backpropagation (BP) neural network was used to project China’s future CO2 emissions. The BP neural network is one of the most commonly used and mature multilayer feedforward networks trained according to the error backpropagation algorithm [14]. Extensive training is performed to align the output values as close as possible to the desired values through the BP algorithm [15].
In this study, we first predicted the potential for carbon sequestration through afforestation, forest tending, and existing forests in 31 provinces across the country according to the classification of forest stand origins. We then assessed the potential for forest carbon neutrality at different stages in the context of China’s nationally determined contributions (NDC). Finally, based on the research results, strategies for the implementation of carbon-neutral pathways in forestry are discussed, which will provide information about the construction of future carbon-neutral pathways in China.

2. Materials and Methods

2.1. Calculation of Forest Carbon-Neutral Contribution

The forest carbon-neutral contribution is the ratio of carbon sequestration generated by forests to fossil fuel energy emissions. The calculation method is shown in Equation (1):
Z c t b _ y = S C G H G y C F o s s i l _ y
In Equation (1), Z c t b _ y is the contribution of carbon emissions reduction by forests in the yth year, S C G H G y is the carbon sequestration generated by the forest carbon pool in the yth year, and C F o s s i l _ y is the carbon dioxide emissions produced by burning of fossil fuels in the yth year.

2.2. Calculation of China’s Forest Carbon Sequestration Potential

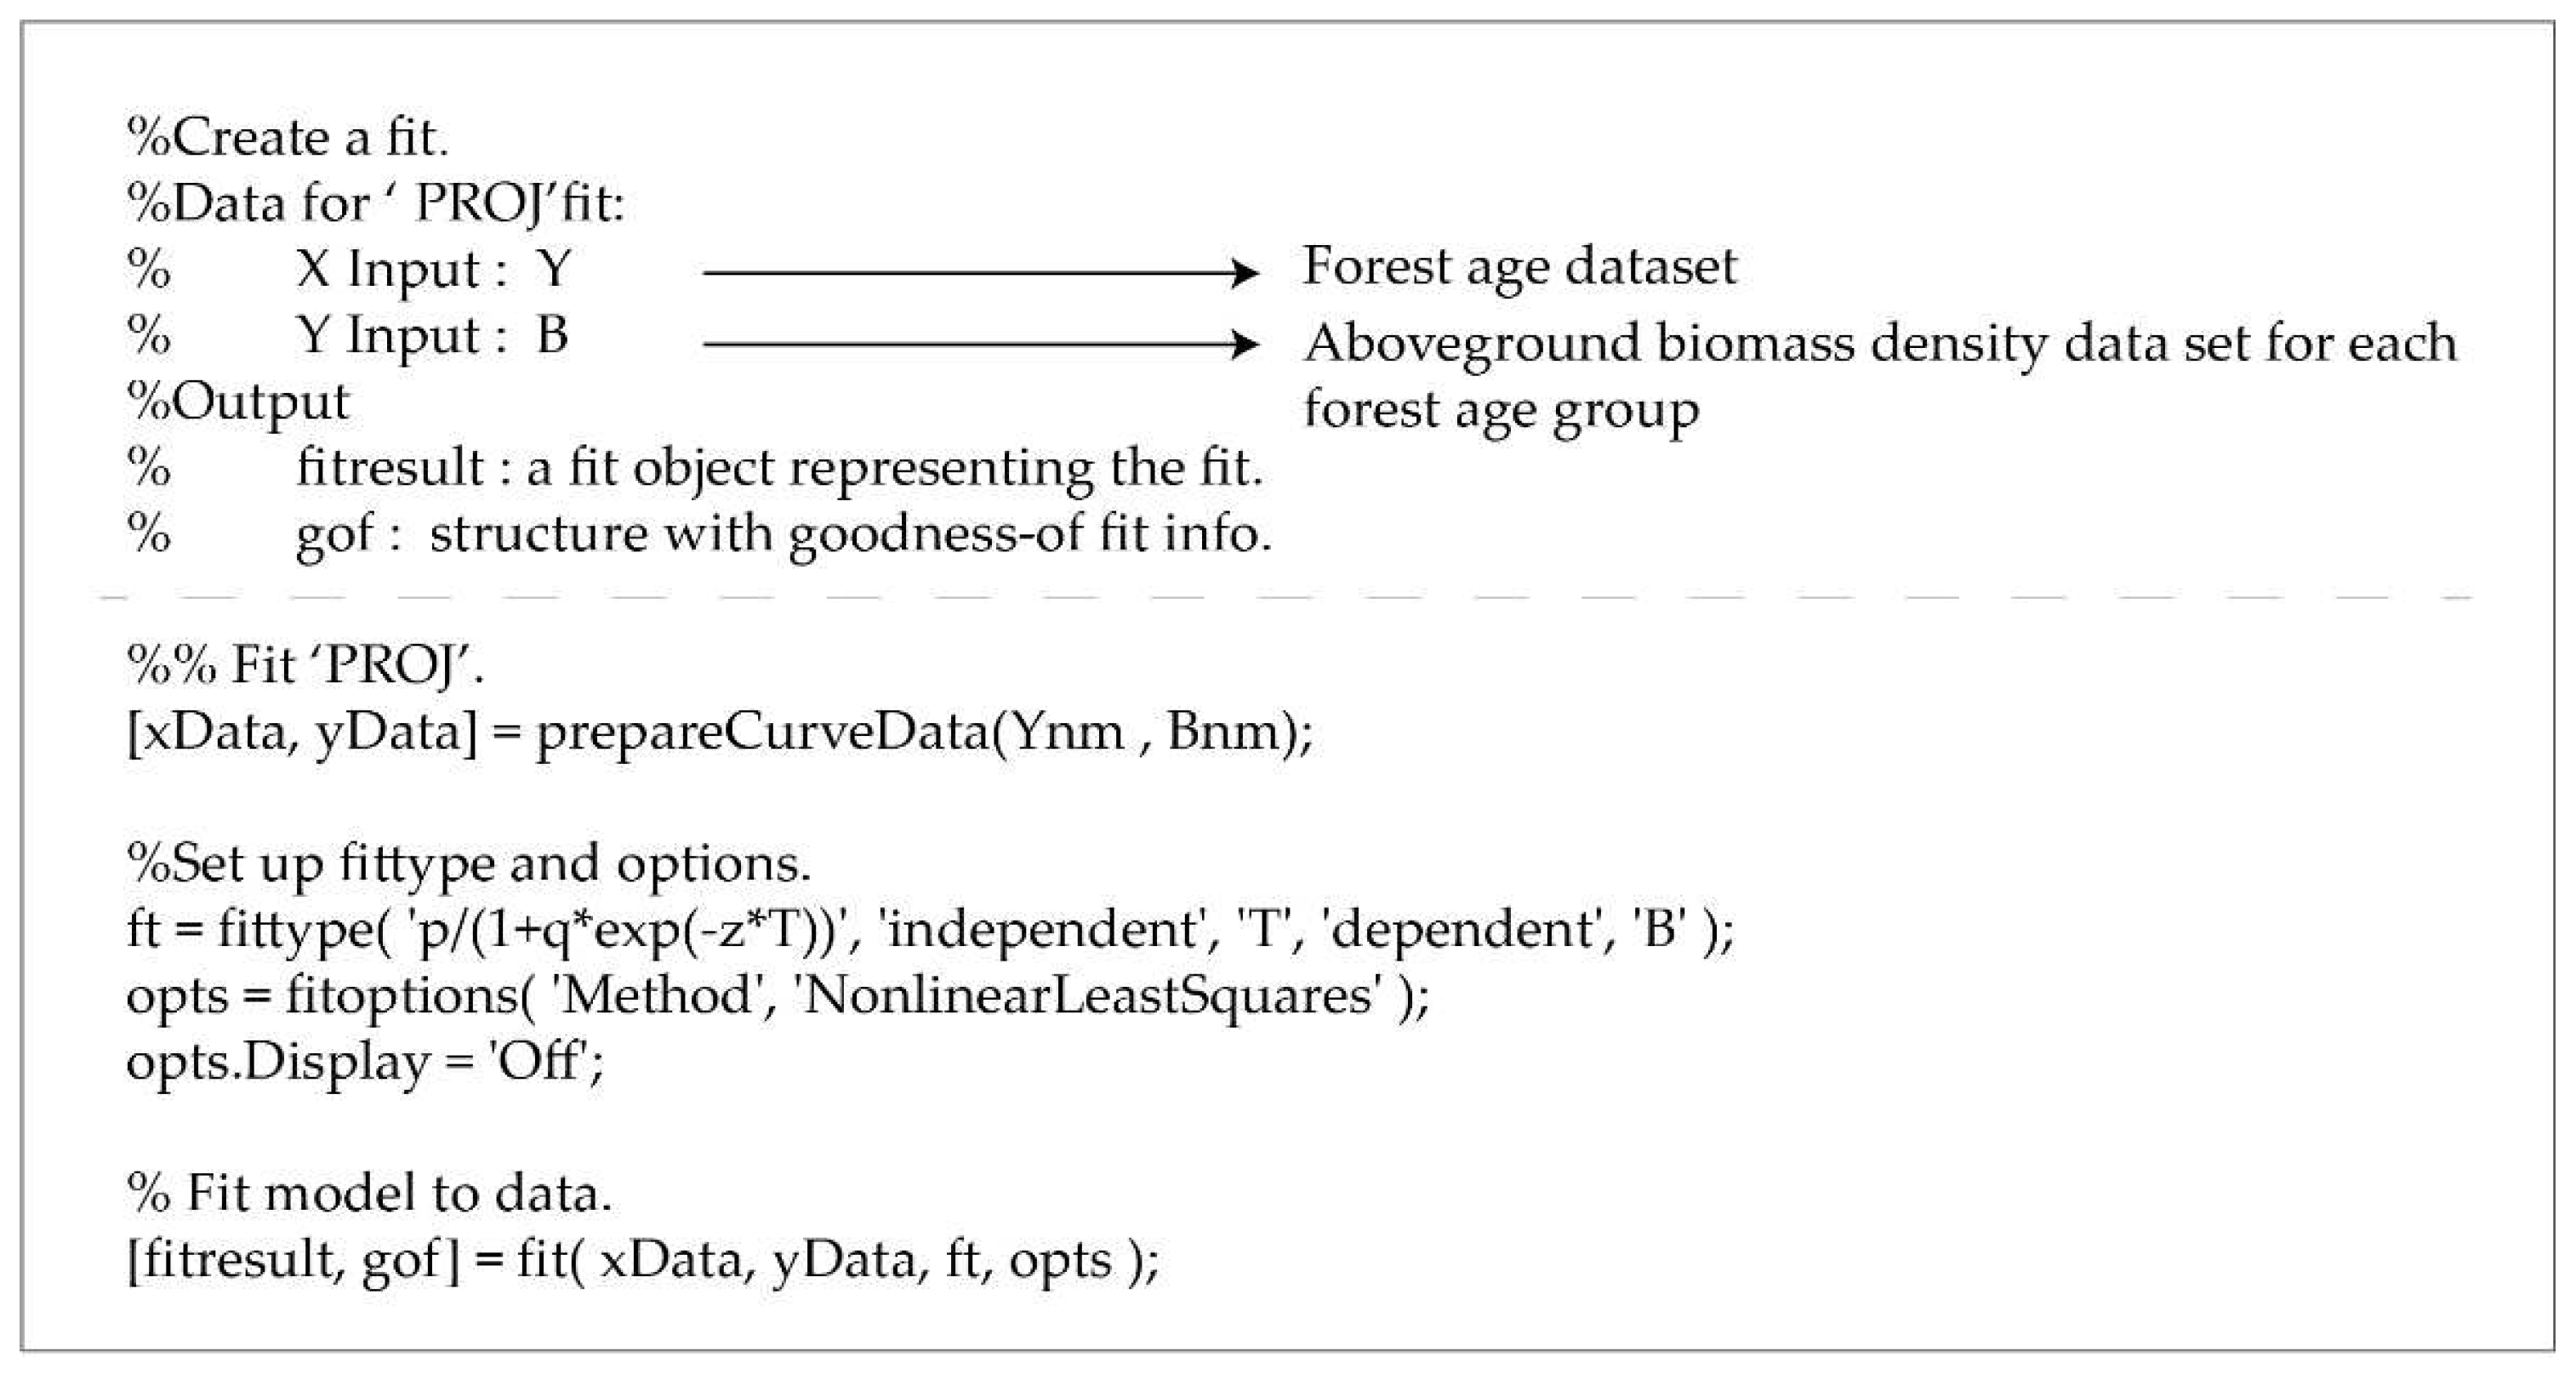
2.2.1. The Relationship between Above-Ground Biomass Density and Stand Age

In this study, the continuous biomass expansion factor method and the logistic growth equation method were used to determine the relationship between the above-ground biomass density and stand age.
First, using the continuous biomass expansion factor method was used to calculate the biomass density of each tree species at each stand age stage (Equation (2)) [12].
B = B E F · x
In Equation (2), BEF is the biomass expansion factor, B is the above-ground biomass density, and x is the stock volume density;
Second, the relationship between the above-ground biomass density and stand age was fitted using the logistic growth equation (Equation (3)) [8], where the fitting process used the curve fitting function of MATLAB 2016b. The specific fitting steps and code are shown in Figure 1.
B = p 1 + q e z y
In Equation (3), B is the above-ground biomass density; p, q, and z are the relationship coefficients between the above-ground biomass density and the stand age; and y is the average value of the stand age group. The ages of the overmature forests are 1.5 times higher than the lower limit.
Finally, the adjusted coefficient of determination ( A d j R 2 ) and root mean squared error (RMSE) were used to evaluate the reliability of the logistic model fitting results, where the method is shown in Equations (4)–(6).
A d j R 2 = 1 1 R 2 n 1 n d 1
R 2 = j = 1 n S j , l S ¯ j , l S j , q S ¯ j , q 2 j = 1 n S j , l S ¯ j , l 2 j = 1 n S j , q S ¯ j , q 2
R M S E = j = 1 n ( S j , q S j , l ) 2 n
In Equations (4)–(6), A d j R 2 refers to the adjusted coefficient of determination, R 2 is the coefficient of determination, and RMSE is the root mean squared error. S j , l , S j , q , S ¯ j , l , and S ¯ j , q are the measured, estimated, average of measured, and estimated maize transpiration, respectively. n is the observation number and d is the feature number.

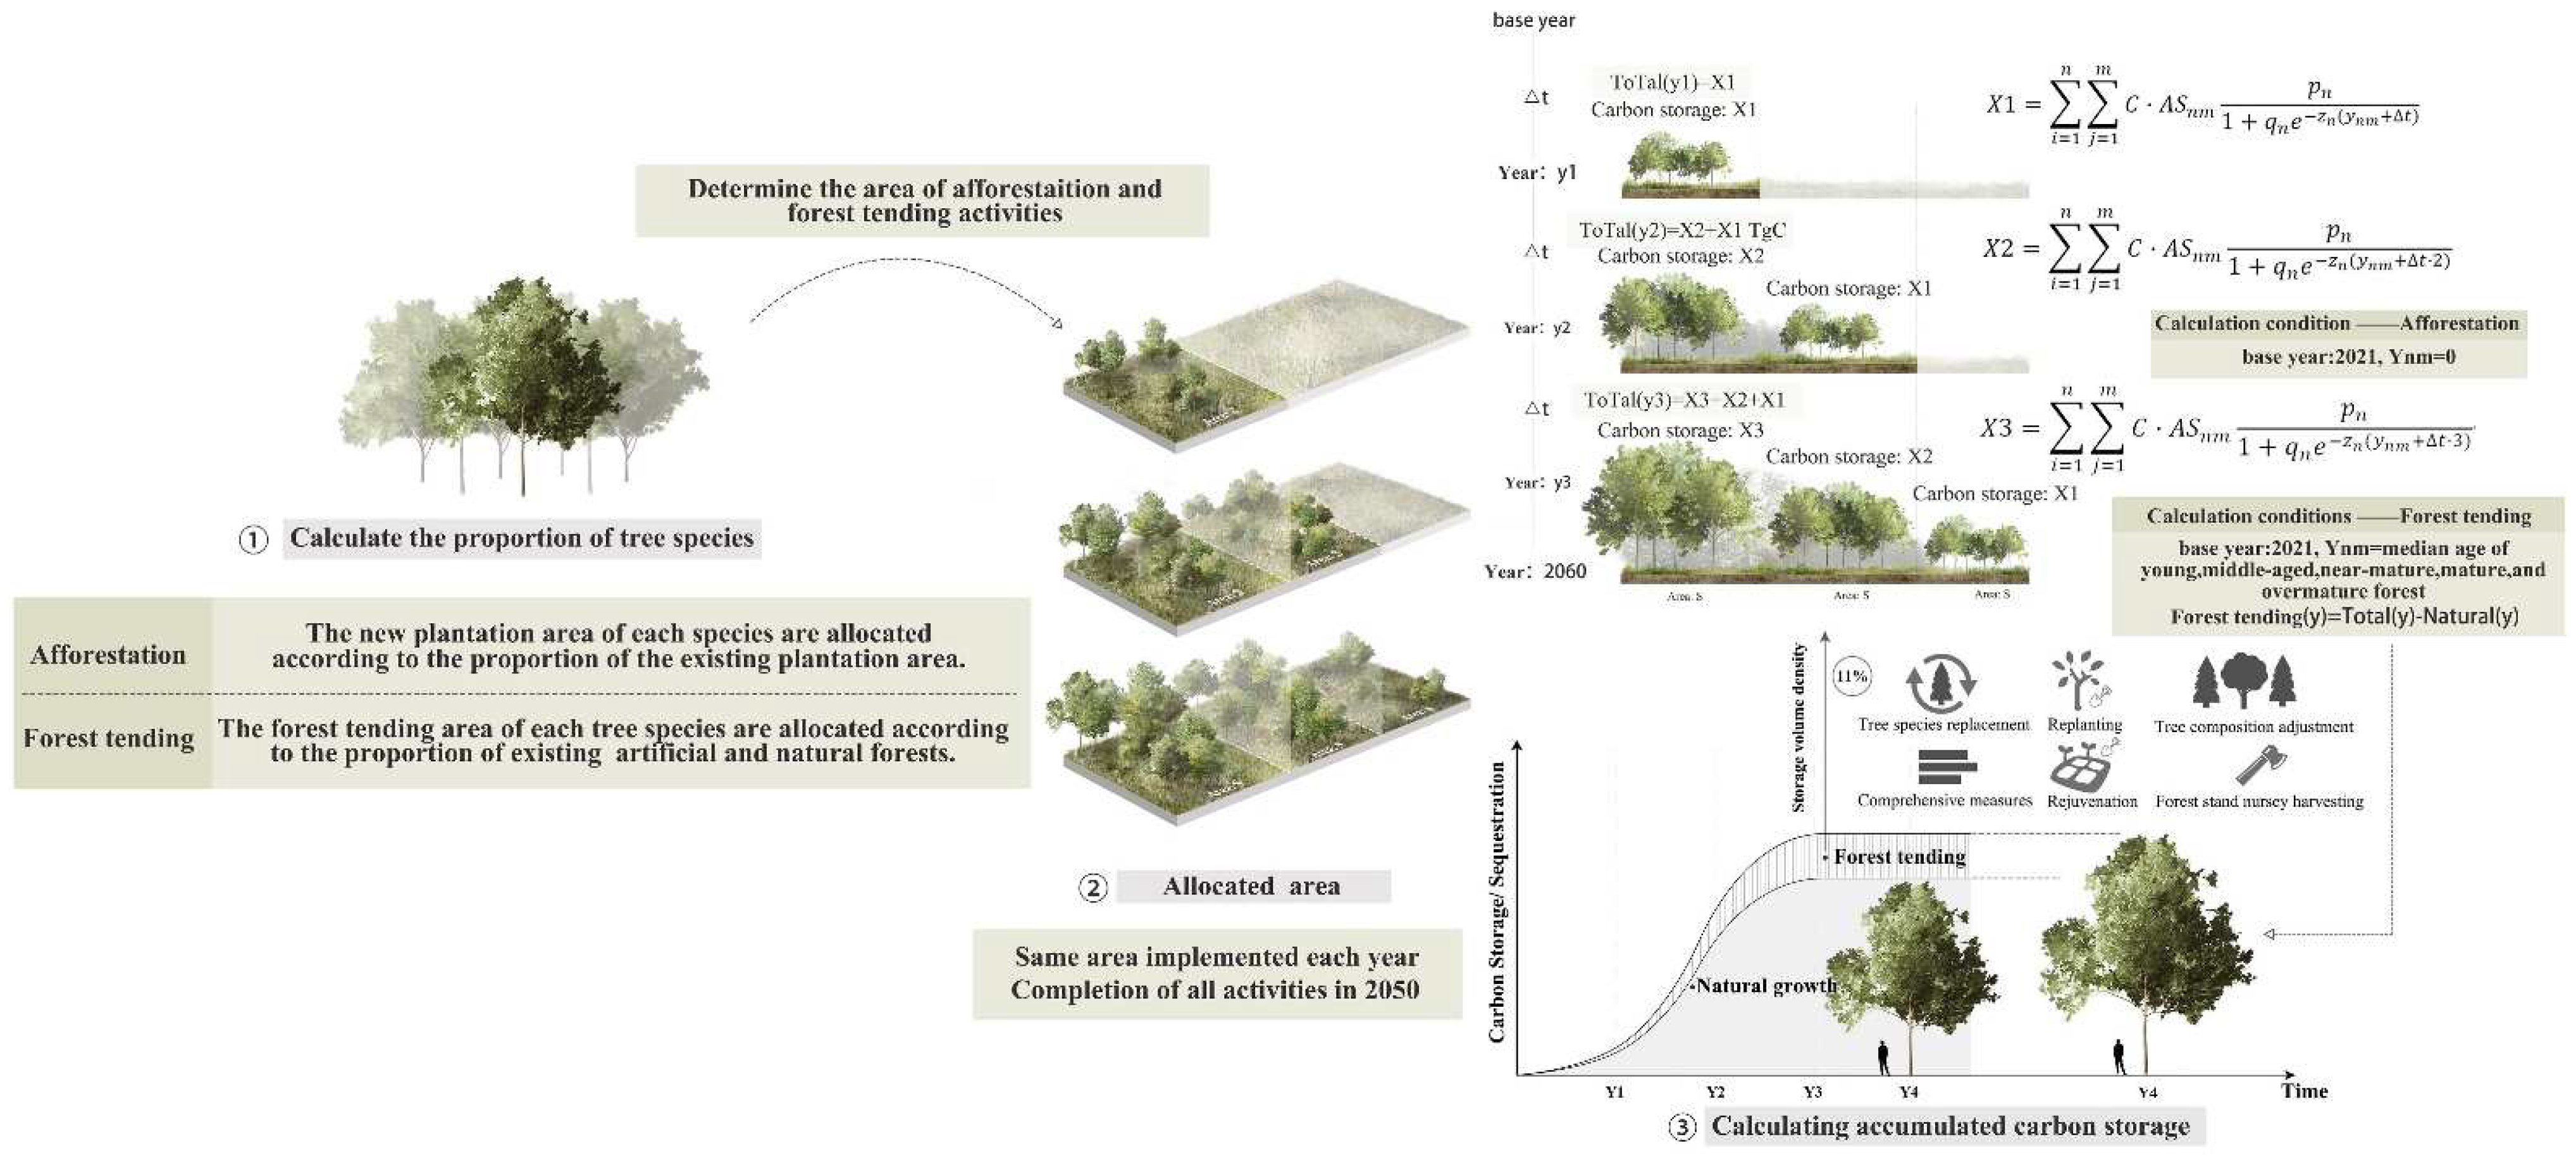
2.2.2. Prediction of Forest Above-Ground Biomass Carbon Pool

After determining the relationship coefficients p, q, and z between the above-ground biomass density and stand age, we used Equation (7) [8] to calculate the future forest above-ground biomass carbon pool.
S C y = i = 1 n j = 1 m C · A S n m · B n m = i = 1 n j = 1 m C · A S n m p n 1 + q n e z n y n m + y
In Equation (7), S C y is the carbon storage produced by forests in the yth year; B is the above-ground biomass density; n and m refer to the tree type and forest age, respectively; A S n m is the area of the mth stand age group in the nth tree type; ynm is the average age of the mth forest age group in the nth forest type; y is the time interval from the forecast year to the base year; and C is the carbon conversion coefficient, which was taken as 0.5 [16] in this study.

2.2.3. Calculation of Forest Carbon Sequestration

After completing the calculation of the forest above-ground biomass carbon pool, we used the carbon storage change method to calculate the carbon sequestration, as shown in Equation (8) [16]:
S C G H G y = S C y 2 S C y 1 T y 2 T y 1 · 44 12 C R e v e r s a l
In Equation (8), S C G H G y is the carbon sequestration generated by the forest carbon pool in the yth year; T y 1 and T y 2 are the years y1 and y2, respectively; 44/12 is the CO2 conversion coefficient; and C R e v e r s a l is the reversal of carbon sequestered caused by human activities and natural disasters. This study assumed that no large-scale deforestation and fire events occur during the forecast period, i.e., C R e v e r s a l is taken as 0; S C y 1 and S C y 2 are the total carbon storage in years y1 and y2, respectively.

2.2.4. Calculation Scenario

For the prediction of the existing forests, this study assumed that the forest area and tree species composition will not change during the forecast period.
For the prediction of the new forest biomass carbon pool, the new afforestation area of each tree species was allocated according to the proportion of the existing planted forest area in each province. For calculation purposes, the afforestation area was assumed to be constant every year during the forecast period. The detailed afforestation pattern is shown in Figure 2.
For the prediction of the forest-tending carbon pool, the forest-tending area of each tree species was allocated according to the proportion of existing planted and natural forests in each province. To facilitate the calculation, this study assumed the same implementation area for each year of the prediction period. In addition, considering that the total biomass carbon pool from forest-tending activities includes both natural growth and human intervention, the calculation should be based on the increase in stocking density. In this study, the calculations were based on the 11% annual increment in stocking density from the National Forest Management Plan [11]. The detailed pattern is shown in Figure 2.

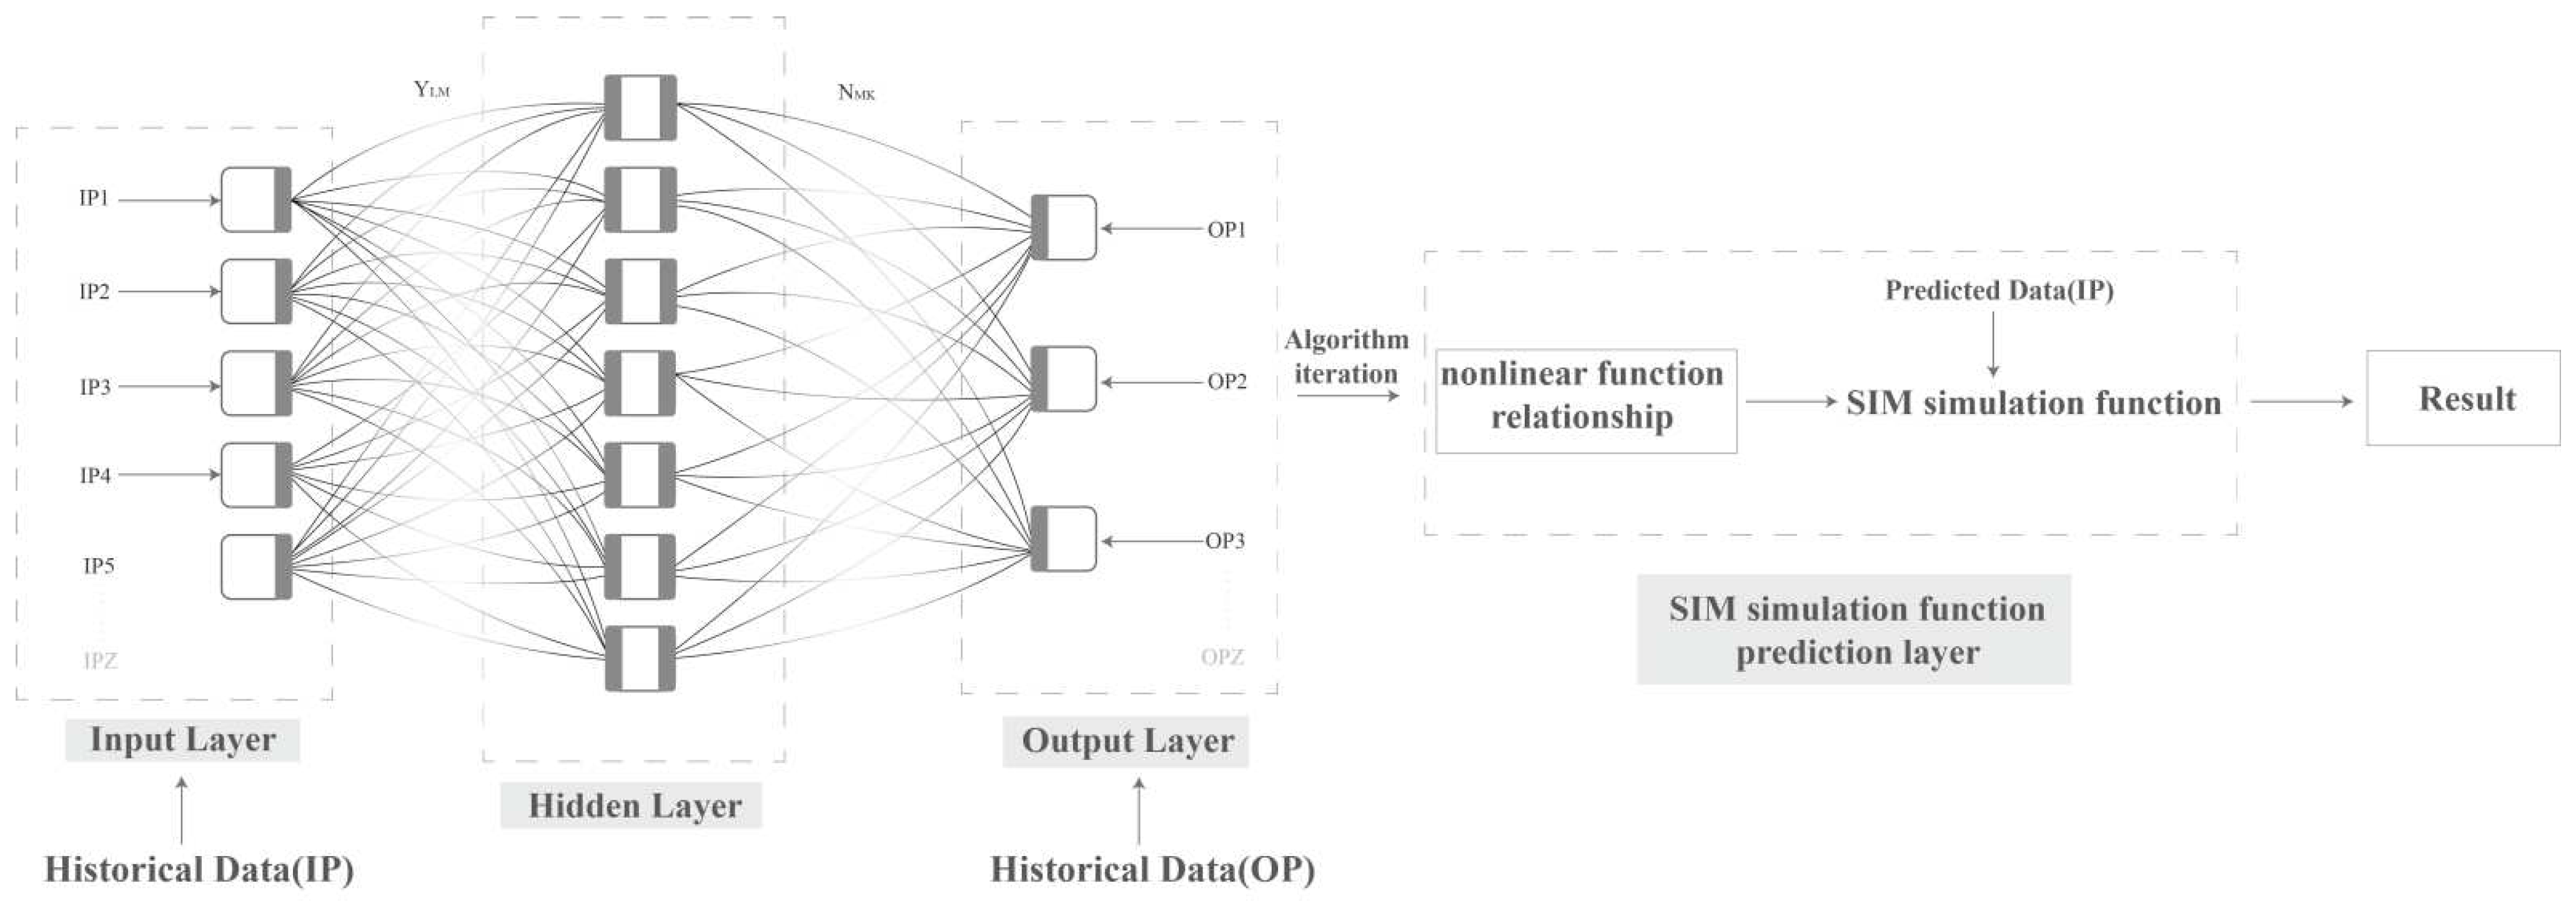
2.3. Estimation of CO2 Emissions

The CO2 estimation in Equation (1) was predicted using a BP neural network and the topology of the neural network is shown in Figure 3.
In terms of structure, a BP neural network mainly consists of an input layer, hidden layer, output layer, and SIM simulation function prediction layer. In the operation, the element IP is amplified by the weighting effect of YLM and NMK in the hidden layer when it is passed to the output layer, i.e., it forms a mapping relationship as a nonlinear function in the process. Subsequently, the “mapping relationship” and the future input IP elements are transferred to the SIM simulation function layer to predict. The specific implementation steps of this study were as follows
Step 1: Determine the data type. According to the summary and screening of the existing studies on the influence factors of CO2 emissions, the IP indicators in the training input layer could be selected as: population, per capita GDP, urbanization rate, energy consumption intensity, and the proportion of non-fossil fuel energy consumption [17,18,19]. The output layer indicator OP was carbon dioxide equivalent. For the SIM simulation function prediction layer, the prediction input and output data were the IP and OP values for the period 2021–2060, respectively.
Step 2: Sets the number of hidden layers according to Equation (9).
L = n + m + a
In Equation (9), L is the number of nodes in the hidden layer, n is the number of neuron types in the input layer, m is the number of neuron types in the output layer, and a is a constant that takes the value range of [0, 10]. Based on the type of training input data in this study, n = 5 and m = 1. In addition, from the Kolmogoroff theorem, the best training effect of the neural network was obtained when a = 10, and thus L = 12.
Step 3: To reduce the training error caused by the variability of the magnitude, the data need to be normalized according to the method of Equation (11).
G = S a S m i n S m a x S m i n
In Equation (10), G is the normalized training data, S a is the training data, S m i n is the minimum value in the training data, and S m a x is the maximum value in the training data.
Step 4: Initialize the threshold {NMK} and the connection weight {YLM}, which was assigned a random value between [−1, 1].
Step 5: Provide the 1999–2017 IP and OP data to the network and divide it into a training group, validation group, and test group according to the percentages 70%, 15%, and 15%, respectively.
Step 6: Select the algorithm for training. Considering the better correlation between CO2 and its influencing factors in this study [14], we used the nonlinear least-squares method (Levenberg–Marquardt algorithm) for model training.
Step 7: Train the model and observe the test results. If the results are not good, return to step 4 again until the Xth test result is good.
Step 8: Call the command “SIM (AX_RNET, (1999–2017 IP)” to verify the Xth training result (AX_RNET); if the calculated value has a larger error than the actual value, then return to step 3 for training until the verification result is good.
Step 9: After training, call the forecast layer command of “SIM (AX_RNET, (2021–2060_IP))” to predict the CO2 emissions in 2021–2060, where “(2021–2060_IP)” refers to the dataset of population, per capita GDP, urbanization rate, energy consumption intensity, and proportion of non-fossil fuel energy consumption in 2021–2060.

2.4. Data Sources

2.4.1. Forest Resource Data

In logistic stipulation, the data for calculating forest biomass density were from the 7th to 9th National Forest Inventory (NFI) dataset published by the State Forestry and Grassland Administration, which comprises 415,000 fixed samples in China (excluding Hong Kong, Macao, and Taiwan) collected between 2004 and 2018. The carbon pools that were focused on in this study primarily refer to those produced by arbor forests, as they constituted 82.43% of the total forested area. To facilitate data fitting, this study categorized 31 provinces in China into north (Beijing, Tianjin, Hebei, Shanxi, Inner Mongolia), east (Shandong, Jiangsu, Anhui, Zhejiang, Fujian, Shanghai), south (Guangdong, Guangxi, Hainan), northeast (Heilongjiang, Jilin, Liaoning), southwest (Sichuan, Guizhou, Yunnan, Xizang, Chongqing), northwest (Ningxia, Xinjiang, Qinghai, Shaanxi, Gansu), and central (Hubei, Hunan, Henan, Jiangxi) regions based on the geographical zoning basis of the National Forest Management Plan. In addition, considering the limitations of the data, the carbon sequestration benefits of below-ground biomass, dead wood, and soil organic matter carbon pools were not included in the calculations of this study.
The afforestation area and forest management area were selected from the National Forest Management Plan [11], as shown in Table 1. In the calculations, we assumed the same area of forestry activities implemented each year.
Forest age data selection and classification were from the “Technical regulations for continuous forest inventory” (Table 2) [20].
In Table 2, different forest types are categorized. Type 1 includes red pine (Pinus koraiensis Sieb. et Zucc.), spruce (Picea asperata Mast.), and cypress (Cupressus funebris Endl.); type 2 includes larch (Larix gmelinii (Rupr.) Kuzen.), fir (Abies fabri (Mast.) Craib), and sphagnum pine (Pinus sylvestris var. mongolica Litv.); type 3 includes Chinese red pine (Pinus tabuliformis Carriere.), horsetail pine (Pinus massoniana Lamb.), and Huashan pine (Pinus armandii Franch); type 4 includes poplar (Populus L.), willow (Salix babylonica L), eucalyptus (Eucalyptus robusta Smith.), and soft broad species; type 5 is birch (Betula); type 6 includes oak (Quercus acutissima), lime (Tilia tuan Szyszyl.), and hard broad species; type 7 is cedar (Cunninghamia lanceolata (Lamb.) Hook) and Cryptomeria fortunei (Cryptomeria japonica var. sinensis Miquel); type 8 is mixed coniferous and mixed coniferous forest; and type 9 is mixed broadleaf forest.
In Table 2, the northern region includes Heilongjiang, Jilin, Liaoning, Mongolia, Beijing, Hebei, Tianjin, Shandong, Shanxi, Henan, Shaanxi, Gansu, Shanxi, Ningxia, and Xinjiang; the southern region (excluding Hong Kong, Macao, and Taiwan) includes Shanghai, Jiangsu, Anhui, Zhejiang, Jiangxi, Fujian, Guangdong, Guangxi, Yunnan, Guizhou, Tibet, Chongqing, Sichuan, Hainan, Hubei, and Hunan.
The BEF data selection was from the “Technical regulations for continuous forest inventory” (Table 3) [20].

2.4.2. Carbon Dioxide Emission Data

For the training input and output layers of the BP neural network, we selected the dataset from 1999 to 2017, where the population, per capita gross regional product, urbanization rate, and energy intensity were obtained from the National Bureau of Statistics for China [21]. The share of non-fossil energy consumption was obtained from the bp World Energy Statistical Yearbook [22]. The CO2 data are from the published database [23,24], which covers carbon emissions from fossil fuel combustion in 47 sectors, such as agriculture, forestry, grazing, and transportation for 31 provinces across China. Fossil fuel types include raw coal, cleaned coal, other washed coal, briquettes, coke, coke oven gas, other gas, other coking products, crude oil gasoline, kerosene, diesel oil, fuel oil, liquefied petroleum gas, refinery gas, other petroleum products, and natural gas.
For the forecast input data, the population size, per capita GDP, urbanization rate, energy intensity, and the share of non-fossil energy consumption for 2021–2060 were obtained from previous studies and national reports [4,19,25,26]. Some of the missing data were filled in by extrapolation and interpolation. The specific settings are shown in Table 4.

3. Results

3.1. Modelled Coefficient of the Relationship between Biomass Density and the Forest Age

Based on the forest area data and volume data from the 7th to 9th NFI, the existing biomass density for each forest age group with different origins was calculated using Equation (3), and subsequently, forest age parameters and the resulting biomass densities were processed for fitting using MATLAB 2016b (the fitting results for some dominant tree species are shown in Table 5). The results showed that there was significant variability in the relationship between biomass density and stand age for the same type of tree species within the same region. In the case of mixed coniferous forests, the variability of relevant parameters for this forest type was the most pronounced in southwest China, where the differences in p, q, and z were 194.10, 1.77, and 0.01, respectively, while the variability was weaker in south China (29.60, 1.69, 0.02).
There was also significant variability in the relationship between biomass density and stand age for the same type of tree species in different regions for forests of the same origin. Taking natural mixed coniferous forests as an example, the fitted parameters were closer in the central, northern, and eastern regions, with the maximum differences in p, q, and z being 11.10, 2.25, and 0.19, respectively. Meanwhile, the variability was greater in other regions, with the maximum difference in p being 289.
The average adjusted r-square of the dominant tree species in each region was 0.93 and the average root means square was 15.29. Overall, the model fit was good.

3.2. Status of China’s Forest Carbon Storage

The results of the calculation for current forest carbon storage in China based on the logistic growth model are shown in Figure 4. According to the forest origin, China’s carbon storage capacities were 9459.56 TgC and 2816.08 TgC for natural and planted forests, respectively. For the natural forests, an imbalanced distribution of carbon storage existed in China, with higher carbon storage in the southwest (3588.76 TgC) and northeast (2178.350 TgC), followed by the northern (1138.89 TgC), central (795.72 TgC), eastern (670.58 TgC), northwestern (543.85 TgC), and southern regions (543.41 TgC). The provinces of Sichuan, Heilongjiang, and Tibet Autonomous Region had the highest natural forest carbon storage, accounting for 1369.56 TgC, 1345.30 TgC, and 1233.17 TgC, respectively. Together, these three regions accounted for 42% of the national natural forest carbon storage. In contrast, Shanghai, Jiangsu, Tianjin, and Ningxia were the four regions with lower carbon storage, accounting for only 0.10% of the national capacity.
Compared to natural forests, plantation-type forests had a more balanced carbon storage distribution comprising 592.16 TgC in the southwest, 556.80 TgC in the east, 464.85 TgC in the south, 453.98 TgC in the central region, 371.86 TgC in the northeast, 269.26 TgC in the north, and 107.92 TgC in the northwest. Regions with higher carbon storage in plantation forests were Sichuan (316.61 TgC), Fujian (243.90 TgC), and Guangxi (241.50 TgC). Conversely, Shanghai (0.28 TgC), Tibet (1.54 TgC), and Tianjin (2.46 TgC) had lower carbon storage.
By age group, China’s middle-aged forests contributed the most carbon storage currently, accounting for 29% (3558.97 TgC) of the overall carbon storage, followed by 22% (2707.34 TgC) from near-mature forests, 20% (2507.23 TgC) from mature forests, 16% (2262.37 TgC) from young forests, and 13% (1618.26 TgC) from over-mature forests.
Overall, the carbon storage capacity of China’s arboreal forests constituted approximately 12,315.69 TgC. In particular, forest resources were mainly concentrated in the northeast and southwest, and the carbon storage capacity collectively accounted for 55% of the country’s capacity. The top regions with high carbon storage were Sichuan Province (1686.17 TgC), Heilongjiang (1532.23 TgC), Tibet Autonomous Region (1234.71 TgC), Inner Mongolia (1112.38 TgC), and Yunnan (861.95 TgC). Meanwhile, regions with low carbon storage were mainly the coastal municipalities and northwestern provinces, such as Shanghai (0.28 TgC), Tianjin (2.71 TgC), and Ningxia (14.48 TgC).

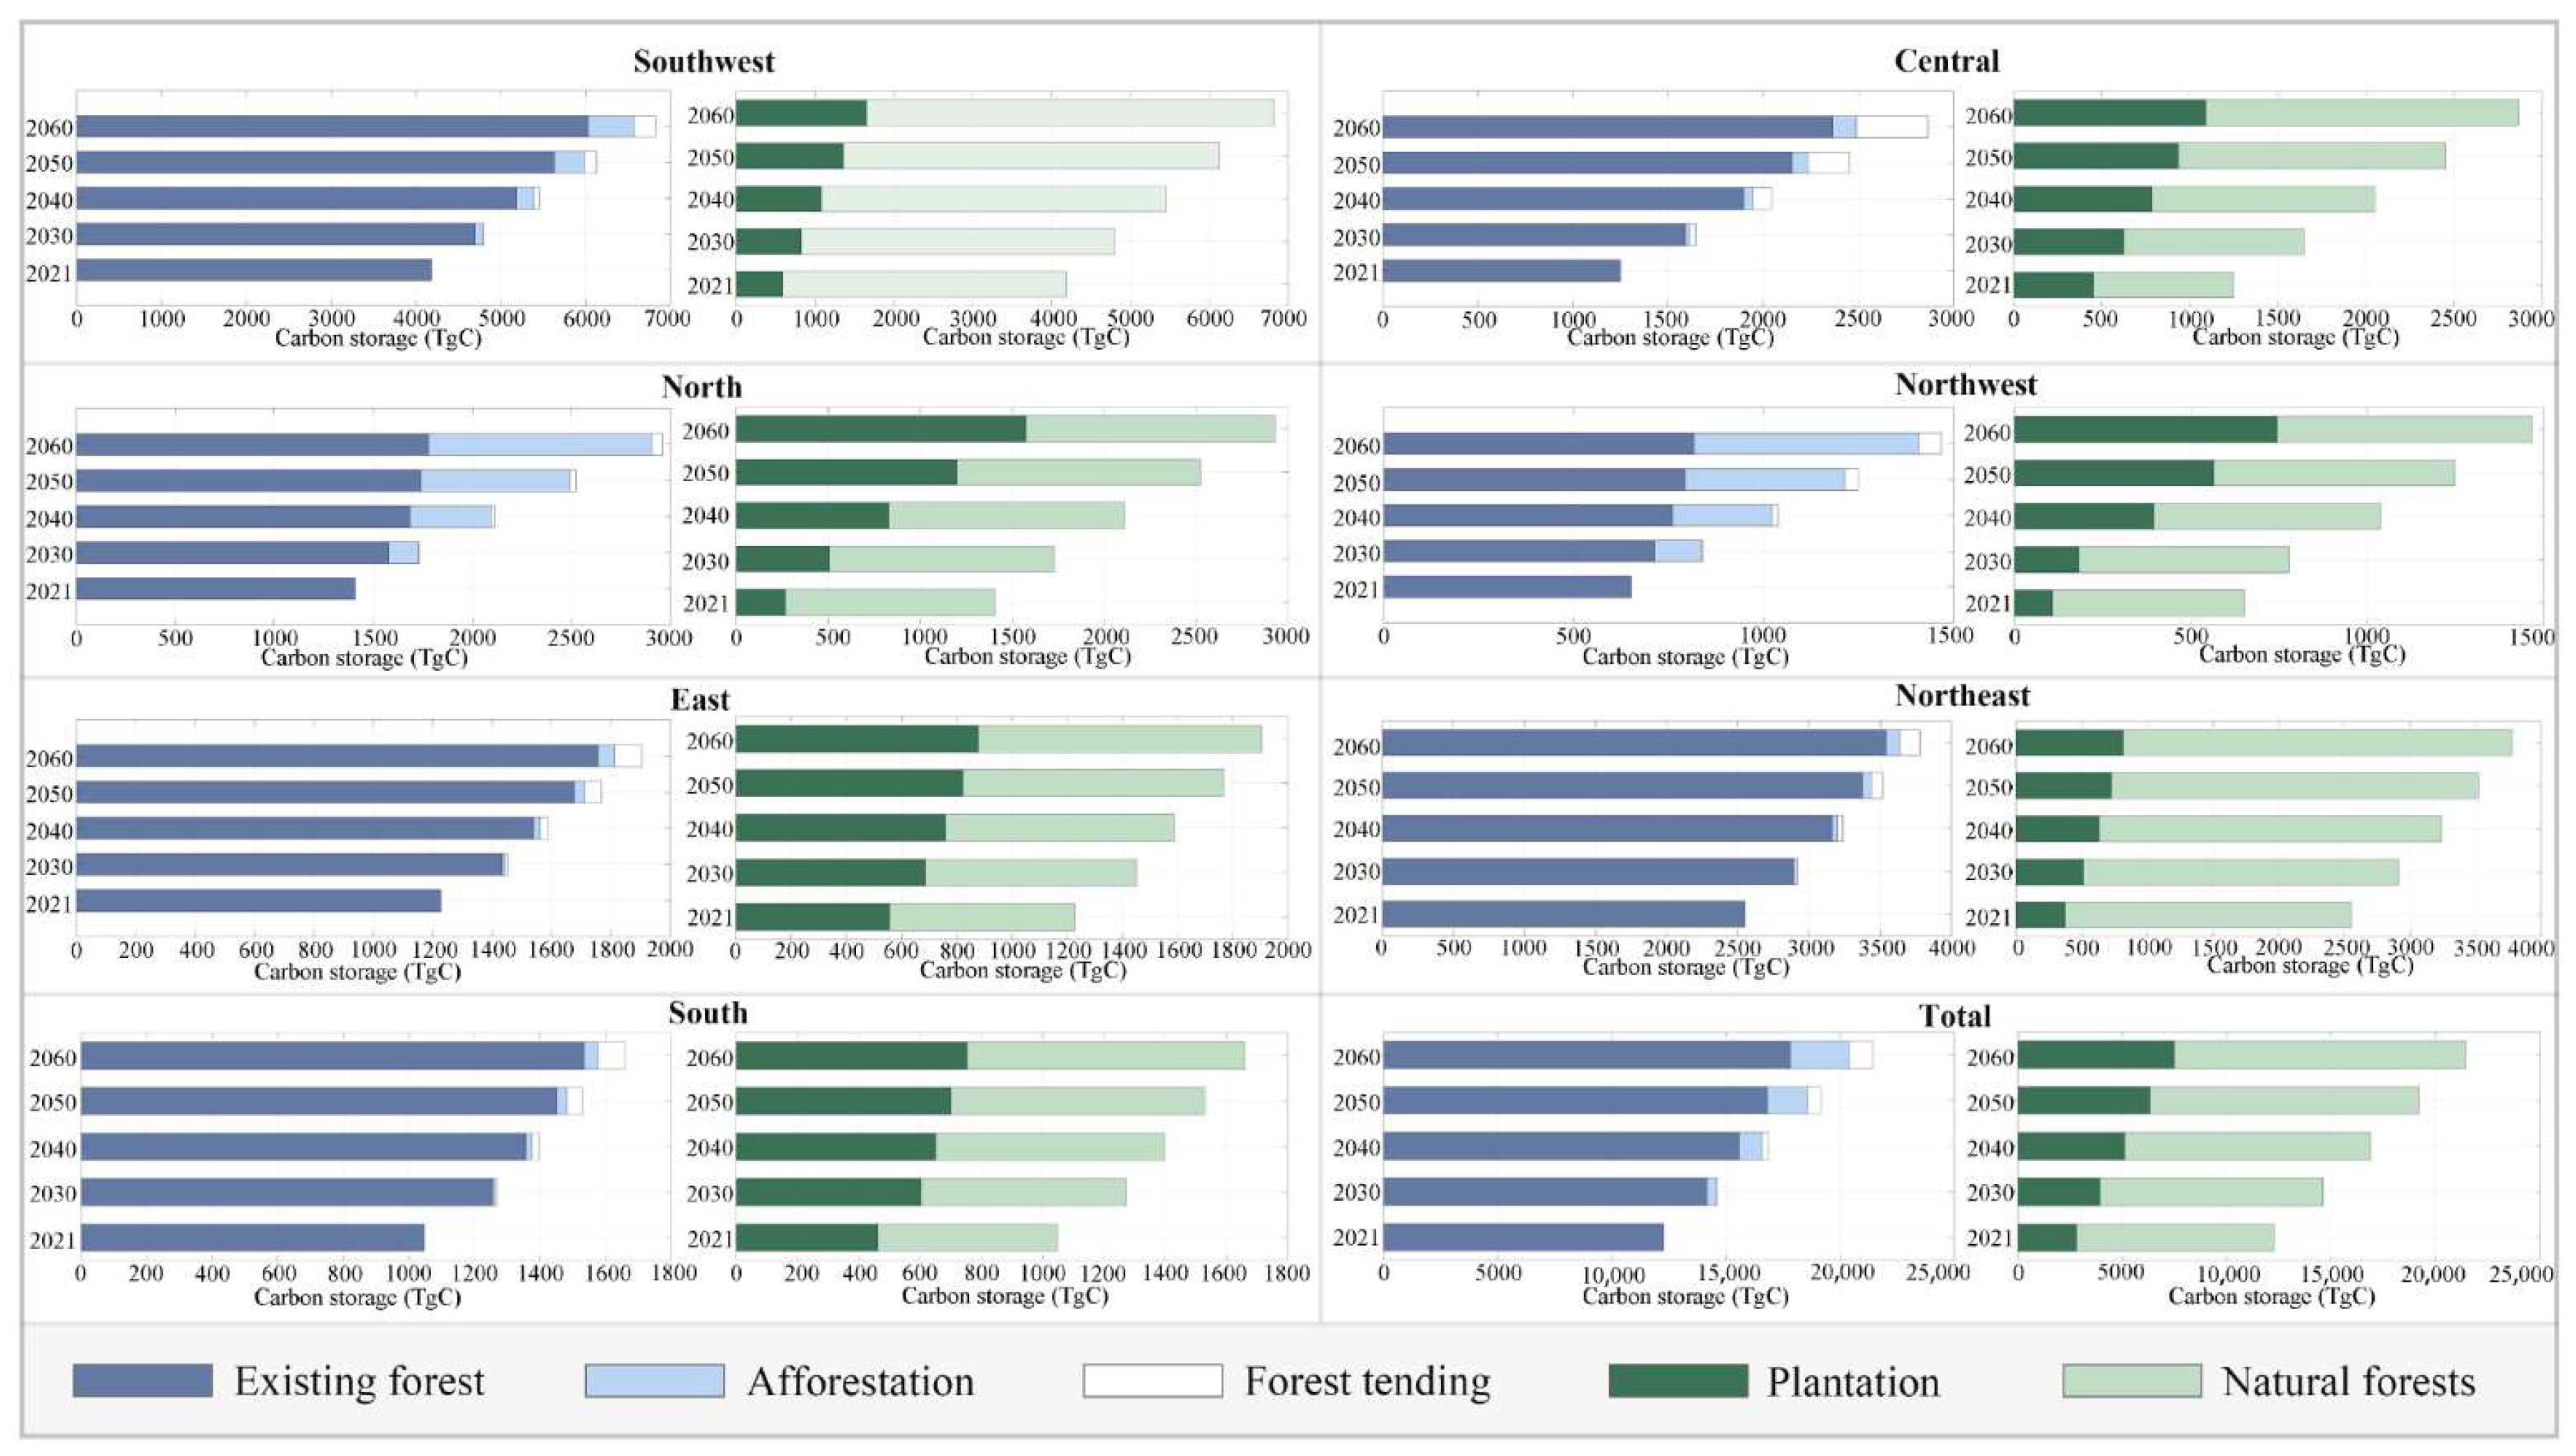
3.3. Forecasted Forest Carbon Storage in China

Table 6 shows the predicted results of the logistic growth model based on biomass density and forest age. Forest carbon storage in China is expected to increase from 12,315.69 TgC to 21,457.88 TgC during 2031–2060, with the average growth rate gradually slowing down from 1.90% during 2021–2030 to 1.19% during 2051–2060, Regionally, the average annual growth rate of carbon storage in the central region had the largest change (2.30%) and the lowest (1.03%) was found in the northeast. By 2060, the cumulative carbon storage generated by each region is projected to be 6819.41 TgC in the southwest, 3779.23 TgC in the northeast, 2961.82 TgC in the north, 2866.70 TgC in the central region, 1467.77 TgC in the northwest, 1956.15 TgC in the south, and 1659.16 TgC in the east. The southwest and northeast are expected to be the main contributing regions of carbon storage since 2021, accounting for about 49.39% nationally.
In consideration of different factors, such as the climate environment, basic forest resources, and future planning scenarios of each region, the carbon storage ratios are likely to be significantly different between provinces and municipalities. During the forecast period, Sichuan, Heilongjiang, Tibet, and Yunnan provinces are expected to hold cumulative carbon storage accounting for 42.15% of the national total. In contrast, Tianjin, Shanghai, Ningxia Autonomous Region, and Beijing are expected to have a lower contribution to carbon storage, with an average of only 0.43% of the national total. Overall, the projected variability of forest carbon storage is consistent with the current status.
To further analyze the future carbon storage composition, forestry activities were classified by type and corresponded to forest origin type (Figure 5). From the perspective of forestry activities, the predicted cumulative carbon storage generated by existing forest resources was 17,824.11 TgC from 2021–2060. This accounted for 83.07% of the overall and was mainly attributable to the southwest (6026.36 TgC) and northeast (3542.45 TgC) regions. Meanwhile, afforestation activities were anticipated to contribute 2583.27 TgC, which accounted for 12.04% of the total and was mainly attributable to northern China (1127.23 TgC) and northwest China (592.32 TgC). The cumulative carbon storage from forest tending activities (1050.50 TgC) accounted for 4.90% of the total and its main sources were central (376.57 TgC) and southwest China (245.27 TgC). In terms of the forest origin, plantation forests in the north, northwest, and northeast were the main sources of future carbon storage, while the future carbon storage in the southwest, east, south, and central China were driven by natural forests.

3.4. CO2 Emissions Forecast for NDC Scenario

The population, GDP per capita, urbanization rate, energy intensity, share of non-fossil energy consumption, and CO2 emissions data from 1999–2017 were used as training data and input into MATLAB R2016b for training, and the obtained network was substituted into the SIM function for simulation prediction (Table 7). The results showed that, under the latest submitted NDC scenario, average annual emissions were forecasted to be 10,852.20 MtCO2 in 2021–2030, 10,959.30 MtCO2 in 2031–2040, 9994.70 MtCO2 in 2041–2050, and 7682.91 MtCO2 in 2051–2060.
The regression curve of the simulated output of the BP neural network and the desired output (Figure 6) calculated correlation coefficients of 0.99991 for the training sample, 0.99551 for the validation sample, 0.99997 for the test sample, and 0.99992 for the whole sample. The network was trained for a third time, resulting in the convergence of the perceptron output to a target value, indicating proper training of the model. In addition, to further determine the prediction error, training input data from 1999–2017 were used as the prediction input data of the SIM function for secondary calculation calibration. The calibration results showed that the average absolute error between the true value and the predicted value was 1.18% (Table 8).

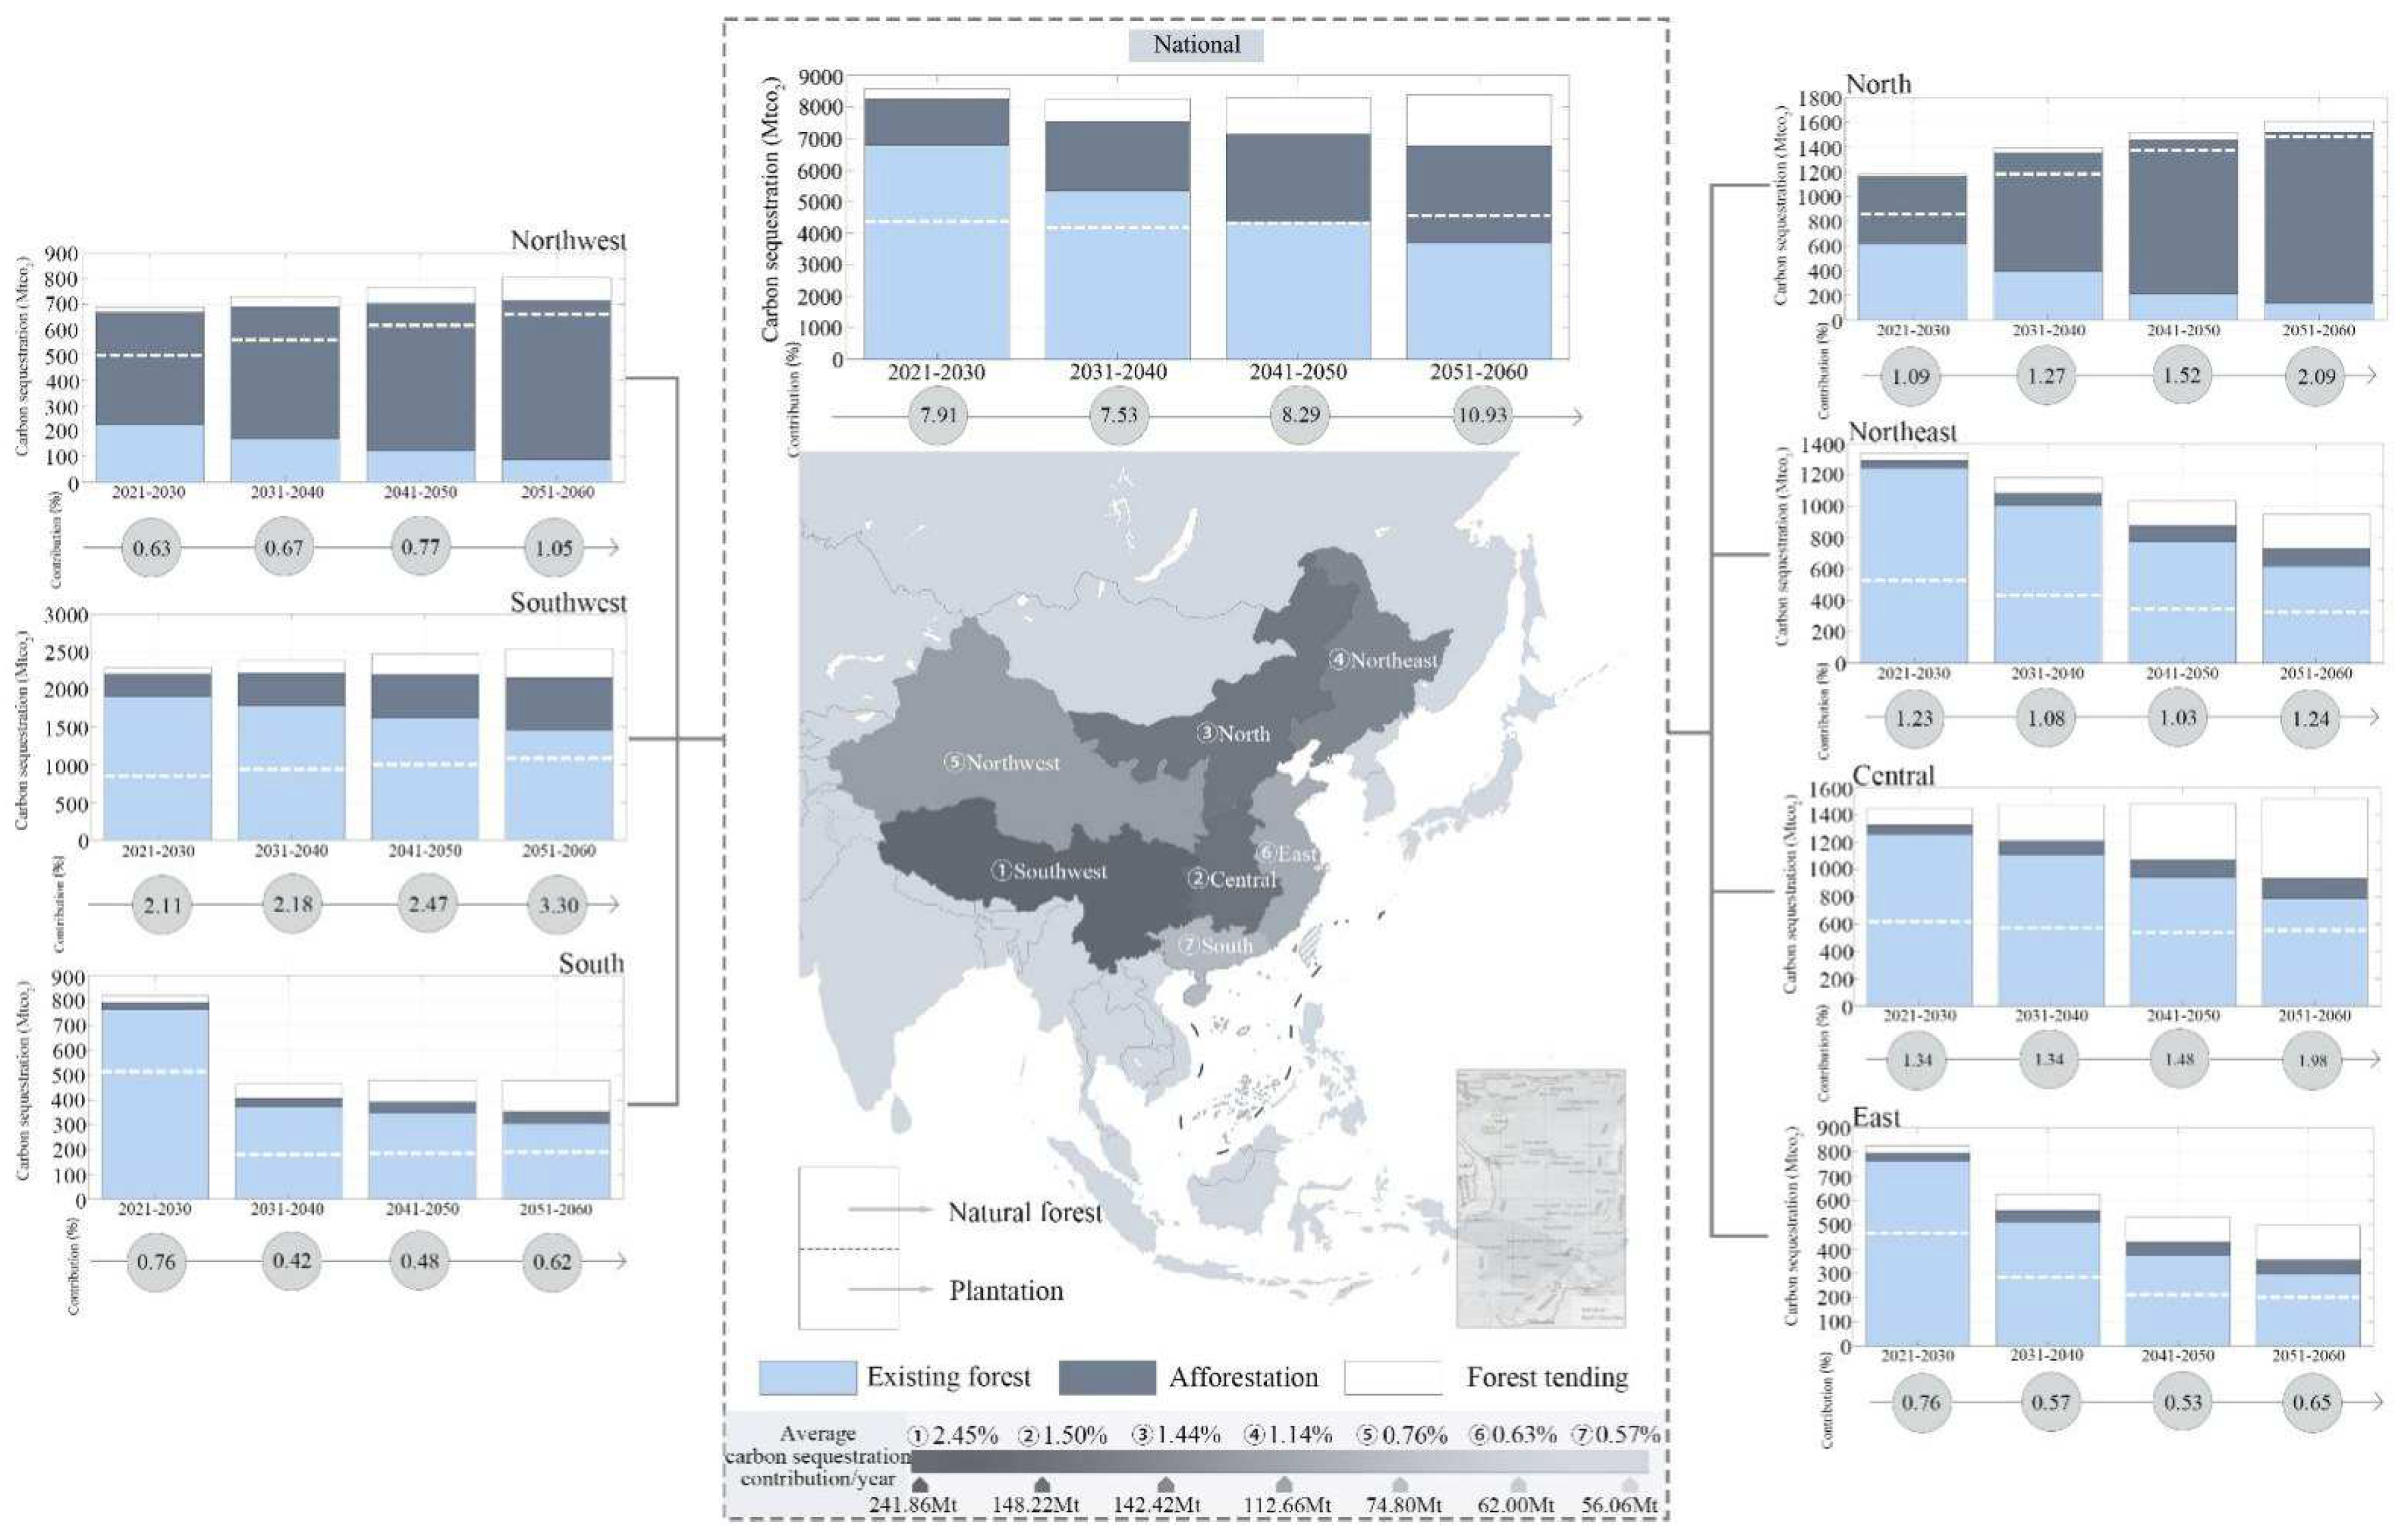
3.5. Forecast of Forestry Contributions toward Carbon Neutrality in China

Figure 7 shows the results of the carbon sequestration contribution calculations. In order of sink size growth and contribution of each region during the carbon peak period: southwest 2284.53 MtCO2 (2.11%) > central 1452.08 MtCO2 (1.34%) > northeast 1339.71 MtCO2 (1.24%) > north 1178.74 MtCO2 (1.09%) > south 819.78 MtCO2 (0.76%) > east 825.61 MtCO2 (0.76%) > northwest 688.15 MtCO2 (0.63%). The sink increase and contribution of each region during the carbon neutral period were 7389.91 MtCO2 (2.58%) in the southwest > 4518.05 MtCO2 (1.58%) in the north > 4476.89 MtCO2 (1.56%) in the central region > 3166.68 MtCO2 (1.11%) in the northeast > 2303.84 MtCO2 (0.80%) in the northwest > east 1654.59 MtCO2 (0.58%) > south 1422.77 MtCO2e (0.62%). Overall, China’s forest carbon sequestration and contribution for 2021–2030 were 8588.61 MtCO2 (7.91%), 8252.96 MtCO2 (7.53%) for 2031–2040, 8284.32 MtCO2e (8.29%) for 2041–2050, and 8395.45 for 2051–2060 MtCO2 (10.93%), with the average annual carbon sequestration at 838.03 MtCO2.
The annual average carbon sequestration contributed by forestry activities of existing forest resources is expected to gradually decrease during 2021–2060, from 678.34 MtCO2 (6.25%) to 368.96 MtCO2 (4.80%). A significant contribution could be attributable to the southwest, where accumulated carbon sequestration accounted for 30.08% of the existing forest resources nationwide. In contrast, the contribution of carbon sequestration in the northwest is expected to be low, only accounting for 2.99% of the country. The annual average carbon sequestration of afforestation is expected to continue to increase, from 145.94 MtCO2 (1.34%) to 308.18 MtCO2e (4.01%). Among them, afforestation in the north is expected to play a significant role, accounting for about 43.64% of the national afforestation. The annual average carbon sequestration of forest nurturing activities is expected to increase from 34.58 MtCO2 (0.32%) to 162.4 MtCO2 (2.11%), with the largest carbon sequestration in central China, accounting for about 35.85% of the national forestation.
Meanwhile, the average annual carbon sequestration of natural forests is projected to continue to decline in the future during the forecast period, from 424.05 MtCO2 to 387.12 MtCO2e, but the contribution is projected to increase from 3.91% to 5.04%, with the largest contribution of cumulative carbon sequestration in the southwest (1.46%) and the lowest in the northwest (0.17%). The national carbon sequestration contribution of plantation forests is projected to gradually increase after the carbon peak, with the annual average carbon sequestration increasing from 414.66 MtCO2 (3.78%) to 452.42 MtCO2 (5.89%). It is worth mentioning that despite the high carbon storage of natural forests in northeastern China, the potential for future sink size increase is weak, with cumulative carbon sequestration of only 1618.74 MtCO2.

4. Discussion

4.1. Evaluating the Reliability of Modeled Outcomes

4.1.1. Accuracy in Estimating Carbon Pool Potential

The methodology of estimating the above-ground biomass carbon pool of forests was validated through logistic models to chart carbon stocks from 1984 to 2003, and it was found to have good reliability [8,12]. However, considering the differences in data sources and calculation conditions, such as afforestation scenarios, it is necessary to further test the accuracy of the estimation results in this study. For this reason, we compared the results of previous national forest carbon storage studies [8,9,10] (as shown in Figure 8). The test showed that compared with previous studies, there was an overestimation of arbor forest carbon storage in our results. This was mainly because the above-ground biomass of the same tree species under different conditions (type of origin, geographical location) had obvious differences, and other studies did not consider this important factor. In addition, the types of tree species and afforestation planning scenarios selected by different studies also contributed to the variance.

4.1.2. Accuracy in CO2 Emission Prediction

Table 8 demonstrates the robustness of the BP neural network used in the study, and consequently, the modeled results were reliable. In comparison with the predicted carbon dioxide outcomes in other studies, our results corroborate those estimates [27,28,29]. The results (Table 9) show that the predicted value of the 2021 NDC scenario was 6% lower than that of the 2016 NDC scenario and approximately 3–18% lower than the shared socioeconomic pathway scenarios (SSPs) [30] set forth by the IPCC. Therefore, it is clear that the estimation results in this study were consistent with the results of other key national policies.

4.1.3. Deviation Factors in Carbon Sequestration Estimation

As expected of all modeled results, deviations would exist in the final estimated carbon sink contribution. This was due to variations in the actual distribution of the dominant tree species in each forest age group. Importantly, the area of forestry activities was mapped out according to the current forest management plan. Any changes in the overall National Forestry Plan in the future will affect the actual distribution. Furthermore, in consideration of the continuous development and innovation of emission reduction technologies, the carbon dioxide output values predicted by the BP neural network in this study may be different from the actual emissions results. Lastly, the inherent gaps within the dataset ultimately restricted the estimation of carbon sequestration to above-ground biomass and did not account for the contributions of other biomass carbon pools, such as underground biomass and soil.

4.2. Analysis of Spatial and Territorial Characteristics of Forestry Carbon Sequestrations

In this study, it was found that there was significant spatial and geographical variability in the contribution of future forestry carbon sequestration in China. From a temporal perspective, carbon sequestration from existing forest resources dominates during the period from carbon peaking to carbon neutrality, but the contribution declines gradually. On the other hand, afforestation and forest management activities play a greater role in carbon sequestration towards the end of the projection period. The reason was that the majority of current forest resources belong to middle-aged forests (28.99%) and near-mature forests (21.81%). As these sinks mature, the growth rate tapers, and carbon sequestration capacity will gradually decrease [31]. Similarly, new forests stemming from afforestation will still be in the process of maturation in the forecast period. The density per unit of carbon accumulation from young to mature forests gradually increases, accounting for the increasing trend of afforestation-related carbon storage. Exceptions to the rule include poplar, eucalyptus, and other softwood fast-growing species that can grow rapidly to maturation [32]. Furthermore, it should be noted that the importance of primary natural forests should not be displaced by afforestation/reforestation efforts, as secondary forests typically have poor carbon sink strength and biodiversity [33].
From the perspective of geographic zoning, the future contribution of forest carbon sequestration in China was mainly concentrated in the provinces of Sichuan and Yunnan in the southwest region. The causes of this phenomenon were related to a stable population density and economic development patterns coupled with the original variability in forest resources and climatic factors (temperature, precipitation patterns) [34]. It was shown that high population density and economic development will lead to a greater demand in the social requirements for resources, which will indirectly lead to a higher demand for land and, ultimately, a reduction in forested land [35].
According to the China Statistical Yearbook [21], the top three regions with the highest population density in 2017 were Shanghai (3814 persons/km2), Beijing (1323 persons/km2), and Tianjin (1301 persons/km2), which coincided with a low percentage of forest carbon storage (0.15%) and the average annual incremental sequestration (2.37 MtCO2). In contrast, the population density in the southwest was only 122 persons/km2, with a higher forest area for carbon storage and average annual incremental sink. Therefore, this presents an opportunity to focus on the carbon sequestration contribution of urban forests and reduce the phenomenon of forest land conversion caused by population growth. This could be achieved by strengthening afforestation and forest management efforts in alignment with areas that are expected to undergo robust population growth. The incorporation of these aspects in future forestry policies will not only improve urban habitats and quality of life in city centers, but also contribute to the national goals of carbon neutrality [36].

4.3. Analysis of the Opportunities and Barriers of Forestry Carbon Sequestration in China

In this study, it was found that in the NDC scenario submitted in October 2021, forest carbon sequestration has the potential to reduce 7.91–10.93% of CO2 emissions per year. Compared with the NDC CO2 emission scenario submitted in 2016 [27,28], the average annual carbon sequestration contribution had increased by 1.00% in the carbon peaking phase and by 0.33% in the carbon-neutral phase. This was mainly because the newly submitted NDC document made a readjustment for the share of non-fossil energy consumption in each emission sector in the future, thus leading to a decrease in the CO2 emission scenario. In addition, referring to other studies on CO2 emission projections [29], the cumulative contribution of forestry carbon sequestration in China was 7.17–8.19% over the period 2021–2060 under the five Shared Socioeconomic Pathways (SSPs) scenarios published by the IPCC. Overall, under ideal conditions, China’s forestry carbon neutral pathways have an integral role in combating climate change. However, in practice, forestry activities face many obstacles in the development and implementation stages that may affect the actual benefits.
In the development phase, the biggest barrier to implementation is the source of funding. Currently, government funding represents the predominant financial support for forestry activities, and mainly comes from the central government. However, forestry maintenance and enhancement activities are multi-year endeavors that could span generations [37]. It is difficult to support long-cycle and complex forestry activities with a single source of financing; therefore, multilateral institutional financing is needed to address such obstacles. It should be appreciated that international investment patterns in forestry activities are gradually converging to the private sector, while the demand for voluntary compensation for forestry and other NbS services by international companies is surging [38]. The extensive participation of companies not only provides more diversified and stable financing channels for forest-related projects but could also ignite technical collaborations to develop decarbonization technologies [39].
As of 2017, only 13 forestry-related corporate voluntary emission reduction projects have been recorded in China, resulting in an overall annual incremental sink of 1.87 MtCO2 [40]. Compared to the average annual incremental sink of 821.10 MtCO2 calculated in this study, private sector participation in forestry activities is currently low in China. The reasons for this phenomenon are mainly as follows: (1) forestry activities have higher environmental risks compared to other fields; (2) the lack of corresponding laws and regulatory mechanisms to protect the interests and motivate private sector involvement; and (3) the lack of a strong collaborative policy framework linking financial institutions, the private sector, and the government.
Establishing an innovative yet holistic forestry financial investment system combined with strict government oversight would be instrumental in creating positive change in the present scenario [41,42]. Considering the importance of the private sector as a funding source, it might be necessary to institute a diversified financing mechanism to incentivize private and public sector engagement in the future development phase of forestry activities. By emphasizing enhancing incentives (e.g., preferential financing) and legal protection for investors, funds can be better directed toward forestry and environmental goals [41,42]. Accompanying that, climate risk information disclosure efforts should also be strengthened so that investors can get an overview of the activities and promote willingness to invest [43].
In the implementation stage, the biggest obstacle comes mainly from carbon reversal. According to the National Bureau of Statistics for China [21], the total area of forest fires caused by agricultural clearing and accidental arson from 2008 to 2017 was 235,900 ha, while the area of forests affected by pests and rodents was as high as 119,055,000 ha. Such phenomena are a combination of unavoidable natural factors and poor management/anthropogenic practices [44]. There is a need to manage the root cause of anthropogenic factors through better education, leadership, and management to prevent forest carbon sinks from becoming carbon-emitting sources, as seen in the Amazon basin [45,46]. Therefore, to reduce the probability of carbon reversal, it is critical to build a complete sustainable forest management system that involves agricultural cooperatives, forward-planning risk assessment strategy, and human resource training in the future national forestry planning.
Overall, the role of forestry-based carbon sequestration is important, but it alone cannot ensure timely and successful outcomes of carbon neutrality. The development of other sectors and technologies to mitigate climate change is imperative due to the multi-faceted issues driving greenhouse gas emissions. Renewable energy and fuels, industrial planning and transformation, and agricultural systems are some key sectors that should be targeted by governments and private companies in China, some of which are already underway [47,48,49,50,51,52,53].

5. Conclusions

Forest carbon sequestration is important in achieving China’s carbon neutrality targets, and an accurate assessment of forest emission reduction contribution will help the government to better formulate future policies. In this study, we used the method of continuous biomass conversion expansion factor and logistic growth modeling to calculate the carbon stocks and carbon sequestration of existing forests, afforestation, and forest tending activities in 31 provinces across China (excluding Hong Kong, Macao, and Taiwan) during the period 2021–2060. Subsequently, emissions reduction contribution was assessed based on the carbon emissions under the NDC scenario predicted with BP neural networks.
In summary, China’s forest resources have significant potential for emissions reduction contribution in the future. However, considering the uncertainties in the development and implementation (environmental and investment risks, etc.) of forestry activities, the actual benefit of forestry carbon sequestration in China could be lower than the annual average of 8.49% predicted in this study. Therefore, it is necessary to enhance the policy frameworks related to forestry activities to maximize the potential of this sector. At the same time, achieving carbon neutrality targets is multifaceted; therefore, more focus should be placed on developing alternative technologies, such as renewable energy and other emissions reduction sectors. This will ensure the timely achievement of carbon goals and boost sustainable development in the context of climate change.

Author Contributions

All authors contributed to the conceptualization, formal analysis, methodology, writing, and editing of the original draft. Conceptualization, Z.C.; Data curation, Z.J., Y.H., J.C. and S.W.; Formal analysis, Z.C., B.D., B.F., Z.J., Y.H., Y.L. and L.X.; Methodology, Z.C., B.D., Z.L. and J.C.; Visualization, B.F.; Writing—original draft, B.F., Z.L., Y.H., Y.L., L.X., Y.C. and S.W.; Writing—review & editing, Z.C., B.D., B.F., Z.J. and S.W. All authors have read and agreed to the published version of the manuscript.

Funding

This research received no external funding.

Institutional Review Board Statement

Not applicable.

Informed Consent Statement

Not applicable.

Data Availability Statement

The data presented in this study are available on request from the corresponding author.

Conflicts of Interest

The authors declare no conflict of interest.

References

  1. Forest Trend. Demand for Nature-based Solutions for Climate Drives Voluntary Carbon Markets to a Seven-Year High. Available online: https://www.forest-trends.org/pressroom/demand-for-nature-based-solutions-for-climate-drives-voluntary-carbon-markets-to-a-seven-year-high/ (accessed on 9 September 2021).
  2. Le, Q.C.; Andrew, R.M.; Friedlingstein, P.; Sitch, S.; Pongratz, J.; Manning, A.C.; Korsbakken, J.I.; Peters, G.P.; Canadell, J.G.; Jackson, R.B.; et al. Global carbon budget 2017. Earth Syst. Sci. Data 2018, 10, 405–448. [Google Scholar] [CrossRef] [Green Version]
  3. BP. Statistical Review of World Energy. Available online: https://www.bp.com/content/dam/bp/business-sites/en/global/corporate/pdfs/energy-economics/statistical-review/bp-stats-review-2021-full-report.pdf (accessed on 18 April 2022).
  4. United Nations Framework Convention on Climate Change. NDC Registry. Available online: https://www4.unfccc.int/sites/ndcstaging/Pages/Party.aspx?party=CHN&prototype=1 (accessed on 21 November 2021).
  5. Food and Agriculture Organization of the United Nations. Global Forest Resources Assessment 2020: Main Report. 2020. Available online: http://www.fao.org/3/ca9825en/ca9825en.pdf (accessed on 20 September 2021).
  6. National Bureau of Statistics. Available online: https://data.stats.gov.cn/easyquery.htm?cn=C01&zb=A0C08&sj=2021 (accessed on 18 April 2022).
  7. State Forestry and Grassland Administration. China Forest Resources Report 2014–2018; China Forestry Press: Beijing, China, 2019; ISBN 978-7-5038-9982-9. [Google Scholar]
  8. Xu, B.; Guo, Z.; Piao, S.; Fang, J. Biomass carbon stocks in China’s forests between 2000 and 2050: A prediction based on forest biomass-age relationships. Sci. China Life Sci. 2010, 53, 776–783. [Google Scholar] [CrossRef] [PubMed]
  9. Qiu, Z.; Feng, Z.; Song, Y.; Li, M.; Zhang, P. Carbon sequestration potential of forest vegetation in China from 2003 to 2050: Predicting Forest vegetation growth based on climate and the environment. J. Clean. Prod. 2020, 252, 119715. [Google Scholar] [CrossRef]
  10. Li, Q.; Zhu, J.H.; Feng, Y.; Xiao, W.-F. Carbon storage and carbon sequestration potential of the forest in China. Adv. Clim. Chang. Res. 2018, 14, 287. [Google Scholar] [CrossRef]
  11. National Forestry and Grassland Administration. National Forest Management Plan (2016–2050). Available online: http://www.forestry.gov.cn/uploadfile/main/2016-7/file/2016-7-27-5b0861f937084243be5d17399f5f5f71.pdf (accessed on 17 April 2022).
  12. Fang, J.; Guo, Z.; Piao, S.; Chen, A. Terrestrial vegetation carbon sinks in China, 1981–2000. Sci. China Ser. D Earth Sci. 2007, 50, 1341–1350. [Google Scholar] [CrossRef]
  13. Li, H.K.; Zhao, P.X.; Lei, Y. Comparison on estimation of wood biomass using forest inventory data. Sci. Silvae Sin. 2012, 48, 44–52. [Google Scholar]
  14. Jin, W.; Li, Z.J.; Wei, L.S.; Zhen, H. The improvements of BP neural network learning algorithm//WCC 2000-ICSP 2000. In Proceedings of the 2000 5th International Conference on Signal Processing Proceedings. 16th World Computer Congress 2000, Beijing, China, 21–25 August 2000. [Google Scholar]
  15. Plaut, D.C.; Nowlan, S.J.; Hinton, G.E. Experiments on learning by Backpropagation Technical Report CMU–CS–86–126; Computer Science Department, Carnegie-Mellon University: Pittsburgh, PA, USA, 1986; Volume 22. [Google Scholar]
  16. Penman, J.; Gytarsky, M.; Hiraishi, T.; Krug, T.; Kruger, D.; Pipatti, R.; Buendia, L.; Miwa, K.; Ngara, T.; Tanabe, K.; et al. Good Practice Guidance for Land Use, Land-Use Change and Forestry. Available online: https://www.ipcc-nggip.iges.or.jp/public/gpglulucf/gpglulucf_files/GPG_LULUCF_FULL.pdf (accessed on 17 April 2022).
  17. Rehman, A.; Ma, H.; Ozturk, I.; Ulucak, R. Sustainable development and pollution: The effects of CO2 emission on population growth, food production, economic development, and energy consumption in Pakistan. Environ. Sci. Pollut. Res. 2021, 29, 17319–17330. [Google Scholar] [CrossRef]
  18. Rehman, A.; Ma, H.; Chishti, M.Z.; Ozturk, I.; Irfan, M.; Ahmad, M. Asymmetric investigation to track the effect of urbanization, energy utilization, fossil fuel energy and CO2 emission on economic efficiency in China: Another outlook. Environ. Sci. Pollut. Res. 2021, 28, 17319–17330. [Google Scholar] [CrossRef] [PubMed]
  19. Duan, F.M. Scenario Prediction and Peak Characteristics of China’s CO2 Emission Peak–BP Neural Network Analysis Based on Particle Swarm Optimization Algorithm. 2018. Available online: https://kns.cnki.net/kcms/detail/detail.aspx?dbcode=CJFD&dbname=CJFDLAST2018&filename=DBCD201805003&uniplatform=NZKPT&v=FGrJbI3aXLTLGDxPkU_6eIjf_JlzlqD2WjRsINw3SZ2aV_NSvjnZgMQ4WT6cPnHn (accessed on 14 November 2021).
  20. GB/T 38590-2020; Technical Regulations for Continuous Forest Inventory. China Quality Inspection Press: Beijing, China, 2020.
  21. National Bureau of Statistics. China Statistical Yearbook. Available online: http://www.stats.gov.cn/tjsj/ndsj/ (accessed on 10 November 2021).
  22. British Petroleum. Statistical Review of World Energy. 2021. Available online: https://www.bp.com/en/global/corporate/energy-economics/statistical-review-of-world-energy.html (accessed on 3 January 2022).
  23. Shan, Y.; Guan, D.; Zheng, H.; Ou, J.; Li, Y.; Meng, J.; Mi, Z.; Liu, Z.; Zhang, Q. China CO2 emission accounts 1997–2015. Sci. Data 2018, 5, 170201. [Google Scholar] [CrossRef] [Green Version]
  24. Shan, Y.; Huang, Q.; Guan, D.; Hubacek, K. China CO2 emission accounts 2016–2017. Sci. Data 2020, 7, 1–9. [Google Scholar] [CrossRef] [Green Version]
  25. State Grid Energy Research Institute. China’s Energy and Power Development Prospect 2020; State Grid Energy Research Institute: Beijing, China, 2020. [Google Scholar]
  26. General Office of the State Council. Opinions on The Complete and Accurate Implementation of The New Development Concept to Do a Better Work in The Carbon Peak and Carbon Neutral. Available online: http://www.gov.cn/zhengce/2021-10/24/content_5644613.htm (accessed on 10 November 2021).
  27. Li, M.; Liu, H.; Geng, G.; Hong, C.; Liu, F.; Song, Y.; Tong, D.; Zheng, B.; Cui, H.; Man, H.; et al. Anthropogenic emission inventories in China: A review. Natl. Sci. Rev. 2017, 4, 834–866. [Google Scholar] [CrossRef]
  28. Zheng, B.; Tong, D.; Li, M.; Liu, F.; Hong, C.; Geng, G.; Li, H.; Li, X.; Peng, L.; Qi, J.; et al. Trends in China’s anthropogenic emissions since 2010 as the consequence of clean air actions. Atmos. Chem. Phys. 2018, 18, 14095–14111. [Google Scholar] [CrossRef] [Green Version]
  29. Zhang, F.; Xu, N.; Wu, F. Research on China’s CO2 emissions projections from 2020 to 2100 under the shared socioeconomic pathways. Acta Ecol. Sin. 2021, 41, 9691–9704. [Google Scholar] [CrossRef]
  30. Pathak, M.; Slade, R.; Shukla, P.R.; Skea, J.; Pichs-Madruga, R.; Ürge-Vorsatz, D. 2022: Technical Summary. In Climate Change 2022: Mitigation of Climate Change; Contribution of Working Group III to the Sixth Assessment Report of the Intergovernmental Panel on Climate Change; Cambridge University Press: Cambridge, UK; New York, NY, USA, 2022. [Google Scholar] [CrossRef]
  31. Clark, K.E.; West, A.J.; Hilton, R.G.; Asner, G.P.; Quesada, C.A.; Silman, M.R.; Saatchi, S.S.; Farfan-Rios, W.; Martin, R.E.; Horwath, A.B.; et al. Storm-triggered landslides in the Peruvian Andes and implications for topography, carbon cycles, and biodiversity. Earth Surf. Dyn. 2016, 4, 47–70. [Google Scholar] [CrossRef] [Green Version]
  32. Murata, K.; Nakano, M.; Miyazaki, K.; Yamada, N.; Yokoo, Y.; Yokoo, K.; Umemura, K.; Nakamura, M. Utilization of Chinese fast-growing trees and the effect of alternating lamination using mixed-species eucalyptus and poplar veneers. J. Wood Sci. 2021, 67, 1–8. [Google Scholar] [CrossRef]
  33. Smith, C.C.; Espírito-Santo, F.D.B.; Healey, J.R.; Young, P.J.; Lennox, G.D.; Ferreira, J.; Barlow, J. Secondary forests offset less than 10% of deforestation-mediated carbon emissions in the Brazilian Amazon. Glob. Chang. Biol. 2020, 26, 7006–7020. [Google Scholar] [CrossRef]
  34. Tang, X.; Zhao, X.; Bai, Y.; Tang, Z.; Wang, W.; Zhao, Y.; Wan, H.; Xie, Z.; Shi, X.; Wu, B.; et al. Carbon pools in China’s terrestrial ecosystems: New estimates based on an intensive field survey. Proc. Natl. Acad. Sci. USA 2018, 115, 4021–4026. [Google Scholar] [CrossRef] [Green Version]
  35. Liu, W.; Lu, F.; Luo, Y.; Bo, W.; Kong, L.; Zhang, L.; Liu, B.; Ouyang, Z.; Wang, X. Human influence on the temporal dynamics and spatial distribution of forest biomass carbon in China. Ecol. Evol. 2017, 7, 6220–6230. [Google Scholar] [CrossRef] [Green Version]
  36. Endreny, T.A. Strategically growing the urban forest will improve our world. Nat. Commun. 2018, 9, 1160. [Google Scholar] [CrossRef] [Green Version]
  37. Fahey, R.T.; Alveshere, B.C.; Burton, J.; D’Amato, A.W.; Dickinson, Y.L.; Keeton, W.S.; Kern, C.C.; Larson, A.J.; Palik, B.; Puettmann, K.J.; et al. Shifting conceptions of complexity in forest management and silviculture. For. Ecol. Manag. 2018, 421, 59–71. [Google Scholar] [CrossRef]
  38. Forest Trend, Forest trend Impact Report 2020. Available online: https://www.forest-trends.org/wp-content/uploads/2020/12/FT-Impact-Report-2020.pdf (accessed on 12 September 2021).
  39. Forest Trend. Available online: https://www.forest-trends.org/wp-content/uploads/2020/07/doc_5756_rev_web.pdf (accessed on 12 September 2021).
  40. China Certified Emission Reduction Exchange Info-Platform. Available online: https://cdm.ccchina.org.cn (accessed on 21 November 2021).
  41. Fleischman, F.; Basant, S.; Fischer, H.; Gupta, D.; Lopez, G.G.; Kashwan, P.; Powers, J.S.; Ramprasad, V.; Rana, P.; Rastogi, A.; et al. How politics shapes the outcomes of forest carbon finance. Curr. Opin. Environ. Sustain. 2021, 51, 7–14. [Google Scholar] [CrossRef]
  42. Rode, J.; Pinzon, A.; Stabile, M.C.; Pirker, J.; Bauch, S.; Iribarrem, A.; Sammon, P.; Llerena, C.A.; Alves, L.M.; Orihuela, C.E.; et al. Why ‘blended finance’ could help transitions to sustainable landscapes: Lessons from the Unlocking Forest Finance project. Ecosyst. Serv. 2019, 37, 100917. [Google Scholar] [CrossRef]
  43. Monasterolo, I.; Battiston, S.; Janetos, A.C.; Zheng, Z. Vulnerable yet relevant: The two dimensions of climate-related financial disclosure. Clim. Chang. 2017, 145, 495–507. [Google Scholar] [CrossRef] [Green Version]
  44. Harris, N.L.; Gibbs, D.A.; Baccini, A.; Birdsey, R.A.; de Bruin, S.; Farina, M.; Fatoyinbo, L.; Hansen, M.C.; Herold, M.; Houghton, R.A.; et al. Global maps of twenty-first century forest carbon fluxes. Nat. Clim. Chang. 2021, 11, 234–240. [Google Scholar] [CrossRef]
  45. Kruid, S.; Macedo, M.N.; Gorelik, S.R.; Walker, W.; Moutinho, P.; Brando, P.M.; Castanho, A.; Alencar, A.; Baccini, A.; Coe, M.T. Beyond Deforestation: Carbon Emissions From Land Grabbing and Forest Degradation in the Brazilian Amazon. Front. For. Glob. Chang. 2021, 4, 645282. [Google Scholar] [CrossRef]
  46. Santika, T.; Meijaard, E.; Budiharta, S.; Law, E.A.; Kusworo, A.; Hutabarat, J.A.; Indrawan, T.P.; Struebig, M.; Raharjo, S.; Huda, I.; et al. Community forest management in Indonesia: Avoided deforestation in the context of anthropogenic and climate complexities. Glob. Environ. Chang. 2017, 46, 60–71. [Google Scholar] [CrossRef]
  47. Tour, J.M.; Kittrell, C.; Colvin, V.L. Green carbon as a bridge to renewable energy. Nat. Mater. 2010, 9, 871–874. [Google Scholar] [CrossRef]
  48. Bryan, B.A.; Gao, L.; Ye, Y.; Sun, X.; Connor, J.D.; Crossman, N.D.; Stafford-Smith, M.; Wu, J.; He, C.; Yu, D.; et al. China’s response to a national land-system sustainability emergency. Nature 2018, 559, 193–204. [Google Scholar] [CrossRef]
  49. Yu, J.; Wu, J. The Sustainability of Agricultural Development in China: The Agriculture–Environment Nexus. Sustainability 2018, 10, 1776. [Google Scholar] [CrossRef] [Green Version]
  50. Sinha, R.K.; Chaturvedi, N.D. A review on carbon emission reduction in industries and planning emission limits. Renew. Sustain. Energy Rev. 2019, 114, 109304. [Google Scholar] [CrossRef]
  51. Qazi, A.; Hussain, F.; Rahim, N.A.; Hardaker, G.; Alghazzawi, D.; Shaban, K.; Haruna, K. Towards Sustainable Energy: A Systematic Review of Renewable Energy Sources, Technologies, and Public Opinions. IEEE Access 2019, 7, 63837–63851. [Google Scholar] [CrossRef]
  52. Azarkamand, S.; Wooldridge, C.; Darbra, R.M. Review of initiatives and methodologies to reduce CO2 emissions and climate change effects in ports. Int. J. Environ. Res. Public Health 2020, 17, 3858. [Google Scholar] [CrossRef] [PubMed]
  53. Correa, D.F.; Beyer, H.L.; Fargione, J.E.; Hill, J.; Possingham, H.; Thomas-Hall, S.R.; Schenk, P.M. Towards the implementation of sustainable biofuel production systems. Renew. Sustain. Energy Rev. 2019, 107, 250–263. [Google Scholar] [CrossRef]
Figure 1. Fitting steps of the relationship between the above-ground biomass density and stand age.
Sustainability 14 05444 g001
Figure 2. Predicted patterns of afforestation and forest-tending activities.
Sustainability 14 05444 g002
Figure 3. BP neural network layout.
Sustainability 14 05444 g003
Figure 4. Carbon storage status of forests in China.
Sustainability 14 05444 g004
Figure 5. Forest carbon storage composition in China, 2021–2060.
Sustainability 14 05444 g005
Figure 6. BP neural network training results.
Sustainability 14 05444 g006
Figure 7. Potential of forestry carbon sequestration contribution in China, 2021–2060.
Sustainability 14 05444 g007
Figure 8. Comparison of the carbon storage potential in arbor forests from 2020–2050.
Sustainability 14 05444 g008
Table 1. Forecasted forest activities from 2021 to 2050 according to region.
RegionAfforestation
Area (100 ha)
Forest Tending
Area (100 ha)
RegionAfforestation
Area (100 ha)
Forest Tending
Area (100 ha)
Beijing53110,006Hubei5252174,200
Tianjin1051378Hunan1385217,676
Hebei24,7331305Guangdong3948118,569
Shanxi61,14753,184Guangxi479864,852
Inner Mongolia112,098246,426Hainan3598845
Liaoning417375,335Chongqing510445,357
Jilin443284,215Sichuan42,374175,035
Heilongjiang8772198,694Guizhou364256,330
Shanghai14375Yunnan49,092310,608
Jiangsu21519,665Xizang528753,234
Zhejiang2584109,324Shaanxi49,423101,385
Anhui141941,579Gansu53,65479,122
Fujian389597,561Qinghai22,78739,433
Jiangxi4784172,460Ningxia56516041
Shandong936,621Xinjiang108732,114
Henan12,15486,571Total494,9082,717,500
Table 2. Age (in years) categorization for different forest types [20].
SpeciesRegionOriginYoung
Forest
Half-
Mature Forest
Near-
Mature Forest
Mature
Forest
Over-
Mature Forest
Type 1NorthNatural forest≤6061–100101–120121–160≥161
Planted forest≤4041–6061–8081–120≥121
SouthNatural forest≤4041–6061–8081–120≥121
Planted forest≤2021–4041–6061–80≥81
Type 2NorthNatural forest≤4041–8081–100101–140≥141
Planted forest≤2021–3031–4041–60≥61
SouthNatural forest≤4041–6061–8081–120≥121
Planted forest≤2021–3031–4041–60≥61
Type 3NorthNatural forest≤3031–5051–6061–80≥81
Planted forest≤2021–3031–4041–60≥61
SouthNatural forest≤2021–3031–4041–60≥61
Planted forest≤1011–2021–3031–50≥51
Type 4NorthPlanted forest≤1011–1516–2021–30≥31
SouthPlanted forest≤56–1011–1516–25≥26
Type 5NorthNatural forest≤3031–5051–6061–80≥81
Planted forest≤2021–3031–4041–60≥61
SouthNatural forest≤2021–4041–5051–70≥71
Planted forest≤1011–2021–3031–50≥51
Type 6North/SouthNatural forest≤4041–6061–8081–120≥121
Planted forest≤2021–4041–5051–70≥71
Type 7SouthPlanted forest≤1011–2021–2526–35≥36
Type 8NorthNatural forest≤5051–9091–110111–150≥151
Planted forest≤3031–4546–6061–90≥91
SouthNatural forest≤4041–6061–8081–120≥121
Planted forest≤2021–3536–5051–70≥71
Type 9NorthNatural forest≤4041–6061–8081–120≥121
Planted forest≤1516–2829–3536–50≥51
SouthNatural forest≤4041–6061–8081–120≥121
Planted forest≤1213–2526–3334–48≥49
Table 3. BEF for some dominant tree species [20].
Tree SpeciesBEF *Tree SpeciesBEF *
Eucalyptus (Eucalyptus robusta Smith.)1.151Larch (Larix gmelinii (Rupr.) Kuzen.)1.416
Cypress (Cupressus funebris Endl.)1.535Horsetail pine (Pinus massoniana Lamb.)1.218
Akamatsu (Pinus densiflora Sieb. et Zucc.)1.402Nanmu (Phoebe zhennan S. Lee et F. N. Wei)1.474
Lime (Tilia tuan Szyszyl.)1.407Soft broad tree1.559
Alpine Pine (Pinus densata Mast.)1.651Cedar (Cunninghamia lanceolata (Lamb.) Hook.)1.093
Exotic pine (pinus elliottii)1.416Hemlock (Tsuga chinensis (Franch.) Pritz.)1.347
Red pine (Pinus koraiensis Sieb. et Zucc.)1.377Polar (Populus L.)1.441
Huashan pine (Pinus armandii Franch.)1.717Hard broad tree1.270
Birch (Betula)1.180Chinese red pine (Pinus tabuliformis Carriere.)1.571
Broadleaf mixed forests1.514Yunnan pine (Pinus yunnanensis Franch.)1.585
Fir (Abies fabri (Mast.) Craib)1.286Spruce (Picea asperata Mast.)1.264
Oak (Quercus acutissima)1.587Coniferous mixed forests1.587
Willow (Salix babylonica L.)1.821Mixed coniferous and broad-leaved forest1.656
Cryptomeria fortunei (Cryptomeria japonica var. sinensis Miquel)1.744Sphagnum pine (Pinus sylvestris var. mongolica Litv.)1.827
* BEF: dimensionless.
Table 4. The development rate of input data for carbon dioxide prediction in 2021–2060.
2021–20252026–20302031–20352036–20402041–20452046–20502051–20552056–2060
Population0.2750.050−0.125−0.200−0.275−0.350−0.568−0.704
GDP per
capita
6.1955.4054.8454.1653.7353.3452.5811.996
Urbanization rate1.2850.9350.4550.4400.2600.2400.0000.000
Energy
intensity
3.2103.0102.8602.7602.6602.5802.3792.242
Proportion of non-fossil
energy
consumption
0.0510.0500.0680.0510.0410.0340.0290.028
Development rate unit: percentage (%).
Table 5. Fitting results of some dominant tree species.
RegionSpeciesOriginpqz A d j R 2 RMSE
NortheastMixed coniferous
forests
Natural309.604.950.570.9714.04
EastMixed coniferous
forests
Planted240.407.520.070.9319.47
NorthOak
(Quercus acutissima)
Natural140.704.070.050.967.47
SouthRubber
(Quercus palustris Münchh)
Planted206.906.680.050.993.61
CentralCedar
(Cunninghamia lanceolata (Lamb.) Hook.)
Planted209.804.260.110.9117.06
NorthwestCypress
(Cupressus funebris Endl.)
Natural151.102.780.020.957.29
SouthwestMixed coniferous forestsNatural259.904.870.040.993.13
Table 6. Carbon storage of forests in China from 2021–2060.
RegionProvince20212030204020502060
SouthwestSichuan1686.171913.112138.942365.932594.31
Guizhou244.16319.27397.29474.55549.71
Yunnan861.951048.221287.041545.631829.50
Xizang1234.711323.701409.071485.811555.73
Chongqing153.93186.27221.87255.84290.17
Subtotal4180.934790.585454.236127.776819.41
NorthBeijing22.5629.0134.0537.9441.88
Tianjin2.714.936.527.578.56
Hebei150.23219.74284.60341.52396.54
Shanxi120.25172.15249.91346.25451.53
Inner Mongolia1112.381303.781534.331790.212063.32
Subtotal1408.151729.632109.422523.512961.82
EastShandong85.58128.43159.33181.53201.48
Jiangsu90.05110.69121.85128.94135.25
Anhui205.88242.18269.99295.45319.30
Zhejiang309.30354.16394.18430.83464.66
Fujian536.27616.70677.20730.53782.32
Shanghai0.280.390.510.640.78
Subtotal1227.381452.551588.231767.931903.80
SouthGuangdong367.60457.84507.44561.10617.31
Guangxi548.26673.21743.08813.59881.64
Hainan104.76140.09147.20153.951602.12
Subtotal1047.561271.141397.721528.631659.16
CentralHubei276.43364.33461.23565.47674.34
Hunan401.70528.31651.11769.28887.88
Henan133.60184.93243.89311.51386.58
Jiangxi437.97568.15691.36806.10917.90
Subtotal1249.701645.732047.592452.362866.70
NorthwestNingxia14.4824.5635.4846.4257.38
Xinjiang57.2566.2771.6776.8782.74
Qinghai32.3064.70100.61139.44181.24
Shaanxi376.74437.94502.48569.20638.35
Gansu170.99245.96328.51416.15508.05
Subtotal651.76839.451038.761248.081467.77
NortheastHeilongjiang1532.231735.781916.152074.892220.53
Jilin772.03873.81958.741027.741088.79
Liaoning245.95305.99363.17417.29469.91
Subtotal2400.162915.593238.063519.923779.23
Carbon storage in TgC, where 1 TgC = 1012 gC.
Table 7. Prediction results of carbon dioxide emissions based on a BP neural network in 2021–2060.
YearCO2 Emission (Mt)YearCO2 Emission (Mt)YearCO2 Emission (Mt)YearCO2 Emission (Mt)
202110,418.78203111,028.40204110,787.6720518423.99
202210,582.90203211,017.07204210,707.5120528137.10
202310,726.36203311,006.23204310,600.9120537904.62
202410,837.26203410,995.44204410,458.9220547726.11
202510,918.10203510,984.14204510,271.9020557594.91
202610,966.05203610,964.59204610,043.3720567506.17
202710,993.05203710,942.9720479767.2020577441.39
202811,011.77203810,917.9020489449.0120587394.81
202911,027.83203910,887.4120499104.1520597361.70
203011,040.20204010,848.7820508756.3720607338.35
Mt: million tons.
Table 8. SIM function secondary calibration results.
YearActual
(Mt)
Predict
(Mt)
RE (%)YearActual
(Mt)
Predict
(Mt)
RE (%)
19992978.102974.16−0.1320097656.007590.16−0.86
20003052.403056.550.1420108366.408686.773.83
20013224.303232.340.2520119245.409209.21−0.39
20023515.803267.43−7.0620129501.709364.20−1.45
20034154.003988.34−3.9920139492.909488.49−0.05
20044174.704677.12−0.8020149639.809640.220.00
20055566.905510.94−1.0120159644.009645.400.02
20066197.806200.340.0420169615.009619.510.05
20076822.206733.32−1.3020179866.009866.870.01
20087205.207124.66−1.12Mean absolute error1.18
Mt: million tons.
Table 9. Validation of annual carbon dioxide emissions prediction from 2020–2060 in China.
Emission ScenariosNDC2016NDC2021SSP1SSP2SSP3SSP4SSP5
Average emission/year (Mt)10,543.789872.2811,549.5011,128.5010,234.0011,087.0011,693.00
Mt: million tons; SSPs: Shared Socioeconomic Pathways (SSPs) scenarios are five different development scenarios of population, urbanization, and GDP per capita provided by the IPCC, which can often be combined with other quantitative models to derive greenhouse gas emissions [30]; SSP1: sustainability (taking the green road); SSP2: middle of the road; SSP3: regional rivalry (a rocky road); SSP4: inequality (a road divided); SSP5: fossil-fueled development (taking the highway).
Publisher’s Note: MDPI stays neutral with regard to jurisdictional claims in published maps and institutional affiliations.

