Article

Crack Propagation and Failure Mechanism of Modeled Recycled Concrete under Shear Stress

1
Economic and Technical Research Institute of Gansu Electric Power Corp., State Grid, Lanzhou 730050, China
2
School of Civil Engineering, Southeast University, Nanjing 211189, China
3
School of Economics and Management, North China Electric Power University, Beijing 102206, China
4
Gansu Electric Power Corp., State Grid, Lanzhou 730050, China
5
School of Environment and Architecture, University of Shanghai for Science and Technology, Shanghai 200093, China
6
Department of Civil Engineering and Architecture, Changzhou Institute of Technology, Changzhou 213032, China
*
Author to whom correspondence should be addressed.
Sustainability 2022, 14(9), 5552; https://doi.org/10.3390/su14095552
Submission received: 21 March 2022 / Revised: 25 April 2022 / Accepted: 27 April 2022 / Published: 5 May 2022
(This article belongs to the Special Issue Complex Solid Waste and Multipath Recycling)

Abstract

:
In this study, the failure processes of modeled concrete specimens under shear force were studied. To investigate the cracks propagation and failure modes, modeled natural aggregate, modeled recycled aggregate, and modeled brick aggregate were used as coarse aggregate in the modeled concrete. Through digital image correlation (DIC) technology, the displacement field and strain field could be obtained by analyzing the change of the speckle position on the surface of the specimens. It was found that the shear strength of the modeled natural concrete (MNC) was the highest, the modeled recycled concrete (MRC) was the second, and the modeled brick aggregate concrete (MBC) was the lowest and only half of that of MNC. The shear crack of the MNC first appeared at the interface transition zone (ITZ) and propagated, resulting in the shear failure. The shear crack of MRC first appeared in the new ITZ and then expanded to the old ITZ. The shear crack of MBC extended through the brick aggregate. The study also found that, along with the compressive stress trace range, the MNC and the MRC have four vertical compressive strain concentration zones, while the MBC has only two strain concentration zones, which should result from the fact that the elastic modulus of the brick aggregate is lower than the surrounding hardened mortar. Therefore, there are no compressive strain concentration zones near the brick aggregate.

1. Introduction

In recent years, China’s fast urbanization process has been particularly prominent. With an annual new construction area of more than 2 billion m2 and an annual demolition area of 200 million m2, China produces more than 1.8 billion tons of construction and demolished wastes (C & D wastes). In China, the C & D wastes are mainly composed of waste concrete and clay brick, of which the proportions of the waste concrete and clay brick are both probably 40%. In small cities and rural areas, the proportion of waste clay bricks is as high as 70% [1,2].
Research on the recycled aggregate and recycled concrete mainly focus on waste concrete, and remarkable results have been achieved. It was found that recycled concrete shows the characteristics of reduced strength and a deterioration of durability [3]. The higher water absorption of recycled aggregates also reduces the working performance [4]. Relevant technical regulations and standards have been issued and implemented, including Chinese national standards “Recycled coarse aggregate for concrete (GB/T 25177-2011)” [5] and “Recycled fine aggregate for concrete and mortar (GB/T 25176-2011)” [6]. In these standards, the recycled aggregate is divided into three categories, mainly categorized by water absorption, which indirectly limits the content of brick aggregates. However, the proportion of the brick aggregate cannot be ignored, which is one of the urgent problems in the C & D wastes resourcilization industry.
The research on making recycled concrete with brick aggregate has attracted increasing attention. Zheng et al. [7] proved that the strength of brick aggregate concrete is about 12% lower than that of ordinary concrete with the same mix proportion. The influence of brick aggregates on the elastic modulus of recycled concrete is more significant. When the substitution rate is 50% and 100%, the elastic modulus decreases by 54% and 62%, respectively [8]. The utilization of brick aggregates also has a negative impact on the durability of concrete, including the deterioration of impermeability and the decline of chloride ion permeability [9].
However, brick aggregates have the characteristics of light aggregates, which can reduce the density of concrete and improve the performance of thermal and sound insulation [10]. In addition, the high water absorption of brick aggregates brings an internal curing effect to improve cement hydration products and reduce the risk of dry shrinkage cracking [11]. Therefore, in applications with low strength and elastic modulus requirements, the brick aggregate concrete shows a high utilizing value. However, there is still a lack of relevant research, especially the damage evolution mechanism from phase separation and the interaction between brick aggregates and the hardened cement mortar.
It is difficult to capture concrete’s internal damage evolution process under stress. Modeling concrete is to make concrete two-dimensional to distinctly see each phase (aggregate phase and hardened cement mortar phase) in concrete, as well as the crack propagation and damage evolution during the process of failure. Shah et al. [12] first proposed modeled concrete, simplified the aggregate into a cylinder, poured cement mortar around it to form the modeled concrete, and conducted uniaxial compression test research. It was found that micro-cracks first appeared in the interface transition zone (ITZ) [13,14]. Using acoustic emission technology and laser holography technology, the crack development process of model concrete can be collected in real-time [15]. Lawler et al. [16] used digital image correlation (DIC) technology to study the failure process of modeled concrete containing different amounts of aggregates under a load. Tregger et al. [17] used single aggregate and double aggregate concrete models to study the failure mechanism and strain localization and performed meso simulation analyses.
Based on the above research on modeled concrete, Xiao et al. [18] put forward the concept of modeled recycled concrete. First, the modeled recycled aggregate was made with a cylindrical natural stone and an old ring-shaped mortar was poured around it. The test results showed that when the model recycled concrete specimen was damaged by compression, cracks always appeared at the ITZ and then extended to the old mortar and finally to the new mortar. Based on the above experiments, Liu et al. [19] further studied crack propagation and failure characteristics of modeled concrete under compression with natural and brick aggregates using DIC.
In this paper, the concept of modeled recycled concrete is proposed to make two-dimensional concrete containing the natural aggregate, recycled aggregate, and brick aggregate. With DIC technology, the displacement and strain distribution field of the modeled concrete in the process of shear failure was analyzed. The effects of different types of recycled aggregates on the crack development process and damage evolution mechanism of concrete are further summarized.

2. Materials and Methods

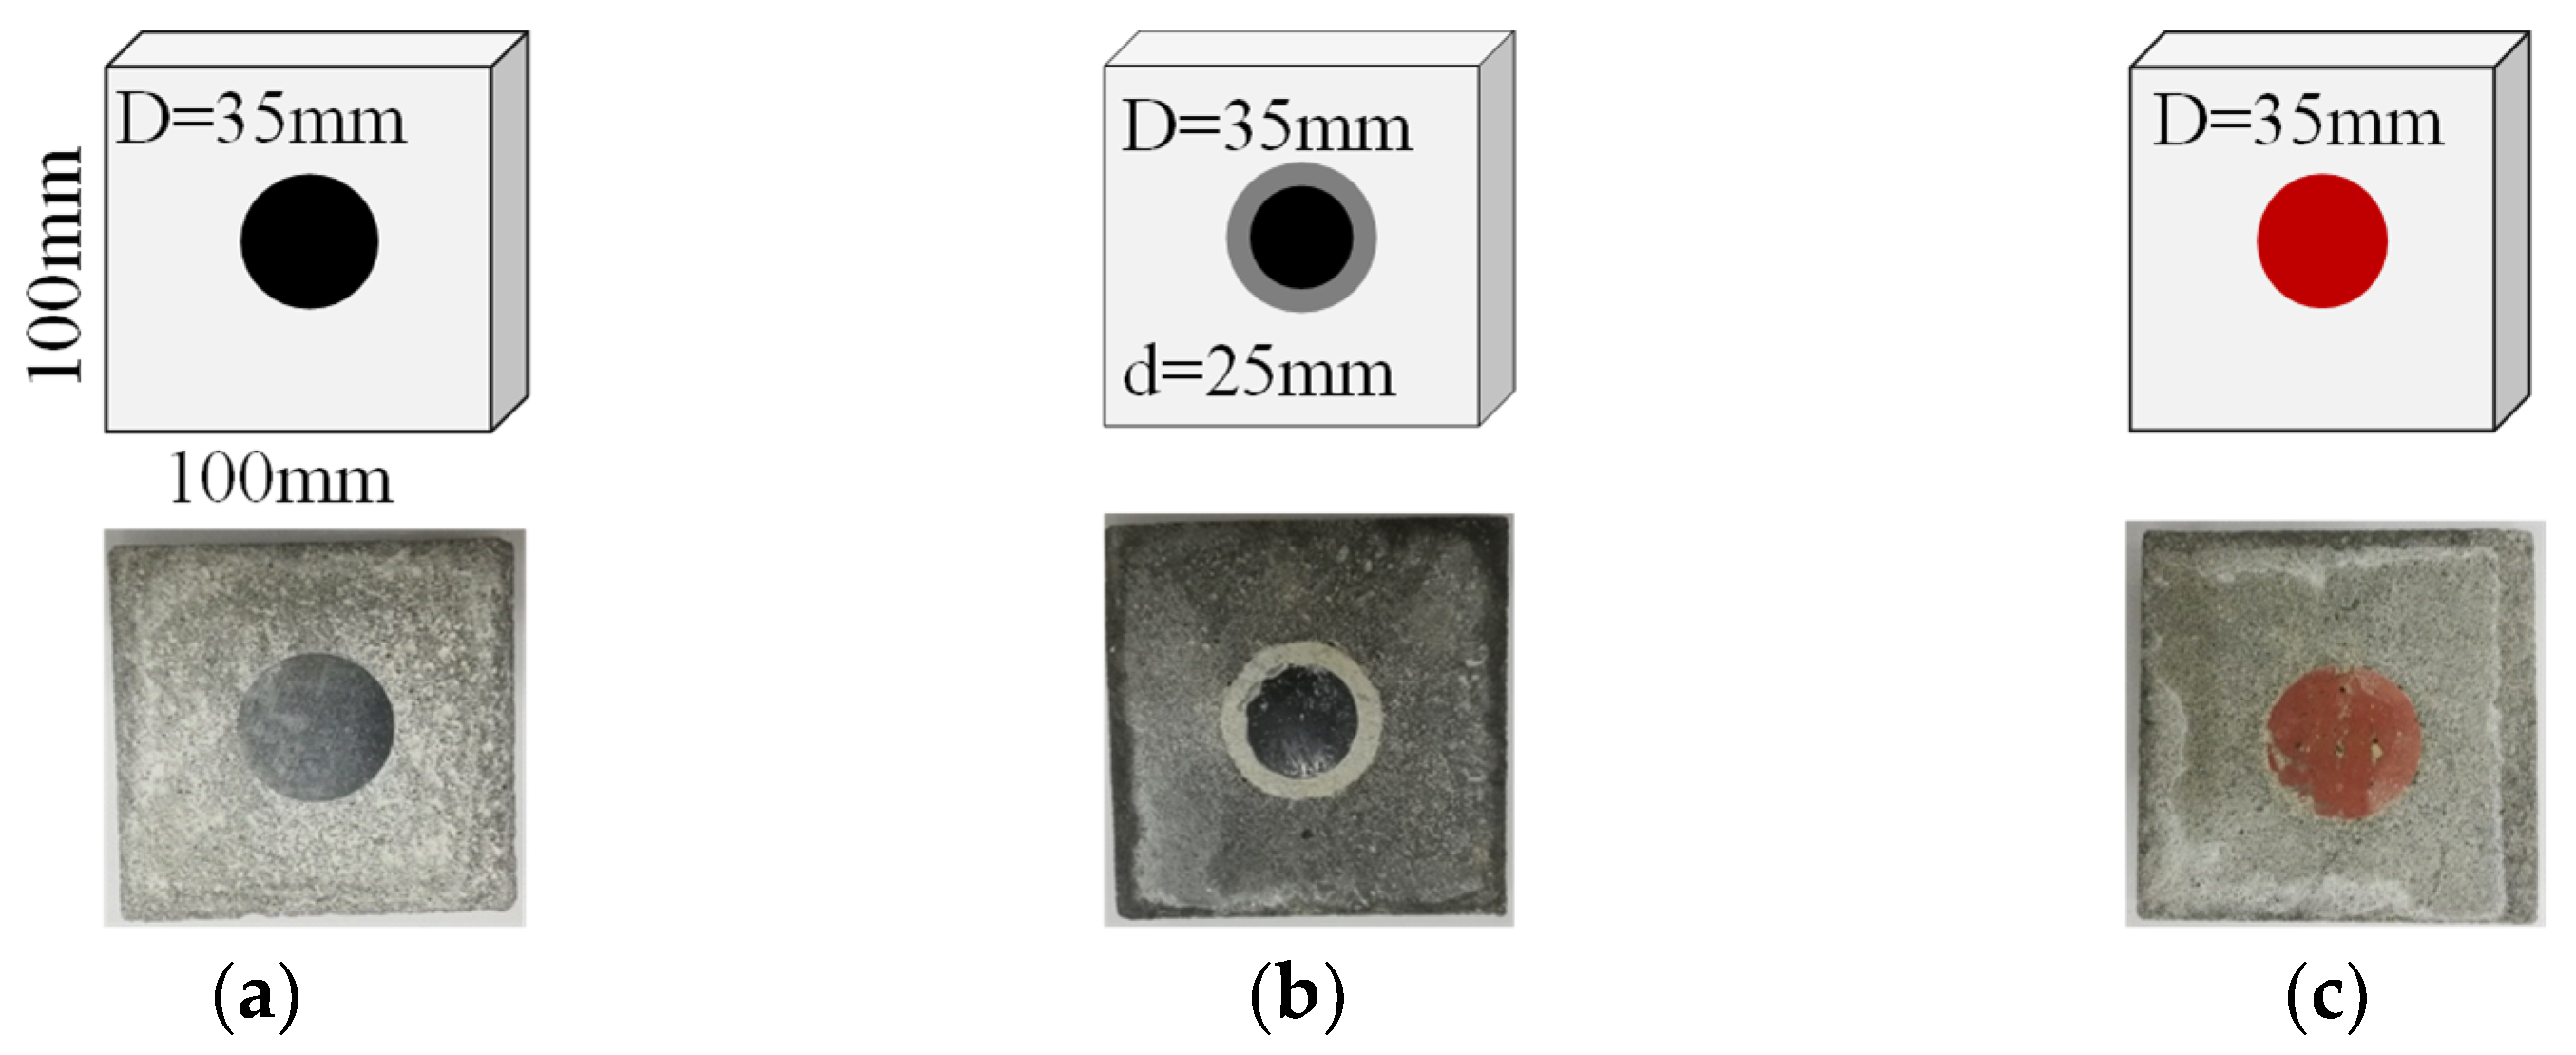
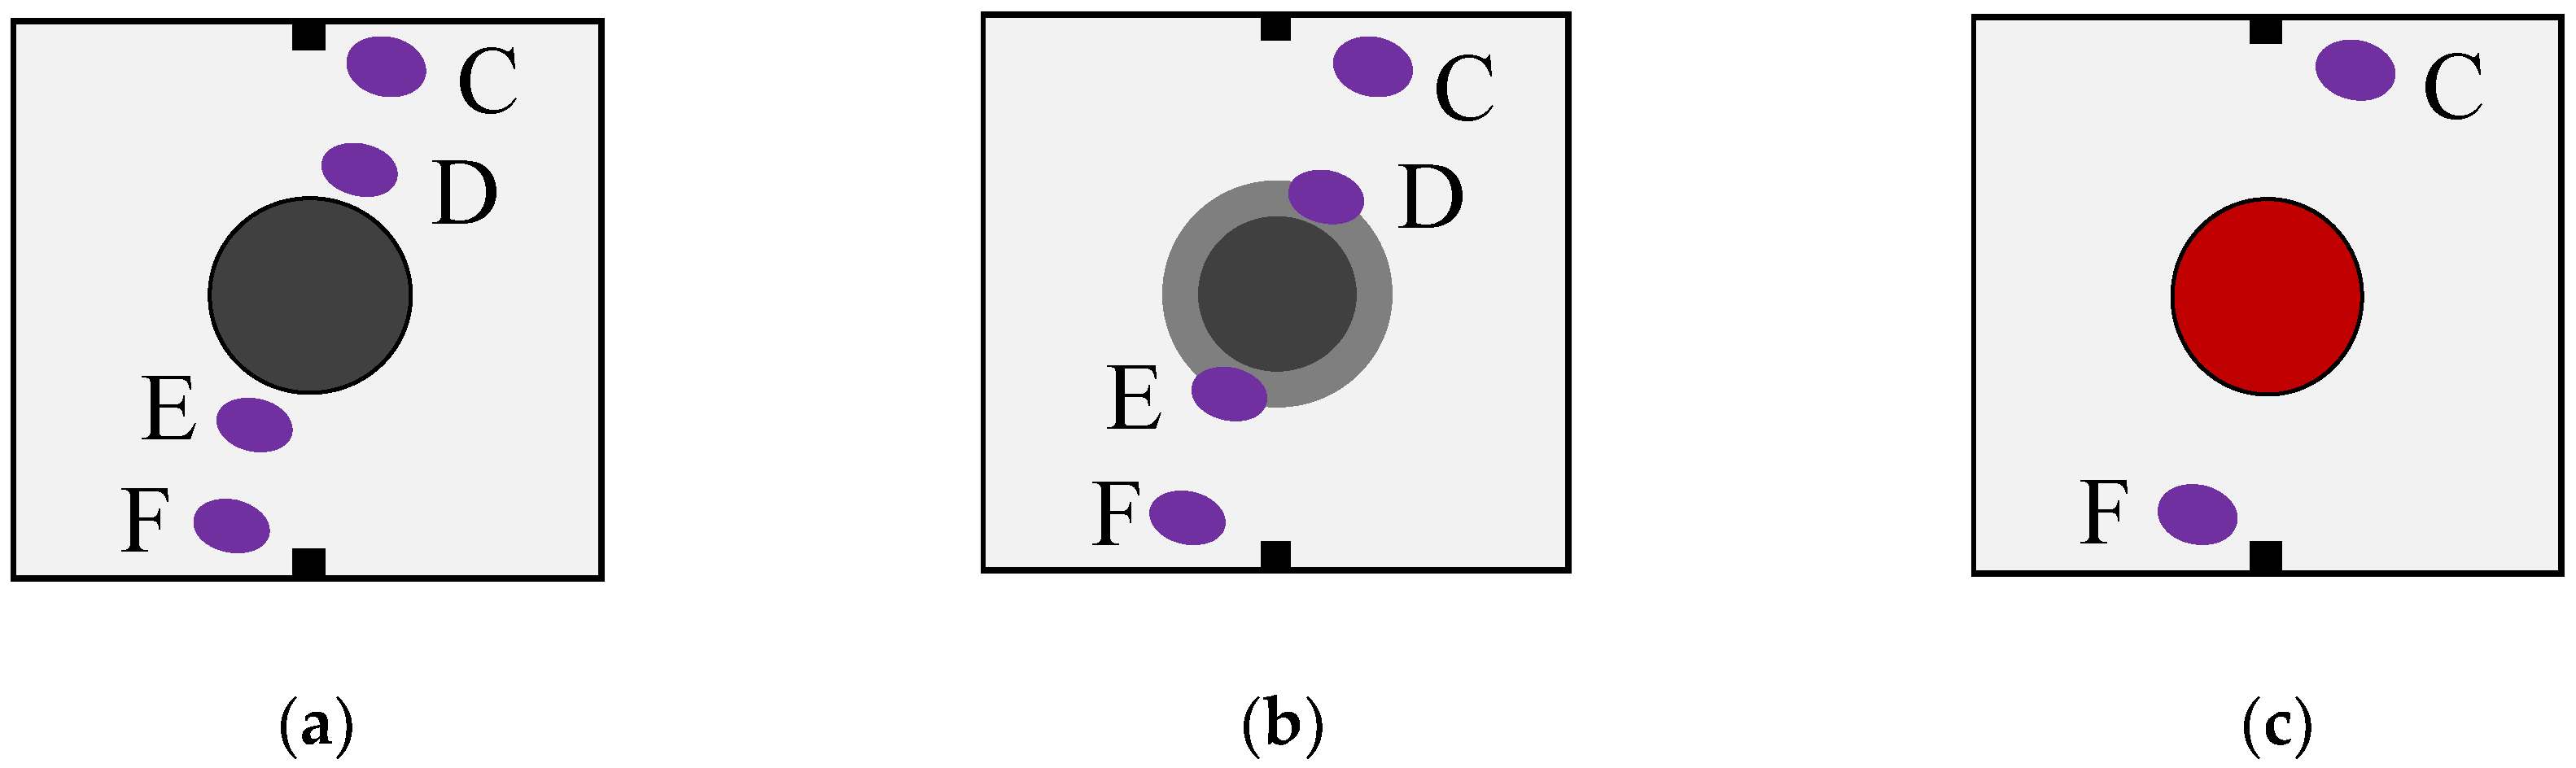
2.1. Modeled Concrete

Marble stone cylinder, with a size of 35 mm dimeter and 20 mm height, was used as the modeled natural aggregate to prepare the modeled natural concrete (MNC), as shown in Figure 1a. According to the viewpoint of the three-phase structure, recycled concrete can be divided into natural aggregate, old mortar, and new mortar. In this study, the recycled concrete is modeled, which is shown in Figure 1b (MRC). The modeled recycled aggregate was made with a marble stone cylinder of 25 mm diameter and a ring of old mortar with the thickness of 5 mm. Additionally, the modeled sintered clay brick aggregate with a diameter of 35 mm was also prepared to prepare modeled brick concrete (MBC), as illustrated in Figure 1c. In Figure 1, the dark, grey, and red colors are marble stone, old mortar, and sintered clay brick, respectively. The modeled concrete specimens had overall dimensions of 100 mm × 100 mm × 20 mm.
To cast modeled concrete specimens, the mortar needed to be poured surrounding the modeled aggregates. This is called the new mortar, with a mix proportion of cement:water:sand = 1:0.6:3. For the modeled recycled aggregate, the old mortar was mixed with a mix proportion of cement:water:sand = 1:0.5:3. The P.O. 42.5 cement was used as the binder agent conforming to Chinese standards. River sand of a size smaller than 1.18 mm was selected in this study.
The modeled natural aggregate concrete and the modeled brick aggregate concrete were made by pouring the new mortar surrounding the modeled aggregates. For the modeled recycled aggregate, it was made by pouring the old mortar surrounding the modeled natural aggregate of 25 mm diameter, which was located in the center of a cylindrical mold of 35 mm diameter and 20 mm height. Then, after one day of curing, the modeled recycled aggregate was demolded and assigned in the center of a plate mold of 100 mm × 100 mm × 20 mm. Then the new mortar was poured around the modeled recycled aggregate. All the specimens were cured in a standard curing room for 28 days.

2.2. Mechanical Properties of Each Phase

To grasp the basic physical properties of each phase of materials, such as density, elastic modulus, compressive strength, and Poisson’s ratio, specimens with a size of 40 mm × 40 mm × 80 mm were made of each material, i.e., marble stone, brick, old mortar, and new mortar. The density of the materials could be obtained by measuring their weight and volume. An electronic universal testing machine tested the compressive strength, modulus of elasticity, and Poisson’s ratio of the prismatic specimens, which are shown in Table 1 [19]. According to Table 1, the density of the natural aggregate was the highest, i.e., 2560 kg/m3. The densities of the new mortar and the old mortar were 2180 kg/m3 and 2209 kg/m3, respectively. The red clay brick had a relatively low density of 1810 kg/m3. Additionally, from Table 1, the compressive strength of the natural aggregate material was significantly higher than those of other materials, about 6 to 8 times that of the new and old mortar. The gap of the compressive strength between the natural aggregate and the brick was much greater. It was also found that a similar trend could be seen when the elastic moduli of these four materials were compared; however, they had similar Poisson’s ratios.

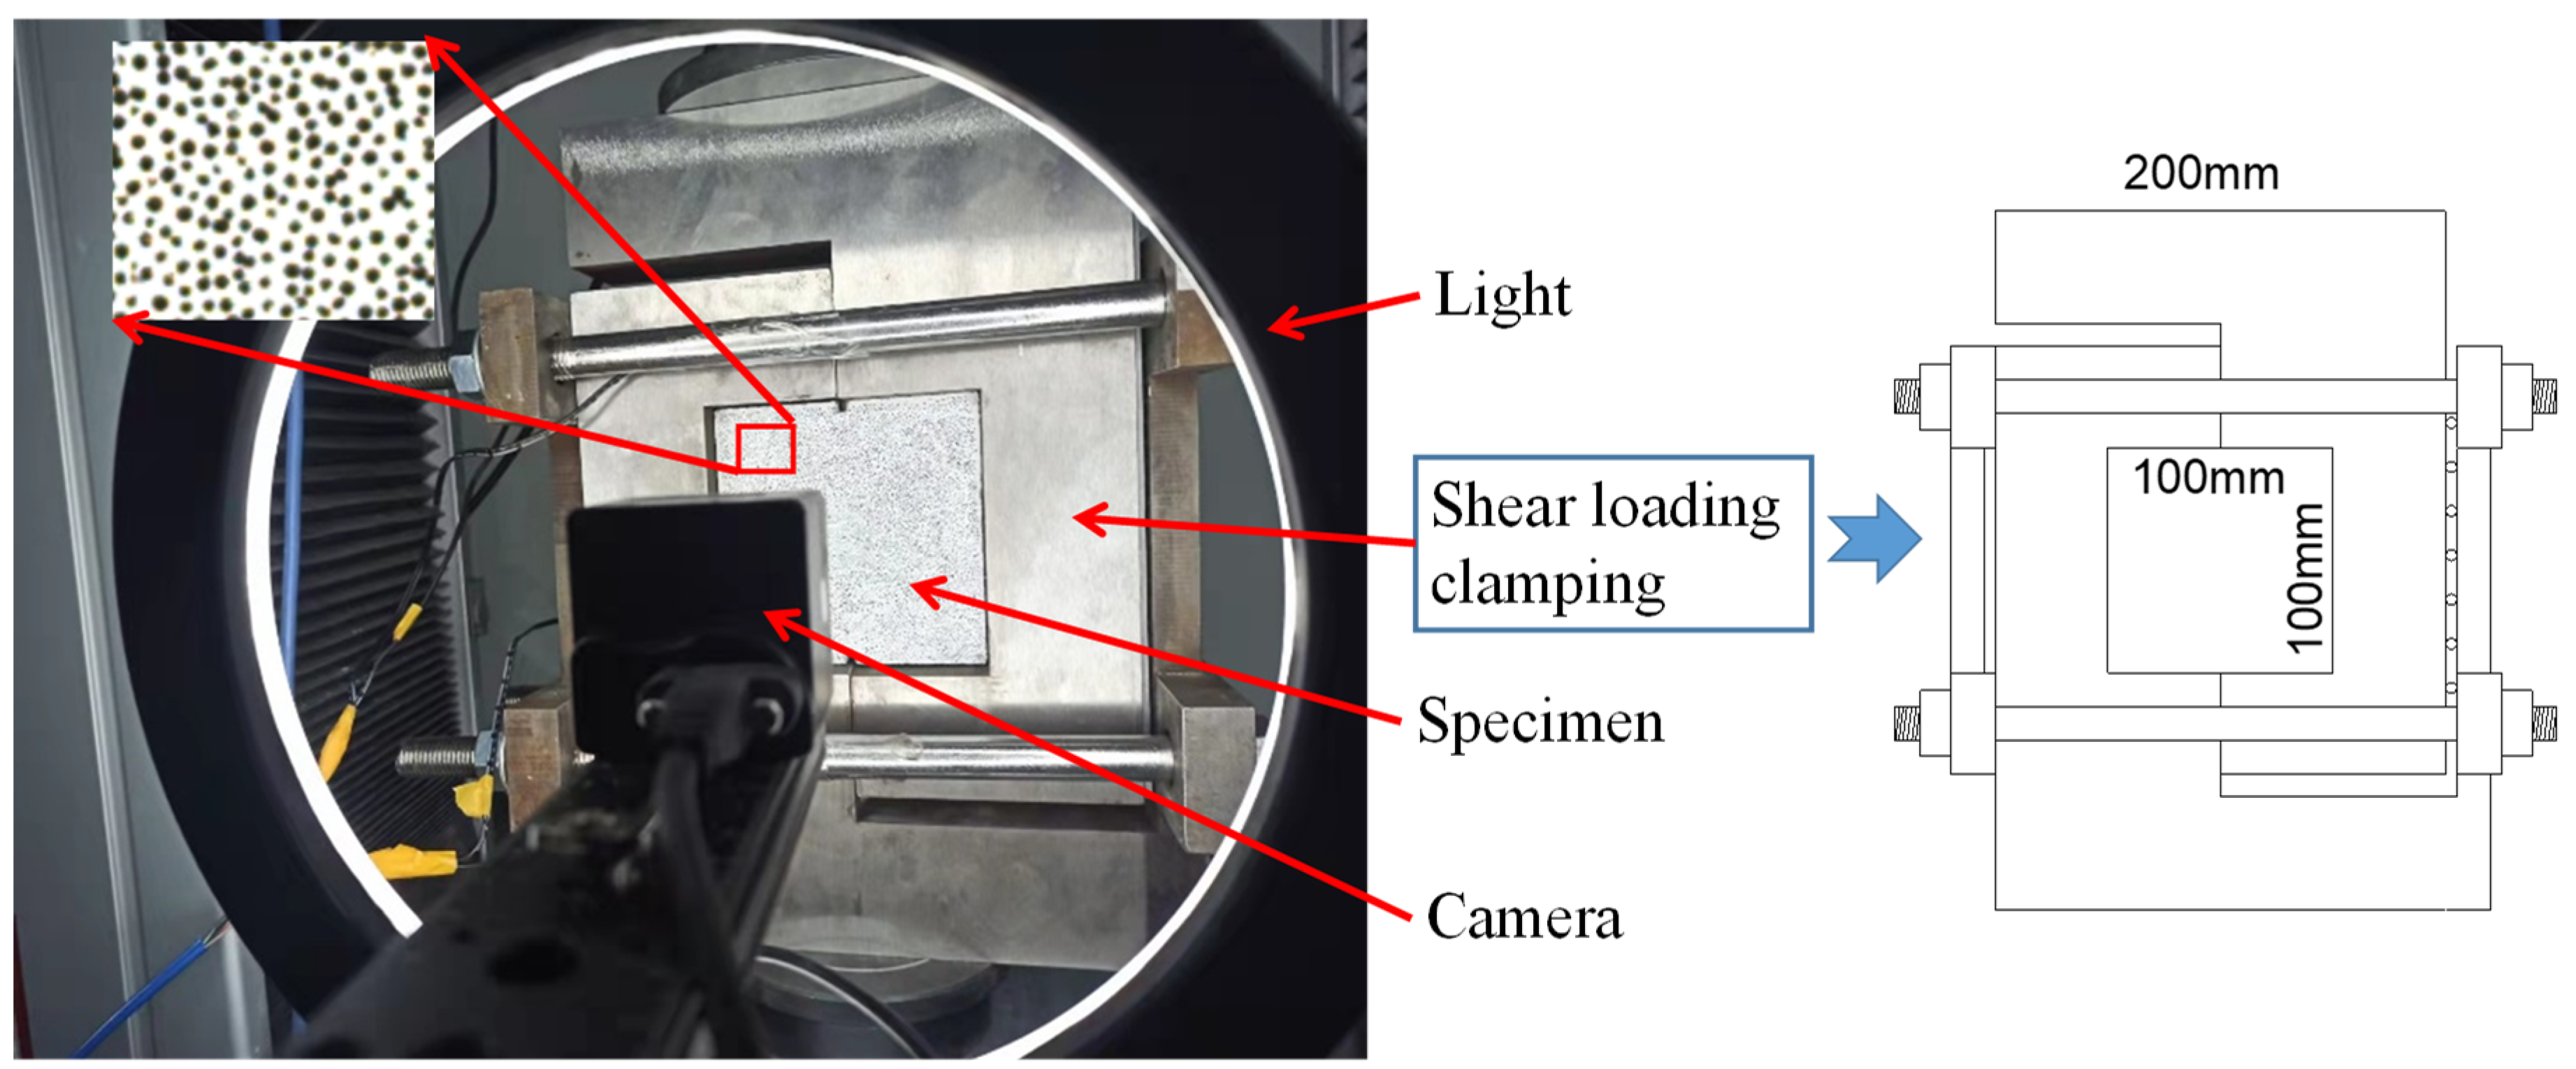
2.3. Digital Image Correlation

In this study, the Digital image correlation (DIC) technology was used to detect the full-field displacements of the specimens’ surfaces before and after deformation. First, randomly arranged speckles were sprayed on the surface of the modeled concrete. Then, by comparing the change of the relative position of these speckles acquired during the loading process, the displacement field could be constructed with DIC technology. The strain field could be obtained by deriving the derivative through the displacement field, and the mutation of the displacement field is the strain concentration, which can be conducive to analyzing the response of the internal structure of the modeled concrete to the external force, thereby revealing the crack propagation disciplines and failure mechanism.
The speckles were randomly signed on the specimen’s front surface (see Figure 2) with a marking pen, and the size of the speckles was about 0.7 mm. An industrial camera (model JHSM300f Jinghang Company, Shenzhen, China) was used to capture a pixel of 2048 × 1536. The visible range was about 150 mm × 120 mm. Therefore, the resolution could be calculated to be 0.08 mm/pixel. According to the related research [20,21], the size of the speckle is suitable for DIC technology and calculating the displacement distribution field.

2.4. Testing Procedure

The experimental testing setup is shown in Figure 2. In order to apply a shear force to the modeled concrete specimen, a shear loading clamping was designed, which is also shown in Figure 2. The clamping is divided into left and right pieces, which slide up and down to apply a shear force to the specimen. Four screws fixed the clamping together, and the strain gauges were arranged on the screws. The tensile force on the screws was converted by collecting the strains of the strain gauges. Two notches of 5 mm deep were cut as the guide cracks so that the crack developed along the middle of the specimen. Displacement loading was adopted, and the speed was 0.02 mm/s.

3. Results and Discussion

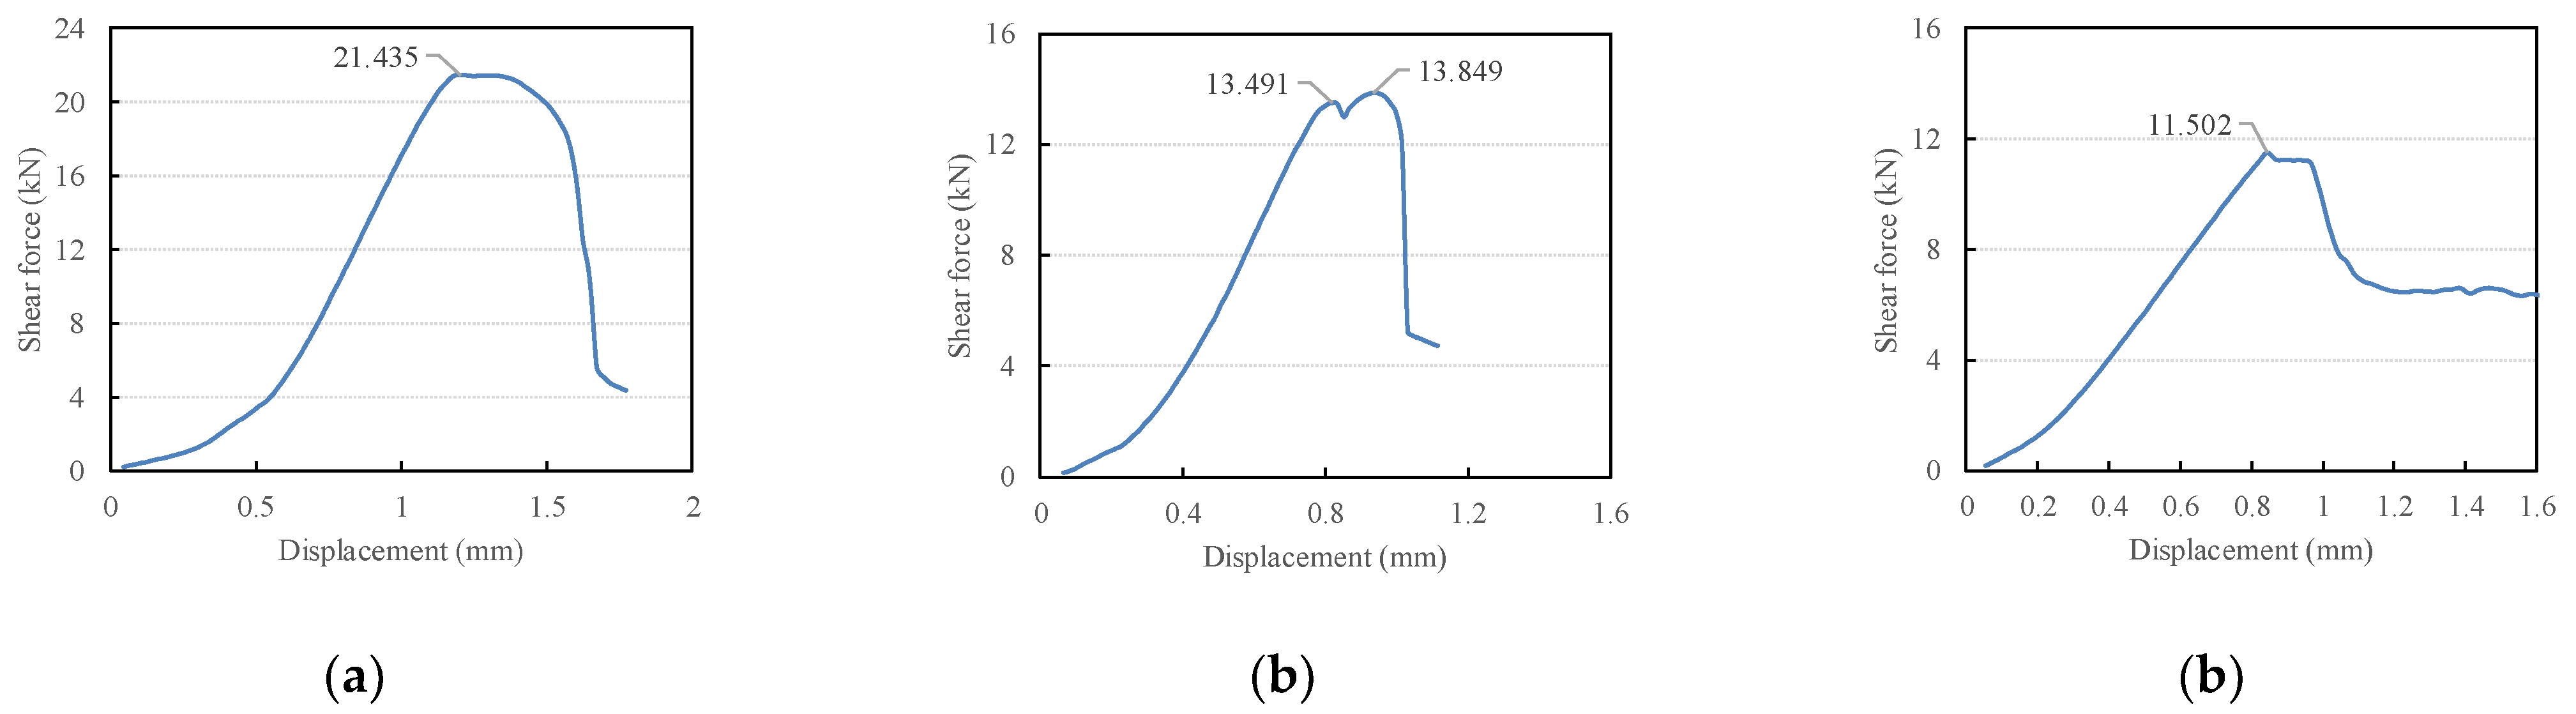
3.1. Mechanical Properties and Failure Modes

The force–displacement relationship curves of the three groups of modeled concrete are shown in Figure 3, in which MNC had the highest shear capacity, reaching 21.435 kN. The failure mode showed that the crack penetrated the ITZ between the natural aggregate and the mortar. The force–displacement curve of MRC illustrates that there were two force peaks; the first peak was 13.491 kN, and the second peak was higher, reaching 13.849 kN. It results from that, in recycled concrete, that there are new ITZs and old ITZs. Among them, the stress concentration in the old ITZ was more severe and developed earlier. Therefore, the crack first occurred in the old ITZ, and the shear force reached the first peak; then the crack ran through the new ITZ, and the second peak was reached. The strain concentration and crack propagating will be discussed in more detail with the help of DIC in the following part. For MBC, as the strength of the brick aggregate was lower than that of the surrounding mortar, once a crack was generated, the crack ran through the brick aggregate. Therefore, the shear strength of MBC was the lowest at 11.502 kN. After comparison, it is not difficult to find that the destructive cracks are preferred to pass through the brick aggregate MBC; however, the cracks of ordinary concrete and recycled concrete often passed through the ITZ between natural aggregate and mortar.

3.2. Modeled Natural Concrete

During the shear loading of the MNC specimen, the displacement field was obtained according to the DIC analysis on the speckles of the specimen surface. The horizontal displacement fields at 80%, 90%, and 100% of the peak load are shown in Figure 4a–c, respectively. It could be seen that when the load reached 80% of the peak load, the surface strain field showed an abrupt change along the ITZ on the lower right side of the modeled aggregate, which indicates that cracks may have propagated. When the load reached 90% of the peak load, there were obvious displacement fields on the left and right sides of the modeled aggregate. The displacement difference between the lower right corner of the specimen and the modeled aggregate was about 0.8 pixels, which can be converted to 0.064 mm, indicating that the crack width reached 0.064 mm. The displacement deviation between the upper left corner of the specimen and the modeled aggregate was about 0.7 pixels, which is 0.056 mm. When the load increased to the peak load, the abrupt displacement field on both sides of the aggregate reached 1.4 pixels. That is, the crack width reached 0.112 mm. It is needed to note that the displacement field nephogram in Figure 4 is the displacement field after eliminating the rigid displacement. It means that the displacement of the modeled aggregate in the center of the specimen was almost zero. It is clear that the upper left corner of the specimen moved to the left, and the displacement value was negative. At the same time, the lower right corner moved to the right, and the displacement value was positive.
Figure 5 shows the displacement field along the vertical direction, and Figure 5a–c are at 80%, 90%, and 100% of the peak force, respectively. A positive value (red) indicates upward movement, and a negative value (purple) indicates downward movement. It could be seen that the right side of the specimen moved downward, and the left side moved upward. At 80% of the peak force, the specimen’s right side near the top displaced downward by 0.67 pixels, or 0.055 mm, and the left side of the specimen near the bottom displaced upward by 0.89 pixels, or 0.071 mm. When the load increased to 90% of the peak force, the displacements on the left and right sides of the specimen were positive and negative, respectively. The mortar on the left side and the modeled aggregate moved upward as a whole, and the specimen’s right side moved downward, which indicates that the overall penetrating crack had occurred. The relative displacement of the left and right sides of the specimen was 1.95 pixels, or 0.156 mm. When the peak load was reached, the relative displacement of the left and right sides of the specimen reached 2.48 pixels, which is 0.198 mm.
The development crack could be seen more clearly with the strain nephogram illustrated in Figure 6. Figure 6a shows the horizontal strain of the MNC specimen when the load reached 80% of the peak force. It could be seen from the figure that the strain concentration first appeared in the pre-cutting groove on the lower side of the specimen and penetrated through the ITZ. The strain concentration also appeared near the pre-cutting groove on the upper side of the specimen. However, the strain concentration degree was relatively small. When the load increased to 90% of the peak load (Figure 6b), obvious strain concentrations appeared on the modeled aggregate’s upper and lower sides and developed along the ITZ, and the maximum horizontal tensile strain reached 0.0099. As the load continued to increase to the peak load (see Figure 6c), the strain concentration was further intensified, and the development of cracks could be seen.
Figure 7 shows the nephogram of the strain in the vertical direction, and Figure 7a–c are 80%, 90%, and 100% of the peak loads, respectively. According to Figure 7a, along the shear path, there were two compressive strain concentration zones (purple and blue) on the upper and lower sides of the specimen. The strain concentration near the lower load application end was the largest, reaching 0.0045, which does not exceed the compressive crushing strain of the mortar [22]. When the load increased to 90% of the peak load, the obvious strain concentration zones increased to four; two were close to the load application end, and the other two were close to the modeled aggregate. Additionally, the lower right side of the aggregate showed an obvious tensile strain concentration due to cracking, that is, the red area in Figure 7b. When the peak load was reached, the mortar near the lower clamping had been crushed, and the maximum compressive strain reached 0.0109.
Figure 8 shows the shear strain nephogram. The clockwise shear strain was positive, and the counterclockwise shear strain was negative. When the peak load was 80%, there were obvious shear strain concentration zones at the upper notch and the lower notch, and the strain concentration zone at the lower notch extended to the ITZ and developed along the ITZ. When the load increased to 90% or even 100% of the peak load, the shear strain concentration was further enhanced, and the shear strain concentration area at the upper notch also extended to the ITZ.

3.3. Modeled Recycled Concrete

Figure 9 shows the horizontal displacement field of MRC. Because the displacement field calculation eliminated the rigid body displacement, the position of the central aggregate remained unchanged. The left half of the specimen moved left, and the right half moved right when the shear load increased; this is similar to MNC. There were new ITZ and old ITZ in MRC. Figure 9b shows cracks developing along the new ITZ at 90% of the peak load. When the load reached the peak load, the crack in the lower right corner of the specimen developed into the old ITZ (see Figure 9c), and the crack in the new ITZ closed. This should be a result from the redistribution of the internal force after cracks appeared in the weak parts of the concrete [19].
Figure 10 shows the displacement nephogram in the vertical direction. At 80% of the peak load, there was no obvious phenomenon that the left side of the specimen moved upward and the right side moved downward. This phenomenon occurred when the load increased to 90% of the peak load. The modeled recycled aggregate in the middle of the specimen moved upward with the left half of the specimen. This trend was more severe when the load increased to the peak load. The maximum upward displacement of the left half of the specimen reached 1.07 pixels, and the maximum downward displacement of the right half of the specimen was 1.26 pixels. The relative displacement of the left and right sides was 2.33 pixels (0.186 mm), which is slightly smaller than that of MNC. This shows that recycled concrete has a lower shear strength than ordinary concrete and has a smaller shear deformation capacity.
According to the nephogram of the horizontal strain field (Figure 11), the crack development process could be observed. At 80% of the peak load, the strain concentration started from notches and developed to the new ITZ. The boundary of recycled aggregate could be observed from Figure 11a. However, when the load increased to 90% of the peak load, the strain concentration area on the lower side of the specimen shifted to the old ITZ, the ITZ between the natural aggregate and old mortar. The strain concentration in the new ITZ almost disappeared, which is consistent with the displacement nephograms in Figure 9. When the load continued to increase to the peak load, the strain concentration further intensified, and the strain concentration on the lower side of the modeled recycled aggregate extended to the old mortar.
Figure 12 shows the vertical strain nephogram. Four compressive strain concentration zones could be found between the upper and lower notches (see Figure 12a). There were two on the upper side of the modeled aggregate, which were close to the upper loading clamping piece and close to the natural aggregate, and they were almost connected. For MRC, the vertical compressive strain concentration close to the natural aggregate developed in the old mortar zone. There were also two strain concentration areas on the lower side of the modeled aggregate, which were close to the loading clamping piece and located in the old mortar zone, and the strain concentration was relatively weak. In addition, there was a little tensile strain in the lower part of the strain nephogram, that is, the red area on the lower side of Figure 12a–c, which surface defects of the specimen may have caused. When the load increased to 90% of the peak load, the compressive strain concentration further intensified and extended to the whole old mortar area (Figure 12b shows the old mortar ring). At the peak load, the strain concentration of the old mortar on the upper side of the natural aggregate was the most prominent, and the maximum compressive strain reached 0.0046. This exceeded the compressive crushing strain of the mortar, and the compressive failure of the old mortar could also be observed in the test.
According to the shear strain nephogram in Figure 13, a phenomenon similar to MNC could also be found. The shear strain occurred at the tip of notches and developed to the ITZ. At 80% of the peak load, the shear strain at the lower side of the modeled aggregate occurred in the new ITZ. With the increase of the load, the shear strain concentration in the new ITZ degenerated, while the shear strain concentration in the old ITZ developed. Moreover, it developed into cracks, consistent with the previous displacement field analysis and horizontal strain field analysis.

3.4. Modeled Brick Aggregate Concrete

The horizontal displacement field nephogram of MBC is shown in Figure 14. When the load increased to 80% of the peak load, the whole specimen rotated clockwise. Therefore, the upper part of the specimen moved to the right, and the lower part moved to the left (see Figure 14a). However, different from MNC and MRC, the displacement field of the specimen was relatively uniform, and the brick aggregate did not distort the displacement field. This should result from the elastic modulus of the brick aggregate being much lower than that of the surrounding hardened mortar. Therefore, the brick aggregate deformed with the surrounding hardened mortar. The elastic modulus of natural aggregate was larger than that of hardened mortar, resulting in stress concentration and the distortion of the displacement field. When the load increased to 90% of the peak, according to Figure 14b, there was a distortion along the upper and lower notches between the left side and the right side of the specimen, which indicates that the shear crack may have propagated. When the load increased to the peak force, the distortion of the displacement field became more serious, according to Figure 14c.
The vertical displacement field nephogram (Figure 15) shows that the specimen had an overall downward displacement. The downward displacement of the upper right corner was greater, and the downward displacement of the lower-left corner was relatively small, indicating that the whole specimen rotated clockwise simultaneously. At 80% of the peak load, the displacement field was a continuous and gradual nephogram (see Figure 15a). At 90% of the peak load, the displacement field on the left and right sides had a sudden change, and the difference was 3.42 pixels (see Figure 15b), which is 0.274 mm, indicating that the left and right sides of the test piece had a dislocation 0.274 mm. When the load increased to the peak force, a 4.24-pixel distortion occurred between the left and right sides of the specimen, which is 0.339 mm, according to Figure 15c.
The development of cracks could be seen according to the nephogram of the horizontal strain field, as shown in Figure 16. When the peak load was 80%, according to the nephogram of strain field Figure 16a, a horizontal tensile strain concentration zone in the brick aggregate could be found in the middle of the specimen, and the strain concentration degree was the strongest. Tensile strain concentration zones could also be found near notches, caused by the stress concentration. When the load increased to 90% of the peak load, the strain concentration zone in the brick aggregate developed into a penetrated crack. For MBC, because the strength of the brick aggregate was much lower than that of the hardened mortar, the crack first occurred in the brick aggregate.
According to Figure 17a, there were only two vertical compressive strain concentration zones in MBC, varying from MNC and MRC. There was only one strain concentration either on the upper side of the brick aggregate or on the lower side. When the load increased to 90% of the peak load, the brick aggregate’s tensile strain concentration zone began to breed. It is necessary to note that the strain concentration was formed inside the brick aggregate instead of the ITZ. When the peak load was reached, this vertical tensile strain concentration became more serious (see Figure 17c (red area)). In addition, according to Figure 16c, the specimen had a vertical penetrated crack, and there was a horizontal tensile strain along the crack. Therefore, the red area in Figure 17c is tensioned in both horizontal and vertical directions. It was in a two-way tensile state, and the crack of the specimen was first developed from this position.
Figure 18 shows the developing process of the shear strain with the increase of the load, and the shear strain concentration zones first occurred at notches. The shear strain concentration zone ran through the whole specimen when the load increased to 90% and 100% of the peak load.

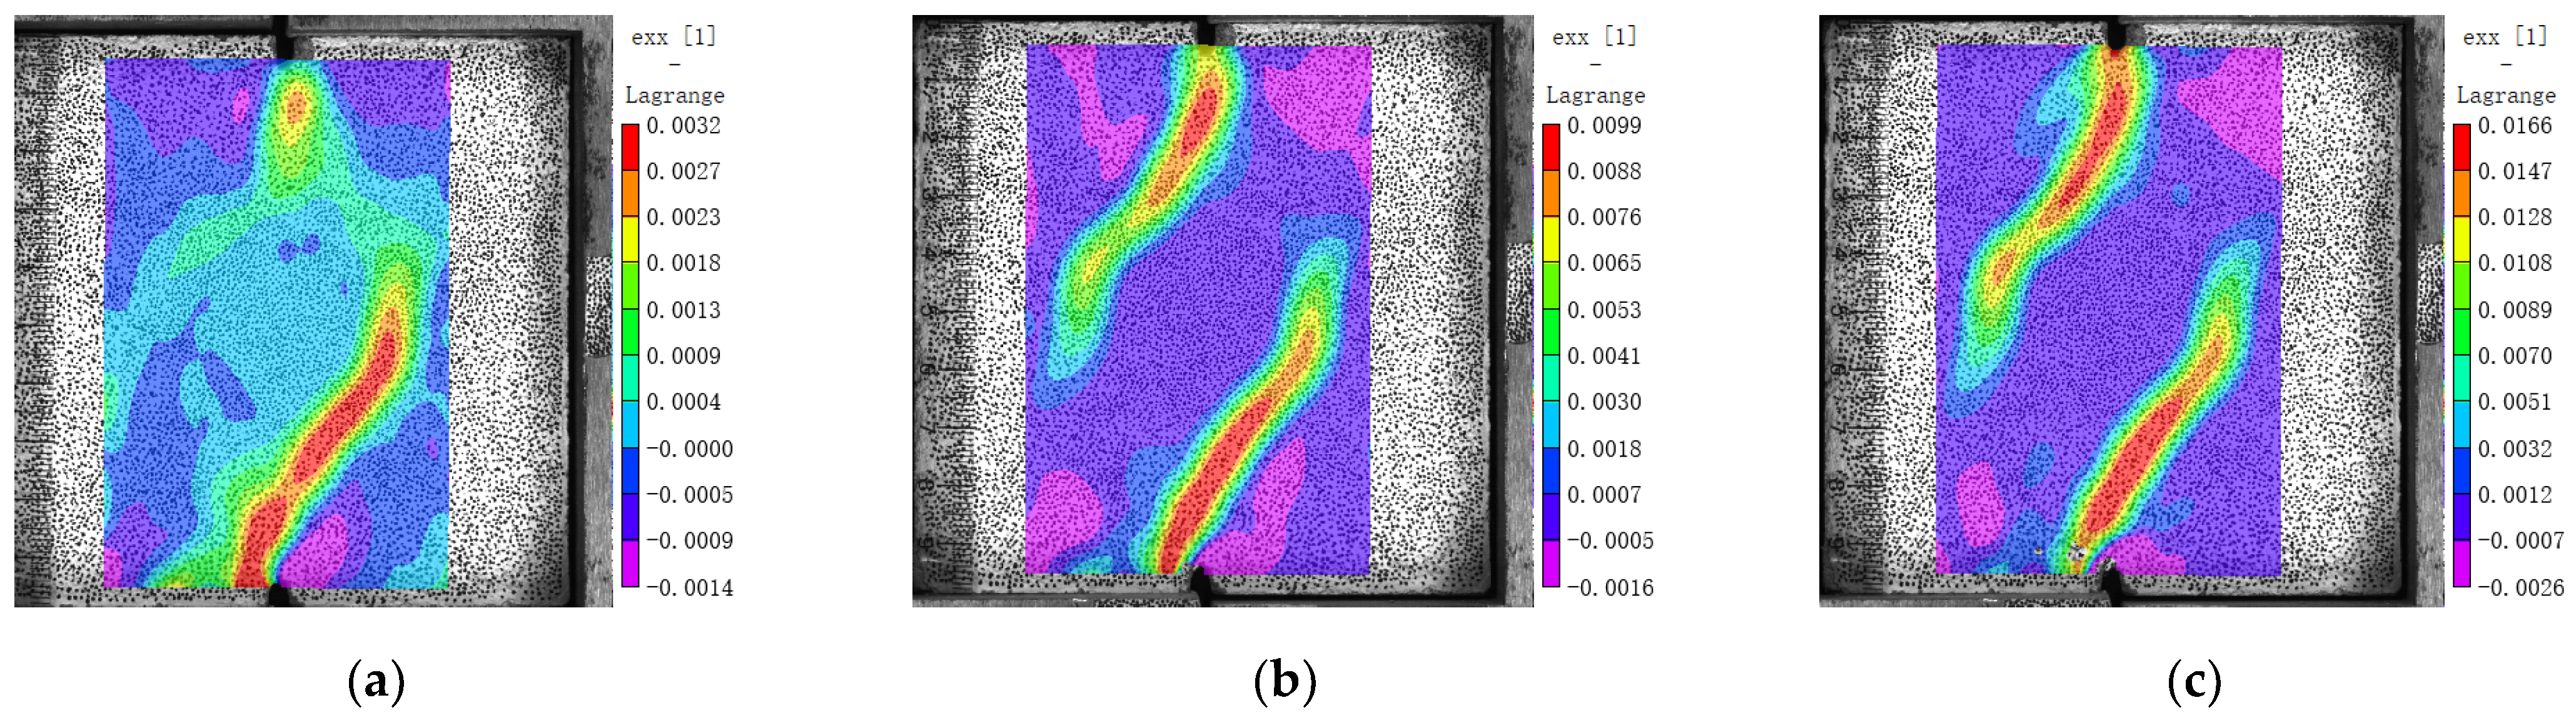
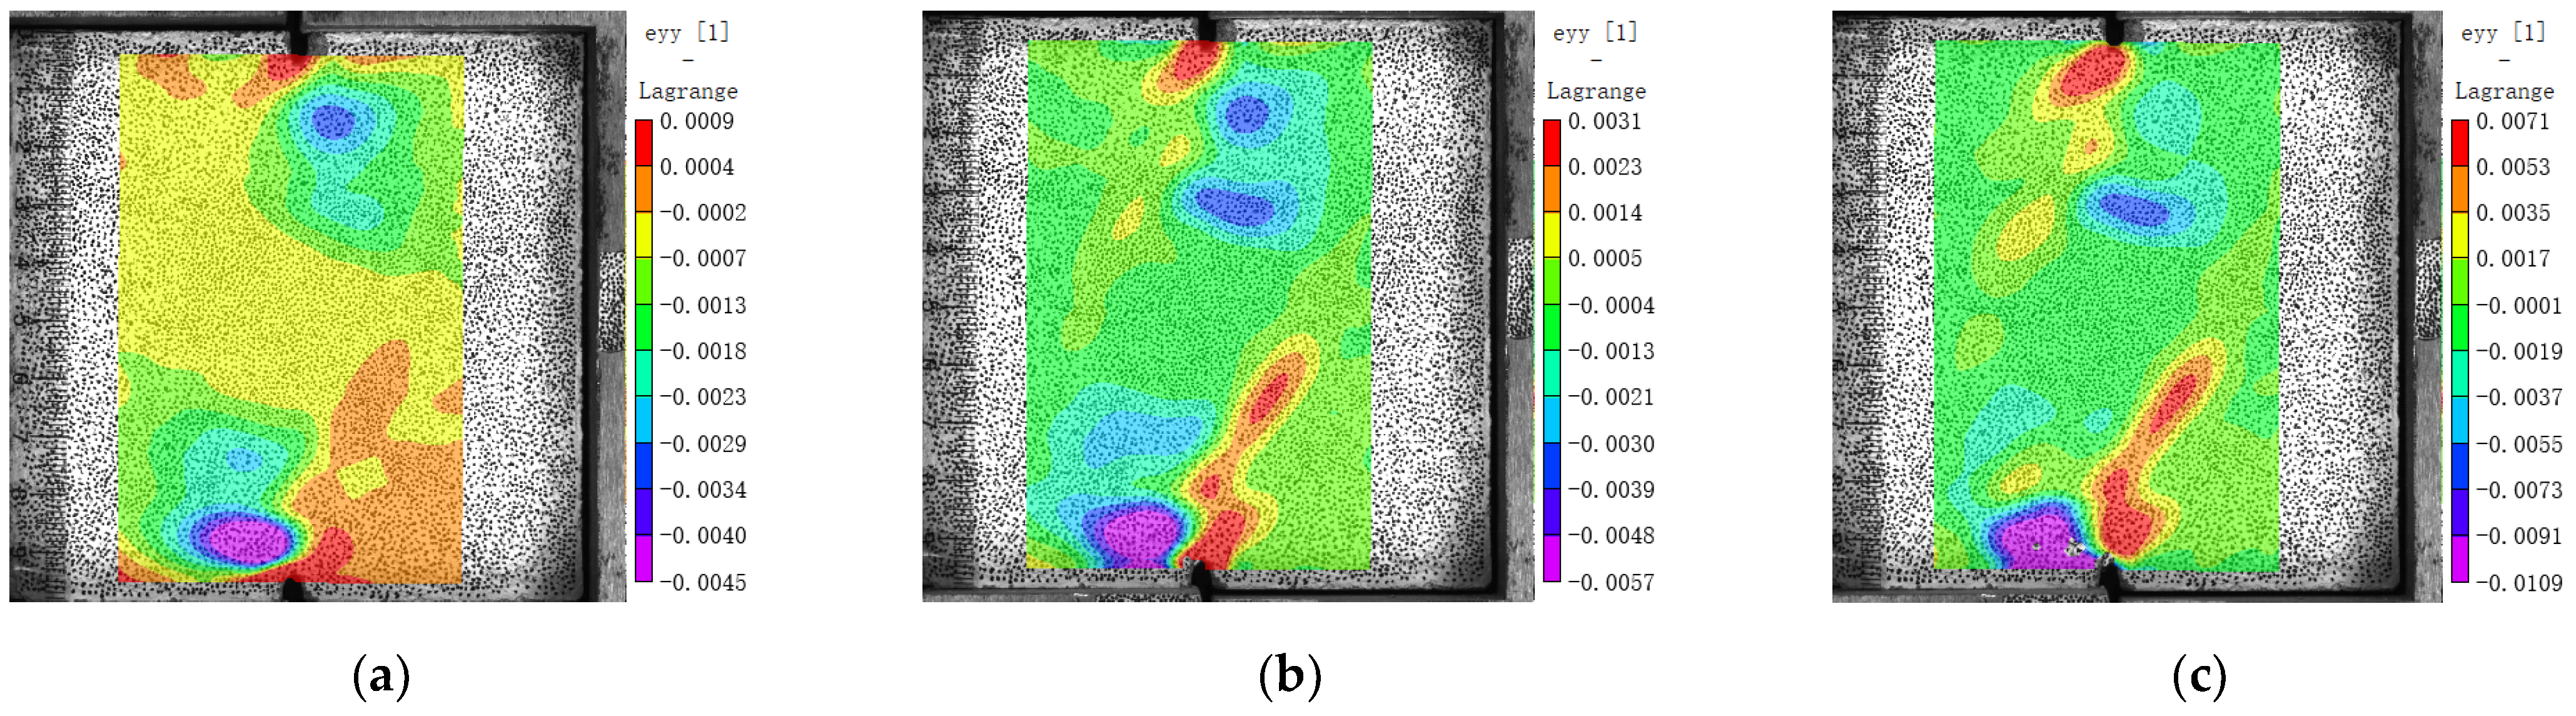
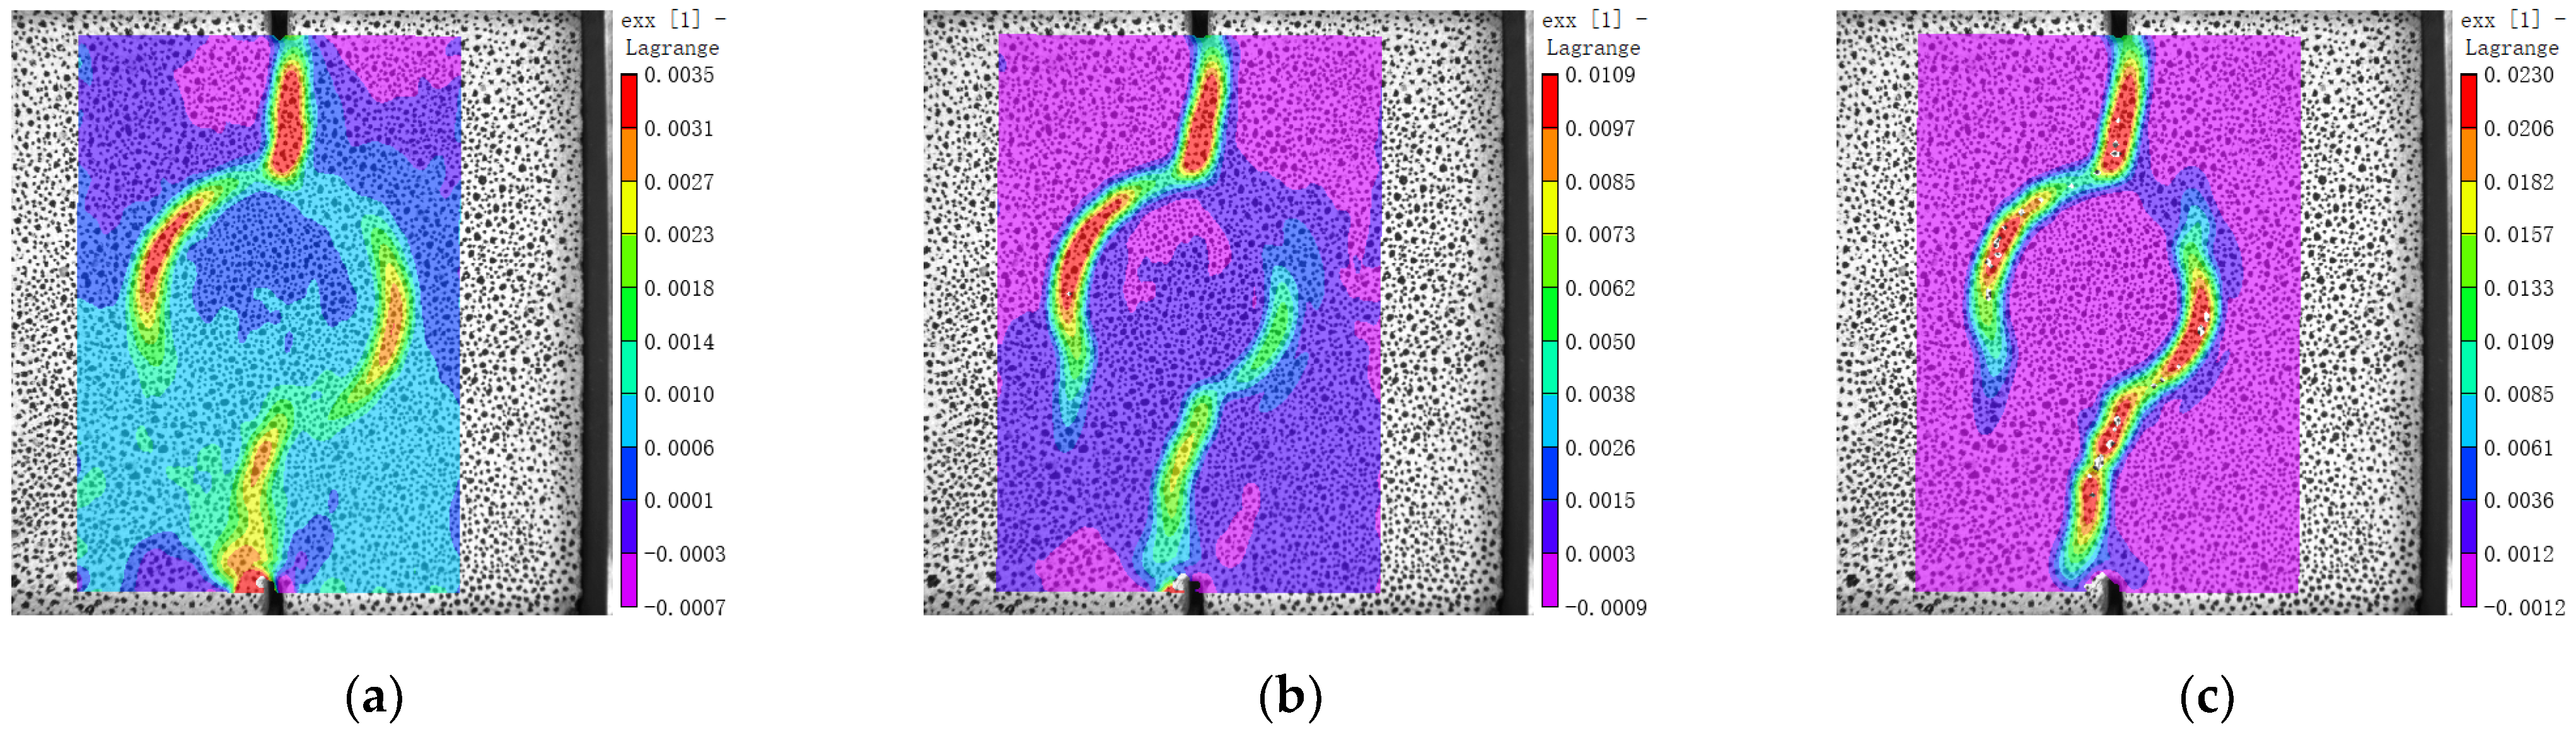
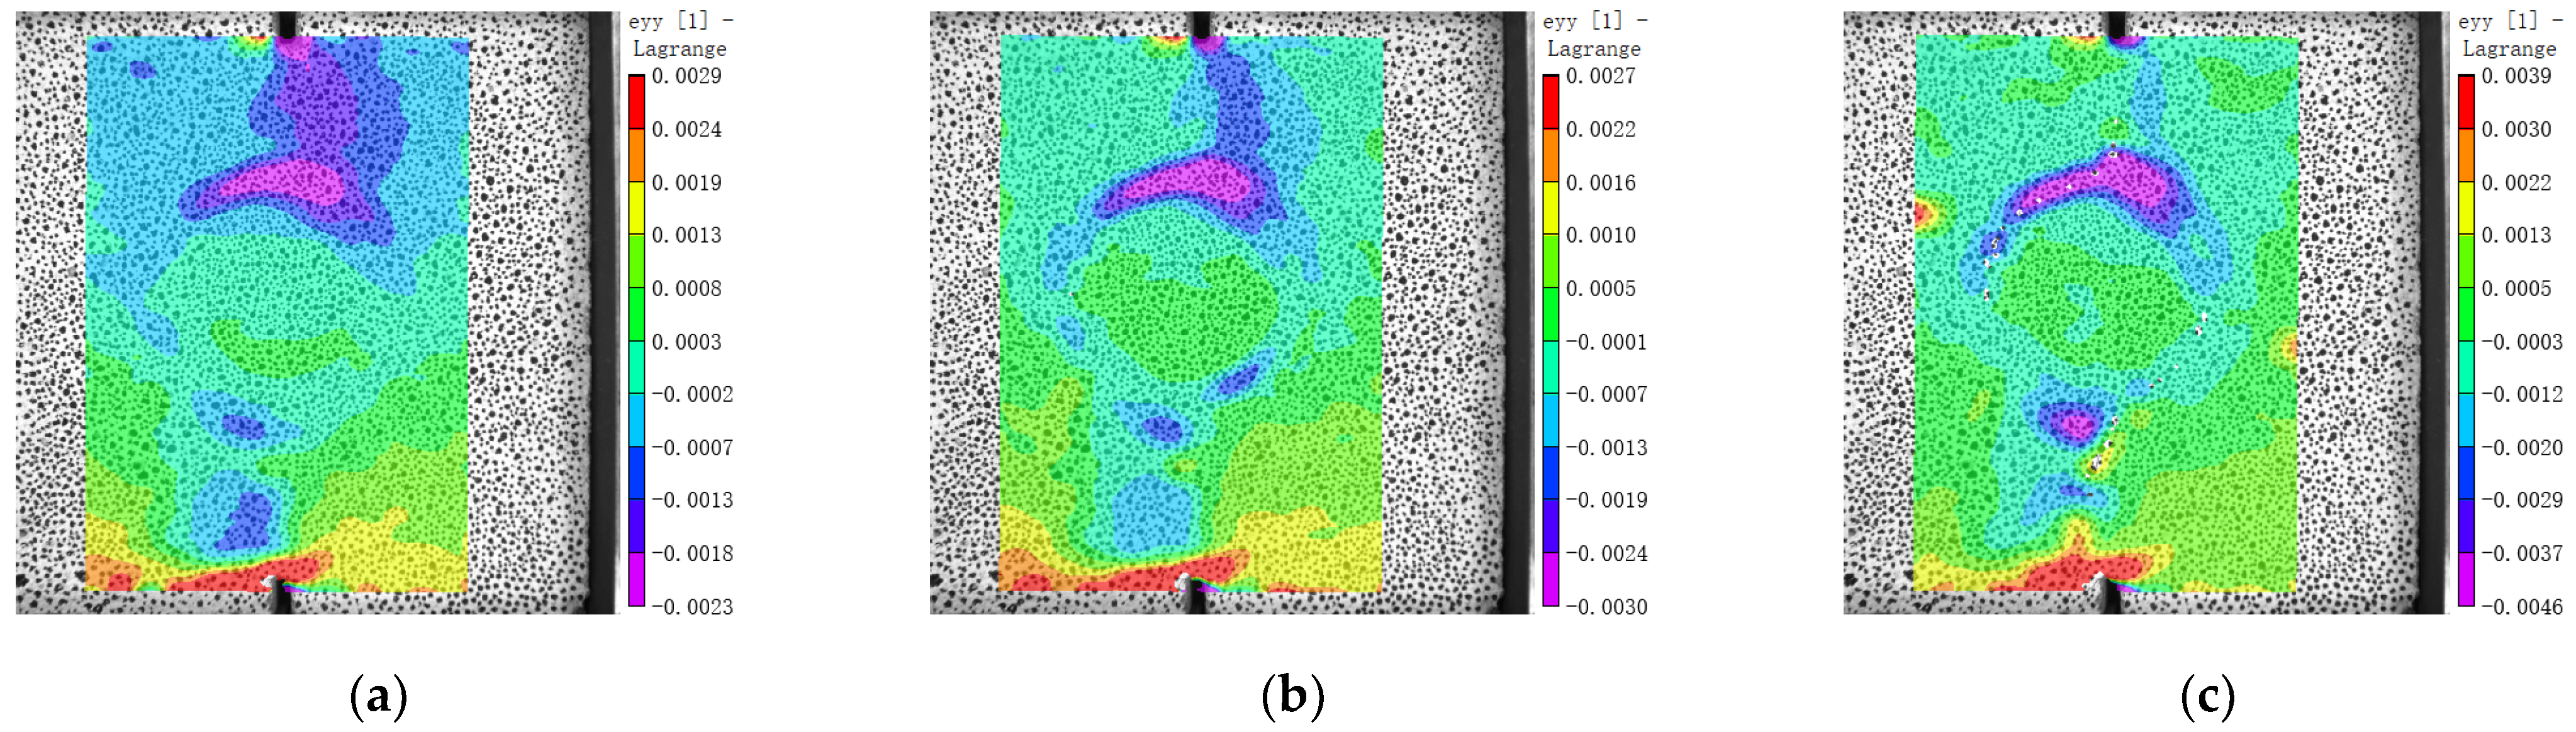
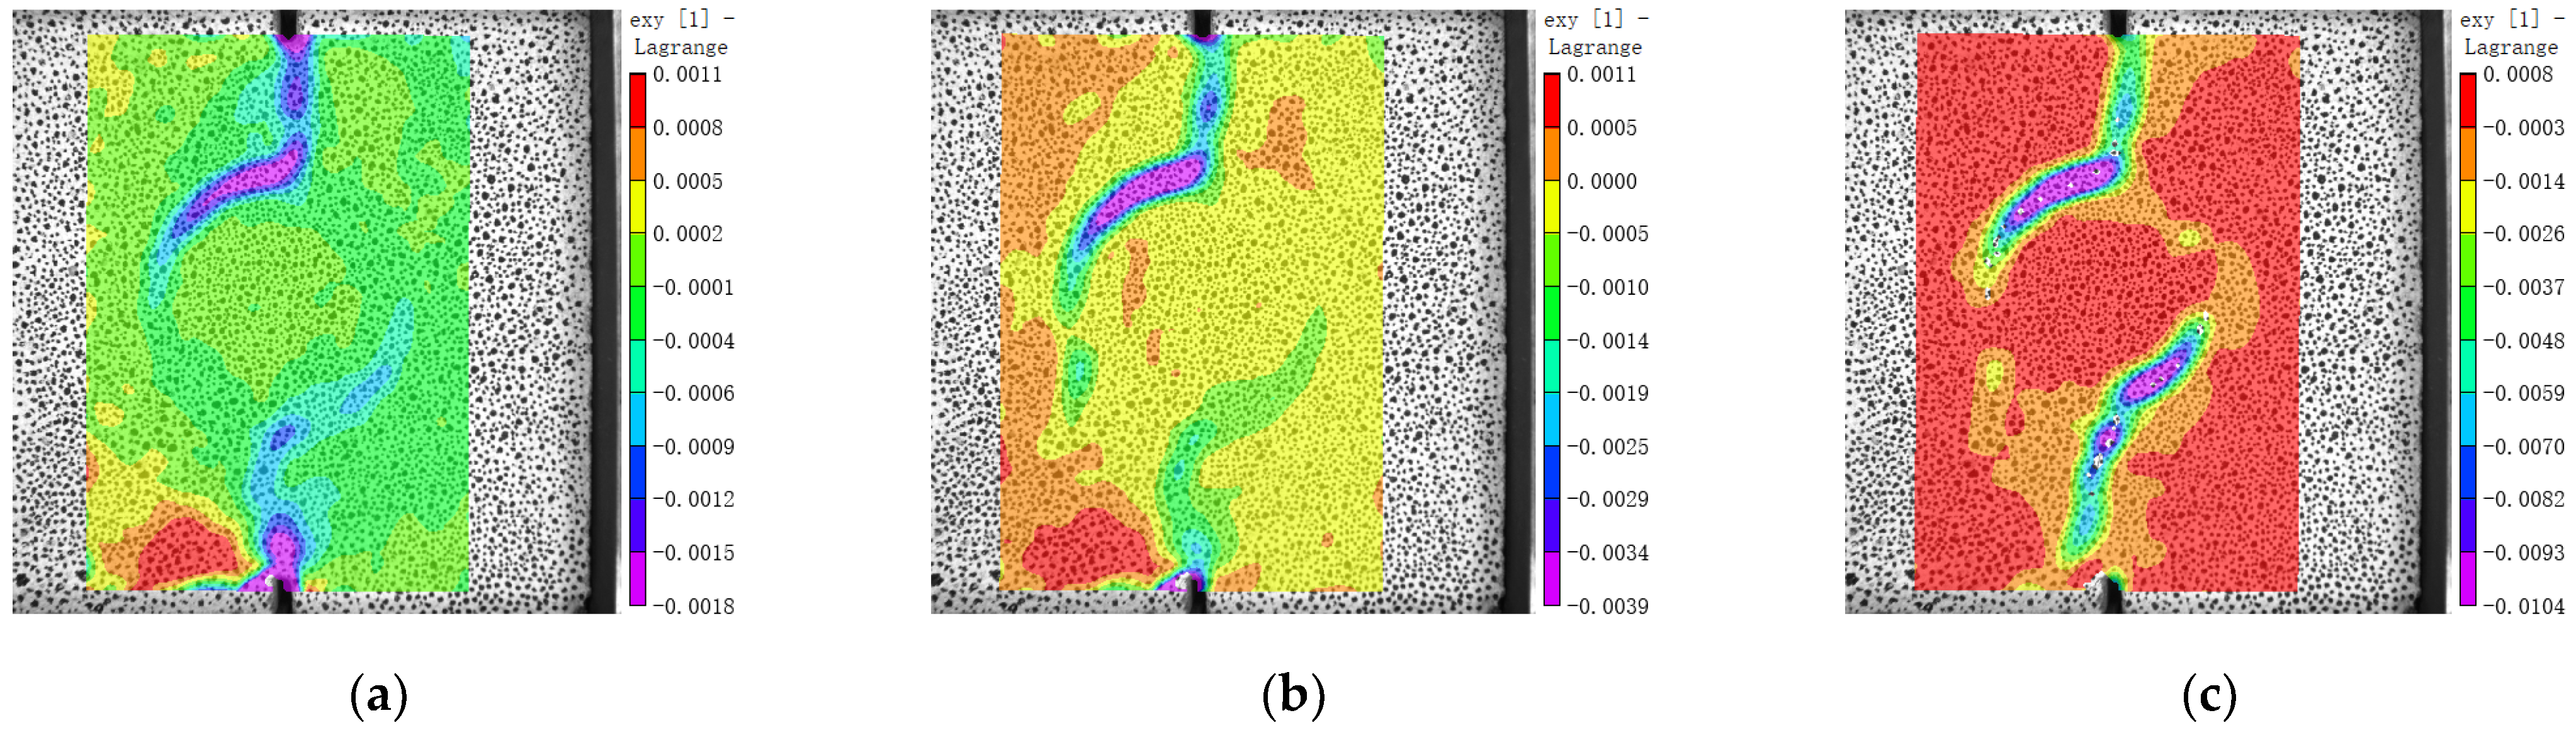
3.5. Internal Force and Strain Concentration

The designed shear loading clamping had one piece moving down and one piece moving up to apply a shear force to the specimen. In order to analyze the external force on the specimen and the internal force inside the specimen, schematic diagrams were drawn, as shown in Figure 19. Figure 19a shows the rotation of the specimen caused by the dislocation of the loading clamping. Although the rotation angle was very small, the contact between the specimen and the clamping could be seen during the test, and these contact positions exerted external pressure on the specimen, as shown in Figure 19b. Taking the left half of the specimen as an example, the internal force could be analyzed according to the force balance principle, as shown in Figure 19c. There must be an internal shear force along the shear plane when considering the vertical force balance. When the balance of horizontal force was considered, there was also a normal pressure on the shear plane. Moreover, there must be pressure traces between the two pressure loading areas, A and B, as shown in Figure 19d.
The specimen bore shear and compression along the shear plane. The shear strength would have been improved when compression was exerted on the shear plane. In order to obtain the horizontal force exerted by the loading clamping, four strain gauges were arranged on the four bolts for fixing the clamping pieces. Measurements show that the average tensile strain on the bolts was about 20 μ. According to the section area of the bolt (π × 162/4) and elastic modulus (210 GPa), the compressive force on the bolt was F = (20 × 10−6) (210 × 103) × (π × 162/4) = 844 N. The compression along the horizontal direction would have caused an increase in shear strength for the concrete. According to the previous study, the coefficient is generally 0.3 [23]. That is, the horizontal compression of 844 N would have caused the shear strength of the specimens to increase by about 253 N, which is negligible relative to the shear strength of the specimens, above 10,000 N. In addition, the force on the bolts was similar for each group of specimens; therefore, it was feasible to use this method to analyze the shear failure mechanism of modeled concrete specimens.
According to the above results and analysis, the crack propagation can be summarized as shown in Figure 20. When MNC is damaged by shear, the crack develops along the ITZ, as illustrated in Figure 20a, in which the red line represents the crack. The cracks of MRC also develop from notches first, then extend along the new ITZ, and penetrate from the old mortar into the old ITZ (see Figure 20b). The failure mode of MBC is different from the other two groups. Once the crack occurs, it penetrates through the brick aggregate (see Figure 20c) because the strength of brick aggregate is also low.
According to the strain concentration zones analysis, it can be summarized that there are four vertical compressive strain concentration zones C, D, E, and F along the pressure zone between the two pressure loading areas (see Figure 21a). The strain concentration zones C and F are close to the pressure loading areas, and D and E are close to the aggregate due to the higher elastic modulus of natural aggregate than the hardened mortar. The orthogonal direction to the compressive stress trace bears tensile stress.
The failure mode of MRC is similar to that of MNC. There are also four vertical compressive strain concentration zones between two pressure loading areas. Additionally, it could be found that D and E are located in the old mortar, as illustrated in Figure 21b.
There are only two vertical compressive strain concentration zones, C and F (see Figure 21c) due to the lower elastic modulus of brick aggregate than the surrounding hardened mortar.

4. Conclusions

According to the investigation on the performance of the modeled concrete containing natural aggregate, recycled aggregate, and brick aggregate under shear loading, the following conclusions can be drawn:
  • The shear strength of MNC is the highest, followed by MRC, and the shear strength of MBC is the lowest. The strength of natural aggregate concrete is high, and the bite effect is the strongest. The recycled aggregate also contains a natural aggregate, which also contributes to the bite effect in shear failure. The strength and elastic modulus of brick aggregate is lower than that of the hardened mortar, so there is no bite effect in MBC.
  • The failure mechanism of MNC is that the cracks develop from notches and pass through the ITZ. The failure law of MRC is similar, but the cracks will pass through the old mortar from the new ITZ and continue to develop in the old ITZ. MBC cracks propagate and develop from the inside of the aggregate and run through the whole aggregate
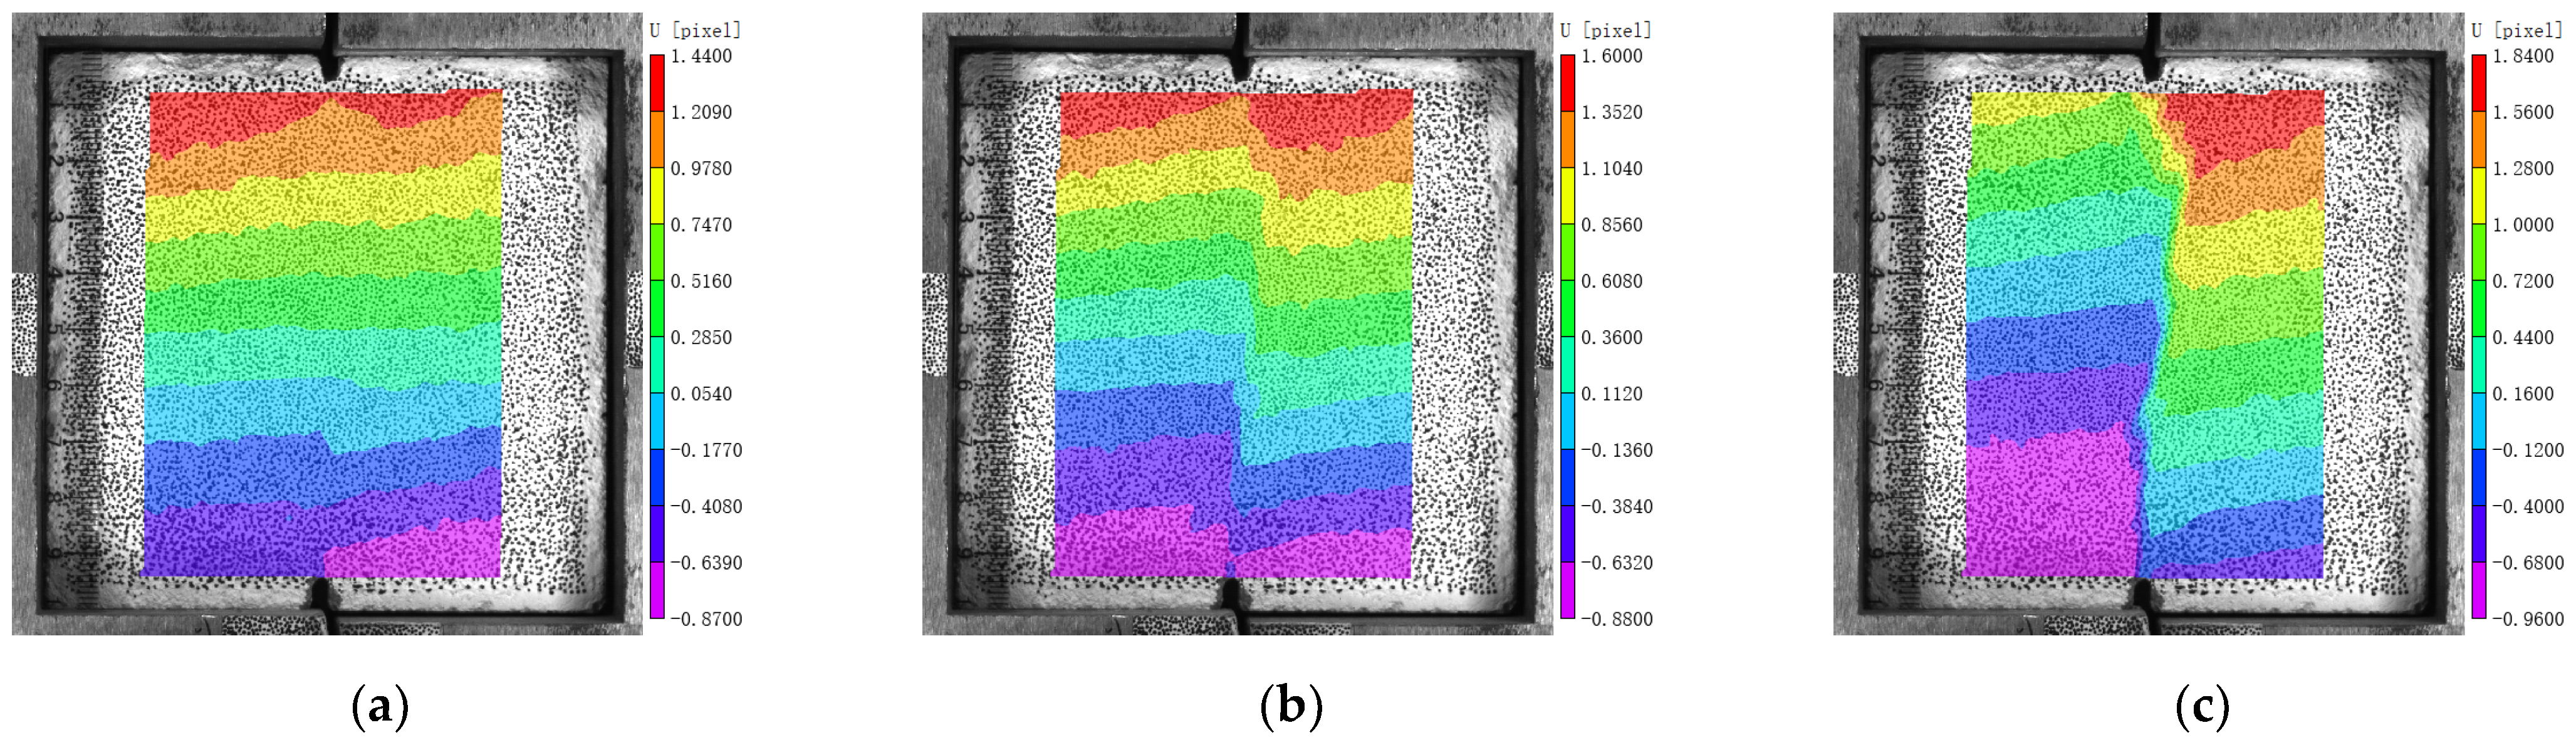
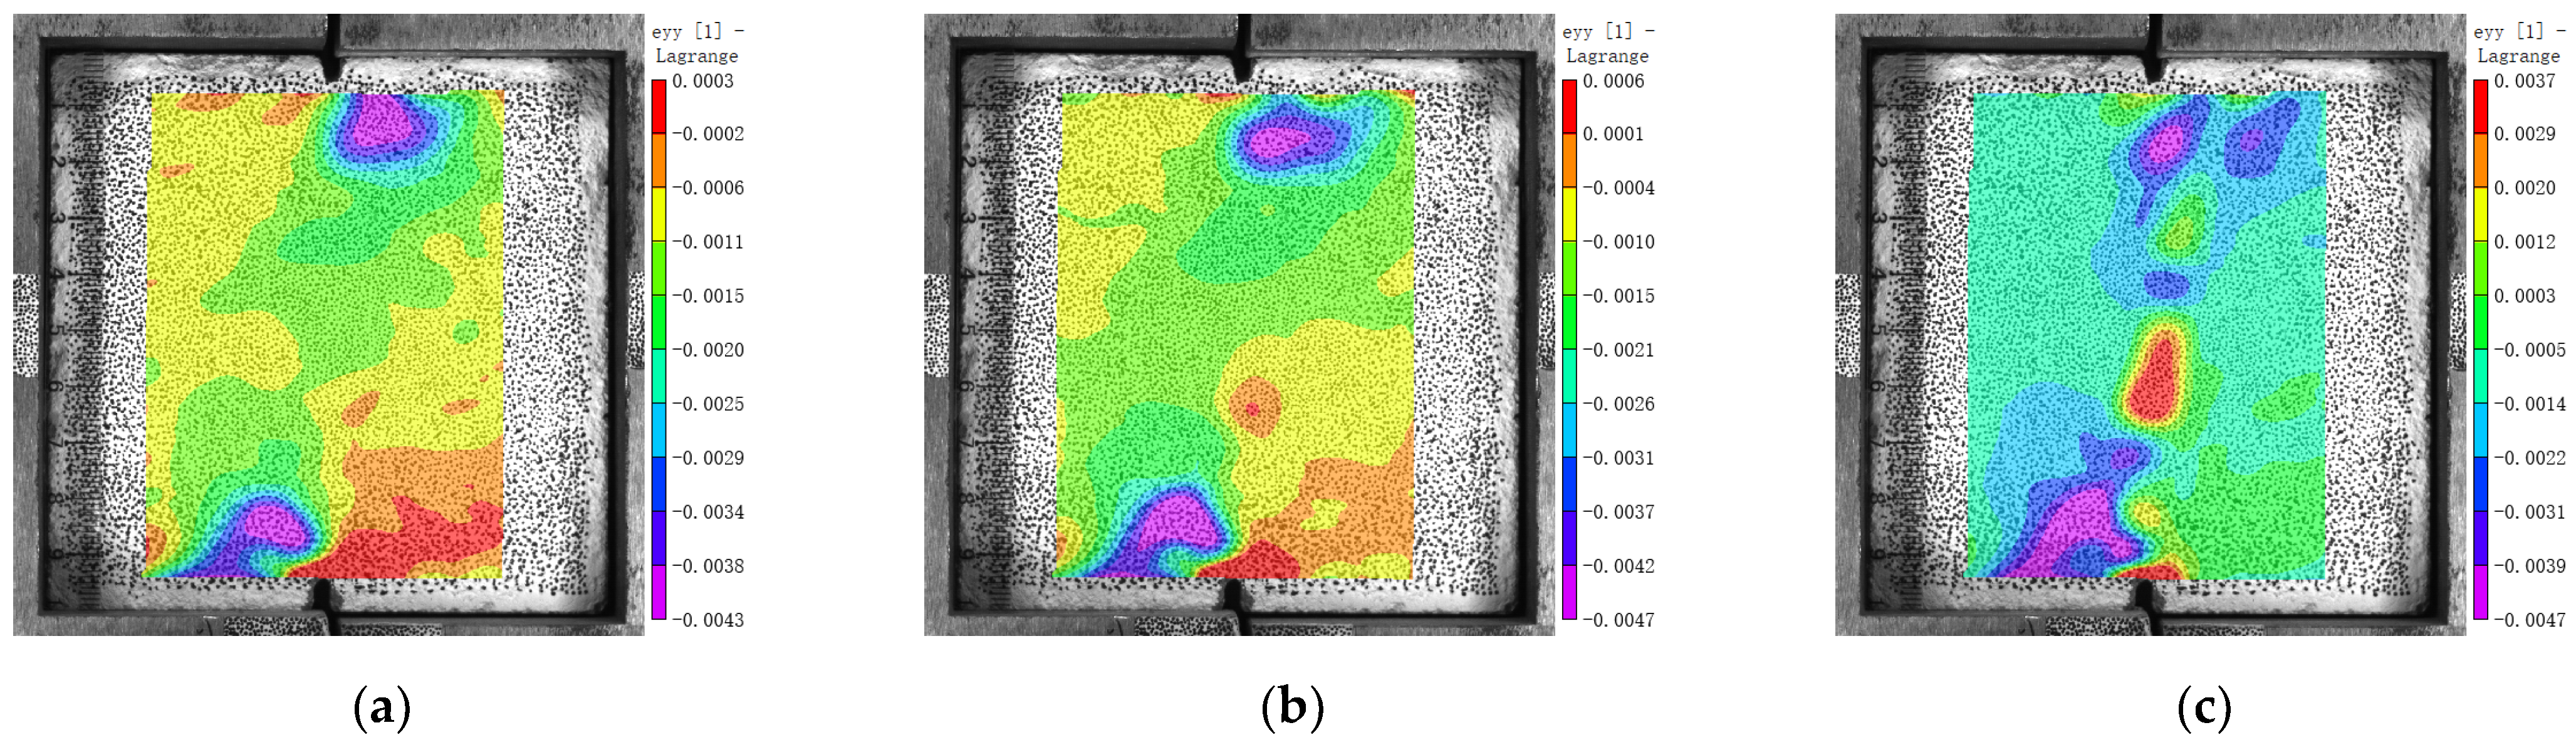
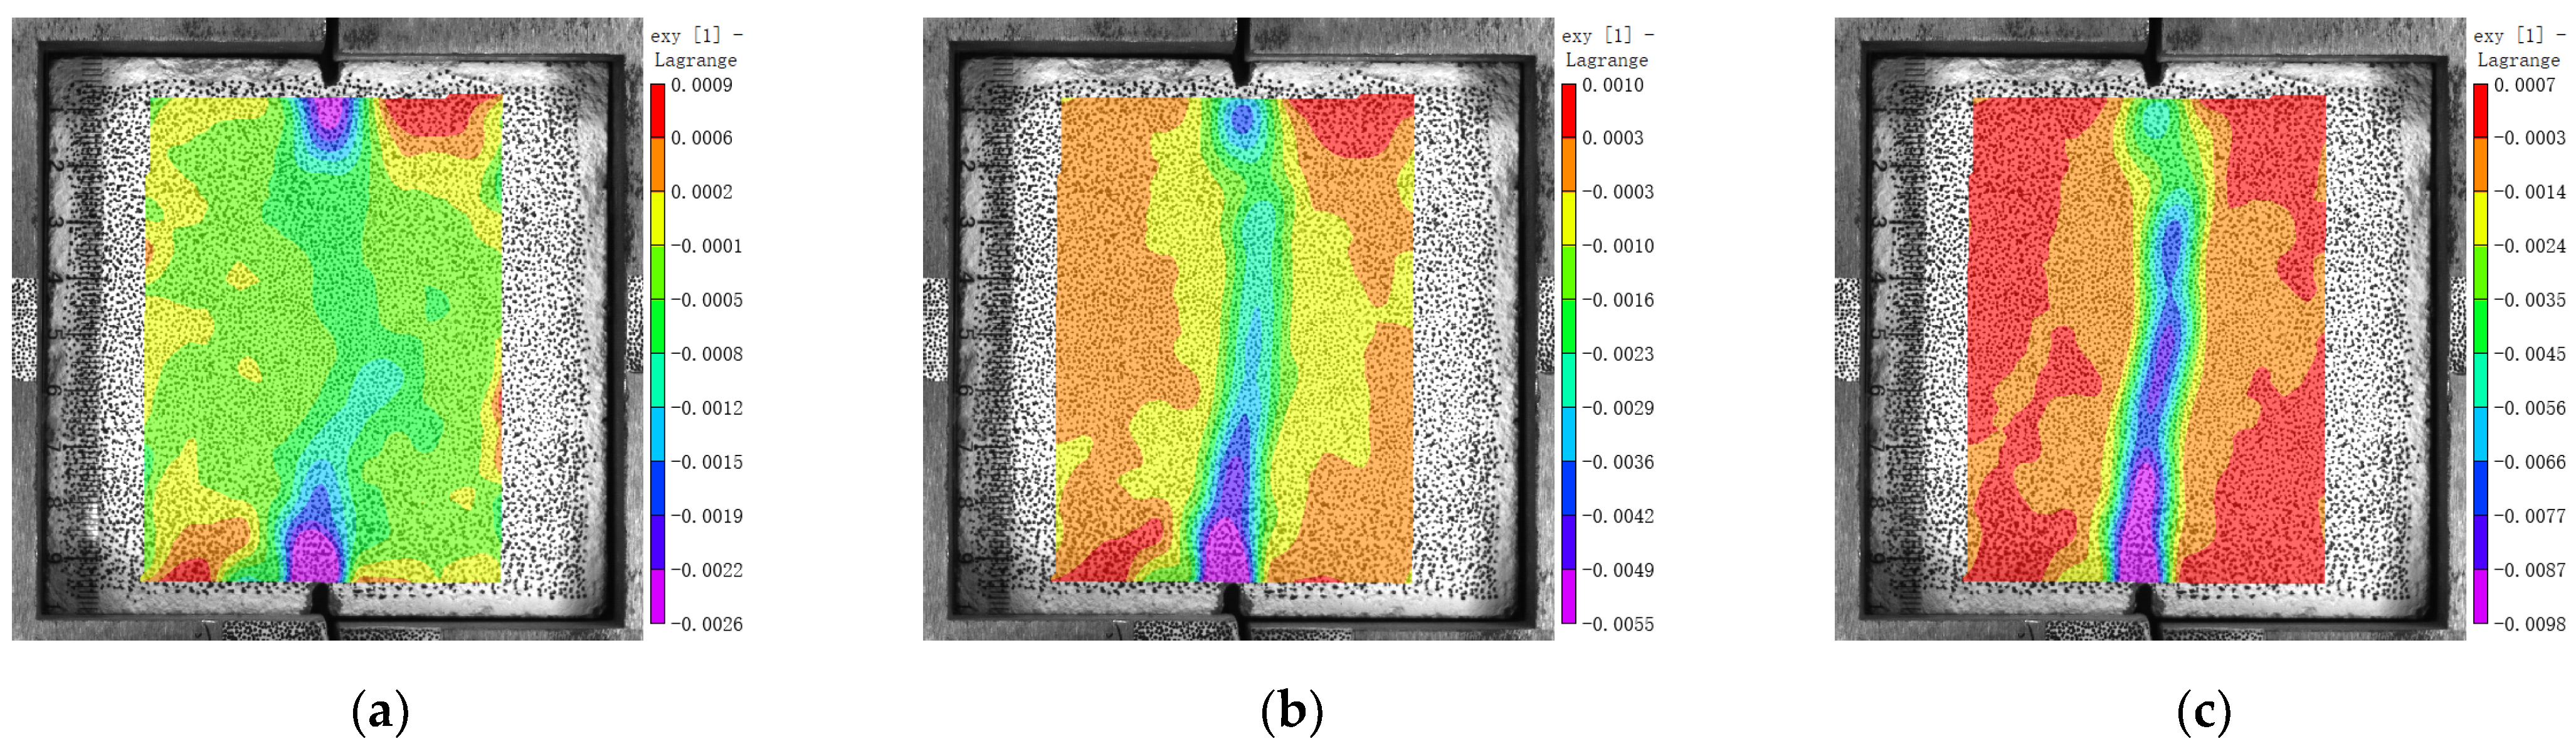
  • When MNC is close to failure under shear, there are four vertical strain concentration zones along the compressive stress trace; two of them are near the loading end and two near the natural aggregate. MRC also has four strain concentration zones along the compressive stress zone, two near the loading end and two in the old mortar near the natural aggregate. MBC has only two strain concentration areas along the compressive stress zone, and there is no strain concentration area near the brick aggregate because the elastic modulus of the brick aggregate is less than that of the surrounding hardened mortar.
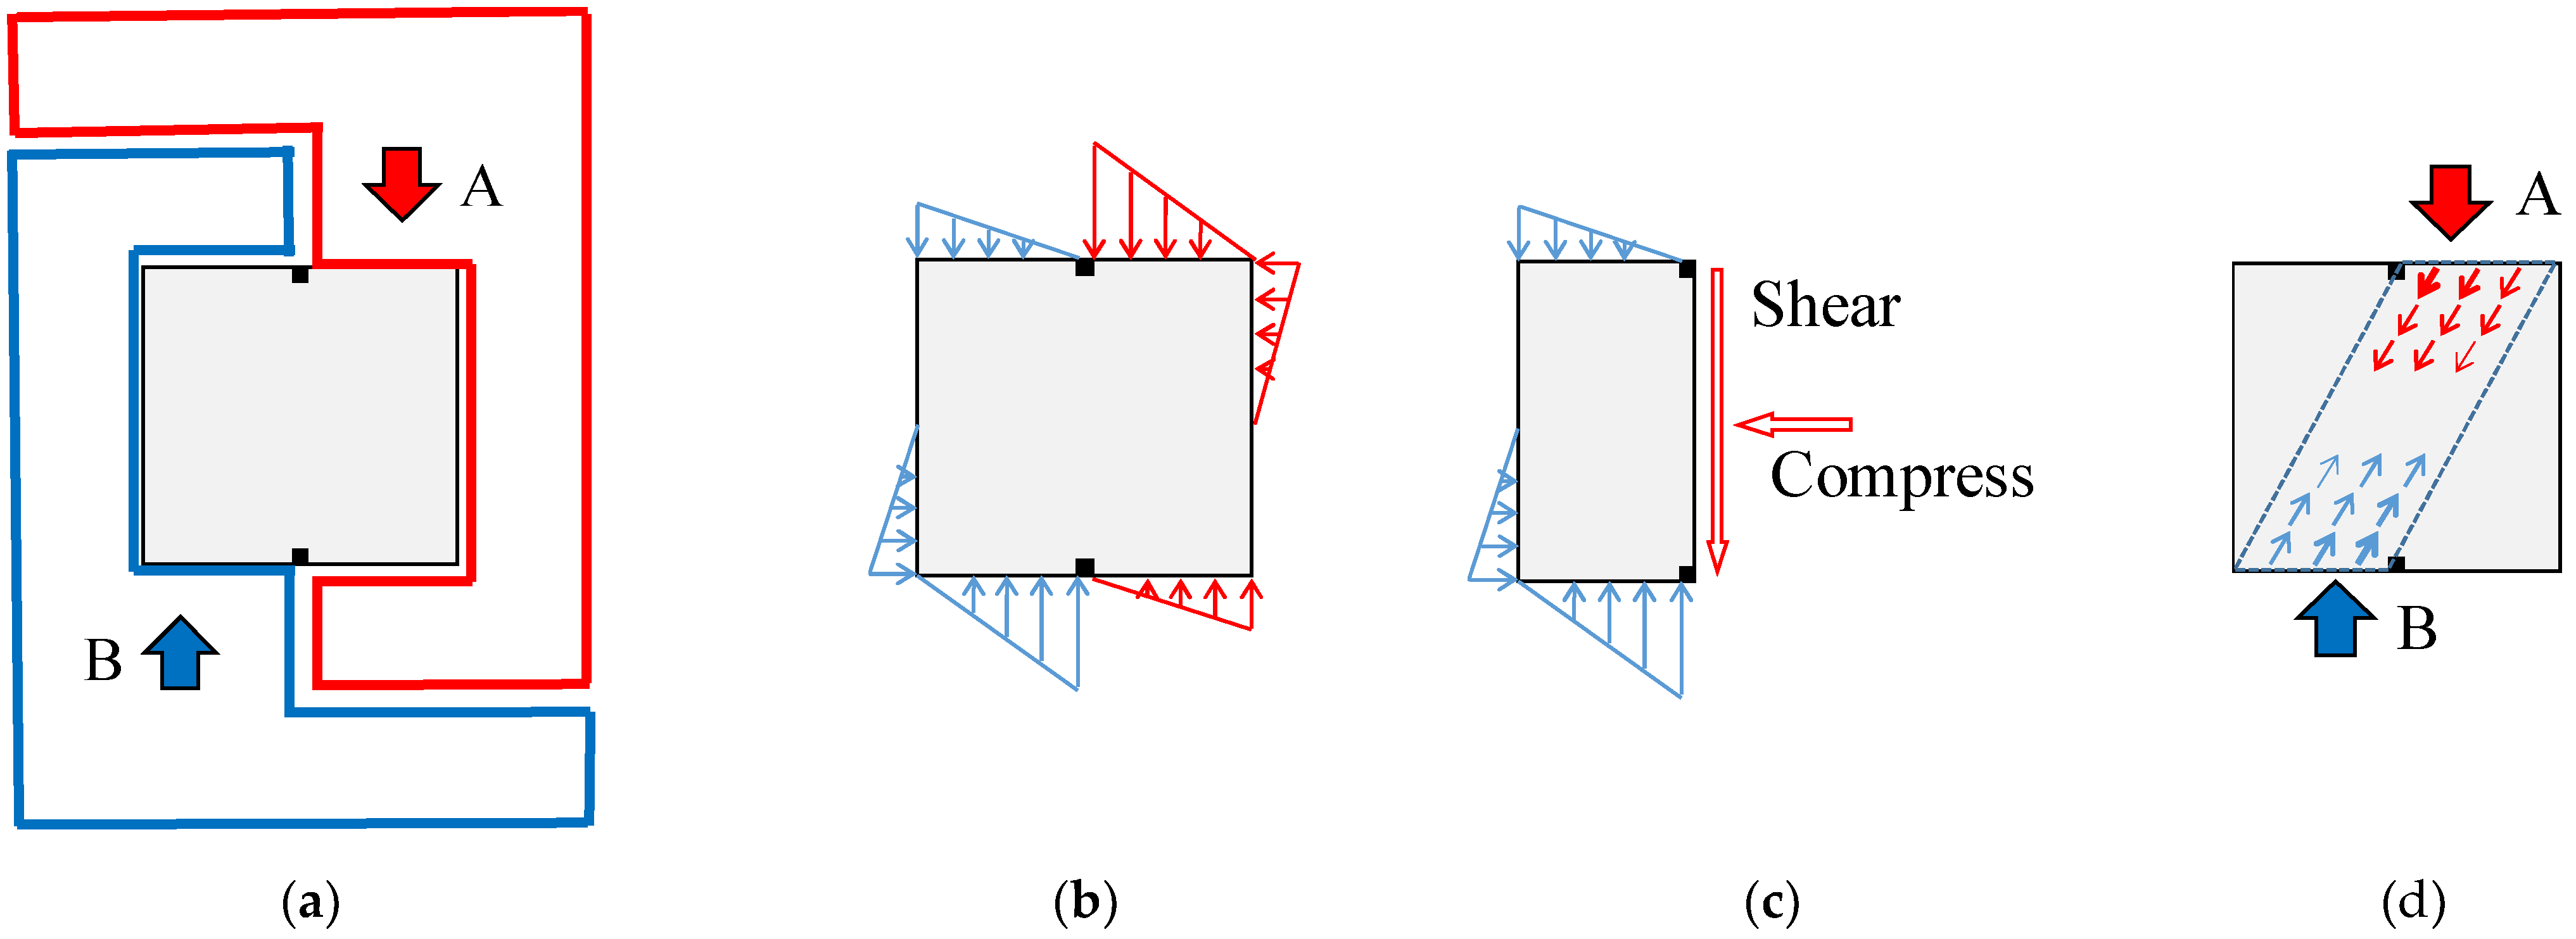
  • The fixture designed in this paper can easily apply a shear force to the square specimen. Although there is orthogonal pressure to the shear plane, the pressure is small and does not affect the study of the specimen’s shear failure mechanism. In the future, the experimental setup can be improved to strudy pure shear or controllable compression shear.

Author Contributions

Conceptualization, S.W. and C.S.; methodology, C.S.; software, C.S.; validation, S.W., S.P. and Z.C.; formal analysis, S.W. and C.S.; investigation, S.W., S.P. and C.S.; resources, S.W.; data curation, Y.T.; writing—original draft preparation, S.W. and C.S.; writing review and editing, A.S.; visualization, Z.C.; supervision, C.S.; project administration, S.W.; funding acquisition, S.W. All authors have read and agreed to the published version of the manuscript.

Funding

This work was financially supported by the Gansu Province Youth Science Foundation (20JR5RA079) Research Project of the State Grid Gansu Electric Power Corporation (52273019000B).

Institutional Review Board Statement

Not applicable.

Informed Consent Statement

Not applicable.

Data Availability Statement

Not applicable.

Conflicts of Interest

The authors declare no conflict of interest.

References

  1. Xiao, J.; Li, W.; Fan, Y.; Huang, X. An overview of study on recycled aggregate concrete in China (1996–2011). Constr. Build. Mater. 2012, 31, 364–383. [Google Scholar] [CrossRef]
  2. Tam, V.W.Y.; Soomro, M.; Evangelista, A.C.J. A review of recycled aggregate in concrete applications (2000–2017). Constr. Build. Mater. 2018, 172, 272–292. [Google Scholar] [CrossRef]
  3. Zheng, Y.; Zhuo, J.; Zhang, P. A review on durability of nano-SiO2 and basalt fiber modified recycled aggregate concrete. Constr. Build. Mater. 2021, 304, 124659. [Google Scholar] [CrossRef]
  4. Liu, Q.; Singh, A.; Xiao, J. Workability and mechanical properties of mortar containing recycled sand from aerated concrete blocks and sintered clay bricks. Resour. Conserv. Recycl. 2020, 157, 104728. [Google Scholar] [CrossRef]
  5. GB/T 25177-2011; Recycled Coarse Aggregate for Concrete. China Architecture & Building Press: Beijing, China, 2011. (In Chinese)
  6. GB/T 25176-2011; Recycled Fine Aggregate for Concrete and Mortar. China Architecture & Building Press: Beijing, China, 2011. (In Chinese)
  7. Zheng, C.; Lou, C.; Du, G.; Li, X.; Liu, Z.; Li, L. Mechanical properties of recycled concrete with demolished waste concrete aggregate and clay brick aggregate. Results Phys. 2018, 9, 1317–1322. [Google Scholar] [CrossRef]
  8. Dang, J.; Zhao, J.; Pang, S.; Zhao, S. Durability and microstructural properties of concrete with recycled brick as fine aggregates. Constr. Build. Mater. 2020, 262, 120032. [Google Scholar] [CrossRef]
  9. Zong, L.; Fei, Z.; Zhang, S. Permeability of recycled aggregate concrete containing fly ash and clay brick waste. J. Clean. Prod. 2014, 70, 175–182. [Google Scholar] [CrossRef]
  10. Wong, C.; Mo, K.; Yap, S.; Alengaram, U.J.; Ling, T. Potential use of brick waste as alternate concrete-making materials: A review. J. Clean. Prod. 2018, 195, 226–239. [Google Scholar] [CrossRef]
  11. Liu, Q.; Xiao, J.; Singh, A. Plastic shrinkage and cracking behavior of mortar containing recycled sand from aerated blocks and clay bricks. Sustainability 2021, 13, 1096. [Google Scholar] [CrossRef]
  12. Shah, S.P.; Winter, G. Inelastic behavior and fracture of concrete. ACI Mater. J. 1966, 63, 5–28. [Google Scholar]
  13. Buyukozturk, O.; Nilson, A.H.; Slate, F.O. Stress-strain response and fracture of a concrete model in biaxial loading. ACI Mater. J. 1971, 68, 590–599. [Google Scholar]
  14. Liu, T.; Nilson, A.H.; Slate, F.O. Stress-strain response and fracture of concrete in uniaxial and biaxial compression. ACIAR Proc. 1972, 69, 291–295. [Google Scholar]
  15. Maji, A.K.; Shah, S.P. Application of acoustic emission and laser holography to study micro-fracture in concrete. ACI Mater. J. 1989, 112, 83–110. [Google Scholar]
  16. Lawler, J.S.; Keane, D.T.; Shah, S.P. Measuring three-dimensional damage in concrete under compression. ACI Mater. J. 2001, 98, 465–475. [Google Scholar]
  17. Tregger, N.; Corr, D.; Graham-Brady, L.; Shah, S. Modeling the effect of meso-scale randomness on concrete fracture. Probabilistic Eng. Mech. 2006, 21, 217–225. [Google Scholar] [CrossRef]
  18. Xiao, J.; Li, W.; Sun, Z.; Shah, S.P. Crack propagation in recycled aggregate concrete under uniaxial compressive loading. ACI Mater. J. 2012, 109, 451–461. [Google Scholar]
  19. Liu, Q.; Xiao, J.; Singh, A. Crack Propagation and Failure Characteristics of Modeled Concrete with Natural and Brick Aggregates. J. Renew. Mater. 2021, 9, 1309–1327. [Google Scholar] [CrossRef]
  20. Bertelsen, I.M.G.; Kragh, C.; Cardinaud, G.; Ottosen, L.M. Quantification of plastic shrinkage cracking in mortars using digital image correlation. Cem. Concr. Res. 2019, 123, 105761. [Google Scholar] [CrossRef]
  21. Liu, Q.; Xiao, J.; Singh, A. Quantification of plastic shrinkage and cracking in mortars containing different recycled powders using digital image correlation technique. Constr. Build. Mater. 2021, 293, 123509. [Google Scholar] [CrossRef]
  22. Liu, Q.; Xiao, J.; Sun, J. Experimental study on the failure mechanism of recycled concrete. Cem. Concr. Res. 2011, 41, 1050–1057. [Google Scholar] [CrossRef]
  23. Mattock, A.H.; Hawkins, N.M. Shear transfer in reinforced concrete-recent research. PCI J. 1972, 17, 55–75. [Google Scholar] [CrossRef]
Figure 1. Layout of modeled concrete: (a) MNC; (b) MRC; and (c) MBC.
Sustainability 14 05552 g001
Figure 2. Experimental testing setup.
Sustainability 14 05552 g002
Figure 3. Shear force and displacement curves: (a) MNC; (b) MRC; and (c) MBC.
Sustainability 14 05552 g003
Figure 4. Displacement along horizontal direction: (a) 80% of the peak force; (b) 90% of the peak force; and (c) 100% of the peak force.
Sustainability 14 05552 g004
Figure 5. Displacement along vertical direction: (a) 80% of the peak force; (b) 90% of the peak force; and (c) 100% of the peak force.
Sustainability 14 05552 g005
Figure 6. Strain along horizontal direction: (a) 80% of the peak force; (b) 90% of the peak force; and (c) 100% of the peak force.
Sustainability 14 05552 g006
Figure 7. Strain along vertical direction: (a) 80% of the peak force; (b) 90% of the peak force; and (c) 100% of the peak force.
Sustainability 14 05552 g007
Figure 8. Shear strain: (a) 80% of the peak force; (b) 90% of the peak force; and (c) 100% of the peak force.
Sustainability 14 05552 g008
Figure 9. Displacement along horizontal direction: (a) 80% of the peak force; (b) 90% of the peak force; and (c) 100% of the peak force.
Sustainability 14 05552 g009
Figure 10. Displacement along vertical direction: (a) 80% of the peak force; (b) 90% of the peak force; and (c) 100% of the peak force.
Sustainability 14 05552 g010
Figure 11. Strain along horizontal direction: (a) 80% of the peak force; (b) 90% of the peak force; and (c) 100% of the peak force.
Sustainability 14 05552 g011
Figure 12. Strain along vertical direction: (a) 80% of the peak force; (b) 90% of the peak force; and (c) 100% of the peak force.
Sustainability 14 05552 g012
Figure 13. Shear strain: (a) 80% of the peak force; (b) 90% of the peak force; and (c) 100% of the peak force.
Sustainability 14 05552 g013
Figure 14. Displacement along horizontal direction: (a) 80% of the peak force; (b) 90% of the peak force; and (c) 100% of the peak force.
Sustainability 14 05552 g014
Figure 15. Displacement along vertical direction: (a) 80% of the peak force; (b) 90% of the peak force; and (c) 100% of the peak force.
Sustainability 14 05552 g015
Figure 16. Strain along horizontal direction: (a) 80% of the peak force; (b) 90% of the peak force; and (c) 100% of the peak force.
Sustainability 14 05552 g016
Figure 17. Strain along vertical direction: (a) 80% of the peak force; (b) 90% of the peak force; and (c) 100% of the peak force.
Sustainability 14 05552 g017
Figure 18. Shear strain: (a) 80% of the peak force; (b) 90% of the peak force; and (c) 100% of the peak force.
Sustainability 14 05552 g018
Figure 19. Internal force analysis: (a) loading; (b) external force; (c) internal force; and (d) compressive stress traces.
Sustainability 14 05552 g019
Figure 20. Cracks propagation: (a) MNC; (b) MRC; and (c) MBC.
Sustainability 14 05552 g020
Figure 21. Compressive strain concentration zones: (a) MNC; (b) MRC; and (c) MBC.
Sustainability 14 05552 g021
Table 1. Mechanical properties of each phase material. Reprinted/adapted with permission from Ref. [19]. 2021, Tech Science Press.
MaterialDensity
(kg/m3)
Elastic Modulus
(GPa)
Compressive Strength
(MPa)
Poisson’s
Ratio
Natural aggregate256065.0170.10.160
New mortar218016.318.50.170
Old mortar220923.029.80.176
Brick aggregate18102.55.40.177
Publisher’s Note: MDPI stays neutral with regard to jurisdictional claims in published maps and institutional affiliations.

