
Risk Perception Thresholds and Their Impact on the Behavior of Nearby Residents in Waste to Energy Project Conflict: An Evolutionary Game Analysis


Abstract
:1. Introduction
2. Literature Review
2.1. Research on the Causes of Conflict and Its Governance
2.2. Research on the Mechanisms of Evolutionary Conflict
3. Model Construction and Analysis of Risk Perception Threshold
3.1. Research Hypotheses
3.2. Model Construction
3.3. Risk Perception Threshold
3.3.1. Relationships among the Variables
- (1)
- Between and . Parameter encompasses the various demands of local residents, including compensation. These demands are related to residents’ opposition to the WTE plant. Local government may choose to negotiate with the residents likely to be affected in order to allow the plant to go ahead. If residents’ perceived risk is higher, their demands and levels of compensation will also be higher. The relationship between and will be positive and takes the following functional form:In Equation (5), is a constant and satisfies .
- (2)
- The value . The value of refers to the probability of residents benefiting from negotiations with the local government. It is affected by the attitude of surrounding residents and their past experience of negotiation and conflict with the local authority. If the surrounding residents do not adopt a tough stance, the probability of successful negotiation will be higher. Observation of negotiations over previous NIMBY projects are likely to induce a more robust response and demand for higher levels of compensation which the local government might find impossible to meet. The probability of successful negotiation will be relatively low, and we assume .
3.3.2. Calculation of Risk Perception Threshold
- (1)
- If .
- (2)
- If .
4. Stability Analysis of the Parties’ Behavior Choices
5. Numerical Simulation Analysis
5.1. Description of the Case and Collection of Data
5.2. Model Validation
5.3. Theoretical Model Verification and Analysis for
- (1)
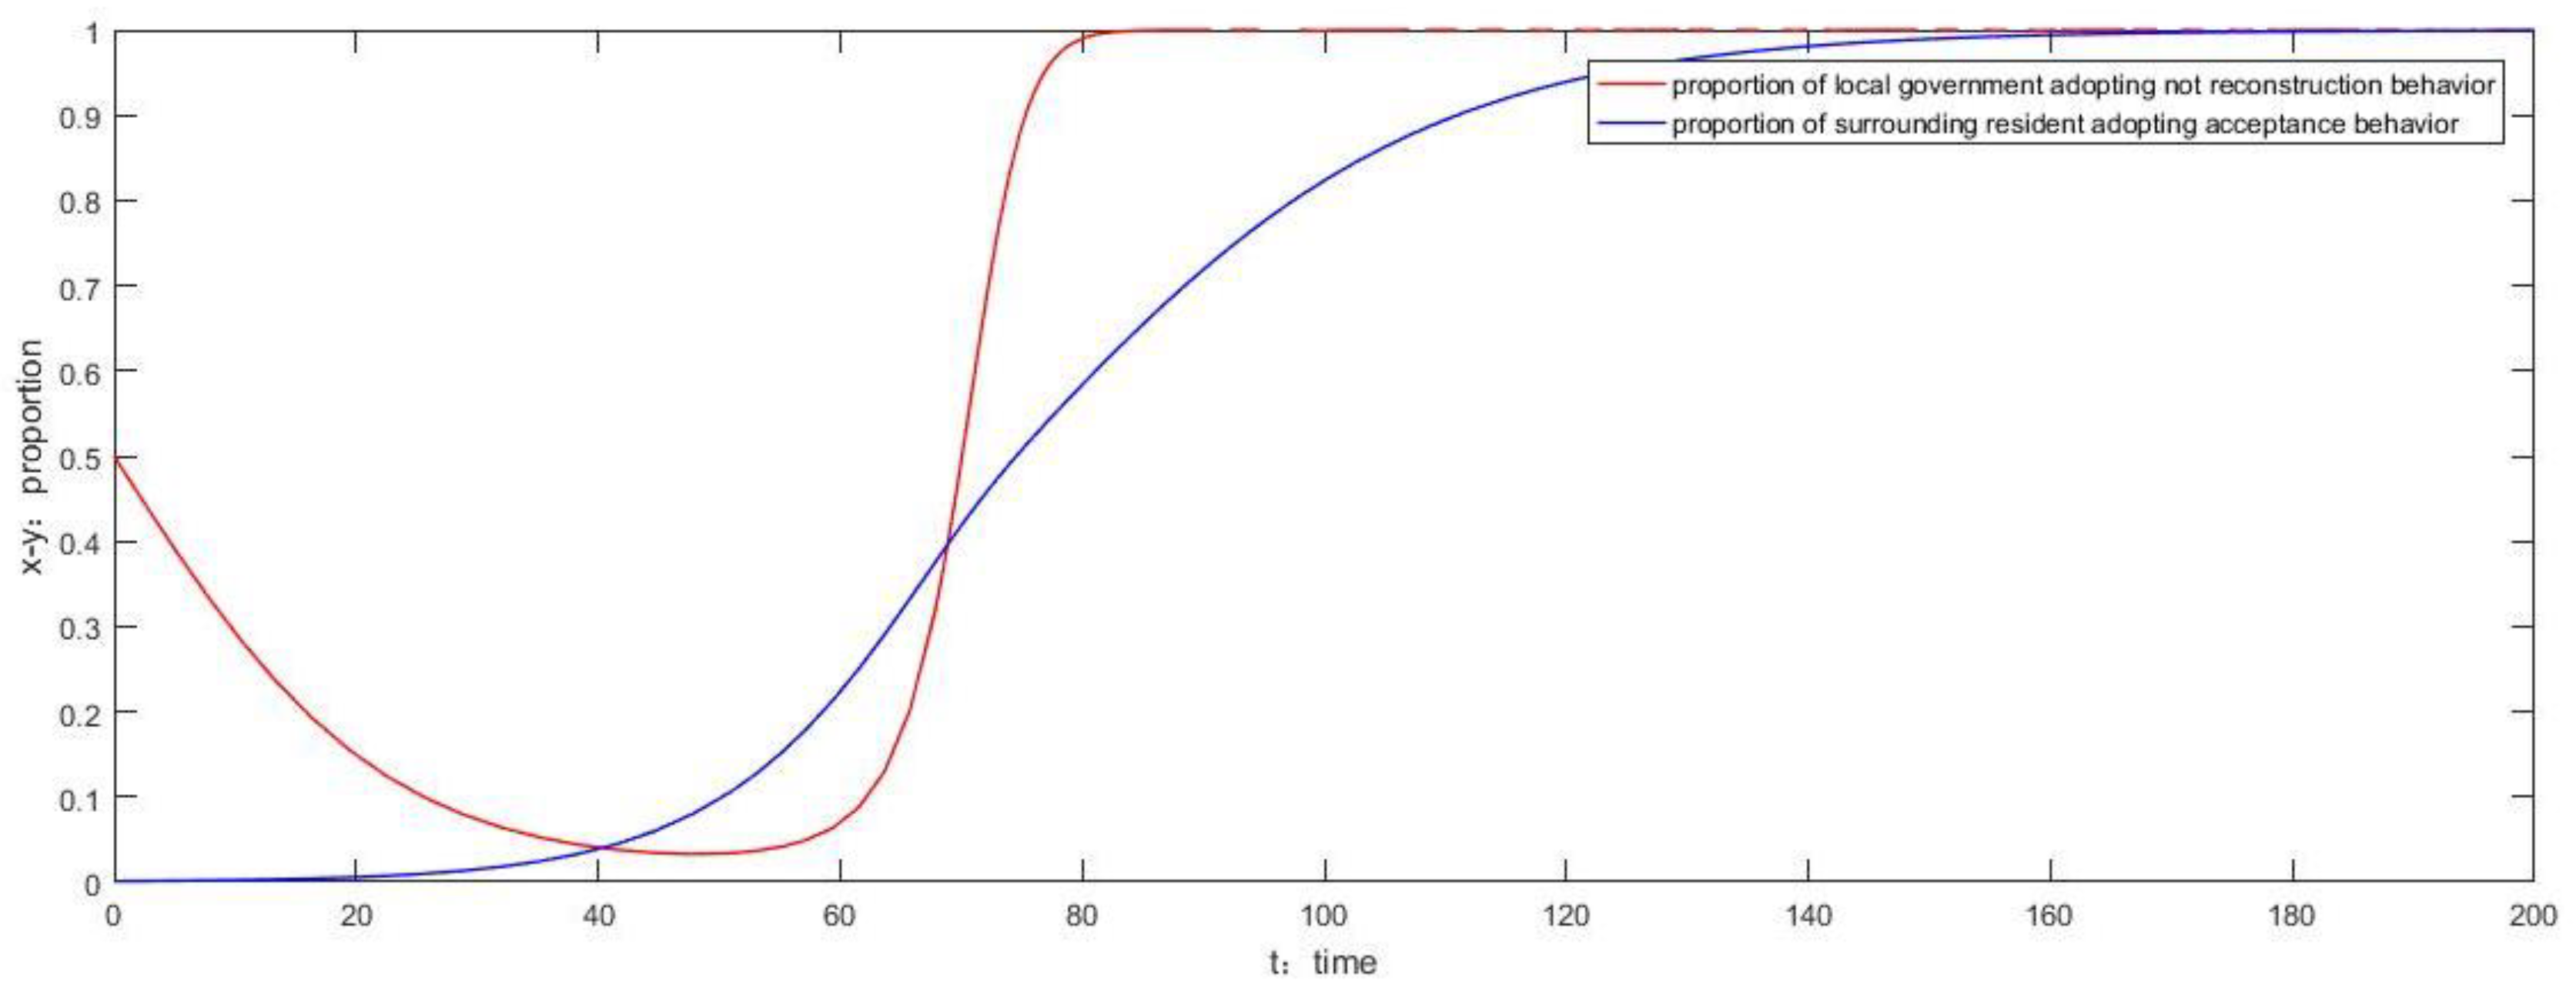
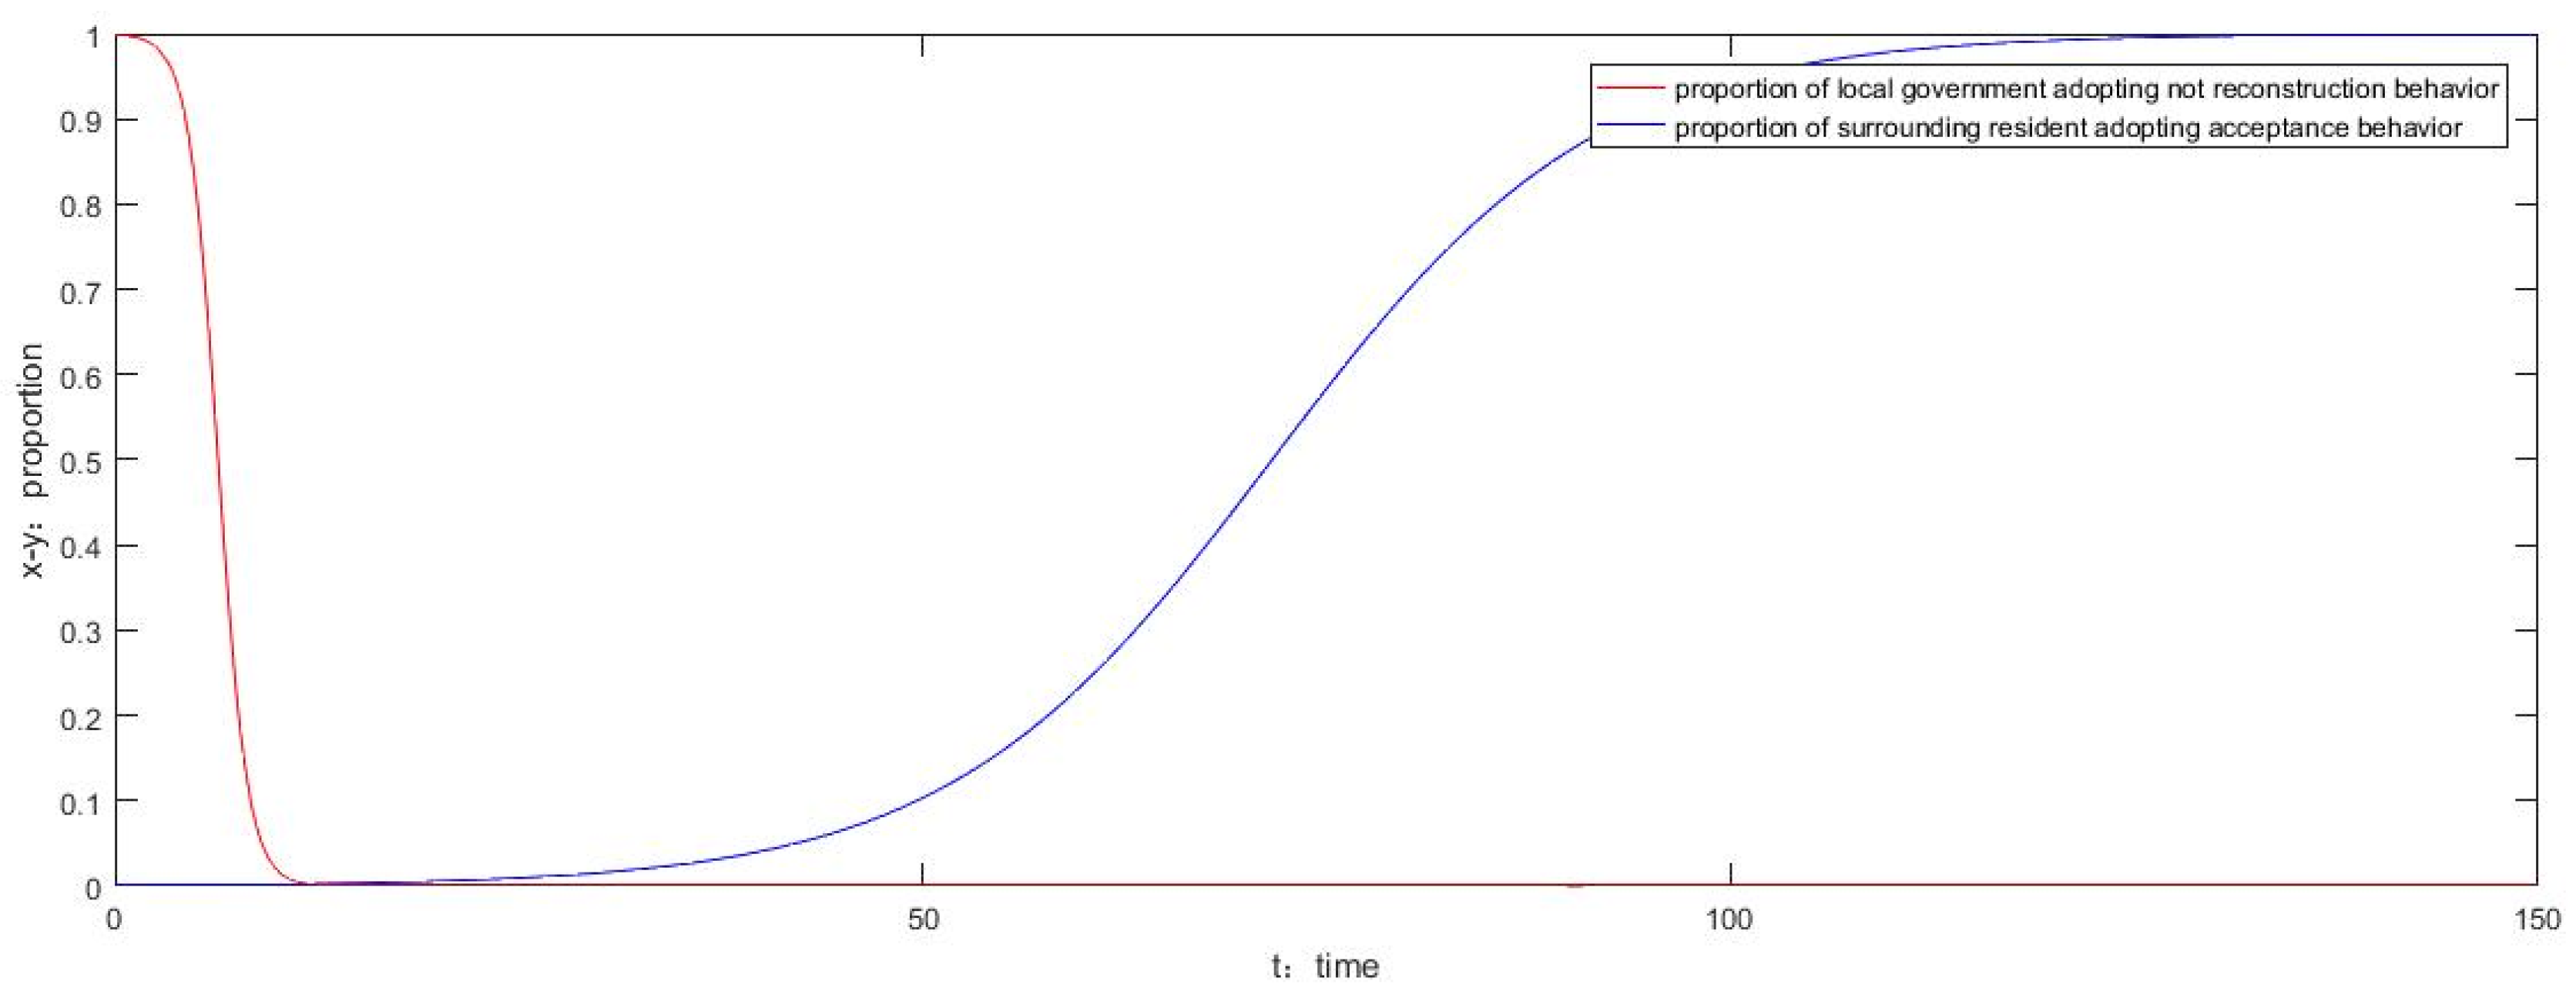
- We set the relevant parameter to , and to demonstrate the specific evolution mechanism, we assume that the initial behavior choice of the surrounding residents is resistance and set the behavior proportion to a value very close to 0, and that the proportion of local government choosing not to relocate is . Figure 10 presents the simulation results which show that at the beginning of the game, the resistance behavior of the surrounding residents fosters the tendency for local government behavior to converge towards relocation. The high cost of relocation and the small perceived risk of the surrounding residents fosters convergence towards acceptance by local residents. Local government persistence causes a gradual convergence towards acceptance, and a final result of (1,1). This is consistent with Proposition 1. When the risk caused by construction of the plant was lower than the surrounding residents’ risk perception threshold and despite lack of local government response to all of the residents’ requirements and demands for compensation, negotiation and better communication by local government, the proposal was eventually accepted. The time taken to reach this position was long and the final outcome required a high level of persistence from the local government.
- (2)
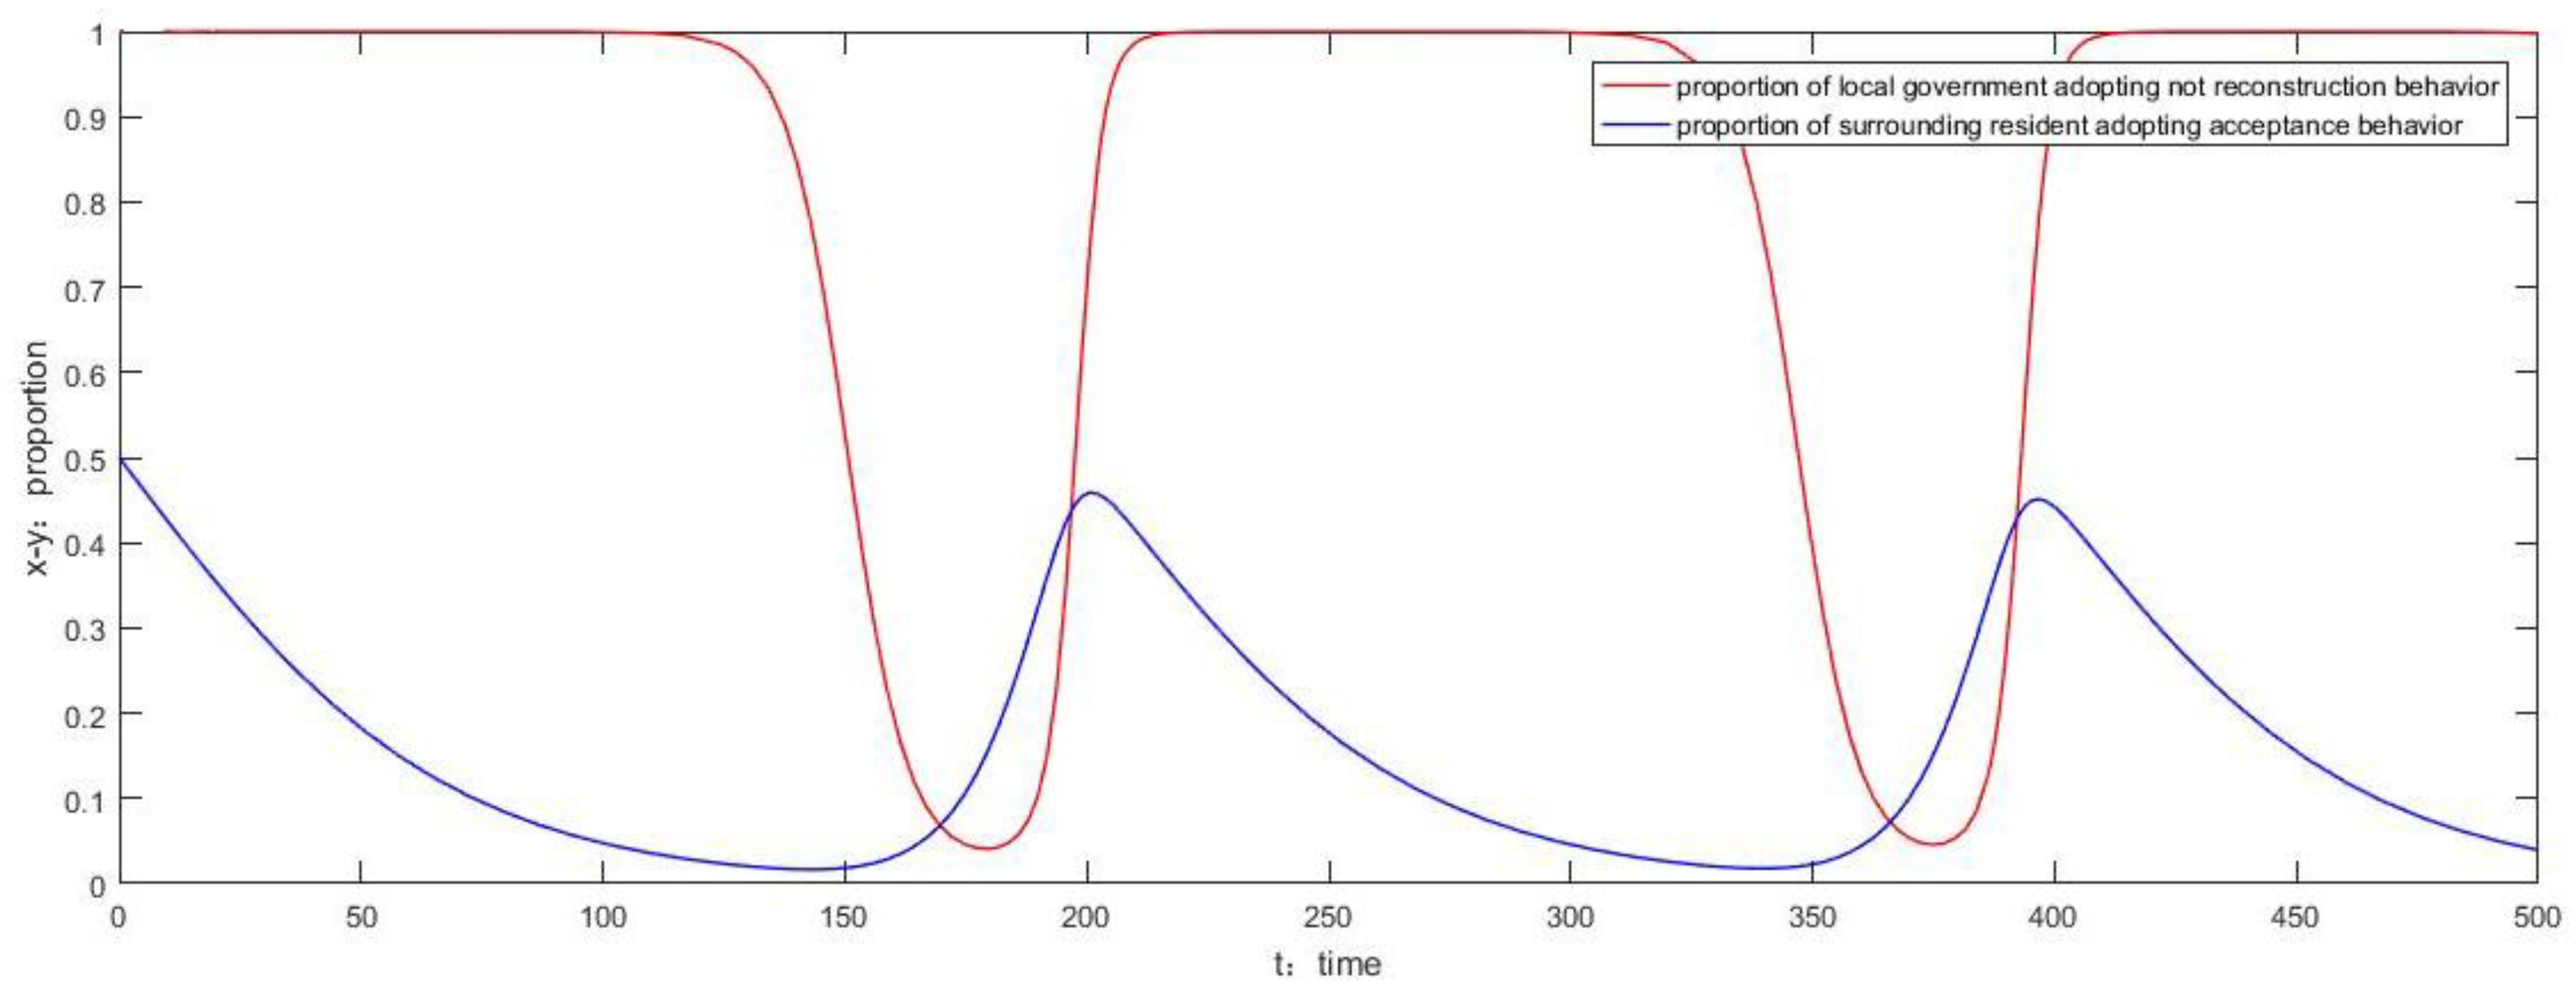
- We set the relevant parameter to we assume that the initial behavior choice of surrounding residents is resistance and set the behavior proportion to a value very close to 0. The initial behavior choice of the local government is not relocation, therefore we set the behavior proportion to a value very close to 1. Figure 11 presents the simulation results which show that although the respective behaviors of the parties at the beginning of the game are not relocation and resistance, over time their choices change, and the final evolution result is (0,1). This is consistent with Proposition 2 and suggests that initiative and decision-making power are stronger for local government than for the surrounding residents. Although the fluctuation in the risk caused by the plant is lower than the surrounding residents’ risk perception thresholds, residents are still worried about the plant and will continue to demonstrate cautious and conservative behavior.
6. Conclusions, Implications and Limitations
6.1. Conclusions and Discussion
6.2. Implications
6.3. Limitations
Author Contributions
Funding
Institutional Review Board Statement
Informed Consent Statement
Data Availability Statement
Conflicts of Interest
References
- Yu, S.; Dong, H. Uncover Cost-Benefit Disparity of Municipal Solid Waste Incineration in Chinese Provinces. Sustainability 2020, 12, 697. [Google Scholar] [CrossRef] [Green Version]
- Wang, K.M.; Zhong, Y. An empirical study of core issues of NIMBY movement in china: Based on public opinion survey. J. Shanghai Jiaotong Univ. 2014, 1, 23–33. [Google Scholar]
- Dear, M. Understanding and Overcoming the NIMBY Syndrome. J. Am. Plan. Assoc. 1992, 3, 288–302. [Google Scholar] [CrossRef]
- Petts, J. Effective Waste Management: Understanding and Dealing with Public Concerns. Waste Manag. Res. 1994, 3, 207–222. [Google Scholar] [CrossRef]
- Tango, T.; Fujita, T.; Tanihata, T.; Minowa, M.; Doi, Y.; Kato, N.; Kunikane, S.; Uchiyama, I.; Tanaka, M.; Uehata, T. Risk of Adverse Reproductive Outcomes Associated with Proximity to Municipal Solid Waste Incinerators with High Dioxin Emission Levels in Japan. J. Epidemiol. 2004, 3, 83–93. [Google Scholar] [CrossRef] [PubMed] [Green Version]
- Lin, P.Y.; Lai, S.P.; Wang, M.C.; Liang, J.J.; Chiang, C.F.; Kuo, H.W. Environmental health risks perception, attitude, and avoidance behaviour toward municipal solid waste incinerator. Int. J. Environ. Health Res. 2018, 28, 159–166. [Google Scholar] [CrossRef]
- Maria, B.S. The Role of Local Communities in the Process of Siting of the Unwanted Facilities within the Rural Areas in Poland. East. Eur. Countrys. 2019, 1, 63–94. [Google Scholar]
- O’Hare, M. Not on my block you don’t:acilities siting and the strategic importance of compensation. Public Policy 1977, 4, 407–458. [Google Scholar]
- Furuseth, O.J.; O’Callaghan, J. Community response to a municipal waste incinerator: NIMBY or neighbor? Landsc. Urban Plan. 1991, 3, 163–171. [Google Scholar] [CrossRef]
- Wolsink, M. Wind power implementation: The nature of public attitudes: Equity and fairness instead of ‘backyard motives’. Renew. Sustain. Energy Rev. 2007, 6, 1188–1207. [Google Scholar] [CrossRef]
- Ru, X.H. Cognitive Bias of Risk Communication in NIMBY Conflicts and Its Governance. J. Manag. 2020, 5, 73–81. [Google Scholar]
- Flynn, J.; Kasperson, R.; Kunreuther, H.; Slovic, P. Time to rethink nuclear waste storage. Issues Sci. Technol. 1992, 4, 42–48. [Google Scholar]
- Slovic, P.; Layman, M.; Flynn, J. Risk Perception, Trust, and Nuclear Waste: Lessons from Yucca Mountain. Environ. Sci. Policy Sustain. Dev. 1991, 3, 6–30. [Google Scholar] [CrossRef]
- Johnston, D.M.; Lai MS BC, D.; Houghton, B.F.; Paton, D. Volcanic hazard perceptions: Comparative shifts in knowledge and risk. Disaster Prev. Manag. 1999, 2, 118–126. [Google Scholar] [CrossRef]
- Lindell, M.K.; Perry, R.W. The Protective Action Decision Model: Theoretical Modifications and Additional Evidence. Risk Anal. 2012, 4, 616–632. [Google Scholar] [CrossRef]
- Ren, X.; Che, Y.; Yang, K.; Tao, Y. Risk perception and public acceptance toward a highly protested Waste-to-Energy facility. Waste Manag. 2016, 48, 528–539. [Google Scholar] [CrossRef]
- Hou, G.; Chen, T.; Ma, K.; Liao, Z.; Xia, H.; Yao, T. Improving Social Acceptance of Waste-to-Energy Incinerators in China: Role of Place Attachment, Trust, and Fairness. Sustainability 2019, 11, 1727. [Google Scholar] [CrossRef] [Green Version]
- Liu, Y.; Xu, M.; Ge, Y.; Cui, C.; Skitmore, M. Influences of environmental impact assessment on public acceptance of waste-to-energy incineration projects. J. Clean. Prod. 2021, 9, 127062. [Google Scholar] [CrossRef]
- Xu, H.; Zhang, Y.; Tan, D.Q. Evolutionary Equilibrium Analysis of the Influence of Participants’ Emotions on Environmental NIMBY Conflict. Soft Sci. 2019, 3, 121–126. [Google Scholar]
- Chen, H.; Lu, W.; Du, L. Stochastic Evolutionary Scenario Analysis of Risk Set Clustering NIMBY Conflicts Events. Chin. J. Manag. Sci. 2020, 4, 134–144. [Google Scholar]
- Kunreuther, H.; Easterling, D. The role of compensation in siting hazardous facilities. J. Policy Anal. Manag. 1996, 4, 601–622. [Google Scholar] [CrossRef]
- Nieves, L.A.; Himmelberger, J.J.; Ratick, S.J.; White, A.L. Negotiated Compensation for Solid-Waste Disposal Facility Siting: An Analysis of the Wisconsin Experience. Risk Anal. 1992, 4, 505–511. [Google Scholar] [CrossRef]
- Kim, D.S. Determinants of Public Opposition to Siting Waste Facilities in Korean Rural Communities. Korean J. Sociol. 2009, 6, 25–43. [Google Scholar]
- Wolsink, M. Wind power and the NIMBY-myth: Institutional capacity and the limited significance of public support. Renew. Energy 2000, 1, 49–64. [Google Scholar] [CrossRef]
- Ek, K. Public and private attitudes towards “green” electricity: The case of Swedish wind power. Energy Policy 2005, 13, 1677–1689. [Google Scholar] [CrossRef]
- Esaiasson, P. NIMBYism: A re-examination of the phenomenon. Soc. Sci. Res. 2014, 48, 185–195. [Google Scholar] [CrossRef]
- Petts, J. Barriers to participation and deliberation in risk decisions: Evidence from waste management. J. Risk Res. 2004, 2, 115–133. [Google Scholar] [CrossRef]
- Kikuchi, R.; Gerardo, R. More than a decade of conflict between hazardous waste management and public resistance: A case study of NIMBY syndrome in Souselas (Portugal). J. Hazard. Mater. 2009, 172, 1681–1685. [Google Scholar] [CrossRef]
- Wolsink, M. Contested environmental policy infrastructure: Socio-political acceptance of renewable energy, water, and waste facilities. Environ. Impact Assess. Rev. 2010, 5, 302–311. [Google Scholar] [CrossRef] [Green Version]
- Rosenbaum, W.A. The Paradoxes of Public Participation. Adm. Soc. 1976, 3, 355–383. [Google Scholar] [CrossRef]
- Aberbach, J.D.; Rockman, B.A. Administrators’ Beliefs About the Role of the Public: The Case of American Federal Executives. West. Political Q. 1978, 31, 502–522. [Google Scholar]
- Zheng, G.L.; Wei, S.Y. NIMBY Conflict Governance: From the Perspective of Public Value Analysis. Theor. Investig. 2019, 2, 166–171. [Google Scholar]
- Wu, W.D.; Li, D.G. On the City NIMBY Conflicts and Its Governing in the Driving of the Mentality of NIMBY Misgivings. Theor. Investig. 2019, 1, 169–173. [Google Scholar]
- Kang, W.; Du, L.; Cao, T.X. Research on the Co-Coupling Evolution Mechanism of Pollution NlMBY Conflict Events-Based on Coupling Coordination Degree Model. Oper. Res. Manag. Sci. 2020, 1, 51–60. [Google Scholar]
- Kojola, E. Who Speaks for the Place? Cultural Dynamics of Conflicts Over Hazardous Industrial Development. Sociol. Forum 2020, 3, 673–695. [Google Scholar] [CrossRef]
- Zhang, L.; Tong, X. Social Generative Mechanism for “NIMBY” Actions. J. Jiangsu Adm. Inst. 2013, 1, 64–70. [Google Scholar]
- Wang, Y.; Zheng, L.; Zuo, J. Online rumor propagation of social media on nimby conflict: Temporal patterns, frameworks and rumor-mongers. Environ. Impact Assess. Rev. 2021, 1, 106647. [Google Scholar] [CrossRef]
- Wassmer, R.W.; Wahid, I. Does the Likely Demographics of Affordable Housing Justify “NIMBY” Ism? Hous. Policy Debate 2019, 2, 343–358. [Google Scholar] [CrossRef]
- Song, J.; Uji, A.; Prakash, A. Does the “NIMBY syndrome” undermine public support for nuclear power in Japan? Energy Policy 2021, 148, 111944. [Google Scholar]
- Lima, M.L. On the influence of risk perception on mental health: Living near an incinerator. J. Environ. Psychol. 2004, 1, 71–84. [Google Scholar] [CrossRef]
- Zhao, J.; Nie, Y.; Liu, K.; Zhou, J. Evolution of the Individual Attitude in the Risk Decision of Waste Incinerator Construction: Cellular Automaton Model. Sustainability 2020, 12, 368. [Google Scholar] [CrossRef] [Green Version]
- Kang, W.; Du, L. Evolutionary Game Analysis of Stakeholders in the NIMBY Conflicts: A Case Study of Pollution NIMBY Facility. Oper. Res. Manag. Sci. 2018, 3, 82–92. [Google Scholar]
- Eguchi, S. Nimby (not in my backyard) conflicts: A simple game-theoretic analysis. Asia-Pac. J. Reg. Sci. 2020, 4, 821–833. [Google Scholar] [CrossRef]
- Smith, J.M. Evolution and the Theory of Games; Cambridge University Press: Cambridge, UK, 1982. [Google Scholar]
- Friedman, D. On economic applications of evolutionary game theory. J. Evol. Econ. 1998, 1, 15–43. [Google Scholar] [CrossRef] [Green Version]
- Liu, D.H.; Chen, J.F. Information-right co-evolutionary simulation analysis of mass emergency derived from environmental pollution. Syst. Eng. Theory Pract. 2014, 12, 3157–3166. [Google Scholar]
- Yu, W.Y. Evolutionary Game of NIMBY Conflict Based on Emotional Catharsis Utility. Oper. Res. Manag. Sci. 2020, 3, 53–62. [Google Scholar]
- Tian, C.; Han, C. How Can China Resolve the NIMBY Dilemma in a Network Society? Government and Society-Negotiated Decisions Based on Evolutionary Game Analysis. Sustainability 2022, 14, 1308. [Google Scholar] [CrossRef]
- Friedman, D. Evolutionary Games in Economics. Econometrica 1991, 3, 637–666. [Google Scholar] [CrossRef] [Green Version]
- Mcdaniels, T.L.; Axelrod, L.J.; Cavanagh, N.S.; Slovic, P. Perception of ecological risk to water environments. Risk Anal. 1997, 3, 341–352. [Google Scholar] [CrossRef]
- Alhakami, A.S.; Slovic, P. A psychological study of the inverse relationship between perceived risk and perceived benefit. Risk Anal. 1994, 6, 1085–1096. [Google Scholar] [CrossRef]
- Zeng, J.; Wei, J.; Zhu, W.; Zhao, D.; Lin, X. Residents’ behavioural intentions to resist the nuclear power plants in the vicinity: An application of the protective action decision model. J. Risk Res. 2019, 3, 382–400. [Google Scholar] [CrossRef]
- Portney, K.E. The potential of the theory of compensation for mitigating public opposition to hazardous waste treatment facility siting: Some evident from five Massachusetts communities. Policy Stud. J. 1985, 1, 81–89. [Google Scholar] [CrossRef]
- Davis, C. Public Involvement in Hazardous Waste Siting Decisions. Polity 1986, 2, 296–304. [Google Scholar] [CrossRef]
- Quan, X.W.; Zuo, G.S. Evolutionary process model and scenario simulation analysis of NIMBY conflict based on stochastic petri nets: A case study of MSW incineration power plant. Oper. Res. Manag. Sci. 2022, 1, 135–141. [Google Scholar]
- Huang, Z.; Zhang, G.R. Research on the influencing factors of residents’ risk perception of waste incineration power generation projects. Adm. Trib. 2019, 1, 86–92. [Google Scholar]


| Players | Surrounding Residents | ||
|---|---|---|---|
| Acceptance | Resistance | ||
| Local government | Not relocation | ||
| Relocation | 0 | ||
| Equilibrium Point | ||||
|---|---|---|---|---|
| (0,0) | 0 | 0 | ||
| (0,1) | 0 | 0 | ||
| (1,0) | 0 | 0 | ||
| (1,1) | 0 | 0 |
| Equilibrium Point | Stability Results | ||||||
|---|---|---|---|---|---|---|---|
| (0,0) | +/− | 0 | 0 | + | +/− | +/uncertain | unstable point/saddle point |
| (0,1) | + | 0 | 0 | − | − | uncertain | saddle point |
| (1,0) | −/+ | 0 | 0 | + | −/+ | uncertain/+ | saddle point/unstable point |
| (1,1) | − | 0 | 0 | − | + | − | ESS point |
| Equilibrium Point | Stability Results | ||||||
|---|---|---|---|---|---|---|---|
| (0,0) | + | 0 | 0 | + | + | + | unstable point |
| (0,1) | − | 0 | 0 | − | + | − | ESS point |
| (1,0) | − | 0 | 0 | + | − | uncertain | saddle point |
| (1,1) | + | 0 | 0 | − | − | uncertain | saddle point |
| Equilibrium Point | Stability Results | ||||||
|---|---|---|---|---|---|---|---|
| (0,0) | + | 0 | 0 | + | + | + | unstable point |
| (0,1) | + | 0 | 0 | − | − | uncertain | saddle point |
| (1,0) | − | 0 | 0 | − | + | − | ESS point |
| (1,1) | − | 0 | 0 | + | − | uncertain | saddle point |
| Equilibrium Point | Stability Results | ||||||
|---|---|---|---|---|---|---|---|
| (0,0) | + | 0 | 0 | + | + | + | unstable point |
| (0,1) | − | 0 | 0 | − | + | − | ESS point |
| (1,0) | − | 0 | 0 | + | − | uncertain | saddle point |
| (1,1) | + | 0 | 0 | − | − | uncertain | saddle point |
| Equilibrium Point | Stability Results | ||||||
|---|---|---|---|---|---|---|---|
| (0,0) | − | 0 | 0 | + | − | uncertain | saddle point |
| (0,1) | + | 0 | 0 | − | − | uncertain | saddle point |
| (1,0) | + | 0 | 0 | − | − | uncertain | saddle point |
| (1,1) | − | 0 | 0 | + | − | uncertain | saddle point |
Publisher’s Note: MDPI stays neutral with regard to jurisdictional claims in published maps and institutional affiliations. |
© 2022 by the authors. Licensee MDPI, Basel, Switzerland. This article is an open access article distributed under the terms and conditions of the Creative Commons Attribution (CC BY) license (https://creativecommons.org/licenses/by/4.0/).
Share and Cite
Quan, X.; Zuo, G.; Sun, H. Risk Perception Thresholds and Their Impact on the Behavior of Nearby Residents in Waste to Energy Project Conflict: An Evolutionary Game Analysis. Sustainability 2022, 14, 5588. https://doi.org/10.3390/su14095588
Quan X, Zuo G, Sun H. Risk Perception Thresholds and Their Impact on the Behavior of Nearby Residents in Waste to Energy Project Conflict: An Evolutionary Game Analysis. Sustainability. 2022; 14(9):5588. https://doi.org/10.3390/su14095588
Chicago/Turabian StyleQuan, Xiongwei, Gaoshan Zuo, and Helin Sun. 2022. "Risk Perception Thresholds and Their Impact on the Behavior of Nearby Residents in Waste to Energy Project Conflict: An Evolutionary Game Analysis" Sustainability 14, no. 9: 5588. https://doi.org/10.3390/su14095588