Article

Mining-Related Metal Pollution and Ecological Risk Factors in South-Eastern Georgia

by
Marika Avkopashvili
1,2,*,
Guranda Avkopashvili
3,
Irakli Avkopashvili
4,
Lasha Asanidze
5,
Lia Matchavariani
1,
Alexander Gongadze
3 and
Ramaz Gakhokidze
1
1
Faculty of Exact and Natural Sciences, Ivane Javakhishvili Tbilisi State University, Tbilisi 0179, Georgia
2
Department of Geology and Environmental Science, University of Pittsburgh, Pittsburgh, PA 15260, USA
3
Elevter Andronikashvili Institute of Physics, Ivane Javakhishvili Tbilisi State University, Tbilisi 0177, Georgia
4
Department of Earth Sciences, Ilia State University, Tbilisi 0162, Georgia
5
Vakhushti Bagrationi Institute of Geography, Ivane Javakhishvili Tbilisi State University, Tbilisi 0177, Georgia
*
Author to whom correspondence should be addressed.
Sustainability 2022, 14(9), 5621; https://doi.org/10.3390/su14095621
Submission received: 22 March 2022 / Revised: 18 April 2022 / Accepted: 25 April 2022 / Published: 6 May 2022
(This article belongs to the Special Issue Soil Pollution and Soil Remediation in Sustainable Agriculture)

Abstract

:
Gold and copper production is important to the Georgian economy, but at the same time, mineral resources are mined in one of the important agricultural areas of the country. This study evaluated water and soil quality in the region. Soil from 18 villages was analyzed. Some of these villages have not been investigated before and previous information about soil quality was unknown. Ecological risk factors and potential ecological risk were determined for the study area. Atomic absorption spectrometry was used to analyze heavy metals concentration in soil and water samples taken from the study area. Integrated water and soil data allowed us to see how these important natural resources influence each other. After the comparison of the four-year period of the study, we observed an increase of heavy metals increase in the soil in 2017 compared to 2014. Higher lead concentration was discovered within a two kilometer radius of the mining area whereas the highest cadmium concentration was observed in the village Ratevani, 15 km away from the nearest mine, where there was an extremely high ecological risk of Cd concentration. Further investigations are recommended to be done in Ratevani village as the people living in this village are at risk of Cd poisoning.

1. Introduction

Along with industrialization, mining activities also negatively influence the environment [1,2,3]. The increasing demand for mineral resources contributes to the growth of the mining industry in the world. Li et al. identified an association between industrialization and environmental quality [4]. Industrialization can have negative impacts on the environment [5]. Mining is one of the pathways by which various heavy metals (e.g., As, Cd, Cu, Mn, Pb, Zn) enter the environment [6]. Open-pit mining impacts natural ecosystems through both removal of soil and vegetation and burial beneath waste disposal sites [7]. Heavy metal contamination primarily comes from ore processing, tailings disposal, and wastewaters around mines [8].
Gold and copper open-pit mining in Kazreti (south-east Georgia) began in the 1970s and continues to play a significant role in the economic and social development of Georgia [9]. In 2011, a new pit called Abulbuqi was opened; in 2014 another pit, called Sakhdrisi quarry was opened and increased ore extraction from the pit and its further processing [10]. Geologically, the area is underlain by quaternary sediments, limestones, sandstones, and magmatic formations of the Cretaceous and Jurassic periods, and the main ore deposits are barite-gold-copper-polymetallic volcanogenic massive sulfides. These deposits show consistent patterns of ore zonation. These zones are from the base upward: (1) copper-pyrite (chalcopyrite, pyrite, quartz, and minor sphalerite, chalcozine, epidote, anhydrite, galena, and fluorite), (2) barite-polymetallic ore (barite, sphalerite, pyrite, galena, and minor chalcopyrite and marcasite), and (3) gold-bearing quartzites (quartz, barite, calcite, and pyrite) [11,12].
At the processing plant, gold is extracted from the ore by the cyanide leaching method where piles of crushed ore are soaked with cyanide solution [13]. Ores are extracted using drilling and blasting methods, and therefore release large volumes of particles into the air. The particulate matter (PM) could transport both harmful compounds and heavy metals from other sites [14]. The PM10 µm can travel 50 km away through the wind [15], while PM2.5 µm can travel hundreds of kilometers away from the eruption point and be deposited onto the soil during precipitation, which pollutes soils in the Bolnisi and Dmanisi municipalities.
The study area is located in the Mashavera river basin, one of the important agricultural regions of the country where much of the food is supplied to Georgian markets. Mashavera river is the main irrigation source in many settlements of the region. The Kazretula river is one of the eastern tributaries of the Mashavera and flows next to the mines. Before the mining company built a water treatment system at the mining site in 2019, the industrial water used at the ore processing plant was being discharged into the Kazretula river and causing Cu, Cd, Mn, Zn, and Pb pollution that impacted the Mashavera river water quality downstream. During their research, Matchavariani and Kalandadze found excess amounts of Cu, Cd, Zn, and SO42− in the Kazretula river. They also found high quantities of Cu, Mn, and Zn in the soils situated on the banks of the Mashavera river [16]. Withanachchi et al. investigated water in the Mashavera river basin and found alarming levels of heavy metals contamination that exceeded national and international thresholds [17]. The food products produced in the Mashavera basin are an important source for Georgian markets. The agricultural fields are used to grow various cereals, vegetables, herbs, and fruits. Henningsen et al. analyzed various food crops grown in the fields of this region and concluded that Cd, Cu, and Zn uptake by plants, especially by spinach, was high and exceeded precaution values [8].
Conducting new research was needed in the region, as its residents intensively consume locally grown food products and are at risk of poisoning. After 2014, the mining area and ore production increased in the region. This study aimed to examine soil and water pollution levels in 18 villages of the region (in the Bolnisi and Dmanisi municipalities) to assess their (soil/water) quality and evaluate how the mining area expansion impacted on the soil and water pollution levels. Previous studies have observed Mashavera river contamination from mine wastewater discharges, demonstrating the crucial need for comprehensive environmental monitoring to protect human health. For pollution assessment, Ecological Risk Factor (ER) and Potential Ecological Risk Index (RI) frameworks were used according to Hakanson and others [18,19,20,21,22,23,24,25,26]. Soils were sampled in 2014 and 2017 to evaluate changes of Cd, Cu, Mn, Pb, and Zn concentrations. The research evaluates sources of soil pollution in the study area to determine processes creating these patterns in soil chemistry; similar studies can be found in other works [27,28,29,30,31]. Finally, interpolation was done to estimate pollution levels across the entire study area, related to the works of Hou et al. and Luzio et al. [32,33]. After comparing the four-year period of the study, we observed an increase in heavy metals in the soil in 2017 compared to 2014. It is remarkable that the highest Pb concentration was found in the soils near the mining area, and its concentration decreased going further from the mine, whereas the highest Cd concentration was found in the village Ratevani, which is located further away from the mines. This pattern has not been observed in previous studies in the region. In addition, some of the villages in the study area have not been investigated before. It is recommended to do further research in Ratevani village as its population are at risk of Cd poisoning.

2. Materials and Methods

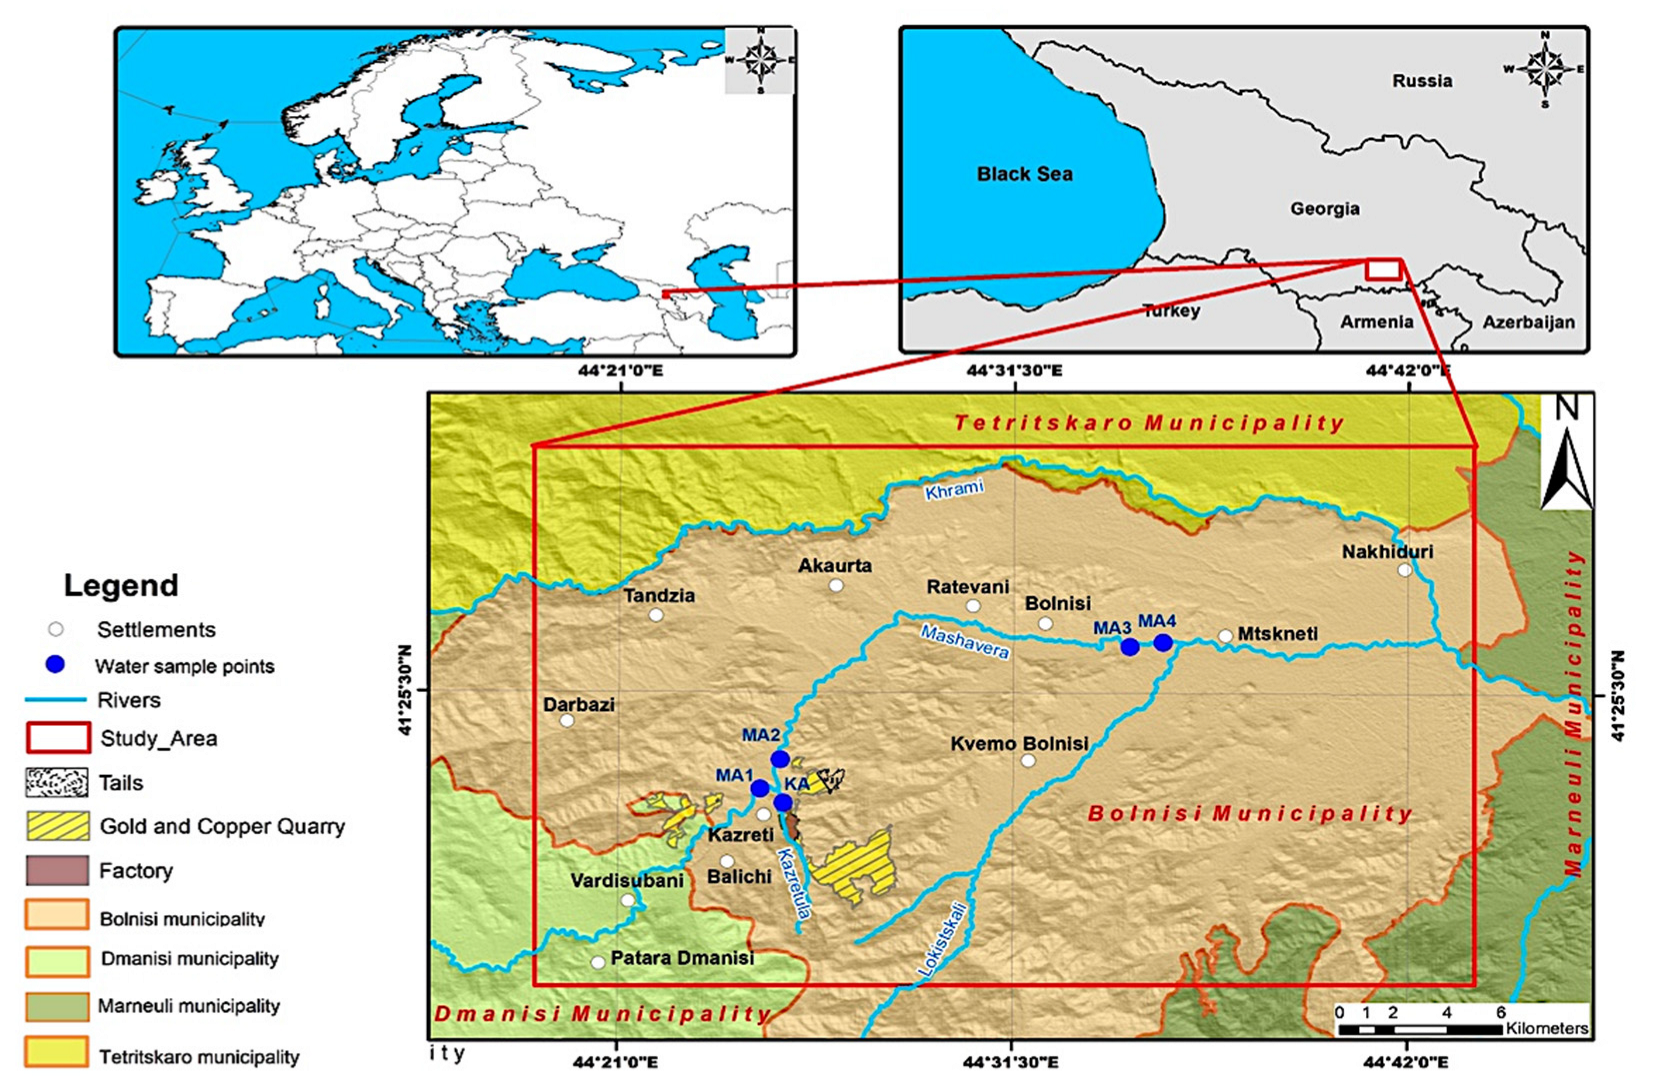
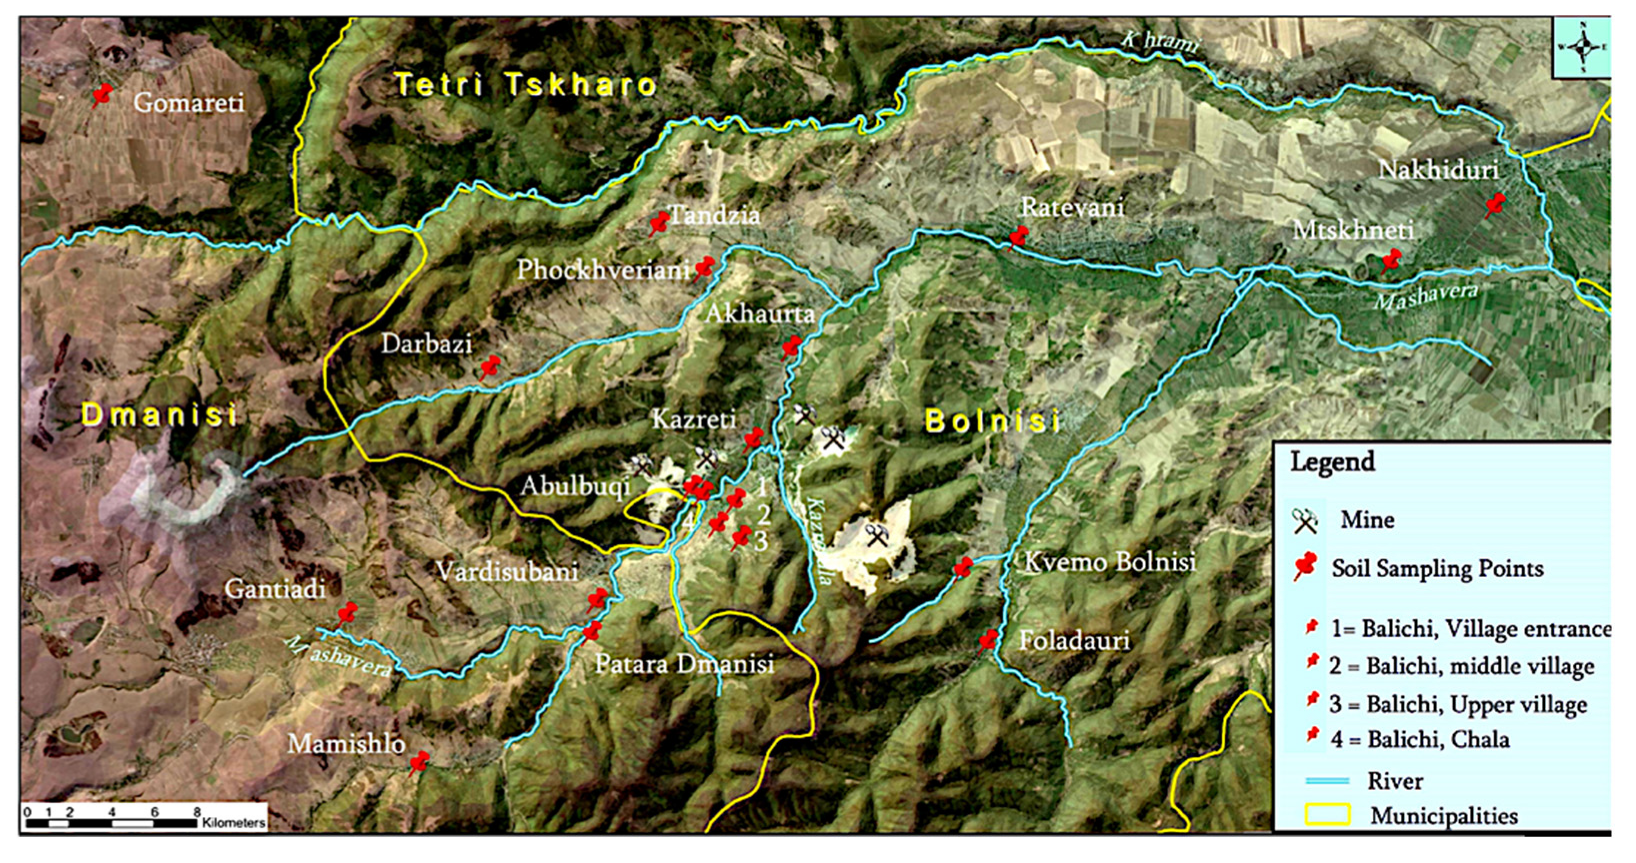
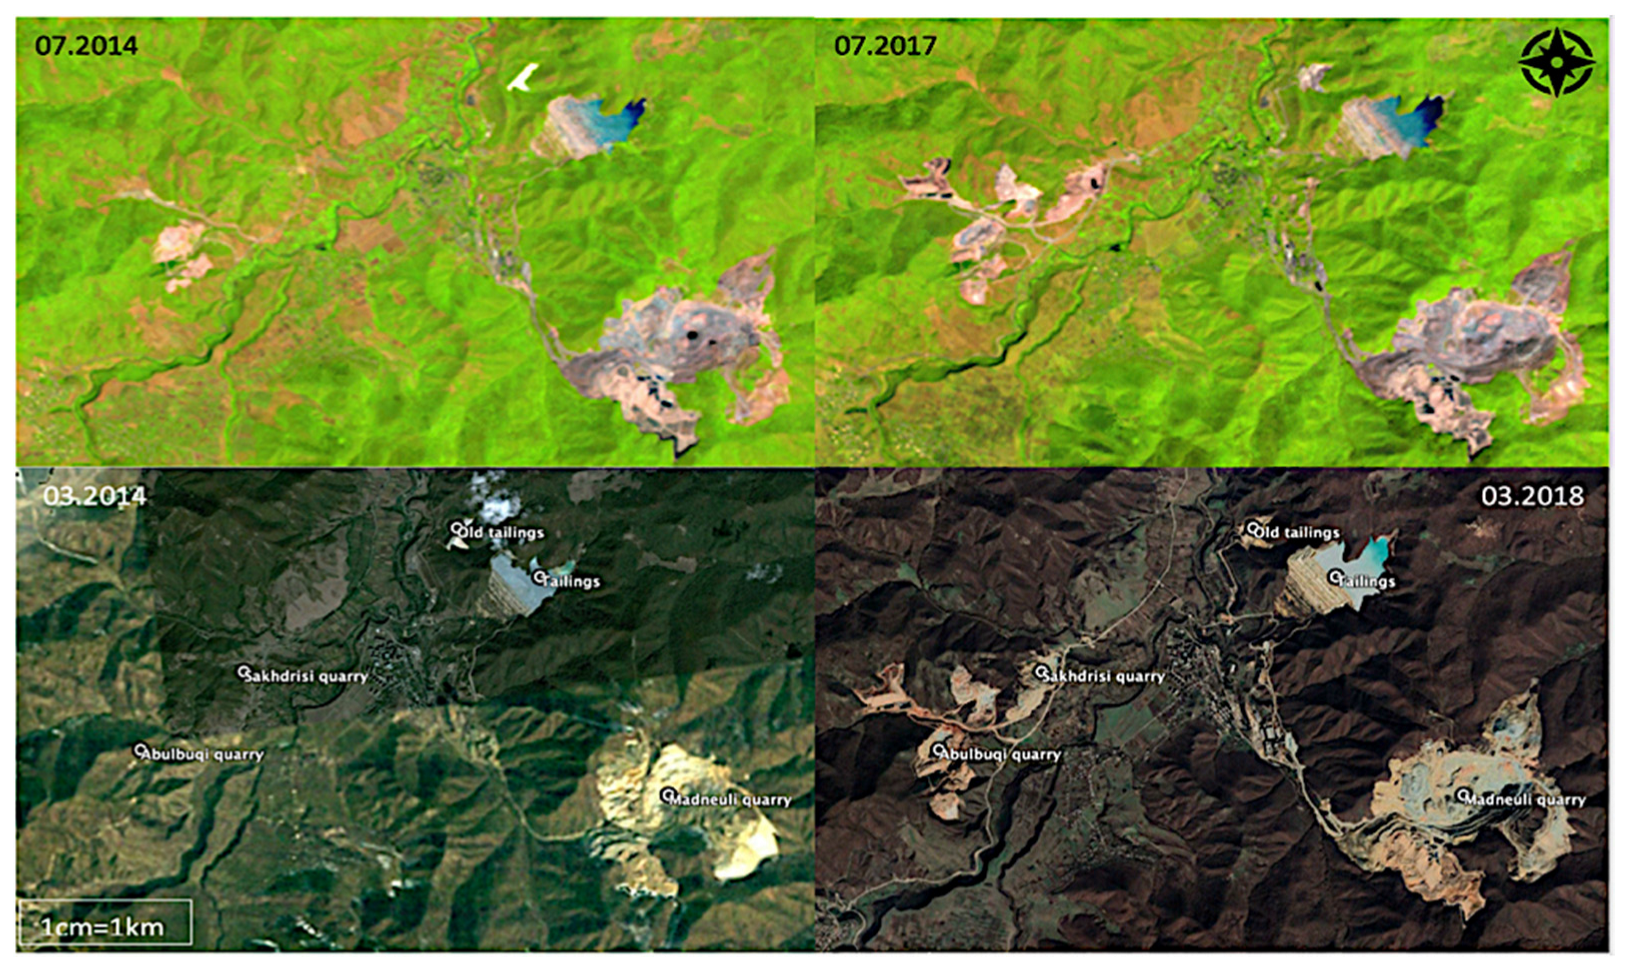
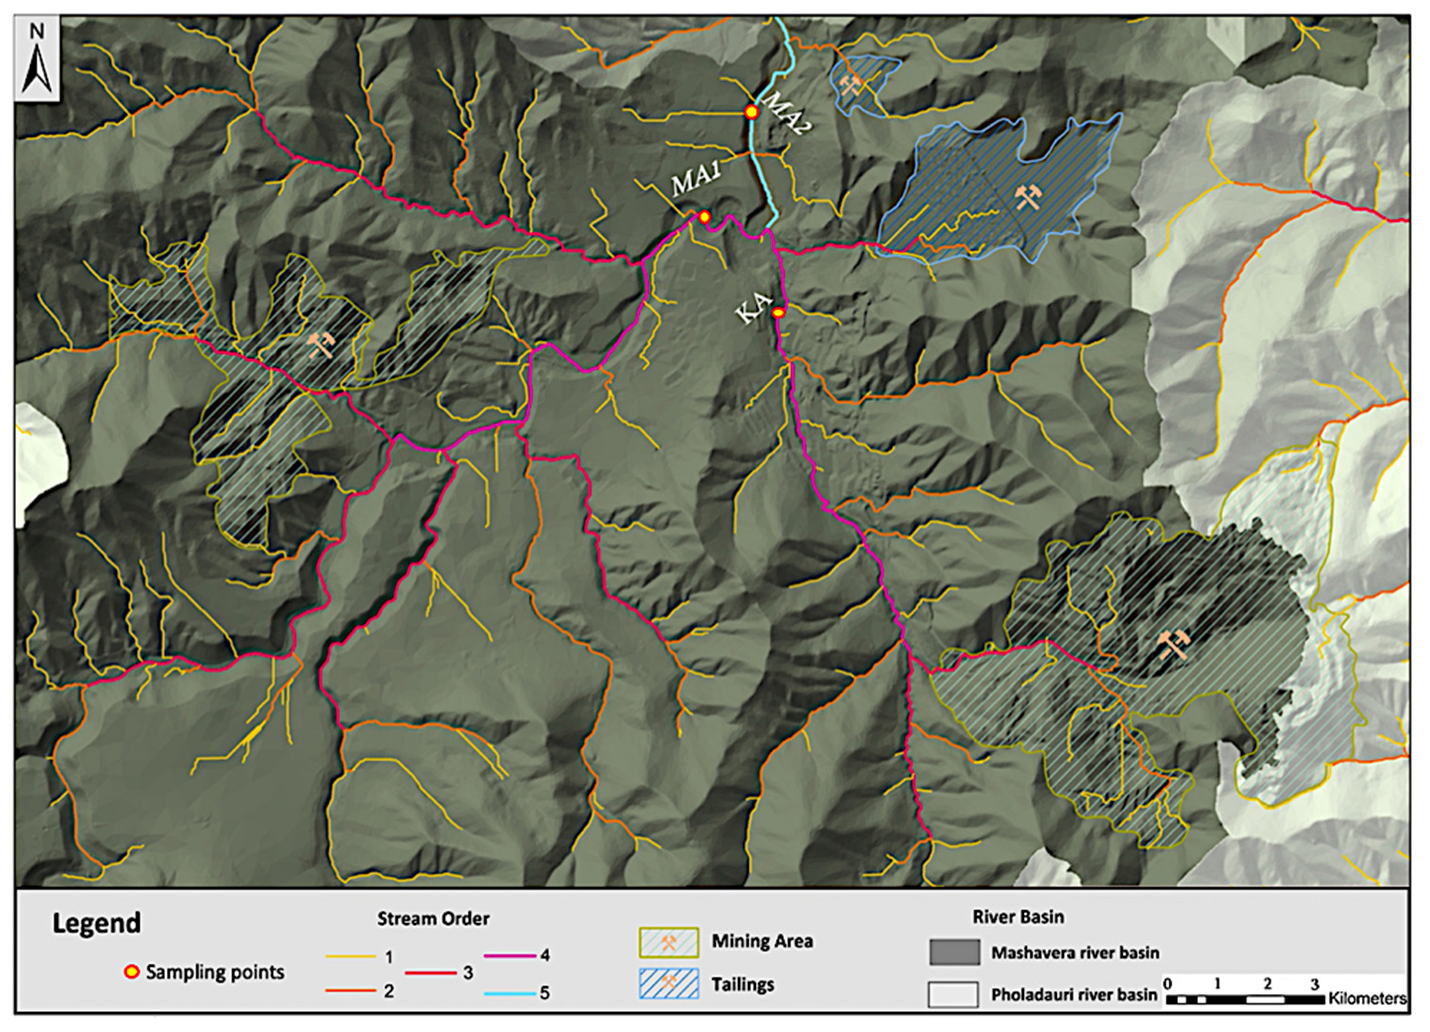
2.1. Description of Study Area

The orographic scheme of study area (Figure 1 and Figure 2) predominantly includes low elevations. The climate of Kazreti belongs to the steppe type of dry subtropics with moderately cold winters and hot summers [13]. The annual rainfall is on average 500–550 mm, and the average wind speed in 2014–2017 was 0.7 m/s, both north-east and south-west winds are widespread. The length of the Mashavera river is 66 km, the river run off varies over the seasons. The peak discharge is in spring—40% of annual runoff and decreasing through the winter as follows, 30.8% in the summer, 16.8% in the fall, and 12.4% in the winter [17]. The main soil types in the study area are chernozems, cinnamonic soils, and brown forest soils [10].

2.2. Sampling and Analytical Methods

Soil Sampling: In 2014, soil samples were collected in the Bolnisi and Dmanisi municipalities from agricultural fields various distances away from the mining site (Figure 2). The sampling point closest to a mine was 0.5 km away, and the farthest was 30 km away. Repeat sampling was conducted in 2017, and soil samples were taken from the same points as in 2014. The sampling and analytical methodology were the same for both dates (2014–2017). Each sample represents a surface soil aliquot taken at 0–5 and 30–35 cm from the depth of the soil. Soil samples were taken with scoop samplers, which were washed between each sampling collection. The study area was divided into regular grids of 1000 × 1000 m, where the samples were collected at five points, mechanically mixed, and a composite sample was prepared. One composite sample was made for each sampling point. The composite soil sample was transferred into a polyethylene bag, labeled, and transported to the laboratory. Unwanted materials such as stones, leaves, and debris were removed from the soil samples. The samples were oven-dried at 105 °C for 24 h, followed by grinding and sieving using a 2 mm sieve to homogenize the sample. To determine the concentrations of metals, 5 mL of 65% HNO3 (trace metal grade) was added to 1000 g of soil in a 50 mL volumetric flask. The flask was heated in a water bath (100 °C) for 2 h, then cooled down at room temperature for 15 min and filtered with a Whatman 0.45 μm paper filter into a 50 mL volumetric flask; the volume was made up to 50 mL with distilled water. The method used was similar to that of references [33,34]. These solutions were analyzed using AAS in the Iv. Javakhishvili Tbilisi State University Elevter Andronikashvili Institute of Physics, Georgia.
Water Sampling: Water samples were taken from Mashavera and Kazretula during July, October, and November. Water samples were collected in 1000 mL (HDPE) plastic bottles, which were washed and rinsed 3 times with distilled water prior to using them. Preservation of water samples was done by adding 2 drops of concentrated HNO3 (trace metal grade) to each sample. Each bottle was labeled according to the sampling location and time. The samples were then put in an insulated box and taken to the laboratory for further processing. Water samples were filtered with Whatman 0.45 µm filter paper in a Buchner funnel and heated at 100 °C until the volume was reduced to 50 mL, in a normal volumetric flask 100 mL. The volume was made up to 100 mL with acidified water (3 mL concentrated HNO3 + 1 L distilled water). Samples were analyzed by AAS in the chemistry laboratory of the Tbilisi State University Institute of Physics, Georgia.
Total concentrations were determined as soil and water concentrations added with their respective pseudo total digestions. For every 20 samples we included a replicate, a preparation blank, and an SRM. Montana soil SRM 2711a (National Institute of Standards and Technology, Gaithersburg, MD, USA) were used as mineral soil samples. All Cd, Co, Cu, Fe, Mn, Ni, Pb, and Zn concentrations for SRM materials were within 13% of their certified values. Preparation blanks had concentrations below detection limits for all metals.

2.3. Statistical Analyses

Ecological Risk Factor (ER) and Potential Ecological Risk Index (RI) were calculated for the assessment of soil contamination [33]. ER = T r i × Cf, where T r i is the toxic-response factor for a given substance (see Table 1) developed by Hảkanson [18], and Cf is the contamination factor. The ratio between the total metal content in the soil sample (Cm) and world average shale values, as a background values, were used for the Cf calculation: Cf = Cmetal/Cshale. See the grading standards for the ER and RI in the Table 2 [28,29].
The Pearson correlation coefficient was used to determine the correlation between the two variables: 1. The concentration of trace metals in soil and 2. the distance of each sampling point from the pollution source.
ArcGIS 10.2.1 was used to create hydrological modeling and Inverse Distance Weighted (IDW) interpolation maps of the study area. The hydrological tool allows us to determine flow direction, and show the stream network derived from the elevation model from SRTM data sources. Interpolation allowed to estimate values at new locations based on measurements found in a collection of points [32,33].

3. Results and Discussions
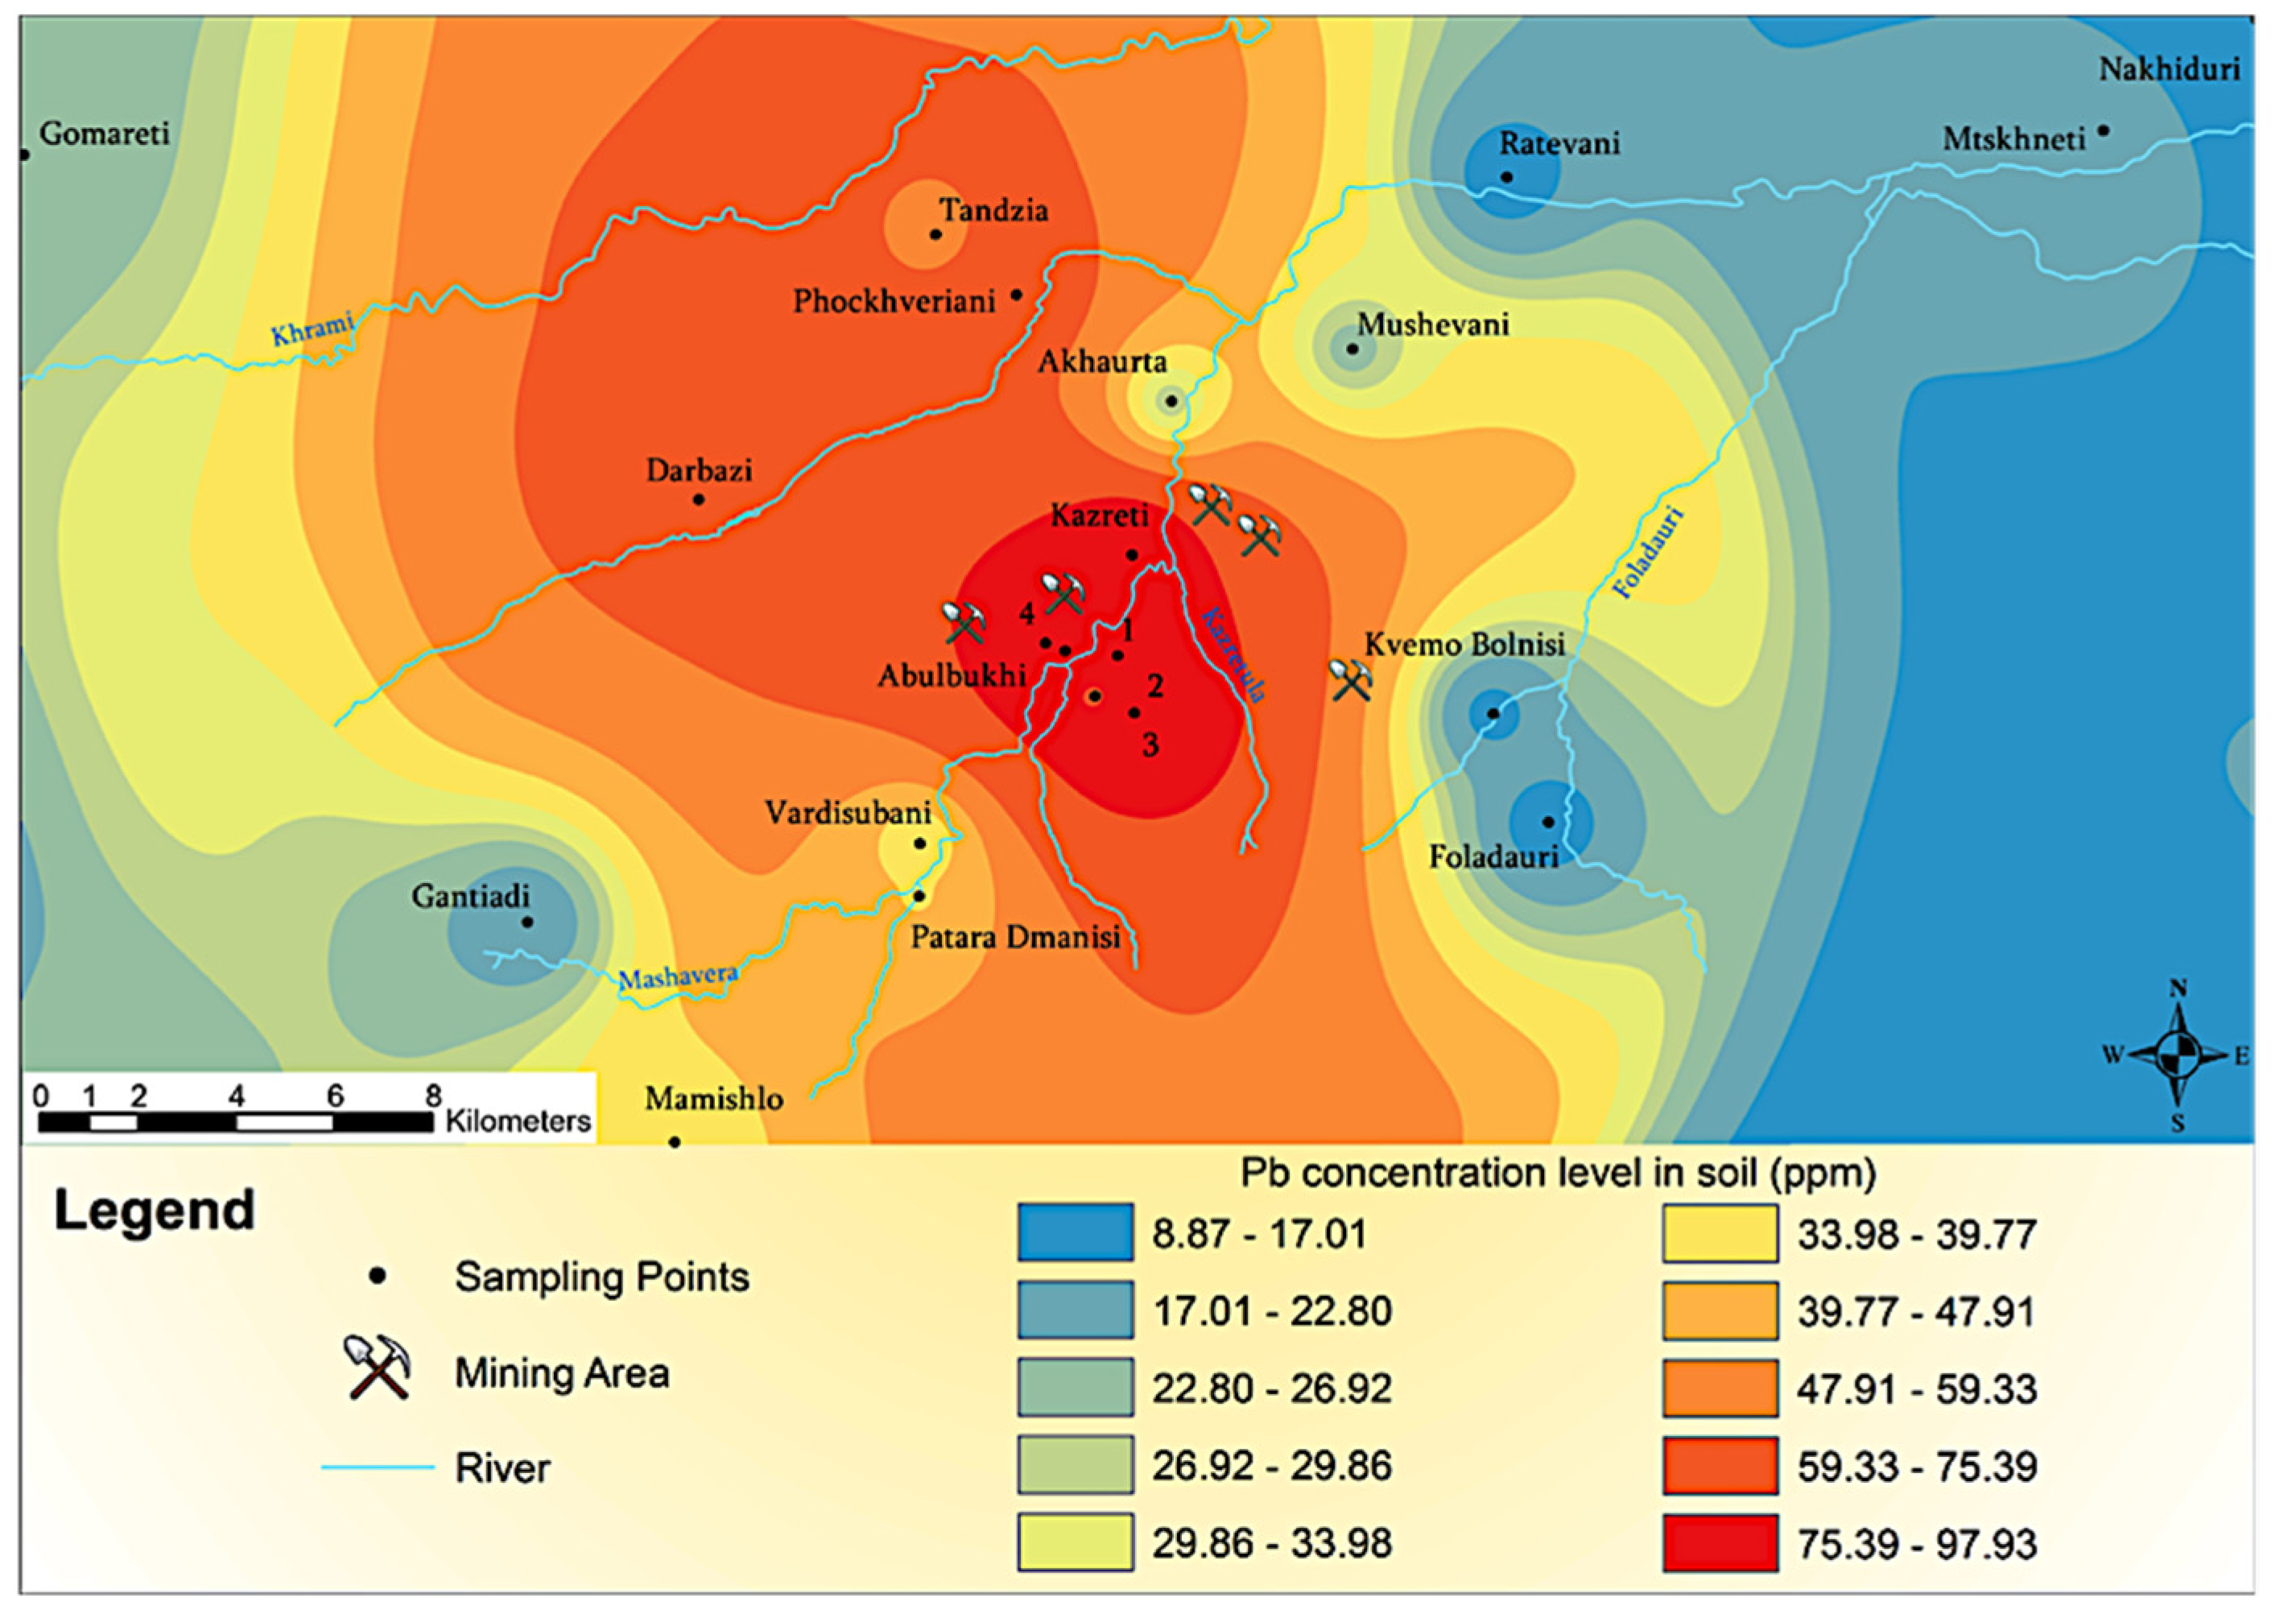
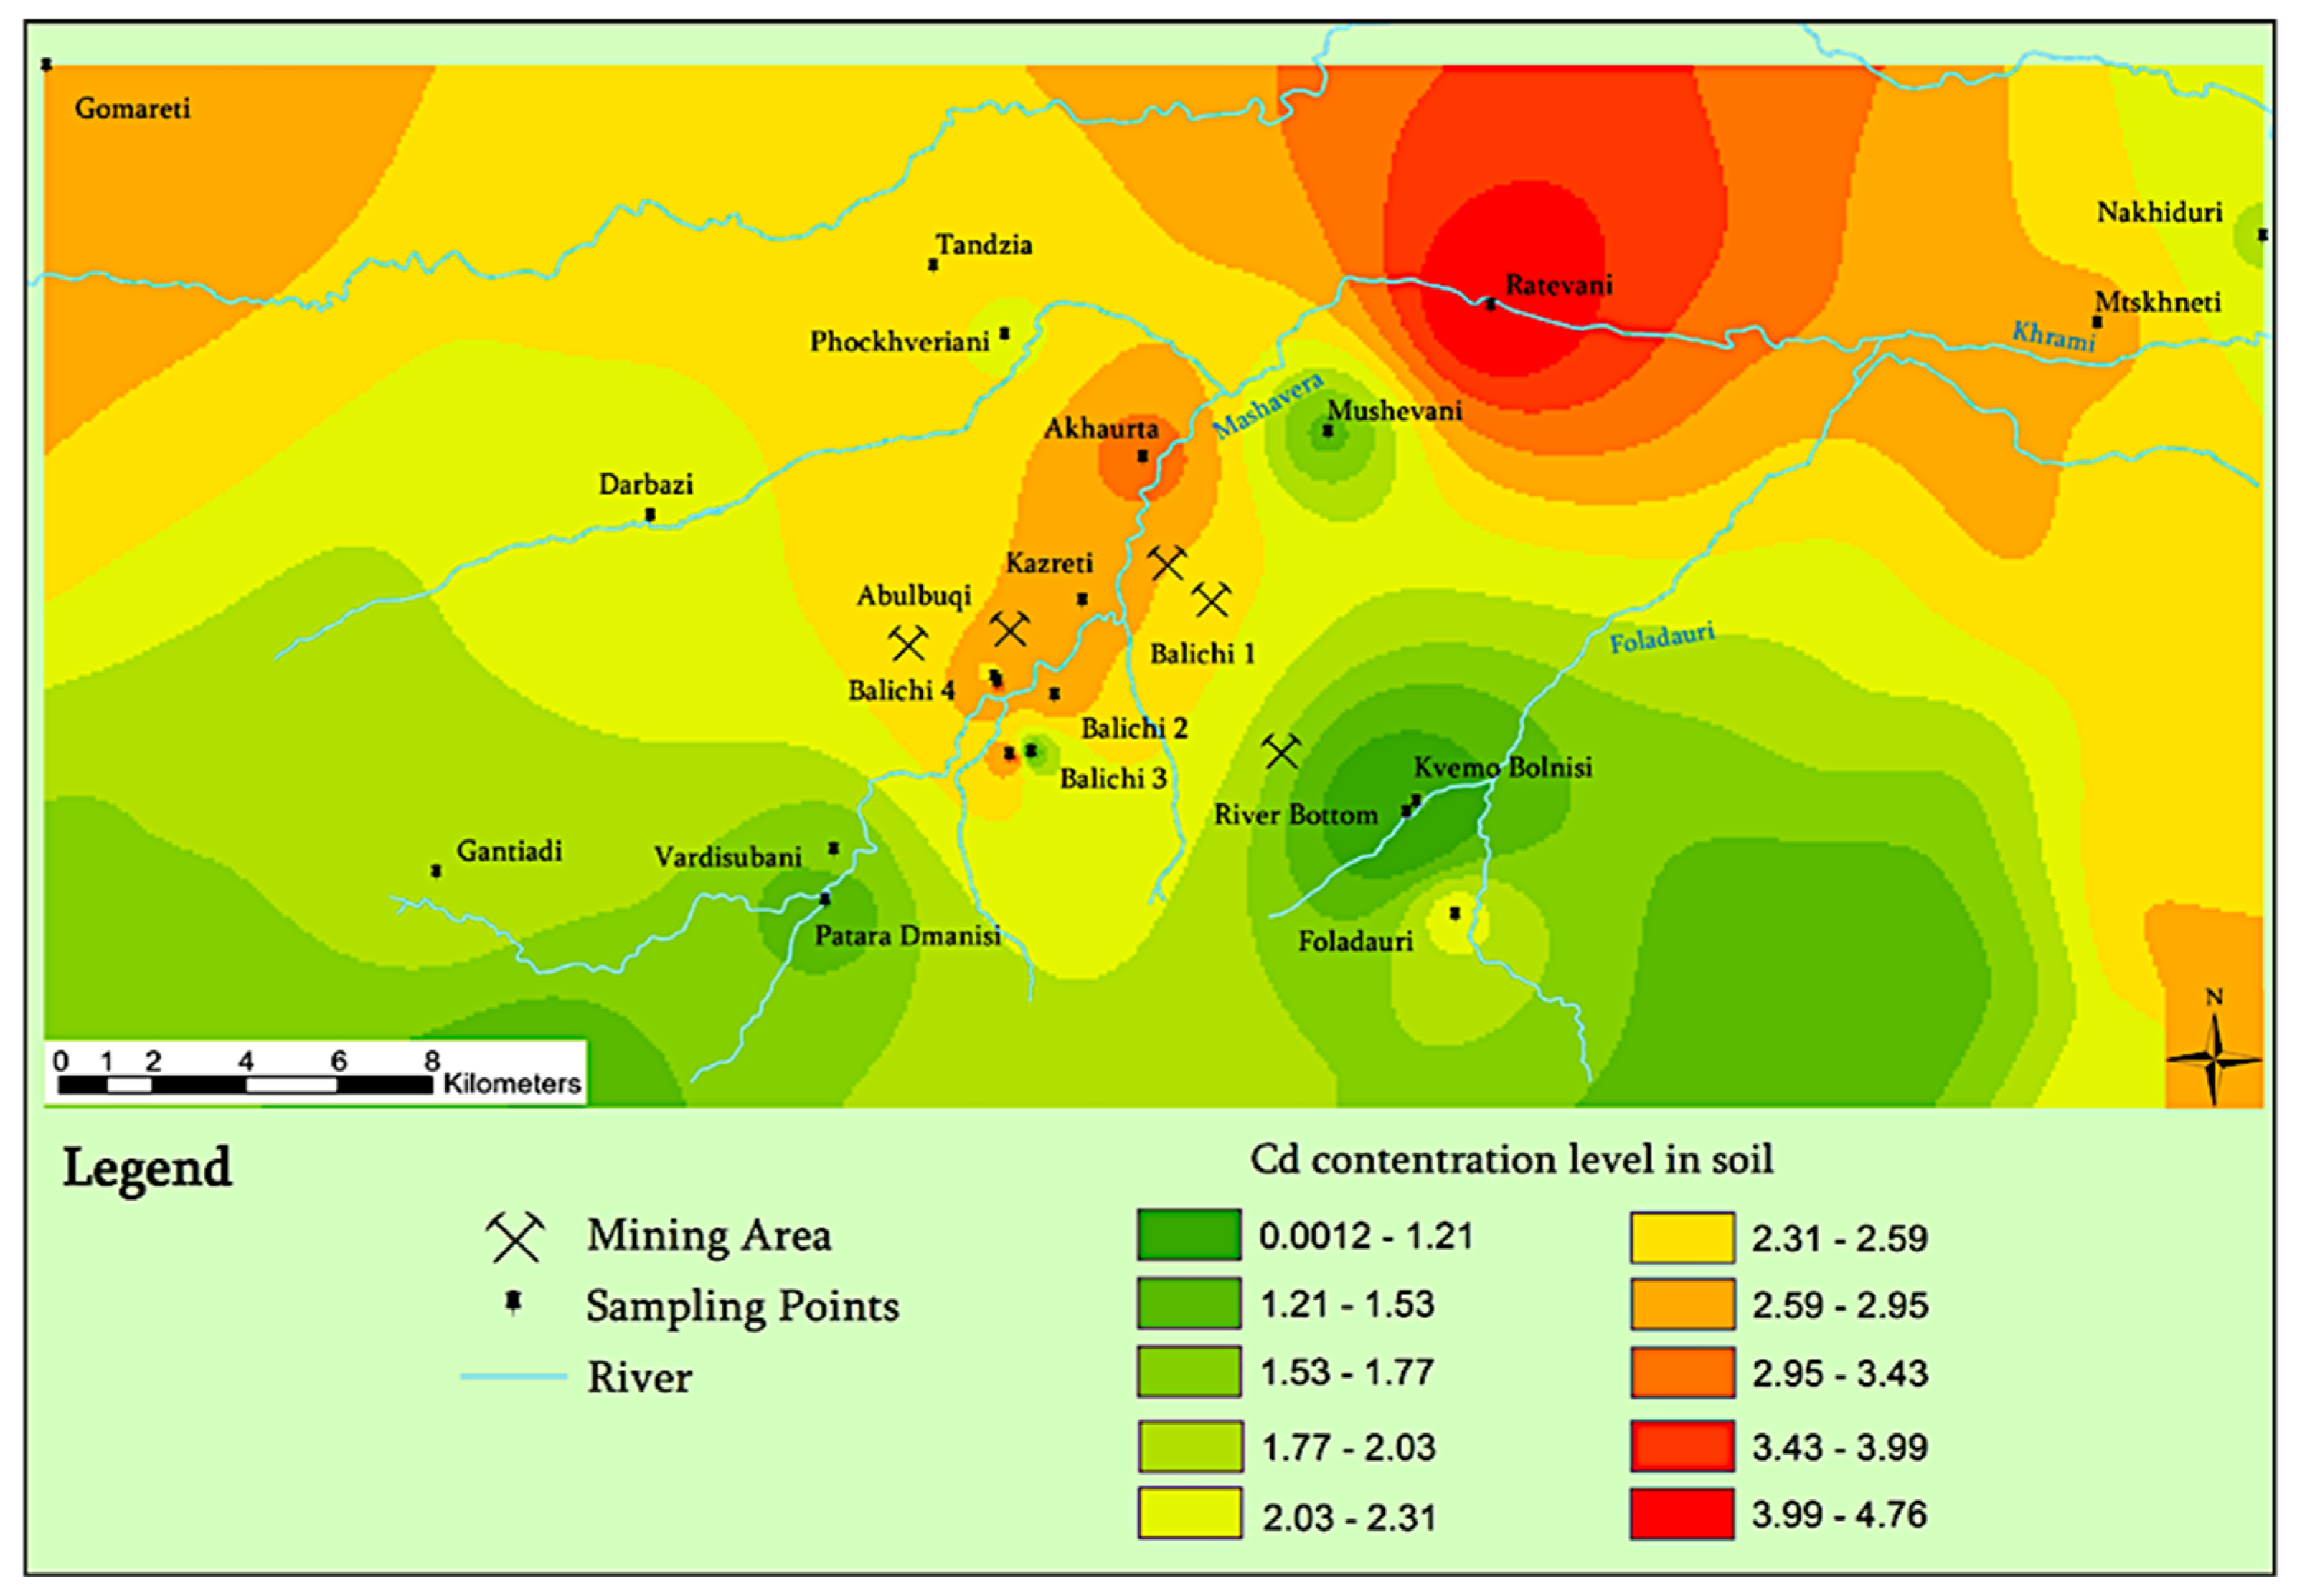
3.1. Soil Chemistry

Cd, Cu, Pb, Mn, and Zn contents were determined in the soil samples taken in 2014 from several settlements of Bolnisi and Dmanisi municipalities (Table 3). In 2014, Cd, Cu, and Zn concentrations in the soils of the villages Nakhiduri and Mtskhneti (30 km from the nearest mine) were higher than in the soils of the villages near the mining area [34,35]. In 2014, Cu concentration in Nakhiduri village soils exceeded the permissible limit by 229 mg/kg, and zinc by 48 mg/kg (Table 3). The Mn content in almost all samples was above the permissible limit, and the highest Mn (660 mg/kg) was found in Nakhiduri. Although, the distance from Nakhiduri to the closest mine is much greater (30 km) than other villages, Cd, Cu, Mn, and Zn concentrations in the soil were higher than the rest of the villages and exceeded the allowable limits. In the other villages, metal concentrations in soils were within the permissible limits (a slight excess of Mn was observed in some places). During the open pit mining, the drilling and blasting methods used for ore extraction lead to the eruption of harmful compounds into the air (Figure 3). These chemicals travel long distances and cause air pollution in the Bolnisi and Dmanisi municipalities, they are deposited into the soil and cause its pollution [36,37,38,39].
In 2014, the agricultural crops in Nakhiduri and Mtskhneti village were intensively irrigated by the Mashavera river which was being polluted by Cu, Cd, and Zn [8,15]. Using contaminated water for the irrigation of the fields resulted in the pollution of soils by Cd, Cu, and Zn. In the other investigated villages, soil samples were taken from the agricultural fields where the Mashavera river is not used for irrigation. Therefore, the higher concentrations of heavy metals in Nakhiduri and Mtskhneti villages in 2014 is explained by the use of contaminated Mashavera river water for the irrigation of agricultural crops.
In 2017, Cd, Cu, Mn, Pb, and Zn were analyzed in 18 villages (Table 3). Compared to 2014, their average concentration in soil increased. Cd in soils increased by 2 mg/kg, Pb increased by 35 mg/kg, Zn increased by 20 mg/kg, and Mn increased by 9 mg/kg. In contrast, the average content of Cu, in 2017, decreased by 29 mg/kg, due to the noticeable decrease of Cu in Nakhiduri soils. In 2017, the Cu concentration in soils of the villages Nakhiduri, Mtskhneti, Foladauri, kvemo Bolnisi, Akhaurta, and Patara Dmanisi decreased by 208, 94, 23, 8, 15, and 3 mg/kg, respectively, compared to 2014. Zn concentration decreased by 165, 111, 12, 70, 40, 38, 11.6, and 5 mg/kg in the villages Nakhiduri, Mtskhneti, Foladauri, Akhaurta, Gantiadi, Vardisubani, Mamishlo, and Patara Dmanisi, respectively. In contrast, a noticeable increase of Cu and Zn concentrations was observed in the villages located near the mining area (Balichi, Kazreti). Cd, Mn, and Pb concentrations in soils in Nakhiduri, Mn and Pb in Ratevani, Mn in Akhaurta, Mamishlo, and Patara Dmanisi were higher in 2014. Their Cd, Mn, and Pb concentrations increased in other investigated villages, the highest levels were discovered in the areas closest to the mine.
In the villages closest to the mine, the increase of Cd, Cu, Mn, Pb, and Zn in soils is a result of the expansion of the mining area and increase of ore production which contributed to releasing a higher amount of dust particles into the air. In the villages where Cu, Mn, and Zn reduction was observed, the agricultural fields where soil samples were taken were not used for cropping; the farmers fallowed soil between 2014 and 2017; the contaminated river water was not used to irrigate the soil and the metals could be leached to the lower levels of soils.
In the village of Nakhiduri in 2014, the Ecological Risk Factor (ER) for Cd was at 234 which is a high risk, and in Mtskhneti it was 144, which is a considerable risk (Table 4). In the other villages, the ER level was low. Accordingly, RI in Nakhiduri was 289 and in Mtskhneti it was 182.6, both at moderate risk. In other villages, there was a minimal RI.
In 2017, ER in the observed villages increased dramatically for Cd (Table 4). In most villages, there was a high ecological risk level for Cd pollution; the maximum was observed in the village Ratevani, where the ER for Cd was 475.8, which means an extremely high risk according to the ER formula grading standards. Observing the peak Cd concentration in the village Ratevani is unclear and needs further investigations. The study area had a low ER for Cu, Mn, Pb, and Zn pollution. Moderate RI risk was shown in the examined villages. Despite there being no ecological risk for Pb pollution, its concentration increased fivefold in 2017 in the village Balichi. Such an increase of Pb concentration in soils within four years is alarming. Comparing the years 2014 and2017, Landsat and Google Earth images show the growth of the mining area (Figure 4). In 2014, the Sakhdrisi mine was opened, increasing ore extraction; intensive deposit blasting contributed to releasing more particulate matter into the air daily and resulted in the increase of Cd and Pb concentrations in the study area in 2017 year. In 2010, soil pollution in the Bolnisi municipality was studied by Kalandadze and Matchavariani, who confirmed its contamination by Cd, Cu, and Zn (2019) [35].

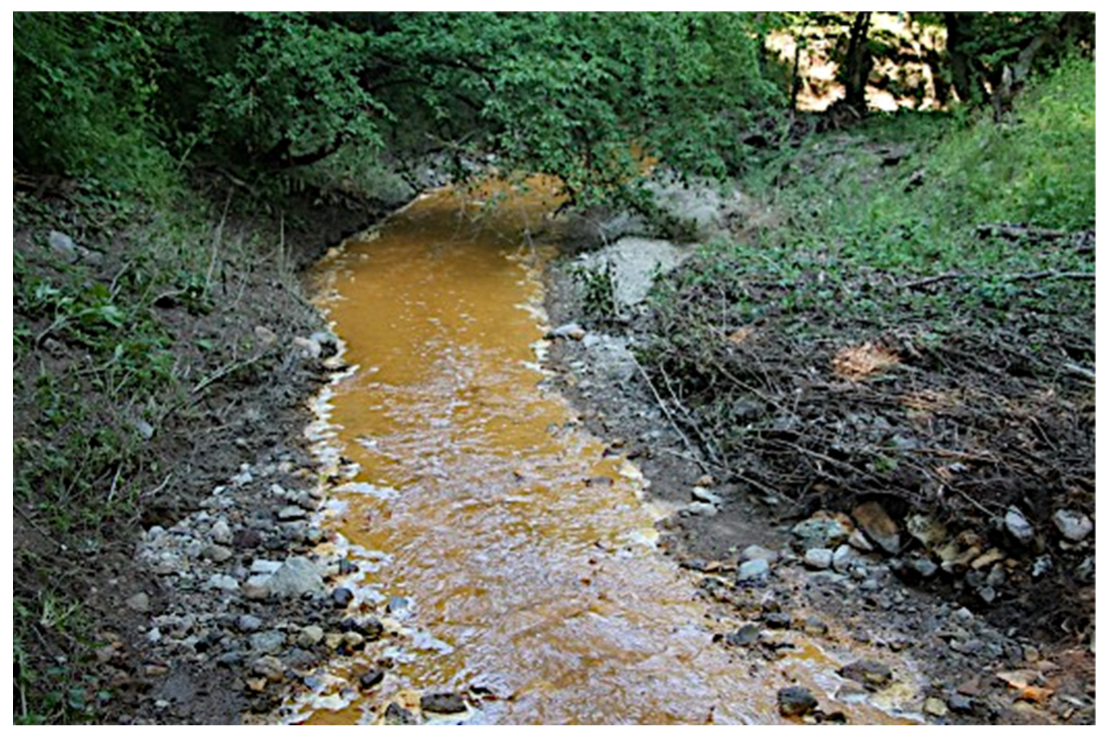
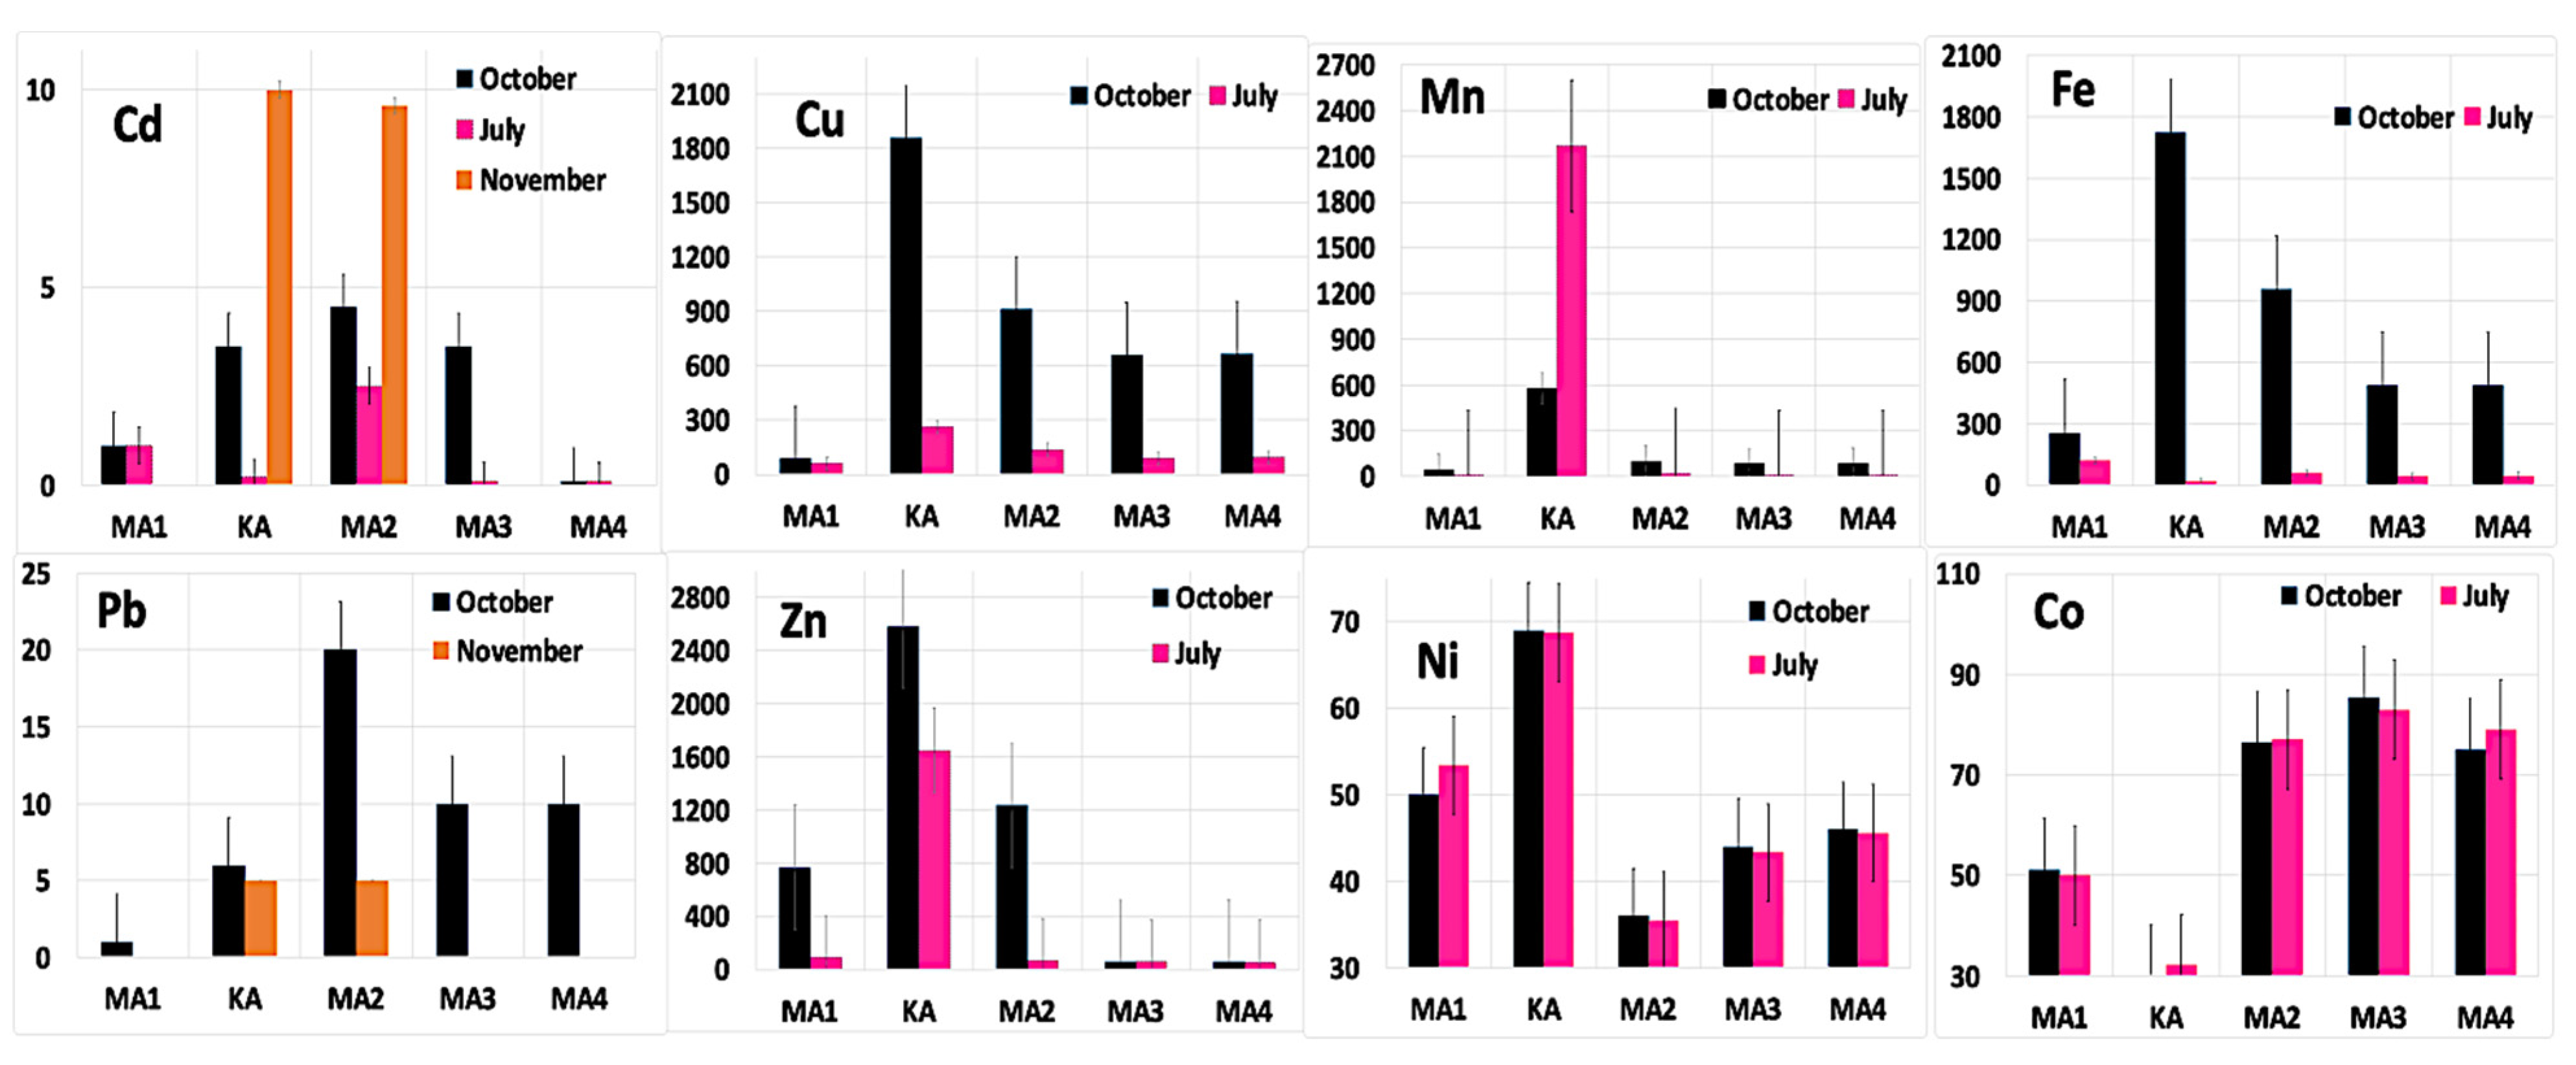
3.2. Water Chemistry

The Mashavera river is used to irrigate agricultural fields in the study area. The river is polluted by wastewater from mining discharged to the Kazretula river, which contributes soil pollution (Figure 5) [40,41,42,43,44]. The study area is hilly, the average elevation of the open-pits are 800 m, whereas the elevation of Mashavera river and agricultural fields around it are 100 m less than mines. Moreover, waste materials from the ore production are deposited near the mining area, which creates steep slopes, which are not terraced or planted to stabilize the slopes. The degree of mine hill slopes ranges from 25 to 57 degrees, whereas the slope of the agricultural fields ranges from 0 to 6 degrees (see the slope map on Figure 6). Therefore, runoff from the mine hill slopes leads to erosion and the contamination of nearby rivers and fields by heavy metals containing fines. The drainage network was derived from elevation data using the ArcGIS hydrological model (Figure 7). First-order streams are dominated by overland flow of water, they have no upstream concentrated flow, so they are most susceptible to non-point source pollution problems.
We took five samples from the Kazretula (KA) and Mashavera (MA) rivers in July, October, and November in 2017 and analyzed Cd, Co, Cu, Fe, Mn, Ni, Pb, and Zn using an AAS (Atomic Absorption Spectrometer). Cd, Cu, Fe, Pb, and Zn were higher in October than in July, unlike Co, Mn, and Ni (Figure 8, Table 5); The highest amount of Cd was observed in November. Changing runoff of the rivers during the seasons also influenced the change of the metals’ concentrations in the samples. The discharge of the Mashavera river was nearly halved in autumn (16.8% of annual discharge) compared to summer (30.8%). The decrease in the runoff of river water led us to observe higher concentration of metals in October and November, compared to July. The concentration of Cu, Fe, Mn, and Zn were higher in the Kazretula river, while Cd in October to July and Pb in October were higher in the Mashavera river at 1 km after intersecting with Kazretula river. However, if industrial water is discharged into the Kazretula river, why is the concentration of Cd and Pb higher in the Mashavera river after the intersection with Kazretula river? This fact can be explained by the Tailings Pond, which is before the MA2 sampling point and is the source of acid mine drainage with pH values < 3 and high dissolved heavy metals concentrations (Table 6). In 2017, two acid mine drainages were analyzed and measured Cd, Cu, and Zn concentrations that showed high toxic values. These acid mine drainages flowed into the river and caused its contamination with toxic substances.
The Mashavera river is used to irrigate soils in the of villages Nakhiduri and Mtskneti, so it can pollute agricultural soils that are transferred into the food chain and impact human health. The higher concentration of heavy metals in Nakhiduri and Mtskhneti in 2014 was caused by use of the contaminated river Mashavera for soil irrigation. Due to the favorable climate conditions (warmer seasons) in the villages of Nakhidui and Mtskhneti, farmers cultivate crops twice a year, thus they intensively irrigate fields and use pesticides, which is one of the contributing factors impacting higher concentration of heavy metals in these villages. In contrast, in 2017, we observed heavy metals reduction in the villages of Nakhiduri and Mtskhneti, which was explained by the fact that the farmers were fallowing soils in 2014–2017, which prevented addition of heavy metals into the soils through the contaminated river water, and soil heavy metals were leached to the lower levels of the soil.
The water results showing high Cd, Cu, Fe, Mn, and Zn concentrations in the Kazretula river that indicates the influence of industrial activities on it. Seasonality also impacts the fluctuations of metals concentrations in the water. Maximum concentrations of Cd, Cu, Mn, Fe, and Zn were observed in the Kazretula river that also exceeded the permissible limits (Table 5). Intensive monitoring of water is recommended to be done in the study area as these rivers are valuable for the region’s population.
The use of the correlation coefficient in the present study allowed us to determine the relationship between the heavy metal contamination in soils and the distances of the sampling points from the source of contamination. The correlation coefficient was calculated separately for each investigated element. The two different variables were (1) the content of Cd, Cu, Mn, Pb, and Zn in the soils, and (2) the distance from each sampling point to the source of contamination, in this case to the open pit.
The correlation coefficient was calculated for Cd, Cu, Mn, Pb, and Zn, analyzed in 2017, to determine whether the distance from the mine to the village affects the change in the concentration of heavy metals in the soils. Out of the five elements, we obtained a high correlation only for Pb, r (Pb) = 0.73, which means that the closer the village is to the mining area, the higher the lead content is in the soils of this village, and vice versa, the farther away the village is from the quarry, the lower the Pb content in the soils is. No similar pattern was found for the other elements, r (Cd) = −0.06, r (Cu) = 0.02, r (Mn) = 0.05, r (Zn) = 0.12, (Table 7). In the case of Cd, Cu, Mn, and Zn, there was no correlation. For example, Cd content in the soil of the village Gomareti was almost the same as in the village Balichi, even though the village Gomareti is located 22 km away from the mine, and the village Balichi is 2 km away. A positively high correlation was found only for Pb.
The interpolation maps were created by using ArcGIS (IDW), they show the distribution of Pb (Figure 9) and Cd (Figure 10) in soils in the Bolnisi and Dmanisi municipalities. In Figure 9, the colors range from blue to red, indicating the minimum and maximum Pb contents in the soils, i.e., the dark red color indicates the highest level of Pb contamination, while the dark blue shows no Pb contamination in the soils. In Figure 10, the colors range from green to red, which is similarly the minimum and maximum Cd content in soils. As can be seen from the maps, the highest level of Pb pollution presented in the villages of Balichi and Kazreti, which are the closest villages to the mine. The highest Cd concentration was found in the village Ratevani, which is 15 km away from the mining area. Cd content was less in the villages adjacent to the mining area. It is unclear why the Cd level was higher further away from the mine rather than closer to it. Further investigation of Ratevani soils is highly recommended because high cadmium concentration is a risk for the human health of the village population.
Integrated water and soil pollution data in the study area revealed that in 2014, high concentrations of heavy metals in agricultural soil in the villages Nakhiduri and Mtskhneti resulted from using the Mashavera river water for irrigation, which was contaminated by various heavy metals from the wastewater flowing out the mining factory. Nakhiduri and Mtskhneti were at high Ecological Risk (ER) for Cd pollution in 2014. In 2017, the new study showed that trace metals concentration increased in the villages near the mining area, which is due to opening new mines and release of higher amounts of dust particles into the atmosphere during intensive open-pit mining, which caused soil pollution by Cd, Cu, Mn, Pb, and Zn. In 2017, in nearly every examined village, Cd pollution was at high Ecological Risk, the highest was observed in the village Ratevani. A high correlation was found between the concentration of Pb in the soils and the distance from these soils to the mining area, meaning that the closer the soil is to the mine, the higher the lead content is in it, and vice versa. No correlation was found for Cd, Cu, Mn, or Zn. Interpolation maps showed Pb and Cd distribution in the region, which supports the assumption that the highest Pb concentration is in the villages near the mining area, and the highest Cd content is in further places. Further investigations are recommended to be done to protect the human health of those living in this region.

4. Conclusions

Thus, mining activities cause water and soil pollution and impact environmental quality in the region. The mining area and ore production increase cause environmental quality decrease in the nearby villages. Using contaminated river water for soil irrigation causes soil pollution. Heavy metals are reduced in the fallow soils that were not harvested for four years, indicating the leaching of heavy metals to the deeper layers of soil. Seasonality impacts the fluctuations of heavy metals concentrations in the water. Extremely high ER and potential RI risk were observed in some of the investigated villages, which requires further research in the area to protect the life of the region’s population.

Author Contributions

Conceptualization, A.G.; Methodology, G.A.; Resources, I.A. and L.A.; Software, M.A.; Supervision, L.M. and R.G.; Visualization, M.A.; Writing—original draft, M.A. All authors have read and agreed to the published version of the manuscript.

Funding

This research was funded by the Shota Rustaveli National Science Foundation of Georgia (grant numbers DO/187/150/14 and PHDF-21-1718) and Heinrich Böll Stiftung. Publication charges for this article were fully paid by the University Library System, University of Pittsburgh.

Institutional Review Board Statement

Not applicable.

Informed Consent Statement

Not applicable.

Data Availability Statement

All of the data used in out article is our own research. This data can be found here: http://www.jeb.co.in/journal_issues/202003_mar20_spl/paper_06.pdf, accessed on 21 March 2022.

Acknowledgments

Authors thank Daniel Joseph Bain and Ramos Caineta, Júlio for reviewing the article.

Conflicts of Interest

The authors declare no conflict of interest.

References

  1. Salomons, W. Environmental impact of metals derived from mining activities: Processes, predictions, prevention. J. Geochem. Explor. 1995, 52, 5. [Google Scholar] [CrossRef]
  2. Cooke, J.A.; Johnson, M.S. Ecological restoration of land with particular reference to the mining of metals and industrial minerals: A review of theory and practice. Environ. Rev. 2002, 10, 41. [Google Scholar] [CrossRef] [Green Version]
  3. Li, Z.; Ma, Z.; Van Der Kuijp, T.J.; Yuan, Z.; Huang, L. A review of soil heavy metal pollution from mines in China: Pollution and health risk assessment. Sci. Total Environ. 2014, 468, 843–853. [Google Scholar] [CrossRef] [PubMed]
  4. Li, T.; Li, Y.; An, D.; Han, Y.; Xu, S.; Lu, Z.; Crittenden, J. Mining of the association rules between industrialization level and air quality to inform high-quality development in China. J. Environ. Manag. 2019, 246, 564. [Google Scholar] [CrossRef]
  5. Abdul-Wahab, S.; Marikar, F. The environmental impact of gold mines: Pollution by heavy metals. Open Eng. 2012, 2, 304. [Google Scholar] [CrossRef]
  6. Korça, B.; Demaku, S. Evaluating the presence of heavy metals in the vicinity of an industrial complex. Pol. J. Environ. Stud. 2020, 29, 3643. [Google Scholar] [CrossRef]
  7. Linhua, S.; Songbao, F. Heavy Metals in the Surface Soil around a Coalmine: Pollution Assessment and Source Identification. Pol. J. Environ. Stud. 2019, 28, 2717. [Google Scholar] [CrossRef]
  8. Felix-Henningsen, P.; Urushadze, T.F.; Narimanidze, E.I.; Wichmann, L.; Steffens, D.; Kalandadze, B.B. Heavy Metal Pollution of Soils and Food Crops due to Mining Wastes in the Mashavera River Valley. Bull. Georg. Natl. Acad. Sci. 2007, 175, 35–49. [Google Scholar]
  9. Gongadze, A.; Matchavariani, L.; Avkopashvili, M.; Avkopashvili, G. Accumulation and distribution of heavy metals in soils from the explosions by mining-processing poly-metallic plant. Int. Multidiscip. Sci. GeoConference SGEM 2018, 18, 11–18. [Google Scholar]
  10. Avkopashvili, M.; Gongadze, A.; Avkopashvili, G.; Matchavariani, L.; Asanidze, L.; Lagidze, L. Metals distribution in soil contaminated by gold and copper mining in Georgia. J. Environ. Biol. 2020, 41, 310. [Google Scholar] [CrossRef]
  11. Little, C.; Magalashvili, A.; Banks, D. Neotethyan Late Cretaceous volcanic arc hydrothermal vent fauna. Geology 2007, 35, 835. [Google Scholar] [CrossRef]
  12. Magalashvili, A. New factors of the Bolnisi mining district economic geology (Southern Georgia). Proc. Georgian Acad. Sci. Geol. Inst. New Ser. 2004, 119, 823. [Google Scholar]
  13. Hanauer, T.; Felix-Henningsen, P.; Steffens, D.; Kalandadze, B.; Navrozashvili, L.; Urushadze, T. In situ stabilization of metals (Cu, Cd, and Zn) in contaminated soils in the region of Bolnisi, Georgia. Plant Soil 2011, 341, 193. [Google Scholar] [CrossRef]
  14. Avkopashvili, G.; Avkopashvili, M.; Gongadze, A.; Gakhokidze, R. Eco-monitoring of Georgia’s contaminated soil and water with heavy metals. Carpathian J. Earth Environ. Sci. 2017, 12, 595. [Google Scholar]
  15. Felix-Henningsen, P.; Urushadze, T.; Steffens, D.; Kalandadze, B.; Narimanidze, E. Uptake of heavy metals by food crops from highly-polluted Chernozem-like soils in an irrigation district south of Tbilisi, eastern Georgia. Agron. Res. 2010, 8, 781. [Google Scholar]
  16. Matchavariani, L.; Kalandadze, B. Pollution of soils by heavy metals from irrigation near mining region of Georgia. Forum Geogr. 2012, 11, 127–136. [Google Scholar] [CrossRef]
  17. Withanachchi, S.S.; Ghambashidze, G.; Kunchulia, I.; Urushadze, T.; Ploeger, A. Water quality in surface water: A preliminary assessment of heavy metal contamination of the Mashavera River, Georgia. Int. J. Environ. Res. Public Health 2008, 15, 621. [Google Scholar] [CrossRef] [Green Version]
  18. Hakanson, L. An ecological risk index for aquatic pollution control a sedimentological approach. Water Res. 1980, 14, 975. [Google Scholar] [CrossRef]
  19. Mugoša, B.; Đurović, D.; Nedović-Vuković, M.; Barjaktarović-Labović, S.; Vrvić, M. Assessment of Ecological Risk of Heavy Metal Contamination in Coastal Municipalities of Montenegro. Int. J. Environ. Res. Public Health 2016, 13, 393. [Google Scholar] [CrossRef] [Green Version]
  20. Sherameti, I.; Varma, A. Heavy metal contamination of soils: Monitoring and remediation. In Soil Biology; Springer: Cham, Switzerland, 2015; Volume 44. [Google Scholar]
  21. Wu, J.; Jia, R.; Xuan, H.; Zhang, D.; Zhang, G.; Xiao, Y. Priority Soil Pollution Management of Contaminated Site Based on Human Health Risk Assessment: A Case Study in Southwest China. Sustainability 2022, 14, 3663. [Google Scholar] [CrossRef]
  22. Latif, A.; Bilal, M.; Asghar, W.; Azeem, M.; Ahmad, M.I.; Abbas, A.; Ahmad, M.Z.; Shahzad, T. Heavy metal accumulation in vegetables and assessment of their potential health Risk. J. Environ. Anal. Chem. 2018, 5, 234. [Google Scholar] [CrossRef]
  23. Guo, B.; Su, Y.; Pei, L.; Wang, X.; Wei, X.; Zhang, B.; Zhang, D.; Wang, X. Contamination, Distribution and Health Risk Assessment of Risk Elements in Topsoil for Amusement Parks in Xi’an, China. Pol. J. Environ. Stud. 2021, 30, 601. [Google Scholar] [CrossRef]
  24. Rolka, E.; Żołnowski, A.C.; Sadowska, M.M. Assessment of heavy metal content in soils adjacent to the DK16-Route in Olsztyn (North-Eastern Poland). Pol. J. Environ. Stud. 2020, 29, 4303. [Google Scholar] [CrossRef]
  25. Bartkowiak, A.; Piątek, M. Analysis of heavy metal content in soil fertilised with fresh and granulated digestate. Pol. J. Environ. Stud. 2020, 29, 3517. [Google Scholar] [CrossRef]
  26. Hassan, N.U.; Mahmood, Q.; Waseem, A.; Irshad, M.; Pervez, A. Assessment of heavy metals in wheat plants irrigated with contaminated wastewater. Pol. J. Environ. Stud. 2013, 22, 115. [Google Scholar]
  27. Jaishankar, M.; Tseten, T.; Anbalagan, N.; Mathew, B.B.; Beeregowda, K.N. Toxicity, mechanism and health effects of some heavy metals. Interdiscip. Toxicol. 2014, 7, 60. [Google Scholar] [CrossRef] [Green Version]
  28. Wongsasuluk, P.; Chotpantarat, S.; Siriwong, W.; Robson, M. Heavy metal contamination and human health risk assessment in drinking water from shallow groundwater wells in an agricultural area in Ubon Ratchathani province, Thailand. Environ. Geochem. Health 2014, 36, 169. [Google Scholar] [CrossRef]
  29. Zhang, F.; He, Y.; Zhao, C.; Kou, Y.; Huang, K. Heavy Metals Pollution Characteristics and Health Risk Assessment of Farmland Soils and Agricultural Products in a Mining Area of Henan Province, China. Pol. J. Environ. Stud. 2020, 29, 3929. [Google Scholar] [CrossRef]
  30. Obiora, S.C.; Chukwu, A.; Toteu, S.F.; Davies, T.C. Assessment of Heavy Metal Contamination in Soils Around Lead (Pb)-Zinc (Zn) Mining Areas in Enyigba, Southeastern Nigeria. J. Geol. Soc. India 2016, 87, 453. [Google Scholar] [CrossRef]
  31. Han, Z.X.; Wan, D.; Tian, H.X.; He, W.X.; Wang, Z.Q.; Liu, Q. Pollution Assessment of Heavy Metals in Soils and Plants around a Molybdenum Mine in Central China. Pol. J. Environ. Stud. 2019, 28, 123. [Google Scholar] [CrossRef]
  32. Hou, D.; O’connor, D.; Nathanail, P.; Tian, L.; Ma, Y. Integrated GIS and multivariate statistical analysis for regional scale assessment of heavy metal soil contamination: A critical review. Environ. Pollut. 2017, 231, 1188. [Google Scholar] [CrossRef] [PubMed]
  33. Luzio, M.D.; Sriniva, R.; Arnold, J.G. A GIS-Coupled Hydrological Model System for the Watershed Assessment of Agricultural Nonpoint and Point Sources of Pollution. Trans. GIS 2004, 8, 113. [Google Scholar] [CrossRef]
  34. Avkopashvili, G.; Avkopashvili, M.; Gongadze, A.; Tsulukidze, M.; Shengelia, E. Determination of Cu, Zn and Cd in soil, water, and food products in the vicinity of RMG gold and copper mine, Kazreti, Georgia. Ann. Agrar. Sci. 2017, 15, 269–272. [Google Scholar] [CrossRef]
  35. Kalandadze, B.; Matchavariani, L. Soil Pollution. In The Soils of Georgia; Springer: Cham, Switzerland, 2019; pp. 153–166. [Google Scholar]
  36. Omar, N.Y.M.J.; Abas, M.R.B.; Rahman, N.A.; Tahir, N.M.; Rushdi, A.I.; Simoneit, B.R.T. Levels and distributions of organic source tracers in air and roadside dust particles of Kuala Lumpur, Malaysia. Environ. Geol. 2007, 52, 1485. [Google Scholar] [CrossRef]
  37. Moustafa, M.; Mohamed, A.; Ahmed, A.R.; Nazmy, H. Mass size distributions of elemental aerosols in industrial area. J. Adv. Res. 2014, 6, 827. [Google Scholar] [CrossRef] [Green Version]
  38. Kubilay, N.; Nickovic, S.; Moulin, C.; Dulac, F. An illustration of the transport and deposition of mineral dust onto the eastern Mediterranean. Atmos. Environ. 2000, 34, 1293. [Google Scholar] [CrossRef]
  39. Mertens, J.; Lepaumier, H.; Rogiers, P.; Desagher, D.; Goossens, L.; Duterque, A.; Le Cadre, E.; Zarea, M.; Blondeau, J.; Webber, M. Fine and ultrafine particle number and size measurements from industrial combustion processes: Primary emissions field data. Atmos. Pollut. Res. 2020, 11, 803. [Google Scholar] [CrossRef]
  40. Chiroma, T.M.; Ebewele, R.O.; Hymore, F.K. Comparative assessment of heavy metal levels in soil, vegetables and urban grey wastewater used for irrigation in Yola and Kano. Int. Refereed J. Eng. Sci. 2014, 3, 1–9. [Google Scholar]
  41. Withanachchi, S.S.; Kunchulia, I.; Ghambashidze, G.; Al Sidawi, R.; Urushadze, T.; Ploeger, A. Farmers’ perception of water quality and risks in the Mashavera River Basin, Georgia: Analyzing the vulnerability of the social-ecological system through community perceptions. Sustainability 2018, 10, 3062. [Google Scholar] [CrossRef] [Green Version]
  42. Bakradze, E.; Shavliashvili, L.; Kuchava, G.; Bouachidze, N.; Shubladze, E. Heavy metal pollution of the river Kzretula by the Madneuli enterprise and restoration of its biodiversity. In Proceedings of the Geography: Development of Science and Education, Saint Petersburg, Russia, 21–23 April 2021; pp. 12–18. Available online: https://elibrary.ru/item.asp?id=46330348 (accessed on 21 March 2022).
  43. Buachidze, N.; Shavliashvili, L.; Bakradze, E.; Kuchava, G. Determination the water quality classification of the river Khrami and its tributaries. In Proceedings of the International Conference on Development of Applied Science and Humanities, Timisoara, Romania, 26–27 October 2021. [Google Scholar]
  44. Mchedluri, T.; Makharoblidze, N. Ecological Monitoring of the River Khrami Water and Anthropogenic Load. Russ. J. Biol. Res. 2018, 5, 20–26. [Google Scholar]
Figure 1. The map of the study area. Water sample points shown with blue dots (MA1 = Mashavera river before intersecting with Kazretula river; KA = Kazretula river; MA2 = Mashavera river at one km after intersecting with Kazretula river; MA3 = Mashavera river at 30 km after the intersect with Kazretula river; MA4 = at 35 km after intersect with Kazretula river).
Sustainability 14 05621 g001
Figure 2. Soil sampling points in the study area.
Sustainability 14 05621 g002
Figure 3. Explosion at the quarry and scattering dust particles through the wind into the environment, in 2011. Erupted dust particles are deposited onto the soil and contribute to its pollution. The scale of the dust eruption is about 1.2 km.
Sustainability 14 05621 g003
Figure 4. Landsat (above) and Google Earth (below) images, comparison of 2014 and 2017 mining area.
Sustainability 14 05621 g004
Figure 5. River Kazretula, one of the tributaries of the river Mashavera that is used for soil irrigation. Color change of the river indicates its pollution.
Sustainability 14 05621 g005
Figure 6. The slope map of the mining area in degrees.
Sustainability 14 05621 g006
Figure 7. Streams flow direction around the mining area (MA1 = Mashavera river before intersecting with Kazretula river; KA = Kazretula river; MA2 = Mashavera river at one km after intersecting with Kazretula river.
Sustainability 14 05621 g007
Figure 8. Cd, Cu, Mn, Fe, Pb, Zn, Ni, and Co content in the rivers (µg/L). Sampling points MA1 = Mashavera river before intersecting with Kazretula river; KA = Kazretula river; MA2 = Mashavera river at 300 m after intersect with Kazretula river; MA3 = Mashavera river at 5 km after the intersect with Kazretula river; MA4 = at 10 km after intersect with Kazretula river.
Sustainability 14 05621 g008
Figure 9. Distribution of lead in soils in the Bolnisi and Dmanisi municipalities. mg/kg. Numbers 1, 2, 3 and 4 are the sampling points in the village Balichi taken from the different locations (see the legend of the map on Figure 2), in the Table 3 they are indicated as Balichi 1, Balichi 2, Balichi 3, and Balichi 4 respectively.
Sustainability 14 05621 g009
Figure 10. Distribution of cadmium in soils in the Bolnisi and Dmanisi municipalities, mg/kg. Numbers 1, 2, 3 and 4 are the sampling points in the village Balichi taken from the different locations (see the legend of the map on Figure 2), in the Table 3 they are indicated as Balichi 1, Balichi 2, Balichi 3, and Balichi 4 respectively.
Sustainability 14 05621 g010
Table 1. Shale values and toxic-response factor.
Shale Values
mg/kg
Toxic-Response Factor for Metals
Pb205
Mn8501
Cd0.330
Zn951
Cu455
Table 2. ER and RI formula descriptions and pollution levels.
DescriptionPollution Level
Ecological risk factor (ER) E R = T r i × C f C f = Contamination factor
T r i = Toxic-response factor for metals
ER < 40 = low ecological risk;
40 < ER < 80 = moderate risk;
80 < ER < 160 = considerable risk;
160 < ER < 320 = high risk;
ER > 320 = extremely high risk
Potential ecological risk index (RI) R I = i = 1 n E R E R Ecological risk factor;
n Sum of the elements
RI < 150-minimal risk;
150 ≤ RI < 300-moderate risk;
300 ≤ RI < 600-considerable risk;
RI ≥ 600-extremely high risk
Table 3. In 2014–2017, elements concentration in soil and maximum, minimum, average, and standard deviation (mg/kg). 1 Permissible limits are taken from the Order of the Minister of Labor, Health and Social Affairs of Georgia, 2001. 2 Distance from the nearest mine to the sample points in kilometers. 3 Maximum allowable limits of heavy metals in soils according to the World Health Organization [40].
Sampling Points Cd Mn Cu Zn Pb
mg/kg mg/kg mg/kg mg/kg mg/kg Dist. to Mine, km 2
2017 2014 2017 2014 2017 2014 2017 2014 2017 2014
Nakhiduri 2 2.34 746.4 660 153.3 361 182.4 348 8.9 19.6 30
Mtskhneti 2.6 1.44 504.3 538 91.2 186 122.6 233 20.4 17.2 22
Foladauri 2.2 0.14 527.2 487 30 53 59.7 72 13.7 8.6 12
Kvemo Bolnisi 1.5 0.17 571.4 503 24.1 32 58.8 55 15.2 15.8 11
Ratevani 4.8 0.63 516.1 559 145.7 149 619.7 155 14 20 14
Mushevani 1.5 0.24 629.8 345 42.9 32 72.7 56 25.5 19.7 9
Akhaurta 3.2 0.34 334.9 576 25.5 41 43 113 28 21.7 7
Gomareti 2.9 0.11 481.4 423 27.3 21 40.5 34 25 11 22
Gantiadi 1.9 0.16 582.2 560 27.4 28 44.3 84 18.4 10.4 10.5
Vardisubani 1.7 0.17 617.5 575 32.5 27 58.1 96 34.5 18 3
Mamishlo 1.2 0.12 466.7 546 26.1 24 54.4 66 35.1 9.7 10.5
Patara Dmanisi 1.2 0.14 494.3 642 25.8 29 66.1 71 39.5 10.1 5.5
Abulbuqi 2.2 0.28 712.2 567 168.3 88 628.3 120 80.7 16.6 0.1
Tandzia 2.5 - 605.5 - 85.2 - 59.6 - 57.8 - 8.5
Darbazi 2.2 0.15 550.2 420 32.3 28 70.1 58 62.8 13.4 6.5
Photskhveriani 2.2 - 616.5 - 45 - 72.1 - 68.5 - 7
Kazreti 2.8 0.17 600.2 462 66.3 32 82.5 66 91.3 16.2 3.5
Balichi 1 2.9 0.18 572.1 525 145.5 87 93.4 78 86.9 28 2
Balichi 2 3.1 0.20 499.1 509 109.2 98 233 87 73.3 21 2.5
Balichi 3 1.3 0.22 609.3 515 65.4 101 120.5 94 98 18.7 3
Balichi 4 3.3 0.3 671.5 523 142.6 124 300.6 89 90.1 18 1
Average 2.5 0.6 567.3 558.3 75.6 105 154.4 134 47.7 16.6
Standard Deviation 1 0.73 93.4 59.9 53 106 171.6 91.8 30 3.8
Maximum 4.7 2.3 746.4 660 168.3 361 628.2 348 98 21.7
Minimum 1.2 0.1 334.9 462 24.1 27.5 40.5 54.8 8.9 10.1
Permissable Limits Georgian Guidelines 1 Cd
2
Mn
500
Cu
132
Zn
300
Pb
32
WHO 3 0.003 2 0.1 0.3 0.1
Table 4. Ecological Risk Factor (ER) and Potential Ecological Risk Index (RI) in 2014 and in 2017.
Sampling Points Ecological Risk Factor
Cd Cu Mn Zn Pb Potential Ecological Risk Index (RI)
2017 2014 2017 2014 2017 2014 2017 2014 2017 2014 2017 2014
Nakhiduri 202 234 17 40 0.9 0.8 1.9 3.7 2.2 4.9 224 289
Mtskhneti 264 144 10 21 0.6 0.7 1.3 2.5 5.1 4.3 281 183
Ratevani 476 63 16 17 0.6 0.7 6.5 1.6 3.5 5.0 503 94
Akaurta 321 34 3 5 0.4 0.7 0.5 1.2 7.0 5.4 331 54
Gantiadi 193 16 3 3 0.7 0.7 0.5 0.9 4.6 2.6 202 26
Dmanisi 120 14 3 3 0.6 0.8 0.7 0.7 9.9 2.5 134 25
Abulbuqi 224 28 19 10 0.8 0.7 6.6 1.3 20.2 4.1 271 50
Tandzia 253 - 10 - 0.7 - 0.6 - 14.5 - 278 -
Kazreti 275 17 7 4 0.7 0.5 0.9 0.7 22.8 4.1 307 33
Balichi 326 22 16 11 0.8 0.6 3.2 1.0 22.5 4.7 368 46
Kvemo Bolnisi - 17 4 0.6 0.6 4.0 32
Table 5. In 2017, heavy metals minimum, maximum, median, and standard deviation in Mashavera and Kazretula rivers (µg/L). 1 ‘-’ means not measured. 2 Permissible limits are according to Georgian official guideline values for water standards. 3 Maximum allowable limits of heavy metals in irrigation water according to the World Health Organization [40].
CuPbZnMnFeNiCdCo
µg/Lµg/Lµg/Lµg/Lµg/Lµg/Lµg/Lµg/L
Permissible limits 2 10003010001003001301130
WHO 3 0.0170.0650.200.200.501.400.010.05
MinOct92.11.057.341.2254.436.00.132.3
July58.0- 154.01.017.035.40.132.3
MaxOct1855.320.02581.9576.11723.669.04.585.5
July263.0-1648.02167.0120.069.02.585.5
MedianOct667.910.0768.984.3487.646.03.576.5
July96.0-65.01.045.046.00.277.0
St.D.Oct643.97.01045.2224.6585.412.31.922.4
July80.2-706.7967.238.612.71.022.5
Table 6. pH and heavy metals concentration in acid mine drainage of tailings pond. Samples were taken in 2017.
Acid Mine DrainagespHCu
mg/L
Zn
mg/L
Cd
mg/L
Drainage 12.62537.35010.023.65
Drainage 22.97165.34460.82.0
Table 7. Correlation coefficient between the heavy metals’ contamination in soils and the distances of the sampling points from the source of contamination, in 2017. (Correlation ranges +1 high correlation to −1 no correlation).
CuMnZnPbCd
Correlation0.020.050.120.73−0.06
Publisher’s Note: MDPI stays neutral with regard to jurisdictional claims in published maps and institutional affiliations.

