Article

Households Social Vulnerability to Food Insecurity and Coping Strategies in Raya Kobo and Raya Alamata Woredas, Ethiopia

1
Center for Food Security Studies, Addis Ababa University, Addis Ababa P.O. Box 150129, Ethiopia
2
Center for Rural Development Studies, Addis Ababa University, Addis Ababa P.O. Box 150129, Ethiopia
*
Author to whom correspondence should be addressed.
Sustainability 2023, 15(1), 160; https://doi.org/10.3390/su15010160
Submission received: 8 September 2022 / Revised: 12 November 2022 / Accepted: 14 November 2022 / Published: 22 December 2022

Abstract

:
The research was carried out in neighboring weredas in Ethiopia (Raya Alamata in the Tigray region and Raya Kobo in Amhara) and assessed reasons for differences in the food security status of households in the two areas. The objective was to examine the relationship between disparities in social vulnerability and food security among households in the two woredas. Despite their close proximity, similar work cultures, natural resource availability, and land size, there is a significant difference in food security status and social vulnerability between Raya Alamata and Raya Kobo communities, with Raya Alamata reporting 84% food insecurity and Raya Kobo reporting 24%. Using propensity score matching (PSM), the study compared the degree of social vulnerability and food security of households, and the key variables linked to differences in food security between the communities of the two weredas were differences in irrigation systems, usage of agricultural inputs, extension packages, and other support systems. In contrast to Raya Kobo, where 68% of sample HHs use a groundwater irrigation system for agriculture, Raya Alamata woreda employs just 8.2% of such systems. Similar to this, in Raya Kobo, 51%, 49%, 31%, 27%, and 18% of the sampled HHs have appropriate access to better seeds, extension services, chemical fertilizers, pesticides, soil and water conservation measures, and manure. Only 0.9% of the surveyed HHs in Raya Alamata, however, receive improved seeds; 1.8% receive extension services; 1.8% receive chemical fertilizers; 0.9% receive compost or manure; 1.8% receive water and soil conservation programs. In addition to households’ access to irrigation, extension services, and agricultural inputs being much greater in Raya Kobo compared to Raya Alamata, the notable differences in the food security status of households in Raya Alamata and in Raya Kobo are due to the varying levels of social vulnerability in terms of access to basic social services and infrastructures, such as education, rural road facilities, potable water, and health. Differences in social vulnerability and food security between the Raya Alamata and Raya Kobo districts could not be explained by differences in farmland size and fertility. The key factors determining the food security of households are the availability of irrigation systems, the provision of agricultural inputs, and the availability of extension services. To ensure food security and significantly reduce poverty in the area, the study advises the provision of irrigation infrastructure, extension services, and agricultural inputs with strong market linkages.

1. Introduction

Regardless of the huge potential surface water resources from the adjacent highlands of the Raya valley (75% predictable runoff) with a total exploitable water volume of 10 million cubic meters per year and 130 million cubic meters of usable groundwater usable for small-scale irrigation agriculture, food security in the Raya Valley, particularly in Raya Alamata, appears to be deteriorating on a regular basis [1,2]. In Raya Alamata wereda, roughly 24% of the overall population receives humanitarian food aid each year as part of the transitory food insecurity category, in addition to the 36% who are chronically poor. As a result, roughly 60% of the Raya Alamata population suffers from food insecurity. Similarly, 13% and 18.9% of the overall population of Raya Kobo wereda, respectively, have been defined as chronically and transitorily poor and are targeted for PSNP and humanitarian food aid [3].
According to the wereda-level data from both regions, there are considerable variations in the basic infrastructure coverage between Raya Alamata in Tigray and Raya Kobo wereda in Amhara. Raya Kobo weredas had a drinkable water supply coverage of 84.7% [4], while Raya Alamata had a potable water supply coverage of 60.45% [5]. Similarly, Kobo has 82.2% rural road supply coverage [6], compared to 18.1% in Alamata [7]. There is a huge difference in student dropout rates between Kobo and Alamata, with less than 1% in Kobo and 3.15% in Alamata. According to reports from both weredas, there is a significant disparity in the provision of agricultural inputs and extension services, which are administered in two separate administrative regions [8]. Anecdotal evidence suggests that institutional arrangements may have played a role in the disparities in living conditions observed among the Raya-Rayuma people, who are divided into two regions despite sharing a common historical background, more or less similar identity, culture, geographical setting, and psychological make-up. In the order of mention, government reports demonstrate significant distinctions between the two groups of people (Raya-Kobo and Raya-Alamata weredas) ruled by the Amhara and Tigray provinces. Yet, disparities in the institution of government in the provision of basic infrastructure services and agricultural inputs and services and their associated possible impacts on the level of food security of households in the area were not investigated. Thus, the study’s target was to examine whether inequalities in the provision of basic services caused by differences in institutional governance between the two weredas resulted in disparities in the food security status of households in the area.
As part of the broad concept of vulnerability, physical vulnerability normally refers to the impact of danger, and it relates to the amount of damage a system encounters as a result of a hazard event. When they use indicators, such as monetary cost, human death, and production cost as indications of outcome rather than indicators of the status of the system prior to the occurrence of a hazard, it seems to refer to physical vulnerability. Tantamount to this, social vulnerability is understood as an intrinsic state of systems emerging from their architecture [9]. Hence, poverty and inequality, marginalization, food entitlement, and access to various resources are among the many elements that determine social vulnerability as fundamental factors [10]. This indicates that people are at risk due to their marginalization, which keeps their lives in a “constant state of emergency” rather than because of external threats and the aggregation of characteristics, such as class, gender, age, ethnicity, and disability, which are the basic causes of this marginalization [11]. All of these aspects of human nature have a significant impact on people’s entitlement and empowerment or control over basic wants and rights [12]. As a result, gender relations in societies, the socioeconomic status of communities and households, population density, and health-related situations of individuals and communities vulnerable to disasters are some of the most important drivers of vulnerabilities [8]. Thus, a variety of exposures at both the community and individual levels, such as a lack of resources and social support, a lack of information connection and security, and various belief systems and practices, all contribute to social vulnerability. Furthermore, metrics that focus on fundamental infrastructure deficiencies increase the social vulnerability of communities and individuals to environmental risks. Social vulnerability, on the other hand, is determined by a number of elements, most of which are related to how vulnerable communities and individuals respond to dangerous hazards, as well as their preparedness and resilience [13]. As a result, social vulnerability combined with a wide range of susceptibilities appears to lead to food insecurity. Food insecurity is defined as “the inability to eat an acceptable meal today (i.e., hunger) and the risk of being unable to do so in the future” by the Social Protection for Food Security [14]. In the context of rural Ethiopia, another definition of food security is: “A household is food secure when its livelihood activities enable it to meet its food and other basic needs, either through its own production, such as crop cultivation and/or livestock rearing (in the case of peasants and pastoralists) or through opportunities to run non-farm ventures or collaborate with others” [15]. Food insecurity, on the other hand, refers to a situation in which a household is unable to adequately feed its members using either its own production or market purchases. Food insecurity or security is mostly a result of a family’s own perceptions or anxieties about facing a food shortfall. In general, households that are anxious about food shortages can be divided into two categories, as defined by the FAO definition for a time above: (i) those who are always facing food shortage crises and subsequent hunger, i.e., the chronically food insecure; and (ii) those who are only facing food shortage problems when they are hard hit by disasters or shocks, i.e., the acutely or temporarily food insecure. In 2018, 821.6 million people worldwide were undernourished, with 704.4 million experiencing extreme food insecurity [16]. There are around 250 million undernourished individuals in Africa, and this figure is continuously increasing. Between 2014 and 2019, the number of people who were very food insecure, as well as the frequency of moderate and severe food insecurity, grew dramatically across Africa. Due to periodic conflicts, climate change’s negative effects, and inequality, food insecurity, hunger, and malnutrition are on the rise around the world [17]. Agriculture is Ethiopia’s most significant sector for food security and poverty reduction, especially among rural households involved in farm and nonfarm activities [18]. As a result, Ethiopia is one of the world’s poorest countries, ranked 174th in the 2020 Human Development Index (HDI), with the country’s mainstay, agriculture, earning about 90% of the total foreign currency but employing just 72% of the workforce [19]. Ethiopia’s HDI value for 2019 is 0.485, placing the country at 173 out of 189 nations and placing it in the poor human development category. Furthermore, Ethiopia’s HDI rating increased by 66.1%, from 0.292 to 0.485, between 2000 and 2019 [19]. For a population of nearly 100 million people, Ethiopian agriculture produces only 32.6 million tomes of food from 14.5 million hectares of land over both harvest seasons (Bega and Meher) [20]. Over 22 million Ethiopians are projected to be food insecure, with roughly half of them using the PNSP [21]. Unless appropriate corrective measures are adopted to improve the existing socioeconomic situation, the remaining 86% of rural smallholder farmers will continue to endure permanent food shortages, posing a serious threat to Ethiopia’s fundamental survival [22]. Ethiopia had around 21.6 million undernourished people on average over three years (2016 to 2018), making it one of the most food-insecure and famine-affected countries [23]. According to ACAPS [24], the number of people experiencing food insecurity has risen dramatically from 5.6 million in December 2016 to 8.5 million in August 2017. A significant proportion of Ethiopians are afflicted by drought-induced transitory and ever-worsening chronic food insecurity, with 31 million people undernourished and 41% living below the poverty line [23]. Similarly, according to the Raya Alamata Agriculture Office’s annual report for 2018/9, 31,980 people, or roughly 35.5% of the overall population of the wereda (90,014), are chronically poor and registered in PSNP. Along with the chronically poor, there are 21,465 people who qualify for humanitarian food aid each year, accounting for 23.8% of the overall population. As a result, approximately 60% of Raya Alamata’s population and 45.4% of the Kobo wereda’s population are food insecure. The Raya Kobo Wereda Office of Agriculture’s annual report for the same year [25] revealed that there were about 42,354 individuals (13%) of the total population of the wereda (326,432) that were chronically poor, while 61,726 individuals (18.9%) of the total population of the wereda were in the transitory food insecure category and received emergency assistance [26]. In terms of coping strategies, communities and individuals responded to approaching risks such as drought-induced famine in a systematic, orderly, and frequently culturally ingrained manner. This is because the most important and applicable cognitive, emotional, and evaluative models are important and relevant to situations in the culture of the affected people’s responses to what these occurrences mean to them within their interpretive frameworks [27,28]. As a result, people and communities make the best of whatever resources they have and undertake everything they can to ensure their survival in the face of hunger fears. The strategy adopted by individuals and communities to ensure their survival in the face of drought-induced hunger is referred to as a “coping mechanism.”

2. Methodology

2.1. Study Area Setting

Raya Valley, located in Ethiopia’s northeastern region, is one of the most productive farming areas in terms of food production and cattle rearing from an agroecological standpoint. Raya Kobo is located between 12°18′15″ and 12°38′15″, and Raya Alamata is located between 12°19′60.00″ N and 39°29′59.99″ E, as per astronomical coordinates. Additionally, the temperatures range from 16° to 26° Celsius on average at the study site, which is roughly 1500 m above sea level. Fluvisols, vertisols, and cambisols are the soil types found in this agroecological zone. The majority of the soils are loam and silty loam with a clay loam texture [29]. An explanatory research design was applied to best explain the effect of social vulnerability on household food security and their coping responses in this study. As a result, the study sites were selected purposely due to their differences in governance systems and associated varied levels of food insecurity, while the socio-cultural, resource bases, and geographic settings of the sites are similar. Accordingly, the questionnaire survey sample participants’ sample size was determined using [2,30]. Data were collected from a total of 400 questionnaire survey sample households which were selected using stratified (administrative, agroecology, and sex) simple random methods from Raya Kobo and Raya Alamata sites. The questionnaire survey was initially pre-tested and adjusted based on the feedback before the actual data collection. This was followed by the translation of the survey to the local language, i.e., Amharic. In addition, data were gathered from a total of 20 agricultural experts and Kebele-level administrators and from 12 heterogynous (agroecology, sex, land ownership) focus group discussion sessions, overt observations, and the literature review. Therefore, descriptive statistics (such as the mean, percentage, standard deviation, and coefficient of variation) and the propensity matching score (PMS) were used to assess quantitative data gathered through a questionnaire survey, whereas qualitative data were collected using interviews, focus group discussions, and overt observation and were analyzed using thematic content analysis. Appropriate procedures such as theme identification, paraphrasing, and summarizing were performed.

2.2. Sample Size Determination

In the study area, Raya-Alamata and Raya-Kobo, six administrative kebeles from the three agroecology zones, were purposively identified. The unit of analysis for the study was households in the rural areas of Raya Alamata and Raya Kobo. The sample size determination formula was developed by Cochran [30], was used to estimate the sample size of the finite population, and is presented as follows. If the population is infinite, the formula is:
n 0 = z 2 pq e 2
where, n 0 is the sample size, z is the selected value of desired confidence level, p is the estimated proportion of an attribute that is present in the population, and q = 1 − p and e is the desired level of precision. If the population is finite, the sample size is estimated as follows:
n = n 0 1 + n 0 1 N
where N is the population size; therefore, a total of 64,986 households were considered. Since the households were located in both regions, the proportional allocation method was used to obtain representative households for the strata. The proportion is allocated as follows: n i   =   n N i N , where n = sample size, Ni = population size of the ith strata and N population size, and i = 1, 2, 3. [30,31]) but with more samples allocated to the users in the Amhara regional state to reduce the dropouts. Finally, 400 total sample HHs from Raya Alamata and Raya Kobo Weredas were considered from the agroecologically selected six Kebeles and household heads, see Table 1.

2.3. Sampling Procudure

This study used multi-stage stratified sampling techniques. The first stage involved the purposeful selection of two weredas, from Raya-Alamata in Tigray National Regional State and Raya-Kobo in Amhara National Regional State, based on the differences in their levels of social vulnerability in terms of household access to basic services and the provision of agricultural inputs that became detrimental to the food insecurity status of households in the two weredas. In the second, a stratified sample strategy was used to select three kebeles from each study wereda to represent the three agroecological zones (Kola, Woina-Dega, and Dega). In the third step, sample households were selected using a systematic sampling procedure that was proportional to the number of households in the kebele.

2.4. Procedure of Matching Strategy

PSM constructs a statistical comparison group that is based on a model of the probability of participating in the treatment T conditional on observed characteristics X, or the propensity score:
Y 1 , Y 0 T | X

Assumption of Conditional Independence and Common Support

Given a collection of observable covariates X that are unaffected by treatment, conditional independence states that prospective outcomes Y are unaffected by treatment assignment T. If Y1 T represents the participation outcomes and Y0 represents the non-participant outcomes, conditional independence is implied.
Y 1 , Y 0 T | X
A second assumption is a common support or overlap condition: 0 < P (Ti = 1|Xi) < 1…..3.
This condition ensures that treatment observations have comparison observations “nearby” in the propensity score distribution Heckman, LaLonde, and Smith (1999) cited in [30,32].
The average treatment effect (ATE) or the treatment effect on the treated (TOT) used to indicate the therapeutic effect of the program using these approaches, and the treatment effect estimation is as follows: The average treatment effect (ATE):
E Δ i = E Y 1 i Y 0 i = E Y 1 i E Y 0 i
where Δ i = Y 1 i Y 0 i .
This is the expected effect of the project for a randomly selected individual. The average treatment effect on the treated (ATT):
E Δ i = 1 = E Y 1 i Y 0 i : T i = 1 = E Y 1 i : T i = 1 E Y 0 i : T i = 1
where Y1i and Y0i are the probable outcomes in the two counterfactual contexts of treatment and control, respectively, and the outer expectation is across the distribution of (p (Xi):Ti = 1). In the literature on effect evaluation, the PSM technique has been employed as a non-parametric method. The use of matching methods aids in the creation of a counter factual from the control group. When utilizing a counter factual, the primary assumption is that untreated samples approximate treated samples if they had not been treated, i.e., (Y0i:I = 1) [33].
The assumption of conditional independence (CIA) is necessary for the matching to be valid. According to this assumption, treatment is random and conditional on observable variables (x) as described in Equation (4). Given the control variables, this assumption indicates that the counter factual outcome for the treated group is the same as the observed outcome for the non-treated group (x). This means that the counterfactual food security scenario is the same as the one that would have prevailed if the household had not treated stated as:
E Y 0 \ X , I = 1 = E Y 0 \ x , I = 0 = E Y 0 \ x
The first term of Equation (7) represents the treated group’s counterfactual food security situation, which is equal to the untreated (control) group’s observed food security. This assumption governs program selection and gains from institutional differences based on run observables. According to the CIA, the list of X’s must include all variables that jointly influence the result with no treatment, as well as the program selection. As a result of conditional independence, the ATT can be calculated as follows:
ATT = E Y 1 Y 0 \ X , I = 1 = E Y 1 \ x , I = 1 = E Y 0 \ x , I = 1
The logit model used to examine the contribution of institutional differences for food secured and food insecure to estimate the household’s chance of participation in the program [Y = 1 decision to participate, Y = 0 otherwise]. The dependent variable Y would be related to the predictor variables (food security, social vulnerability). As treatment determinants, this study used language, the ruling party’s interest and political supremacy in each region, political decision, claiming parties’ negotiation strength, and local people’s consent.

3. Result and Discussion

3.1. Socio-Economic and Demographic Characteristics of Respondents

As shown in Table A1 Appendix A, the demographic parameters of the sample houses in Raya Alamata and Raya Kobo weredas differed significantly. A total of 54.8% of the Raya Alamata sample HHs are single, compared to 6.2% in Raya Kobo, and 84.8% of the Raya Kobo sample HHs are married, compared to 33.3% in Raya Alamata. There is a significant difference in school enrollment between the two weredas, with 26.8% of HHs entering Raya Kobo graduating from high school compared to 6.5% in Raya Alamata. The fact that 54.8% of households in Raya Alamata are single-headed (i.e., not jointly managed, i.e., either female-headed or male-headed families) compared to 84.5% in Raya Kobo demonstrates that Raya Alamata communities are more socially vulnerable to poverty and food insecurity. Raya Alamata’s high percentage of single-headed households might signify the community’s poverty and structural vulnerability to food insecurity. Raya Alamata (15–64 years old) had a 27% active productive force, compared to 35% in Raya Kobo, which had an impact on food security variations between the communities. Although the differences in family size between Raya Alamata, 6.33, and Raya Kobo, 5.2, were not as substantial, they may have an impact on the food security of the two weredas’ populations. In Raya Alamata, 17% of rural sample HHs who should have been engaged in agriculture were engaged in off-farm activities, which indicates that a significant proportion of rural HHs in Raya Alamata lack appropriate access to land as a source of income. The Tigray National Regional State Land Regulation that deters individual HHs from renting other HHs’ land for farming could have a negative influence on such HHs’ involvement in agriculture, affecting their social vulnerability and food insecurity status compared to their Raya Kobo counterparts. Raya Kobo had a far higher level of income diversification than Raya Alamata, which may have improved food security and reduced community vulnerability in Kobo compared to Raya Alamata. The less diverse a household’s degree of livelihood is, the more susceptible and food insecure it is [34,35]. As stated in Table 2, 47% of the sample households in Raya Kobo wereda’s lowland districts possessed fertile land, compared to only 5% in the highlands; 40% of the sample households in the low land also possessed medium fertility land, compared to 81% of sample households in the highlands. Only 8% of sample HHs in Raya Alamata’s highlands had fertile land, whereas 17% of the sample households in the lowlands had fertile land. In the highlands of Raya Alamata, 54% of sample HHs had medium-productive land, compared to 75% in the lowlands of the same wereda.
Table 3 displays the mean result difference between the two groups for several socioeconomic characteristics (Kobo and Alamata Woreda). The difference between the two woredas in those respective metrics is statistically significant except in the case of sharing crops and the total production per hectare.

3.2. Land Tenure

The four types of land tenure that HHs in both Raya Alamata and Raya Kobo households had access to in terms of agriculture are their own land, land rented from other HHs, land rented from institutions, and sharecropping. As stated in Table 3, Raya Kobo HHs have more overall land access than Raya Alamata HHs, with 94.6% of the total land access in one or all of the four options compared to 81.2% in Raya Alamata. As a result, nearly 18% of rural HHs in Raya Alamata had no access to land, compared to 3.45% in Raya Alamata. Furthermore, 18% of the Raya Alamata sample HHs without their own land had no access to agricultural land and were engaged in non-agricultural activities. In Raya Kobo, however, 57.5% of the total HHs without land had access to agricultural land through sharecropping (26.1% in the lowlands and 2.3% in the highlands), renting from other households (22.2% in the lowlands and 22.7% in the highlands), and renting from institutions, such as schools, health centers, and churches (19.4% in the lowlands and 27.3% in the highland areas). On the other hand, the landless were engaged in any business other than agriculture. Of the Raya Alamata sample households, 12.7% had their own private land (12.2% in the lowlands and 14.3% in the highlands), 30% (32.9%) in the lowlands and 21.4% in the highlands), and 9.09% of them were renting from other institutions (9.8% in the low lands and 7.2% in the highlands) with access to farming land. According to regional land regulations, farmers in Raya Alamata are not allowed to lease or rent out their private land to other HHs for more than two years, and if they did, the leasing agreement had to be approved by the kebele/local level administrative apparatus. The lease agreement process is long, bureaucratic, and corrupt, and it does not invite HHs on both sides of the arrangement. Contrary to popular belief, farmers are being pressured to lease their private land to government-affiliated large investors for up to 20 years under the guise of being unable to afford agricultural products that enhance crop productivity. In terms of land ownership, 81.18% of the Raya Alamata sample households (82.9% in the lowlands and 78.6% in the highland kebeles of the wereda) had owned compared to 42.5% of the sample households in Raya Kobo (50.4% in the lowlands and 34.9% in the highland kebeles of the wereda). In Raya Alamata, 90.9% (90.3% in the lowlands and 92.9% in the highlands), 70% (67.1% in the lowlands and 78.6% in the highlands), and 87.3% (87.8% in the lowlands and 85.7% in the highlands) of the sample households did not farm additional lands in any of the three land access options (by renting from institutions, other households, or sharecropping, respectively). In terms of gender, female household heads in Raya Kobo engaged in farming in addition to their own farmland by renting from institutions (24%), renting from other households (33%), and sharecropping (21%), whereas female household heads in Raya Alamata wereda engaged in farming in addition to their own farmland by renting or sharecropping (13.6% renting from institutions, 27% renting from other households). As a result, communities living in the Raya Alamata and Raya Kobo highlands, located in similar western terrains, have similar constrained socioeconomic situations in terms of soil fertility and irrigation infrastructure and are extremely socially sensitive to food insecurity. The average land size in Raya Alamata (1.64 hectares per home) appears to be slightly greater than the average land holding size of the Raya Kobo sample households (1.13 hectares per household). In the research area, land fertility is extremely substantial for agricultural output and productivity. According to sample household data in Raya Alamata, 15%, 69%, and 16% of the land are fertile, medium, and infertile, respectively, while 25%, 62%, and 13% of the sample households’ land in Raya Kobo are fertile, medium, and infertile. Thus, the communities in Raya Alamata are privileged in terms of land ownership (both in size and access to their own land), not only in comparison to Raya Kobo wereda but also in relation to the entire country. Despite the land ownership and size of the land, the ever-deteriorating food security status of communities in Raya Alamata compared to Raya Kobo seems to emerge from a lack of household access to agricultural inputs, irrigation systems, and agricultural extension package services provided by governments. There is no notable difference in land fertility between the two study areas, but the difference in terms of production and productivity seems to be huge. That, again, appears to be a result of the utilization of agricultural inputs and irrigation systems. In terms of agroecology, the highland sections of Raya Kobo are more socially exposed to food insecurity than the lowland plains, primarily because (1) irrigation agriculture is not as spatially convenient as it is in the lowland plains. (2) There is an absence of fertility in the highlands’ farmland. Due mainly to the low fertility rate of farmlands in the highlands, even if the food insecurity and production gaps in Alamata were not as large as in Kobo wereda, there is a discrepancy in production/productivity and food security status due to the low fertility rate of farmlands in the highlands. The utilization of irrigation systems, fertilizers, and other agricultural inputs, as well as extension service packages, are identical in the highland and lowland sections of Raya Alamata. As previously indicated, the production and productivity of female-headed households in both Raya Alamata and Raya Kobo are lower than that of male-headed households. This appears to be related to the lack of a proper workforce in female-headed households to timely engage in agricultural operations as per extension instructions and properly apply production-increasing inputs. As a result, female-headed households appear to be more socially vulnerable to food poverty than male-headed households. Male-headed HHs have an additional advantage in terms of workforce because they are managed jointly by both male and female members, whereas female-headed households are handled only by women. According to the Ministry of Agriculture [20], out of the 16.3 million households (HHs) in the country, around 6.45 million have land between 0.24 and 0.6 hectares, 4.01 million HHs have 0.61 to 1.17 hectares, and only 2.21 million HHs have land between 1.18 and 2.27 hectares. Due to the magnitude of agricultural holdings across the country, Ethiopia only has 10 million and 4 million chronically and transitorily food insecure individuals, respectively. As a result, 14.54 million HHs across the country have smaller plots of land than the communities in Raya. Thus, despite their land holdings, only 2.8 million HHs, or nearly 17% of the total population in rural Ethiopia, are food insecure, compared to 83.8% in Raya Alamata and 23.4% in Raya Kobo weredas, or 75% and 35%, respectively. According to the 2020 HRD, people who receive food aid annually are chronically and transitorily food insecure. The observed level of social vulnerability to food insecurity seems to be because of the economic marginalization and political deprivation of the community in all Raya areas in general and Raya Alamata in particular [26].

3.3. Differences in Social Vulnerability and Use of Agricultural Inputs as Food Security Determinants

As stated in Table A2, 68% of the sample HHs in Raya Kobo use a groundwater irrigation system for agriculture, compared to only 8.2% of the sample HHs in Raya Alamata woreda. The results in Table 3 show that Raya Kobo, the treated, had a 0.44 mean value compared to 0.018 for Raya Alamata wereda, with a mean difference between the two equal to 0.42. This indicates that the difference is statistically significant. The sample households in Raya Alamata revealed that they are completely deprived of agricultural inputs that could improve their productivity and yield, such as improved seeds, extension support, chemical fertilizer, pesticide provision, soil, water conservation activities, and manure application. Similarly, 51%, 49%, 31%, 27%, and 18% of the sample HHs in Raya Kobo have proper access to improved seeds, extension support, chemical fertilizers, pesticides, soil, and water conservation activities, and manure, respectively, which helped them increase their production and productivity. On the other hand, only 0.9% of the sampled HHs in Raya Alamata receive improved seeds, 1.8% receive extension services, 1.8% receive chemical fertilizers, 0.9% receive compost/manure, and 1.8% receive soil and water conservation activities that could help them improve their agricultural production and productivity. As a result, differences in input provision and agricultural extension support services appear to have a detrimental influence on the level of vulnerability of people in Raya Alamata, aggravating food insecurity in the area. When compared to national norms, Raya Alamata inhabitants are significantly marginalized and deprived of important agricultural inputs that could help increase production and productivity, such as improved seeds, insecticides, and fertilizers. According to the MoA [20], fertilizer, insecticides, better seeds, and access to extension packages are used by 88.9%, 31.2%, 21.4%, and 45.3% of the country’s 16.3 million HHs, respectively. According to the Raya Alamata wereda report [36,37], agricultural inputs (fertilizer, improved seeds, and other productivity-improving inputs) are rarely used. It further stated that in the lowlands of the wereda, roughly 45% of farmers use enhanced seeds, particularly teff, whereas, in the highlands, about 30% of farmers use modified wheat and pulse seeds. Fertilizer is used by 15% of farmers in the highlands, whereas pesticides are used by 10%. Pesticides are used by 15% of farmers in the lowlands. In all agro-ecologies, roughly 70–80% of farmers use farm manure. This published wereda agriculture report strongly disagrees with the focus group discussions and key informant interviews (KII) performed with farmers, wereda, and kebele/local level agriculture experts and development agents (DA) that agricultural inputs are exclusively applied to the 20.4 hectares of drip irrigation practicing HHs. Even the households that use traditional irrigation, which covers 415 hectares in the wereda, do not use agricultural inputs that improve production. However, the sample table reveals that agricultural inputs and extension packages, fertilizers, pesticides, better seeds, and extension packages are used by 1.82%, 0%, 0.91%, and 1.82%, respectively. The financial affordability of groundwater irrigation systems appears to be highly varied between the Raya Alamata and Raya Kobo weredas. In connection to this, as shown in Table 3, 92% of the sampled HHs in Raya Alamata do not have access to irrigation systems, and 31% of them cannot afford irrigation systems even if they are available, compared to 24% and 4.6% in Raya Kobo, respectively. In Raya Alamata, only male households have seen an increase in their output, whereas, in Raya Kobo, 56.25% of male households and 43.33% of female households have seen an increase in production. This could mean that Raya Alamata communities, as opposed to Raya Kobo and other HHs around the country, are denied access to natural resources and are made socially vulnerable to poverty and food insecurity.

3.4. Differecnes in Social Vulnerability on Production and Productivity

The mean annual yield per hectare in Raya Kobo ranges from 22 quintals (33.2 in the lowlands and 9.6 in the highlands) to 19.5 quintals (22.9 in the lowlands and 10.1 in the highlands) in Raya Alamatawereda. There appear to be considerable disparities in agricultural productivity between the two administrative areas and their respective highland and lowland areas in terms of gender. In Raya Kobo, the average annual agricultural produce production of male-headed families is 26.9 quintals per hectare, compared to 21.3 quintals per hectare for female-headed households. In Raya Alamata, male-headed HHs produce an average annual agricultural yield of 21.2 quintals per hectare, whereas female-headed HHs produce 11.5 quintals per hectare. There is a substantial difference in the output and productivity trends between Raya Alamata and Raya Kobo weredas. As stated in Table A2, 54.7% of the sampled HHs in Raya Kobo believed that crop productivity per hectare was increasing, compared to 97.1% (96.1% in the lowlands and 100% in the highlands, respectively) of the sampled HHs in Raya Alamata who believed that crop productivity had decreased in recent years. Topographically, the output in Raya Kobo’s lowlands has increased by 86.3%, compared to 28.5% in the same wereda’s highlands. However, production in Raya Alamata’s lowland plains has increased by only 3.9%, with the highlands experiencing a complete loss. According to the Ethiopian poverty and hunger strategic review [20], in Ethiopia, agricultural production and productivity increased by 6.7% from 2000/1 to 2017/8, from 8.8 million tons to 30.6 million tons and, in ten years, Tigray’s crop production has increased by 6.1%. The proper use of agricultural inputs and land expansions are credited with the improvement in production and productivity. However, the rise in the output and productivity in Raya AlamataWereda, which is administratively located in the Tigray area, is lower than the regional and national average. This refers to the extent to which Raya Alamata has been purposefully made socially vulnerable to food insecurity in particular and poverty in general by restricting access to resources such as agricultural inputs and irrigation agriculture. These findings may indicate that households in the highlands of Raya Alamata and Raya Kobo are more socially sensitive to food insecurity than those in the lowlands. These data also imply that homes in the Raya Kobo highlands are doing better than sample households in the Raya Alamata highlands in terms of growing productivity. Raya Kobo households make extensive use of a groundwater irrigation system established with the cooperation of the regional government, which appears to be one of the reasons why Raya Kobo’s production and productivity appear to be significantly higher than Raya Alamata’s. The Raya Alamata and Raya Kobo highlands are both parts of the central highland plateau and have more or less similar characteristics in terms of slop, soil type, rainfall size, and contagiousness, as well as being close to one another, but with varying levels of social vulnerability and food instability. Differences in social vulnerability to food insecurity in the two weredas could be attributed to the vast differences in production and productivity of their individual areas, owing to differences in government assistance for agricultural extension services, soil and water conservation initiatives, and other agricultural input requirements. Similarly, despite being located in the same flood plains and having similar soil types and levels of fertility, the low land kebeles of Raya Alamata and Raya Kobo differ in their level of social vulnerability to food insecurity due to differences in their levels of access to resources and assets, as explained above.

3.5. Food Security Status of Households in the Study Area

Poverty, drought-induced famine, and their negative consequences are not totally genetic in nature but are rather politically and socially generated human phenomena. In terms of Ethiopian poverty and hunger [20,38], in its strategic assessment report, it was revealed that drought-induced famine is a man-made problem that can be solved through human effort. The facts and causes of social vulnerability and food insecurity in the study area, particularly in Raya Alamata, are often depicted by the above facts: human policy and human failure are a source of deprivation and a socio-economic vulnerability factor. Without taking into account the geographic settings of both locations, of the total sample households in Raya Alamata, 16.4% are food secure, compared to 76.6% in Raya Kobo. Table 4 below indicates that just 23.4% of Raya Kobo’s total sample HHs are food insecure, whereas 83.6% of Raya Alamata’s entire sample HHs are food insecure. Only 17.3% of the total samples of HHs in Raya Alamata are classified as mildly food insecure, whereas 53.6% are classified as moderately food insecure, and 12.8% are classified as severely food insecure. On the other hand, in Raya Kobo, HHs who are mildly, moderately, or severely food insecure account for 6.3%, 16.5%, and 0.8% of the total sample HHs, respectively. According to the CSA’s household income and expenditure survey report [39,40,41], from 2015/6, 21.6 million people, or roughly 21% of the country’s total population, were food insecure. As a result of the sample homes’ survey, the percentage of sample households in Raya Kobo wereda that were food insecure (23.4%) was higher than the national average. Furthermore, food insecurity among Raya Alamata sample homes (83.6%) is significantly lower than the national average and Raya Kobo wereda. Despite sharing the same geographical setting, agroecology, soil type, fertility, and a more or less similar work culture, Raya Alamata’s food insecurity is substantially worse than Raya Kobo’s. The main reasons appear to be differences in institutional assistance, such as agricultural supplies, agricultural extension services, and irrigation system availability. According to Diriba [21], the Ethiopian government has made significant efforts to address food insecurity through “programmatic and specific project interventions” and was able to reduce the number of food insecure people by 6.9 million from the total food insecurity caseload between the years 2010 and 2015. The Raya valley was also identified, delineated, and proposed as one of the potential areas for irrigation agriculture development, with a production potential of 1,122,242 quintals of crops rainfed only in Raya Alamatawereda, which could be increased to 6.2 million through irrigation agriculture, with the goal of ensuring sufficient and sustainable food supplies at local, regional, and national levels, together with export earnings for the country. Despite national efforts and the availability of local resources, the food security circumstances of rural HHs in Raya Alamata appear to be deteriorating over time. Food insecurity affects 75% of the people in Alamata [7,29]. Despite the enormous potential for agricultural growth, the results from the survey sample HHs demonstrate that the condition of food insecurity has worsened over time from 2007 to 2019. According to the Raya Alamata wereda agriculture report [7], the governing bodies of both the wereda and the region should be held responsible for the people’s poverty and food insecurity while living in an abundant surface and subterranean water supply. This implies that the ruling elites are well aware that the area’s social vulnerability and related food insecurity issues are a result of political marginalization and a lack of political attention for reasons they are aware of. Graph 2 shows that 76.6% of the total sample households in Raya Kobo are unconcerned about having enough food at home, compared to 16.4% of the same households in Raya Alamata. In terms of food quality, quantity, and choices, 17.3% of households in Raya Alamata and 6.3% in Raya Kobo not only do not eat the food of their preference but also eat a very small amount of food that they really do not want to eat due to a lack of resources to obtain the type and amount of food of their choice at the time they were interviewed. The remaining 66.3% of the sample households in Raya Alamata (severely and moderately food insecure HHs) and 17.2% of the sample households in Raya Kobo (severely and moderately food insecure HHs) were forced to eat not only fewer foods but also to skip nights or the entire day without eating, making them highly vulnerable to the negative effects and physical consequences of insufficient food intake. This will almost certainly have a long-term negative impact on the productivity and effectiveness of the affected communities. According to a study conducted by Raya Valley [29], the per capita income of farmers in the Raya Alamatawereda is estimated to be around Birr 217 per year (i.e., subsistence), necessitating immediate attention to alleviate these constraints and ensure that people’s living standards are secure and sustained through project intervention. These problems continue to persist, and residents of Raya Alamata face truncated socioeconomic conditions in general and severe food insecurity in particular. Similarly, in Raya Kobo wereda, until project intervention, low access to inputs, rural loans, and other support services, as well as a lack of technology adoption and alternative income and work opportunities, all contributed to Raya Kobo wereda’s low agricultural growth. In Raya Kobo wereda, drought not only reduced annual crop and livestock production but also posed a threat to human life until recently and worsened livelihood vulnerability. Crop yields were extremely low before the start of the project due to a significant decline in soil fertility, crop pests, diseases, erratic rainfall, the low adoption of extension support services and inputs, poor farming practices, and declining land holding sizes. Thus, the study estimates that households that were not part of the Kobo Grana irrigation project, of course without considering the agricultural inputs and extension package services as factors, produced quintals of crops worth 1441 birr per year in the 2007/08 production year (if divided by five, as an average number of families in the area would be equal to 288.2 quintals). As a result, in roughly 2007/08, the total yearly income of Raya Alamata and Raya Kobo was nearly identical. However, project beneficiary households in Raya Kobo are currently producing crops with a birr worth up to 37,719 birr per year. The number of irrigation beneficiaries recognized in Raya Kobo wereda for the 2019 budget year was 30,239 (existing users, total 27,759 males, 24,984 females, 2775) and 2480 new beneficiaries (males, 2232 females, 248). The above 30,239 irrigation beneficiaries have formed roughly 648 irrigation cooperatives. In the 2019 budget year, 15,000 farmers received irrigation-related training (13,500 males and 1500 females), in addition to the 55 kebele level experts, or DAs, who had already received training [42].
Table 5 and Figure A1 and Figure A2 show the degree to which the sample households in Raya Alamata and Raya Kobo are vulnerable to food insecurity. The HFIAS score for Raya Kobo is between 15 and 17, with just a small percentage of sample households falling into this category, whereas the HFIAS score for Raya Alamata is between 12 and 27, with the majority of sample households falling into the moderately and severely food insecure categories. Despite the vast agricultural potential and the communities’ willingness to participate in irrigation projects that can significantly improve the lives of local communities in their respective regions and the country as a whole, a large number of households in both areas of the Raya valley are experiencing chronic and transitory food insecurity. It further states that approximately 84% of households in Raya Alamata and 24% in Raya Kobo are both chronically and temporarily food insecure.

3.6. Social Vulnerability Dimensions and Food Insecurity in the Study Area

Because people’s levels of livelihood diversification and food security are influenced by their level of engagement in private and public activities, Raya Alamata’s lower engagement appears to contribute to its truncated food security status when compared to Raya Kobo survey respondent households. In terms of community empowerment, only 21% of Raya Alamata survey respondents believed they had the capacity and power to participate in public and private affairs, as well as the ability to change any local development plan or initiative if it was found to be not in their best interests, compared to 63% of Raya Kobo survey respondents. Raya Alamata and Raya Kobo households revealed statistically significant variations in community empowerment and community capacity to influence local development plans that affect their lives (χ2 = 48.04, p = 0.0000). In regard to the household respondents’ access to basic infrastructures in the two research weredas, just 34% of respondents in Raya Alamata had access, compared to 81% in Raya Kobo. One of these accesses was related to the household respondents’ access to transportation to market locations, with only 36% in Raya Alamata responding positively compared to 74% in Raya Kobo. Raya Alamata and Raya Kobo have statistically significant differences in overall basic infrastructure access and transportation access to marketplaces (both χ2 = 73.40, p = 0.0000 and χ2 = 46.64, p = 0.0000), respectively. This indicates that disparities in total infrastructure availability and market accessibility have a significant impact on people’s production and productivity, resulting in food security status differences. In Raya Alamata, 93% of households had no access to cooperative credit providers, compared to 79% of Raya Kobo households. Unlike the other access factors stated in the table above, there is no significant variation in the percent in this case, but the variance in the households’ access to credit cooperatives was statistically significant (χ2 = 10.45, p = 0.0012). In terms of access to loans from the relatives of survey households, there was no significant variation in the percentage between the two weredas, with 98% of respondents in Raya Alamata responding negatively compared to 92% in Raya Kobo, but the variation was statistically significant (χ2 = 5.16 p = 0.0231). The lack of access to loans from relatives by survey households in both weredas suggests that there is mistrust, a lack of mutual collaboration, and interdependent relationships among community members, all of which point to structural vulnerability in the study locations. Disparities in household access to both cooperatives and relatives of the two weredas appear to lead to differences in food security status in their respective communities. Thus, access to credit from cooperatives, relatives, or both could assist rural community members in purchasing agricultural inputs, farm tools, and other materials that could improve production and productivity, ensuring food security. In regard to the off-farm loan, only 32% of households in Raya Alamata had access to off-farm loans, compared to 61% in Raya Kobo, a statistically significant difference (χ2 = 24.23 p = 0.0000). Off-farm loans are an important sort of credit for rural households because they allow them to diversify their sources of income and improve their food security. This means that households in Raya Kobo, compared to their Raya Alamata counterparts, have more access to off-farm financing and a wider range of economic possibilities and livelihood options, perhaps leading to a higher number of food-secure households. Of the parameters identified and placed in the Table 6 to compare the survey participants in the two weredas, there was a close similarity in the access to loans for the purchase of productive assets, where 76% of respondents from Raya Alamata and 75% of respondents from Raya Kobo said they had no access to it. As a result, there was no statistically significant variation in loan access for household asset creation (χ2 = 0.13, p = 0.7221). Given that household asset creation is a crucial component of food security, this could mean that households in both the Raya Kobo and Raya Alamata weredas lack sufficient access to loans that could enable them to build extra household assets and, hence, ensure food security. In contrast to other criteria, 51% of respondents in Raya Alamata had better access to loans for food purchasing during the drought-induced famine, compared to 20% in Raya Kobo. This difference in household access to loans for food purchases is statistically significant (χ2 = 35.73, p = 0.0000). This disparity in household access between Raya Alamata and Raya Kobo could indicate that residents of Raya Alamata are more vulnerable to drought-induced famine than the residents of Raya Kobo or that residents of Raya Kobo are more food secure than the residents of Raya Alamata. In terms of survey households saving in the research area, almost 70% of survey households in Raya Alamata said they had no savings at all, compared to 17% in Raya Kobo. The disparities in saving capacity of survey household respondents in the two weredas were statistically significant (χ2 = 92.62, p = 0.0000). Nearly 83% of Raya Kobo households stated that they had the saving ability, compared to 30% in Raya Alamata, and that they were actually saving meant that they had excess to purchase agricultural inputs, household furnishings, additional household assets, and other household requirements. Based on the data presented above, therefore, we can conclude that the survey respondents in Raya Alamata are more socially vulnerable in terms of access to basic social services, agricultural inputs, agricultural extension services, credit facilities of any kind or from any organization, and access to participation in local development efforts. This lack of accessibility appears to be negatively associated with low levels of food security in Raya Alamata, and better access in Raya Kobo could also mean better food security status in Raya Kobo communities.
As shown in the Figure 1, there are obvious differences between Raya Alamata and Raya Kobo in terms of their access to all essential resources for sustaining their way of life, including access to basic infrastructure, agricultural extension services, and agricultural inputs, their ability to save money in order to build additional household assets, and the types of copying mechanisms used by households in the two weredas. These pronounced access discrepancies lead to variations in food security status, and levels of social vulnerability appear to be the outcome of variations in institutional governance and related effects.

3.7. Food Coping Strategy of Households in the Study Area

Coping strategies refer to the actions that people rely on when they are faced with food shortages or when they do not have enough money to feed their family members [43]. Many researchers have found that as food insecurity develops, households are more likely to utilize less reversible coping mechanisms, resulting in a more severe type of coping and increased food insecurity [34]. In times of food shortages or when there is insufficient money to procure food for households, communities in the study area have traditionally used different coping strategies, such as local labor, selling productive assets, dropping children out of school, migration to Arab countries, sending HH members to others for feeding, and traditional loans and remittances depending on the level of severity of the disaster and household perceptions towards disasters. As depicted in Table 7, 79.1% of Raya Alamata HHs and 23.7% of Raya Kobo HHs cut back on the number of meals they consumed per day, while 71.8% of Raya Alamata and 27.9% of Raya Kobo HHs cut back on the quality and quantity of their meals. In addition, 47.3% of Raya Alamata sample HHs sold their productive assets, and 44.5% of Raya Kobo sample HHs dropped their children out of school, while 37% and 38.9% of Raya Kobo sample HHs were the same. As affirmed by the focus group discussion conducted with informants in both areas, of course, the simplest coping mechanisms, such as selling buffer livestock assets such as shoats are established, first, progressing to the worst forms of coping possibilities step by step. Because of their reversibility and commitment to domestic resources, people demonstrated rationality in the sequence of different strategies. Modest dietary changes (eating fewer of your favorite foods or reducing portion sizes) are easily reversible measures that do not threaten your long-term health. More drastic actions (such as the selling of productive assets) indicate more catastrophic long-term implications [44,45]. Coping methods can also be divided into two categories. The immediate and short-term modification of consumption patterns is one example. The other category covers long-term changes in income or food production patterns, as well as one-time responses including asset sales [46,47,48]. This demonstrates how people in Raya Alamata are considerably more food insecure and engaged in negative coping methods than people in Raya Kobo. On the contrary, local labor was used by 80.2% of Raya Kobo HHs and 64.9% of Raya Alamata HHs as a means of a coping strategy in both Raya Kobo and Raya Alamata. This suggests that the majority of rural HHs in Raya Kobo, including the food secure, participated in local labor as a means of diversifying HH income rather than as a coping strategy. Despite complaints about microfinance institutions’ high-interest rates in both areas, as confirmed by focus group discussions, 64.9% of the sample households in Raya Alamata and 60% of the sample households in Raya Kobo had access to local microfinance (Dedebit Micro Finance and ACSI, respectively) in times where it was needed as a coping strategy or to engage in income diversification activities. Migration, remittance, and traditional loans are used as coping techniques, with migration (primarily to Arab nations) in Raya Kobo (55% compared to 18.6% in Raya Alamata) and appear to be particularly high, which could have a severe impact on rural labor forces. As indicated in graph 4, it is also clear that 47.3% of Raya Alamata and 37% of Raya Kobo sample households sell their cattle assets, which they cannot easily replace, in order to cope with drought-induced famine in catastrophes. This could result in the depletion of household assets and further put people in a state of chronic food insecurity. In times of drought, 44.5% of sample households in Raya Alamata and 38.9% of sample households in Raya Kobo drop their children out of school as a coping mechanism, indicating the extent to which recurrent disasters could affect the human development efforts of household members in the study area. In terms of social vulnerability to food insecurity, female-headed households, the elderly, and highland dwellers are considerably more susceptible to the worst types of coping strategies than young and low-land residents. According to national annual HRD documents [26] and PSNP PIM (2), 75% of residents in Raya Alamata and 35% of residents in Raya Kobo received food aid, with delays in receiving this assistance sometimes causing further depletion of household assets in both locations.

3.8. Determinant Factors to Household Food Security in the Study Area

Livestock and crop production are the economic foundations of both the highlands and lowlands in the study areas, with crop-based agriculture dominating in the highlands and mixed farming dominating in the lowlands. In the study area, there are two production seasons: belg and meher. Teff, maize, and sorghum are the main crops grown in Meher. Because cereal crops are short growing, the principal crops during the Belg season were Teff and maize. With the advent of irrigation agriculture in Raya Kobo wereda, there was also cash crop production, such as tomatoes, onions, and others. According to the results of the Raya valley socioeconomic study [29], in Raya Alamata wereda, there is a total area of around 2369 km2 of land, with 18,000 hectares of land slated for irrigation. Similarly, the report indicates how the Kobo Gyrana development project reveals that in Raya Kobo wereda, the project intends to dig 393 irrigation wells (boreholes) to serve a total area of 17,500 hectares. Currently, the project has dug more than 150 boreholes, enough to irrigate 2489.22 hectares of land and assist over 33,000 people [42]. Only the net potential irrigable area can be computed based on the field and desk study utilizing the available map in Raya Alamata, amounting to 146,800 hectares that can be irrigated using a pressurized irrigation system. In 2006, the Tigray national regional state’s strategic plan designated the Raya valley, which includes Raya Alamata wereda, as a special development corridor of the region, with the goal of generating meaningful development through urban–rural linkage and bringing a large number of off-farm employment opportunities. It further highlighted that the adoption of policies that emphasize rural and agricultural development to accelerate regional and national sustainable development and growth in order to alleviate poverty is a fundamental foundation that ensures government and donor commitment to the project’s fulfillment [49,50]. Similarly, the Kobo grana agriculture project, which started in 1999, aims to make the greatest contribution to the valley’s development efforts, with a special focus on Raya Kobo wereda, by assisting and empowering valley farmers in their efforts to combat poverty and food insecurity by effectively utilizing the valley’s resources and implementing water and irrigation-based agricultural development activities [42,51]. The Ziway and RAYA Irrigation Projects have been deemed the most valuable projects in terms of assuring long-term food security, reducing poverty, and increasing export profits for their particular districts, regions, and the country as a whole [29,52]. Farmers who have long been in a chronic shortage of rainfed agriculture and have been subject to food insecurity for a previous couple of years expressed a strong interest in irrigation agriculture in a 2007 Raya valley study performed in the area. About 98.5% of the farmers said they would contribute whatever shares and commitment they could to the project’s implementation, while about 1.5% said they were concerned that it might have unintended consequences that would negatively affect their lives [42,51]. According to the Raya valley agronomy study report [42,52], irrigation development in the Raya valley of Alamata wereda could contribute to about 6.2 million quintals of various crop items at optimal levels and play a significant role in improving household food security and income, as well as allowing a large number of private investors to participate and generate significant income from the domestic, export, and agro-processing industries.

4. Conclusions and Recommendations

4.1. Conclusions

Despite the area’s natural resource base, such as surface and underground water potential, the availability of state-of-the-art technology to exploit these potentials, available human power, and the local communities’ willingness and persistent requests to use their resources for irrigation agriculture development to lift themselves out of poverty, people in the study area, especially in Raya Alamata, are affected by recurrent drought-induced famine and its associated adverse impacts, not because of nature but because of government policy failures, deliberate institutional plots, and political measures. This implies that it is not the availability of resources that matters most to ensure food security and reduce the social vulnerability of communities and ensure socioeconomic well-being, but the proper attention and support of institutions and government bodies through the provision of extension services, irrigation systems, and other agricultural inputs. Differences in input provision and support services for agricultural extensions appear to be negatively affecting the degree of vulnerability of residents in Raya Alamata and escalating food insecurity. Households in Raya Alamata are disproportionately disenfranchised and denied access to critical agricultural inputs, such as improved seeds, pesticides, and fertilizers, which could boost production and productivity when compared to Raya kobo in particular and the nation at large. This means that sufficient attention and assistance from institutions and government authorities, such as extension services, irrigation systems, and other agricultural inputs, is more important than the availability of resources in ensuring food security and reducing the social vulnerability of communities. As a coping strategy for drought, 44.5% of the sample households in Raya Alamata and 38.9% of the sample households in Raya Kobo pull their kids out of school. This shows the extent to which recurring disasters could interfere with household members’ attempts to advance their human development in the study area. Furthermore, food aid was provided to 75% of Raya Alamata people and 35% of Raya Kobo households, with delays in obtaining it occasionally leading to the significant depletion of household assets in both places. The study suggests that government failings to deliver services, irrigation systems, and agricultural inputs are to blame for the periodic drought-induced famine in the abundant and untapped natural resource-rich Raya valley. Other research has found that both man-made and natural factors influence the food security of households in rural Ethiopia [28,35,53,54].

4.2. Recommnendations

Because of a lack of proper attention by government institutions, access to and provision of irrigation services, and other agricultural inputs and extension packages, the communities in Raya Valley, in general, and Raya Alamata, in particular, are socially vulnerable to socioeconomic constraints and food insecurity. Thus, access to irrigation systems, agricultural inputs, and proper extension services, together with access to other social services, such as training, education, health facilities, access to roads, and infrastructure facilities, are critical needs for the majority of the population living in the Raya in general and Raya Alamata in particular. As the area is one of the agricultural development potential corridors in the country, the regional government in particular and the federal government should make every effort to empower local communities and allocate resources that will enable farmers to exploit their natural resources and agricultural potential, resulting in agricultural transformation and structural change in the long run. This would help cope with new technology adoption and effective capacity utilization. Traditional smallholders in Raya with vast water potential must be converted to viable and mechanized farm systems. In Raya Kobo wereda, there are good beginnings in terms of irrigation systems that need to be improved to considerably boost productivity as well as solve marketing and other concerns. Appropriate land consolidation in the form of cooperative unions is strongly recommended.

Author Contributions

Conceptualization, A.H., D.T. and T.T.; Methodology, A.H.; Software, T.T.; Writing—original draft, A.H.; Writing—review & editing, A.H.; Supervision, D.T. All authors have read and agreed to the published version of the manuscript.

Funding

This research received no external funding.

Institutional Review Board Statement

Not applicable.

Informed Consent Statement

Not applicable.

Data Availability Statement

Not applicable.

Conflicts of Interest

The authors declare no conflict of interest.

Appendix A

Table A1. Households demographic table x.
ItemsSample Households (%)
Raya Alamata = N = 124Raya Kobo N = 276
Male FemaleTotal MaleFemaleTotal
Age15 to 6441.0511.5852.6331.015.4235.66
Above 6442.115.2647.3756.596.9864.34
Average family size (No.)3.163.256.332.692.635.02
Marital statusmarried 33.3384.76 84.76
single 54.766.19 6.19
High school completed 6.52 26.76
Table A2. Household economy of sample households in the study weredas.
Raya Alamata (%)Raya Kobo (%)
ItemsMaleFemaleTotalMale FemaleTotal
Access to irrgation 8.18 68.20
Irrigation affordability
Can afford 69.9 95.4
Can not afford 30.1 4.6
Access to extension service 1.82 49.43
Access to improved seed 0.91 51.34
Access to fertilizer 1.82 48.66
Access to pecticide 0.00 30.65
Manure application 0.91 18.01
IncomeAgri 80.9 83.14
Pt-T 7.27 0.00
Agri and Pt-T 10.91 16.48
Others 0.91 0.91
Own land68.188581.881.830.344.3
Land Rented from HHs27.2730.68303033.3320.61
Land rented from institutions13.67.89.19.124.2423.25
Productivity trend
Increase 3.5 54.72
Decrease 96.5 45.28
Agri ”agriculture”; Agri-Pt-T “agriculture, petty trade, ”; Pt-T “petty trade”.
Figure A1. Raya Alamata HFIAS score. Sources: author’s construction from 2019 household survey data.
Sustainability 15 00160 g0a1
Figure A2. Raya Kobo HFIAS score. Sources: author’s construction from 2019 household survey data.
Sustainability 15 00160 g0a2

References

  1. Relief Society of Tigray. Feasibility Study Report for Raya Valley Agricultural Development Project, Volume III, Annex J, Agronomy and Crop Production; Relief Society of Tigray: Mekelle, Ethiopia, 1998. [Google Scholar]
  2. Khandker; Shahidur, R.; Koolwal Gayatri, B.; Samad Hussain, A. Handbook on Impact Evaluation: Quantitative Methods and Practices; World Bank: Washington, DC, USA, 2010. [Google Scholar]
  3. Relief Society of Tigray. Raya Valley Development Study Project Demographic and Social Baseline Survey Report; Relief Society of Tigray: Alamata, Ethiopia, 1997. [Google Scholar]
  4. Ministry of Agriculture. Productive Safety Net Programme Phase IV Programme Implementation Manual; Ministry of Agriculture: Addis Ababa, Ethiopia, 2014. [Google Scholar]
  5. Ministry of Water and Energy. Water and Energy Development Office Annual Report; Ministry of Water and Energy: Alamata, Ethiopia, 2019. [Google Scholar]
  6. Amhara Regional State: Urban Rural Road Authority Project (URRAP) Annual Report; ANRS: Kobo, Ethiopia, 2019.
  7. Raya Kobo Woreda Agriculture Office Annual Report; ANRS: Kobo, Ethiopia, 2019.
  8. Allen, K. Vulnerability Reduction and the Community-Based Approach. In Natural Disasters and Development in a Globalized World; Pelling, M., Ed.; Routledge: New York, NY, USA, 2003; pp. 170–184. [Google Scholar]
  9. Adger, W.N. Social Vulnerability to Climate Change and Extremes in Coastal Vietnam. World Dev. 1999, 27, 249–269. [Google Scholar] [CrossRef]
  10. Adger, W.N.; Huq, S.; Brown, K.; Conway, D.; Hulme, M. Adaptation to Climate Change: Setting the Agenda for Development Policy and, Research; Center for Climate Change Research Working Paper: Tyndall, SD, USA, 2002. [Google Scholar]
  11. Adger, W.N. Vulnerability. Glob Environ. Chang. 2006, 16, 268–281. [Google Scholar] [CrossRef]
  12. Adger, W.N.; Brown, K.; Nelson, D.R.; Berkes, F.; Eakin, H.; Folke, C.; Galvin, K.; Gunderson, L.; Goulden, M.; O’Brien, K.; et al. Resilience implications of policy responses to climate change. WIREs Clim. Chang. 2011, 2, 757–766. [Google Scholar] [CrossRef]
  13. Blaikie, P.; Cannon, T.; Davis, I.; Wisner, B. At Risk: Natural Hazards, Peoples Vulnerability, and Disasters; Routledge: London, UK; New York, NY, USA, 1994. [Google Scholar]
  14. Kelly, P.M.; Adger, W.N. Theory and practice in assessing vulnerability to climate change and facilitating adaptation. Clim. Chang. 2000, 47, 325–352. [Google Scholar] [CrossRef]
  15. Hewitt, K. Disasters in ‘development’ contexts: Contradictions and options for a prevention approach. Jàmbá J. Disaster Risk Stud. 1997, 5, a91. [Google Scholar] [CrossRef] [Green Version]
  16. Fatemi, F.; Ardalana, A.; Aguirre, B.; Mansouri, N.; Mohammadfam, I. Social vulnerability indicators in disasters: Findings from a systematic Review: Int. J. Disaster Risk Reduct. 2017, 22, 219–227. [Google Scholar] [CrossRef]
  17. Wisner, B.; Luce, H.R. Disaster Vulnerability: Scale, Power and Daily Life. GeoJournal 1993, 30, 127–140. [Google Scholar] [CrossRef]
  18. HLPE. Social Protection for Food Security; High-Level Panel of Experts on Food Security and Nutrition of the Committee on World Food Security: Rome, Italy, 2012. [Google Scholar]
  19. Degefa, T. Rural Livelihoods, Poverty and Food Security in Ethiopia. A Case Study at Erenssa and Garbi Communities in Oromia Zone, Amhara National Regional State. Ph.D. Thesis, Department of Geography, Norwegian University of Science and Technology, Trondheim, Norway, 2005. [Google Scholar]
  20. Federal Democratic Republic of Ethiopia; Ministry of Finance and Economic Development: Kampala, Uganda, 2013.
  21. United Nations Development Program (UNDP). Human Development Report (HDI) Report; UNDP: New York, NY, USA, 2020. [Google Scholar]
  22. Ministry of Agriculture. Poverty and Hunger Strategic Review: Ethiopia’s Roadmap to Achieve Zero Poverty and Hanger Report; Ministry of Agriculture: Addis Ababa, Ethiopia, 2019. [Google Scholar]
  23. Diriba, G. Overcoming Agricultural and Food Crises in Ethiopia: Institutional Evolution and the Path to Agricultural Transformation; Ministry of Agriculture: Addis Ababa, Ethiopia, 2018. [Google Scholar]
  24. Mohamed, A.A. Food Security Situation in Ethiopia. A Review Study. 2017. Available online: https://www.researchgate.net/publication/328908922 (accessed on 7 September 2022).
  25. FAO STAT. Agricultural Production Statistics 2000–2020 FAOSTAT Analytical Brief 41; FAOSTAT: Rome, Italy, 2020. [Google Scholar]
  26. ACAPS. Food Insecurity. ACAPS Thematic Report: Famine in Ethiopia, Nigeria, Somalia, South Sudan, and Yemen. 2018. Available online: https://www.acaps.org/sites/acaps/files/slides/files/20180226_acaps_thematic_report_food_insecurity_final.pdf (accessed on 7 September 2022).
  27. Abdulla, A.M. Determinants of Household Food Security and Coping Strategies: The Case of BuleHora District, Borana Zone, Oromia, Ethiopia. Eur. J. Food Sci. Technol. 2015, 3, 30–44. [Google Scholar]
  28. Anderson, M.B.; Woodrow, P.J. Reducing Vulnerability to drought and famine; developmental approaches to relief. Disasters 1991, 15, 43–54. [Google Scholar] [CrossRef] [PubMed]
  29. Blaikie, P.; Cannon, T.; Davis, I.; Wisner, B. At Risk: Natural Hazards, People’s Vulnerability and Disasters, 2nd ed.; Routledge: London, UK, 2004. [Google Scholar]
  30. FAO. Climate Risk and Food Security in Ethiopia: Analysis of Climate Impacts on Food Security and Livelihoods. Global Early Warning–Early Action Report on Food Security and Agriculture. 2016. Available online: https://reliefweb.int/report/world/global-early-warning (accessed on 7 September 2022).
  31. Cochran, W.G. Sampling Techniques, 3rd ed.; John Wiley & Sons: New York, NY, USA, 1977. [Google Scholar]
  32. Heckman, J.J.; Ichimura, H.; Todd, P. Matching as an Econometric Evaluation Estimator: The Review of Economic Studies; Oxford University Press: Oxford, UK, 1998; Volume 65, pp. 261–294. [Google Scholar]
  33. FAO; IFAD; UNICEF; WFP; WHO. Pastoralism in Africa’s Drylands: Reducing Risks, Addressing Vulnerability and Enhancing Resilience; The State of Food Security and Nutrition in the World: Rome, Italy, 2017; 52p. [Google Scholar]
  34. FAO. The State of Food Security and Nutrition in the World Transforming Food Systems for Affordable Health Diets; FAO: Rome, Italy, 2020. [Google Scholar]
  35. Devereux, S. Theories of Famine; Harvester Wheatsheaf: Hemel Hempstead, UK, 1993; 221p. [Google Scholar]
  36. Feed the Future; Global Food Security Strategy (GFSS): Global Report on Food Crises. 2018. Available online: https://www.fsinplatform.org/sites/default/files/resources/files/GRFC_2018_Full_report_EN_Low_resolution.pdf (accessed on 7 September 2022).
  37. Raya Alamata wereda Administration Office Annual Report; Raya Alamata Wereda Adminstrative Office: Alamata, Ethiopia, 2019.
  38. Maxwell, D. The “Coping Strategies Index” Introduction and Overview; World Bank: Washington, DC, USA, 2012. [Google Scholar]
  39. Yimer, M. Towards Food Insecurity Multidimensional Index. 2015. Available online: https://www.semanticscholar.org/paper/Towards-a-Food-Insecurity-Multidimensional-Index-(-NapoliMuro/e37dad6f2c3e6d3f159ab68e6c7867b3ea3034ad (accessed on 7 September 2022).
  40. Central Statistics Agency (CSA), Ethiopia; ICF. Ethiopia Demographic and Health Survey 2016; HIV Report; CSA: Addis Ababa, Ethiopia; ICF: Rockville, MD, USA, 2018. [Google Scholar]
  41. WFP. Saving Lives and Changing Lives, Ethiopia Annual Country Report of 2019 Country Strategic Plan; WFP: Rome, Italy, 2020. [Google Scholar]
  42. Yimer, M. Pastoral Development Pathways in Ethiopia; the Policy Environment and Critical Constraints, Brief for GSDR. 2017. Available online: https://sustainabledevelopment.un.org/content/documents/5789pastoralism_development_pathways_rev2.pdf (accessed on 7 September 2022).
  43. Meade, B. Ethiopia’s Progress towards Eradicating Poverty: An Interim Report on 2015/16 Poverty Analysis Study; UNDP: Addis Ababa, Ethiopia, 2019. [Google Scholar]
  44. Ministry of Agriculture. Office of Agriculture and Rural Development Annual Report; Ministry of Agriculture: Addis Ababa, Ethiopia, 2019. [Google Scholar]
  45. Maxwell, D.; Caldwell, R. The Coping Strategies Index Field Methods Manual, 2nd ed.; USAID: Washington, DC, USA, 2008. [Google Scholar]
  46. Helvetas, P.M.; von Grebmer, K.; Bernstein, J.; Patterson, F.; Wiemers, M.; Chéilleachair, R.N.; Foley, C.; Gitter, S.; Ekstrom, K.; Fritschel, H. Global Hunger Index: The Challenge of Hunger and Climate Change; Global Hunger Index; GHI: Dublin, Ireland; Bonn, Germany, 2019. [Google Scholar]
  47. Dan Maxwell, S.; Smith, M. Household Food Security. Concepts Indicators Measurements. A Technical Review; UNICEF: New York, NY, USA; IFAD: Rome, Italy, 1999. [Google Scholar]
  48. Coats, J.; Swindale, P. Household Food Insecurity Access Scale (HFIAS) for Measurement of Household Food Access; Indicator Guide (V.3); Food and Nutrition Technical Assistant Project; Academy for Educational Developmen: Washington, DC, USA, 2007. [Google Scholar]
  49. FDRE, Humanitarian Partners. Joint Government and Humanitarian Partners’ Requirement Document; Government of Ethiopia: Addis Ababa, Ethiopia, 2020. [Google Scholar]
  50. Tigray Regional National State. Tigray Finance and Economic Development Bureau Strategic Plan; Tigray Regional National State: Mekelle, Ethiopia, 2014. [Google Scholar]
  51. KGVD. Kobo Grana Valley Development Project Annual Report; North Wollo: Kobo, Ethiopia, 2018. [Google Scholar]
  52. Water Works Design & Supervision Enterprise (WWDSE). Raya Valley Pressurized Irrigation Project, Socioeconomic Feasibility Report; WWDSE: Mekele, Ethiopia, 2007. [Google Scholar]
  53. Debebe, H. Food Security: A Brief Review of Concepts and Indicators. In Proceedings of the Inaugural and First Annual Conference of the Agricultural Economic Society of Ethiopia, Addis Ababa, Ethiopia, 8–9 June 1995. [Google Scholar]
  54. Mariam, M.W. Rural Vulnerability to Famine in Ethiopia, 1958–1977; Intermediate Technology Publications: London, UK, 1986. [Google Scholar]
Figure 1. One household’s access to livelihood assets.
Sustainability 15 00160 g001
Table 1. Household population size and sampled households.
TabiasPopulation SizeSampled Households
TotalTotal
Amhara region222,534274
Tigray region102,398126
Total324,932400
Table 2. Land fertility by wereda and agroecology.
Land Fertility %Raya AlmataRaya Kobo
Lowland HighlandLowland Highland
Infertile8%38% 13%14%
Medium 75%54% 40%81%
fertile17%8% 47%5%
100%100%100%100%
Sources: Author’s construction from 2019 household survey data.
Table 3. Two-sample t test for means of different socio-economic indicators.
Indicators/GroupTreated
(Raya-Kobo)
No-Treated
(Raya-Alamata)
CombinedDifference
Access to irrigation0.440.0180.310.42 ***
Better extension service0.490.0180.350.47 ***
Access to improved seed0.510.0090.360.50 ***
Access to fertilizer0.480.0090.340.47 ***
Access to pecticide0.3000.210.30 ***
Application of manure0.170.0090.210.17 ***
Land ownership
Land size 1.131.641.27−0.50 ***
Own land0.420.810.54−0.39 ***
Land Rented from HHs0.220.300.24−0.078
Land rented from institutions0.230.090.190.14 **
Share cropping0.260.120.220.13
Production/productivity trend
Total Production per hectare 22.5119.5421.65−2.96
Productivity 0.550.0290.40−0.52 ***
Irrigation infrastructure availability and affordability
Irrigation system availability (Can afford)0.240.600.340.35 ***
Cannot afford even if there is the system0.450.300.120.26 ***
Sources: Author’s construction from 2019 household survey data. Significance level *** p < 0.001, ** p < 0.01.
Table 4. Food security staus of sample households by weredas and agroecology.
Food Security StatusRaya AlamataRaya Kobo
Low LandHigh Land%Low LandHigh Land%
Food secure10%6.4%16.4%40.23%36.40%76.63%
Mildly food insecure12.7%4.5%17.3%2.68%3.45%6.13%
Moderately food insecure41.8%11.8%53.6%6.13%10.34%16.47%
Severely food insecure10%2.7%12.8%0.38%0.38%0.76%
Source: Author’s construction from 2019 household survey data.
Table 5. Treatment effects-average using propensity score matching (PSM) method.
Variables SampleATTDifference (S.E)T-Stat
Treated
RK
No-Treated
RA
Treated
RK
No-Treated
RA
FS_Status 2611101.432.76−1.35 (0.29)−4.54 ****
HFIAS_Score 2611103.7010.58−6.87 (1.50)−4.59 ***
HFIAS_Cat12611100.660.320.33 (0.12)2.76 **
HFIAS_Cat22611100.300.76−046 (0.10)−4.23 ***
HFIAS_Cat32611100.330.77−0.43 (0.09)−4.66 ***
HFIAS_Cat42611100.190.68−0.48 (0.12)−4.01 ***
Sources: Author’s construction from 2019 household survey data. Note: Cetegory refers: Cat1 = food secure, Cat2 = mildly food insecure, Cat3 = moderately food insecure, and Cat4 = severly food insecure sample of the study woredas. Significance level **** p < 0.0001,*** p < 0.001, ** p < 0.01.
Table 6. HH access to livelihoods assets.
VariablesRaya AlamataRaya KoboChi-Squared Test
Yes (%)No (%)Yes (%)No (%)
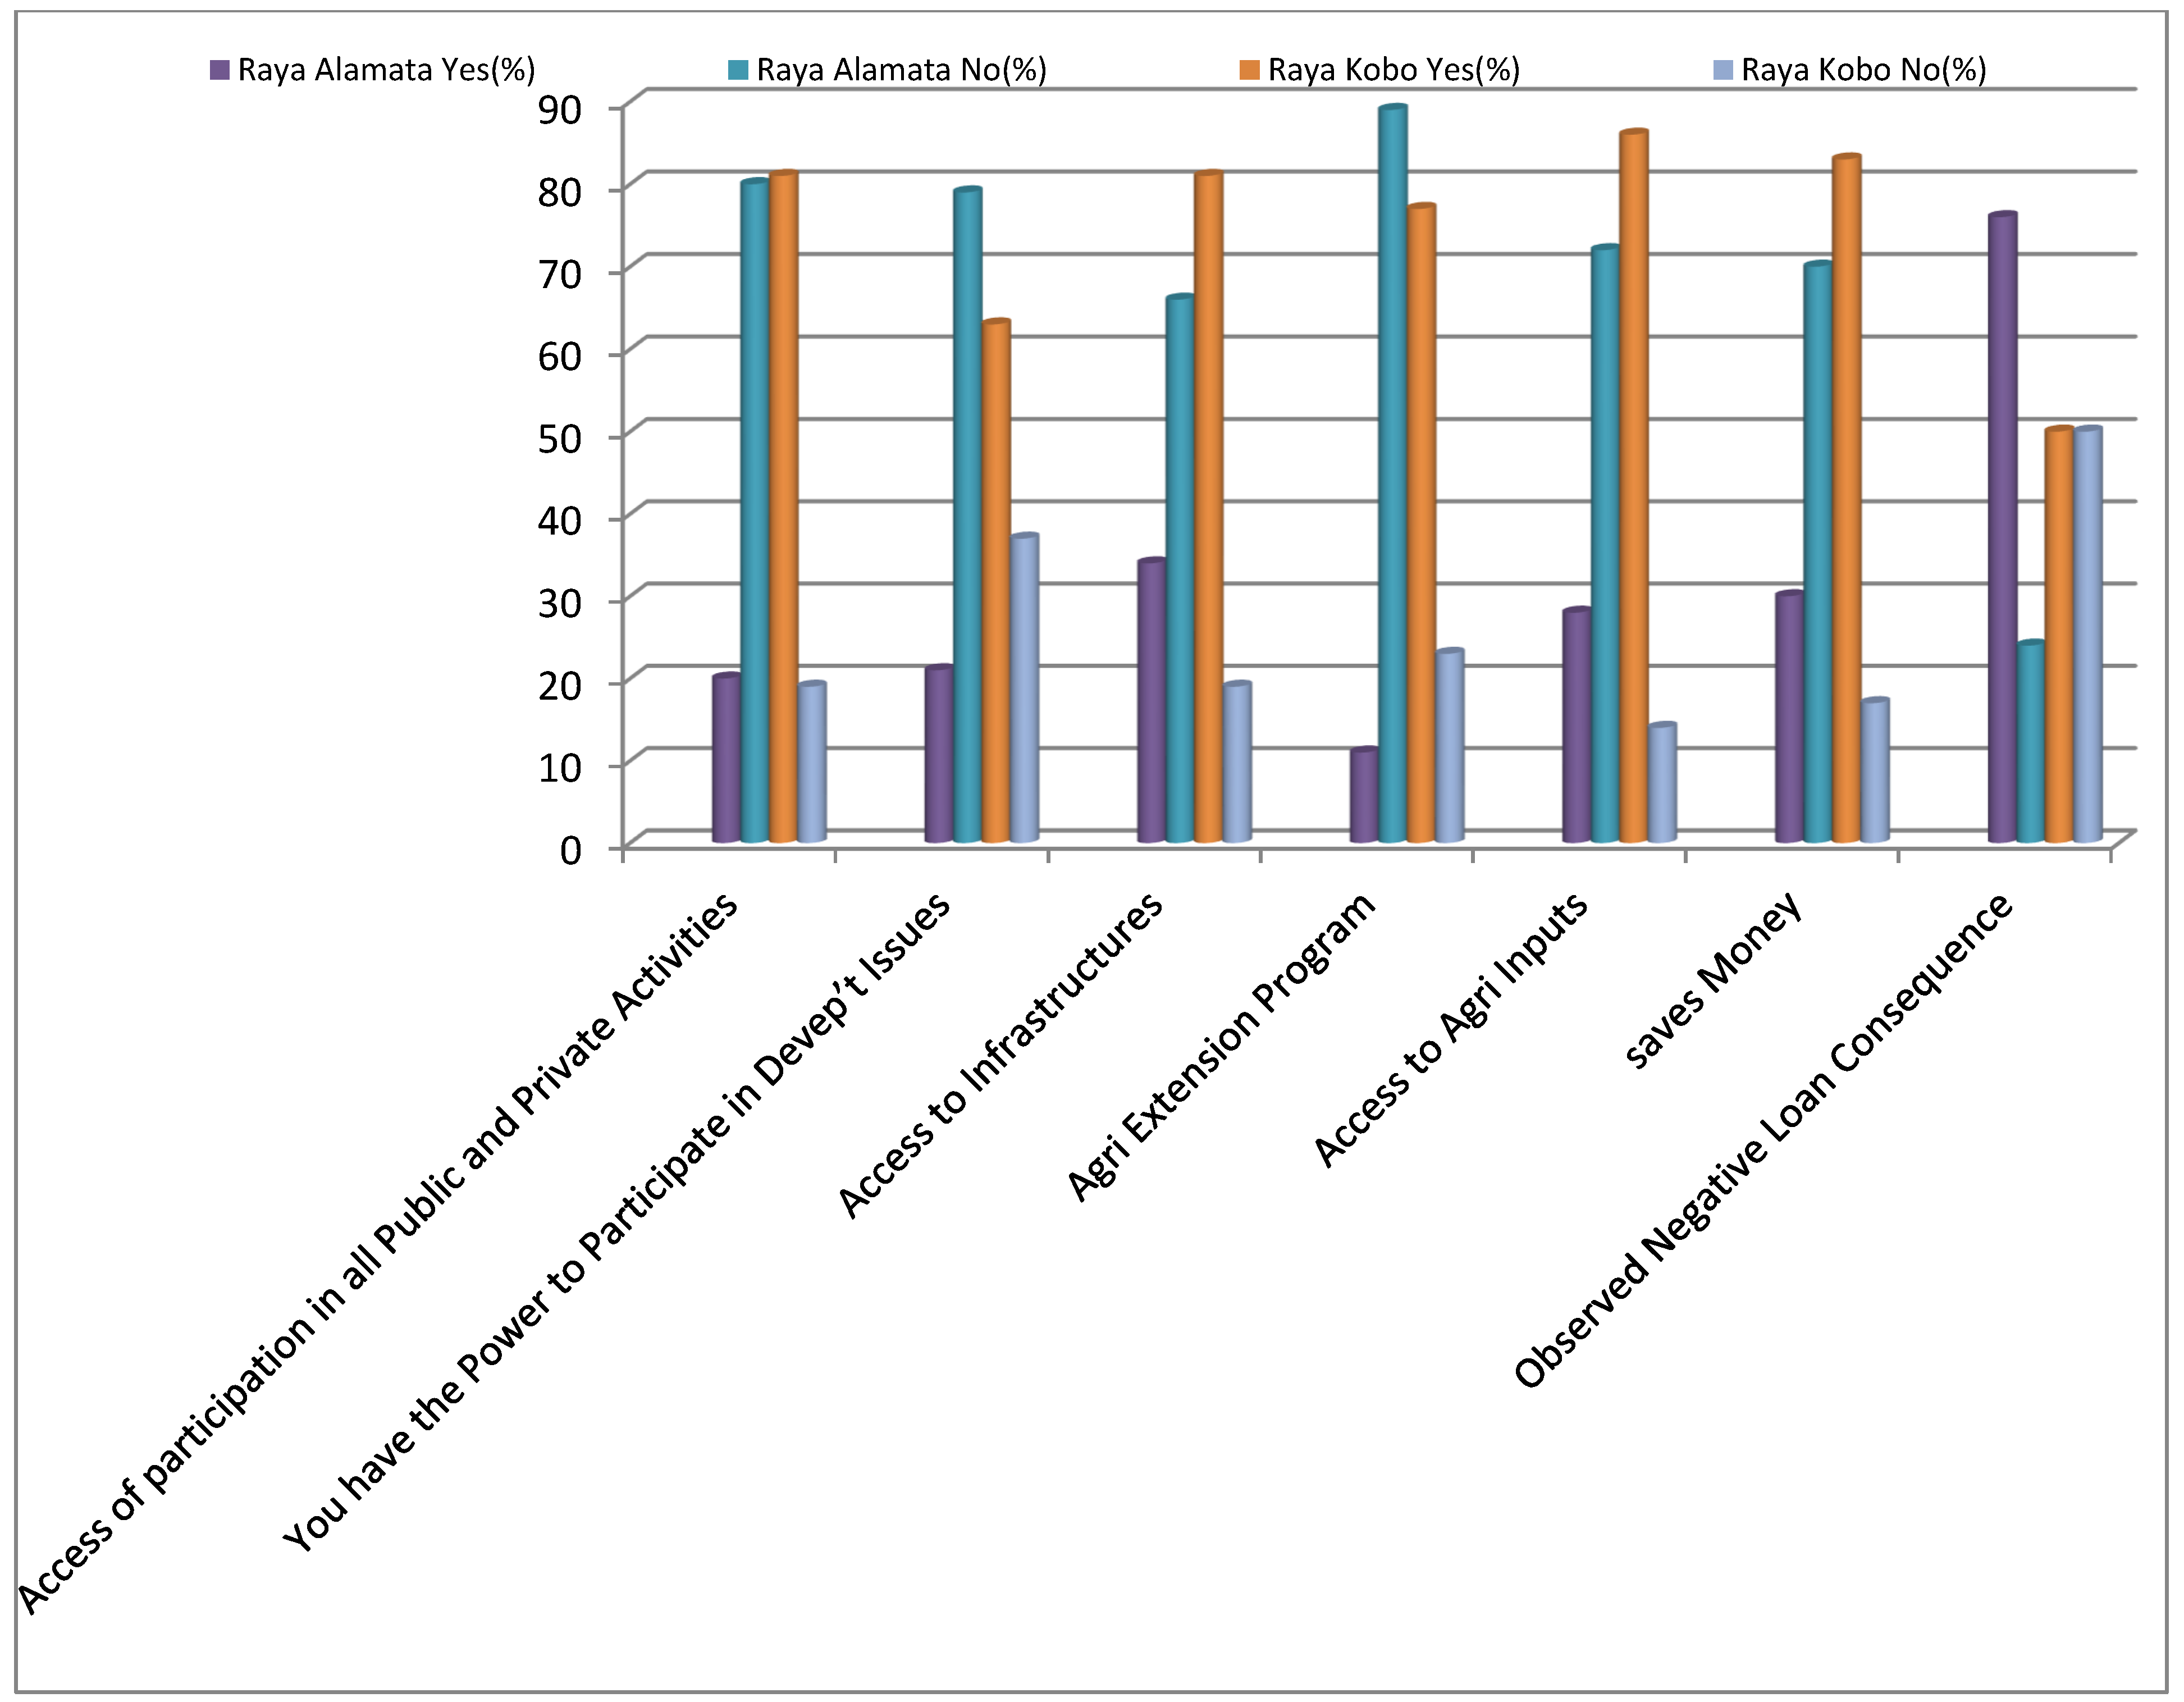
Access to participates in all Public and Private Activities20808119p = 0.0000
You have the Power to Participate in Development Issues21796337p = 0.0000
Access to Infrastructures34668119p = 0.0000
Transportation to Market Places36647426p = 0.0000
Agri Extension Program11897723p = 0.0000
Access to Agri Inputs28728614p = 0.0000
Credit Provider—Cooperatives7932179p= 0.0012
Credit Provider—NGOs298595p = 0.1578
Credit Provider—Relatives298892p = 0.0231
Saves Money30708317p = 0.0000
Loan access for Non-Farm and Off-Farms Activities32686139p = 0.0000
Loan Access from Microfinance58424060p = 0.0039
Observed Negative Loan Consequence76245050p = 0.0004
Loan for Ceremonial Event2872595p = 0.0000
Loan for Sending Children to Arab2575397p = 0.0000
Loan for Purchase of Productive Assets24762575p = 0.7221
Loan for Food Purchase51492080p = 0.0000
Source: researcher’s own construction from 2019 survey data.
Table 7. Comparision of coping strategies of HHs in the study area.
Copping StrategiesRaya Kobo (%)Raya Alamata%
Decrease_No_Meal23.779.1
Decrease_Quality and Quantity27.971.8
Local Labor80.250.9
Loan from micro finance64.960
Selling productive assets37.047.3
Dropping_Children_out of School38.944.5
Migration55.013.6
Sending_HH_member40.834.5
Tradional_loan34.739.1
Remittance25.633.6
Sources: Author’s construction from 2019 household survey data.
Disclaimer/Publisher’s Note: The statements, opinions and data contained in all publications are solely those of the individual author(s) and contributor(s) and not of MDPI and/or the editor(s). MDPI and/or the editor(s) disclaim responsibility for any injury to people or property resulting from any ideas, methods, instructions or products referred to in the content.

