Article

Effect of Acidification on Clay Minerals and Surface Properties of Brown Soil

1
National Engineering Research Center for Efficient Utilization of Soil and Fertilizer Resources, College of Resources and Environment, Shandong Agricultural University, Tai’an 271018, China
2
Department of Environmental Engineering, Shandong Urban Construction Vocational College, Jinan 250103, China
*
Authors to whom correspondence should be addressed.
Sustainability 2023, 15(1), 179; https://doi.org/10.3390/su15010179
Submission received: 29 November 2022 / Revised: 17 December 2022 / Accepted: 19 December 2022 / Published: 22 December 2022
(This article belongs to the Special Issue Agricultural Land Change and Soil Degradation)

Abstract

:
Globally, soil acidification is becoming a serious environmental and ecological concern, posing a major threat to ecosystem functions and services. In order to clarifying the acidification mechanism, evaluating acidification risk, and reconditioning soil acidification, the effects of acidification on clay mineral composition and soil surface properties should be evaluated. In this study, the surface charge, specific surface area (SSA), species and content of clay minerals were investigated using the ion adsorption method, methylene blue method, and X-ray diffraction (XRD) for brown soil samples, which collected from Muping, Shandong Province, China. The results showed that the clay mineral species and content varied with the degree of acidification. A small amount of montmorillonite was found in weakly acidic soils, and gibbsite was found in strongly acidic soils. Furthermore, although illite, kaolinite, vermiculite, and chlorite were commonly found in soils with different acidification degrees, their content differed. The negative charge (CEC8.2), permanent negative charge (CECP), variable negative charge (CECV), and SSA values decreased with increasing acidification, while anion exchange capacity values (AEC) decreased. The change of CECV was caused by soil organic matter, and the change of CECP was caused by illite content, which accounted for the largest proportion in clay minerals of brown soil.

1. Introduction

Globally, soil acidification affects up to 40% of the arable soils and 70% of the potentially arable land [1,2]. Thus, it poses a serious threat to ecosystem functions and services in non-agricultural and agricultural systems [3,4]. Recently, more attention has been paid to the negative impacts of soil acidification on nutrient balances, plant species richness, crop production due to the loss of base cations, and mobilization of Al and other potentially toxic elements in soil [5]. An earlier study reported that lower soil pH increases the activity of nutrients, such as Fe, Al, Mn, while a higher availability of micronutrients helps crops absorb them, the fertility of highly weathered soils are compromised or decline with time [6]. Additionally, a large amount of H+ enters the soil solution and then exchanges with exchangeable base cations on the soil colloids and then enters the soil colloid surface, which enables the soil to produce exchangeable H+ (EH+). When the adsorbed H+ on soil colloids exceeds a certain limit, the crystalline structure of these colloidal particles is disrupted and some Al octahedra even disintegrate. The Al ions detach from the octahedral lattice and become active Al ions, which are adsorbed on the negatively charged clay surface and are converted into exchangeable Al3+ (EAl3+) [7]. Hence, soil acidification can affect the structure and composition of clay minerals.
Clay minerals are important part of the soil. Their fine particles, large surface area, and negative charge have a significant effect on soil properties. Moreover, the changes in clay minerals caused by environmental influences affect soil fertility. Under soil acidification conditions, the weathering intensity may vary, depending on the type of clay mineral concerned. Studies have reported strong weathering of feldspar, mica, chlorite, and vermiculite under acidic conditions [8]. Xu et al. [9] reported that the soil was significantly acidified after the 54 years of tea planting, and soil weathering was enhanced by acidification caused by tea cultivation. Tao et al. [10] used X-ray diffraction (XRD) to scan cultivated brown soil after 23 years of targeted fertilization and found that that the transformation of clay minerals was accelerated by manure treatments. Compared to the no manure treatment, the increasing kaolinite and decreasing illite indicated that the rapid transformation from illite to kaolinite was dependent highly on the long-term manure application, which significantly influenced soil pH.
Soil acidity primarily exists in the form of exchangeable acid on the solid surface of soil. The charge status of the soil surface determines the buffering ability of soil to exogenous acid and the degree of soil acidification [11]. Previous studies have revealed the relationship between soil surface properties (hereafter surface properties) and pH. In the arid soil of southeast Iran [12] that has less variable charge, pH was positively correlated with the permanent negative charge and negatively correlated with the anion exchange capacity (AEC). Additionally, the change in charge was also related to the composition and content of clay minerals. In the soil developed from the tropical and subtropical regions, China [13], soil acidity showed a significant positive correlation with CEC, but a significant negative correlation with free iron oxide content. The degree of variation in the surface properties of brown-red soil, red soil, oxisol, yellow-cinnamon soil, and yellow-brown soil with pH was different in zonal soils in Central Southern China, which was related to the composition of the clay minerals and content of Fe and Al oxides in the soil [14]. Furthermore, soil acidification can lead to heavy metal element activation. On the one hand, H+ produced in the acidification process will dissolve the heavy metal ions into the soil solution, which can improve the availability of heavy metal ions. On the other hand, the reduction of clay content in acidified soil will reduce the adsorption of heavy metal ions, which will seriously affect the safety of agricultural products [15,16,17]. Over the past few decades, many studies have focused on the influence of soil acidification on clay mineralogy and surface properties. However, the effects of soil acidification in most studies were achieved by soaking in inorganic acids [18] or by a dynamic leaching test [19] of simulated acid rain. In nature, soil acidification is a slow and long-term process and is largely influenced by environmental factors. Therefore, the effects of different levels of soil acidification on the surface properties and clay minerals of natural soils need to be studied to improve our understanding of the mechanism of evolution of soil acidification.
Many studies have recently been conducted on soil acidification of red and yellow soil in South China [20,21]. However, relatively fewer studies have been conducted on the acidification of brown soil in the north. Furthermore, the acidification of intensive farmland and orchard soil in Jiaodong Peninsula not only leaded to crop production reduction, but also caused a series of non-point source pollution problems, which seriously restricted the construction of the blue economic zone in Shandong Peninsula. Therefore, the study on acidification of the brown soil in Jiaodong Peninsula urgently need attention. In this study, soil profiles with different acidification degrees were sampled from the Muping area of the Jiaodong Peninsula. The aims of this work were (1) to investigate the influence of the acidification degree on the species and content of clay minerals; (2) clarify the influence of acidification degree on the surface properties including soil surface charge and the specific surface area (SSA); (3) establish the correlation among indices of acidity, clay minerals, and surface properties. The results could provide fundamental theories for understanding the acidification mechanism, evaluating acidification risk, and reconditioning soil acidification.

2. Materials and Methods
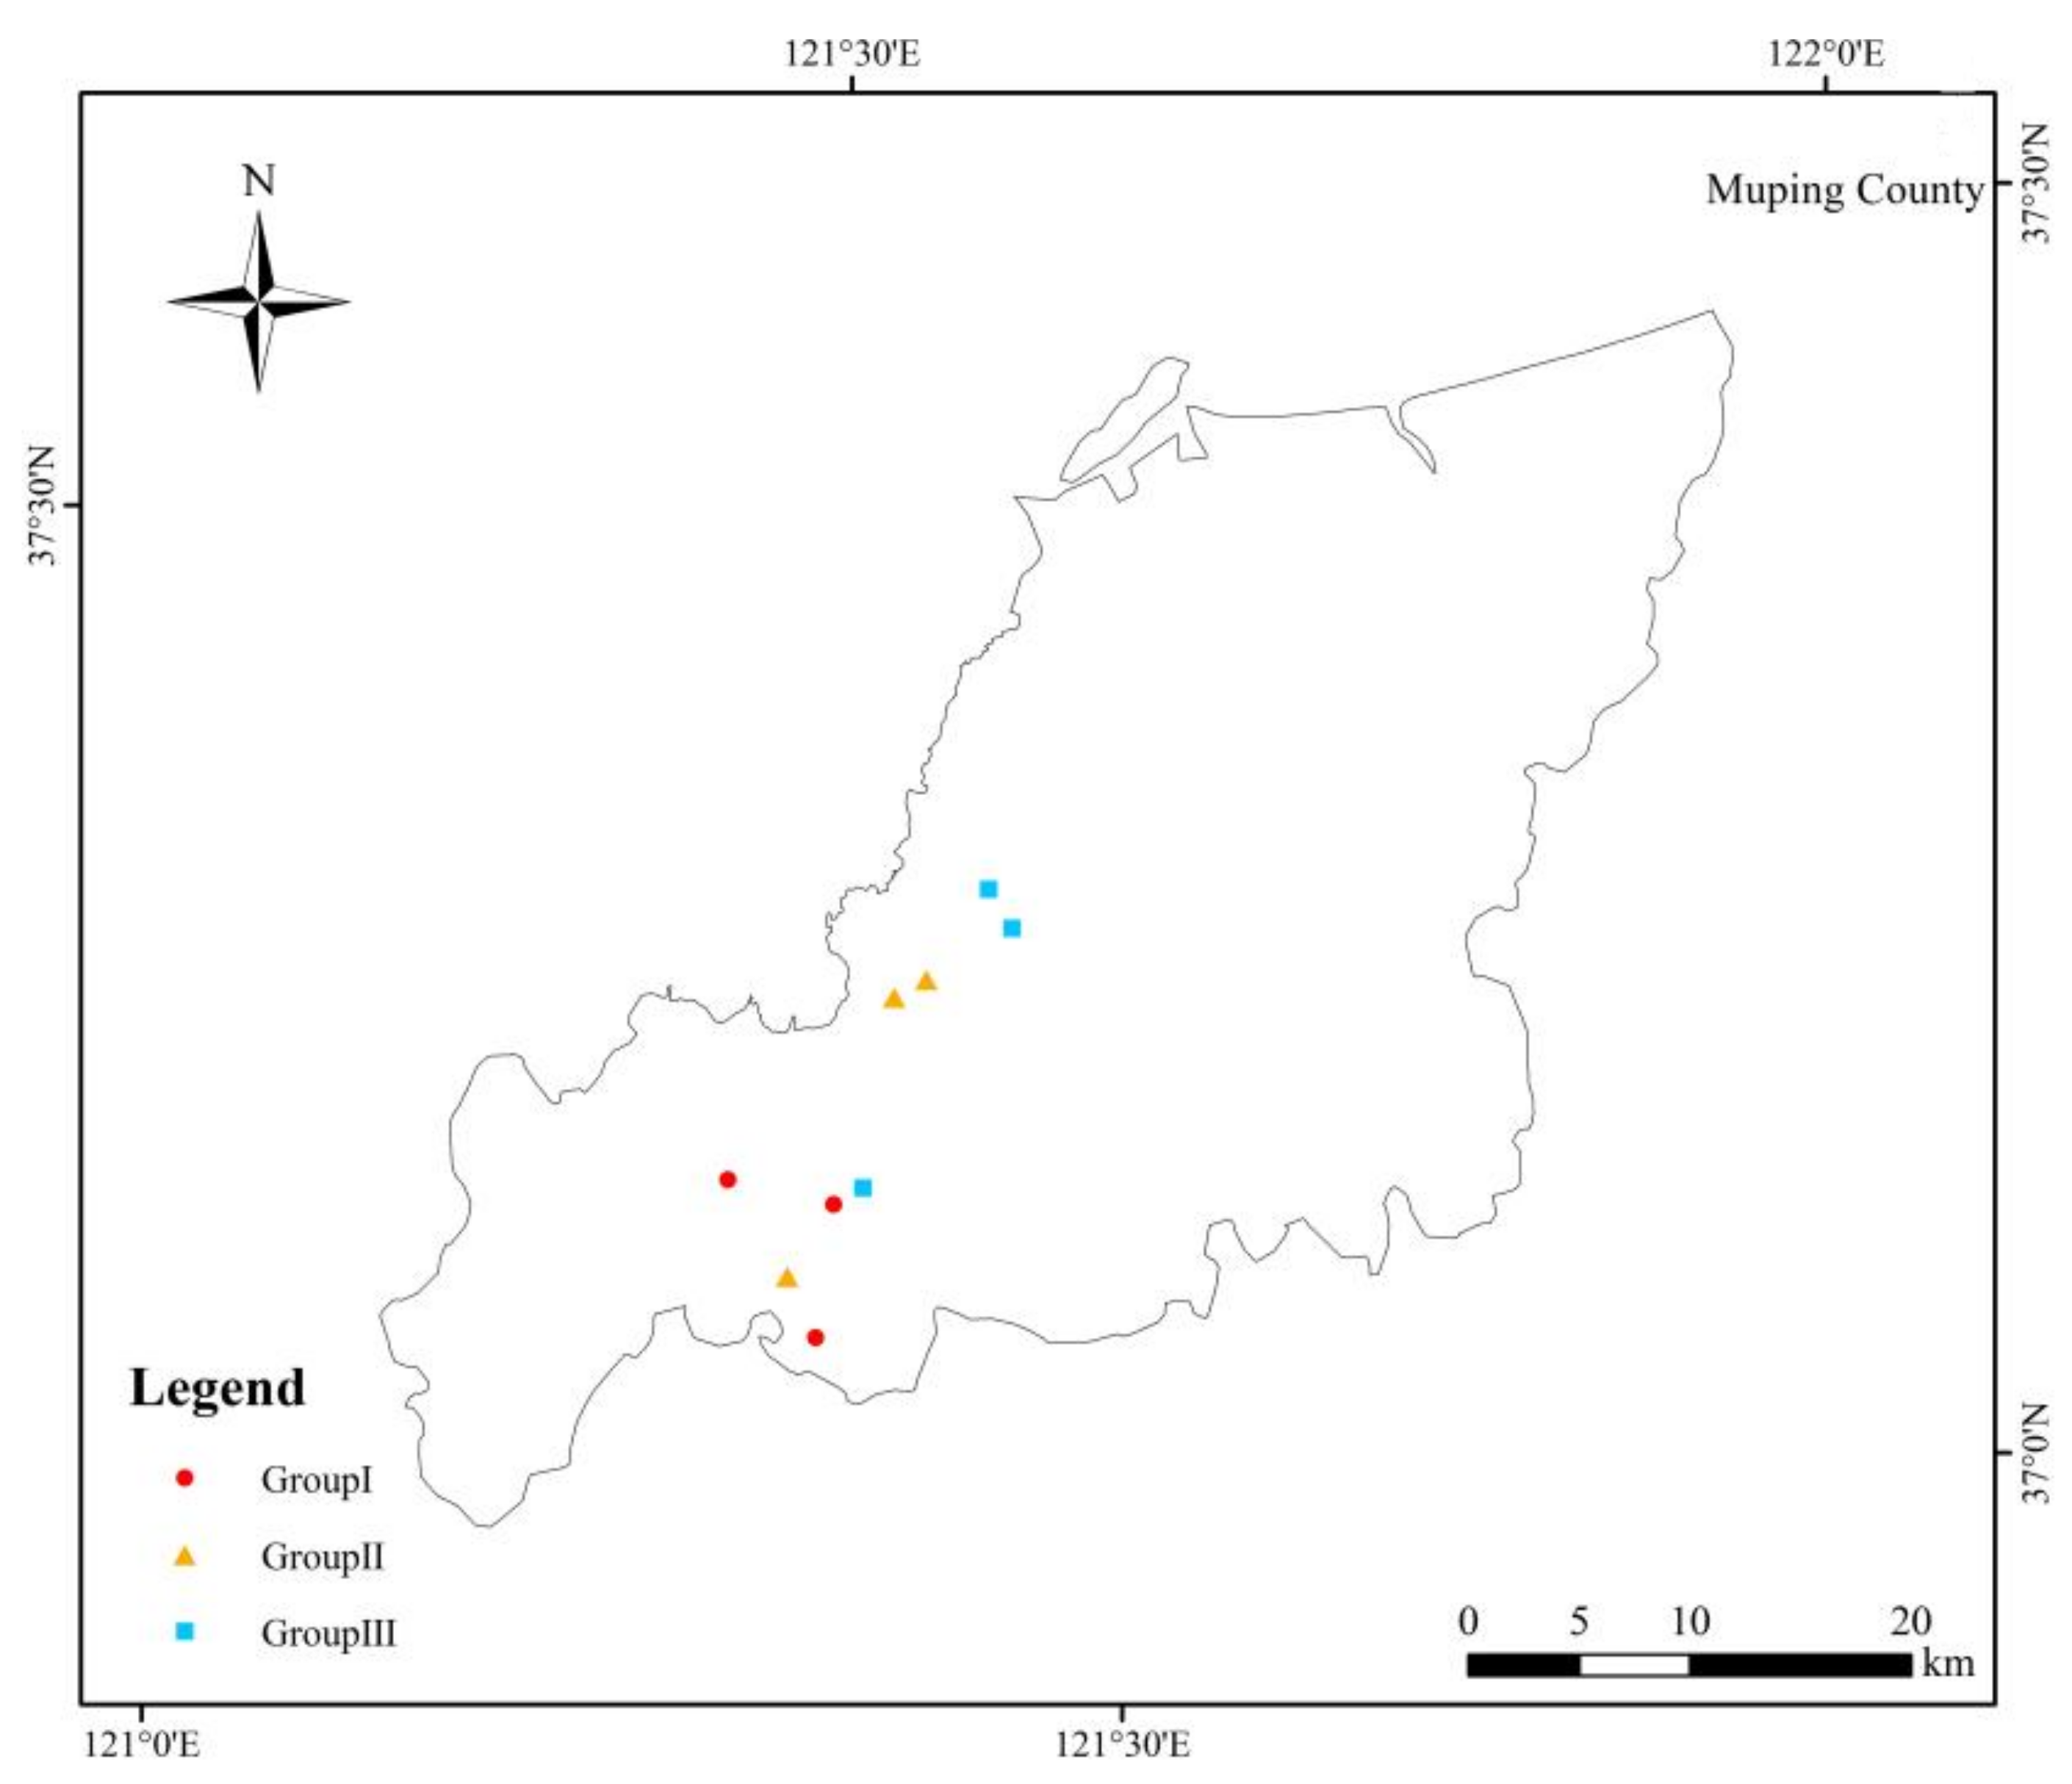
2.1. Soil Samples

In our study, 9 sampling sites were selected and 27 soil samples (including 0–20, 20–40, and 40–60-cm layers) were collected in the Muping District, Yantai City, northeastern Shandong Peninsula (37°4′–37°30′ N, 121°9′–121°56′ E; Figure 1). The study area was characterized by a warm temperate monsoon climate, with an average annual temperature of 11.2 °C and an average annual rainfall of 737.2 mm. The parent rocks in this area are mostly granite. Soil parent materials are alluvial or residual alluvial. The sampling sites were all selected from farmland and a wheat-maize rotation system was adopted. The cropping years were all over 10 years. Each sample contained 1 kg of soil and had a mixture of five-point sub-samples collected using a soil auger. These were placed in sample bags and were air-dried and ground in the laboratory. One part of soil was passed through a 2-mm sieve for the determination of pH, EH+, EAl3+ and clay extraction, another part was passed through a 0.25 mm sieve for the determination of SOM, soil surface charge and SSA.
Based on the pH value of the 0–20-cm soil layer, the 9 sampled sites were divided into three groups according to the soil acidity grading standards of the Second National Soil Census [22,23]: strongly acidic, pH < 4.5 (Group I); acidic, 4.5 < pH < 5.5 (Group II); and weakly acidic, 5.5 < pH < 6.5 (Group III).

2.2. Sample Measurements

Soil pH was determined in a suspension with a soil to solution ratio of 1:2.5 using a pH meter (pH-3c, Shanghai REX Sensor Technology Co., Ltd.; Shanghai, China). Exchangeable H+ (EH+) and exchangeable Al3+ (EAl3+) were measured via the KCl exchange method. Soil organic matter (SOM) was determined via the dichromate method [24].
The Mehlich method [25] was used to measure the negative charge (CEC8.2) and permanent negative charge (CECP). Six portions of 0.5 g of 0.25 mm air-dried samples were weighed into a funnel and moistened with distilled water. Three portions were washed twice with 10 mL of BaCL2-TEA (triethanolamine) buffer; the other three portions were washed 5 times with 10 mL of 0.05 mol/L HCL solution. Then 6 portions samples were washed with 0.3 mol/L BaCL2 solution for 5 times, and rinsed 6 times with distilled water. The above eluent was discarded, then the samples were washed 5 times with 50 mL of 0.3 mol/L CaCL2 solution, and 3 times with 40 mL distilled water. The eluent was collected in a 100 mL volumetric flask. The concentration of Ba2+ in the eluent was determined by spectrophotometer to calculate CEC8.2 and CECP. The variable negative charge (CECV) is the difference between CEC8.2 and CECP.
The AEC was determined via phosphorus adsorption spectrophotometry [25]. The Ca saturated soil samples measured by CECP were dried at 40–45 °C. A certain amount of samples were weighed and placed into 50 mL centrifuge tube, and shaken with 20 mL of 0.006 mol/L Ca(H2PO4)2 for 1 h. The samples were left overnight and then shaken for another hour. After centrifugation (4000 rpm) for 10 min, 5.0 mL of centrifuge solution were absorbed into a 25 mL volumetric flask, then 15.0 mL distilled water and 5.0 mL ammonium vanadate-ammonium molybdate solution were added. After 20 min, the absorbance at 432 nm wavelength was measured with spectrophotometer. The amount of phosphorus adsorbed by soil was calculated as the AEC of soil. The SSA was determined via the methylene blue method [26].

2.3. Clay Minerals Extraction and Determination

Soil samples were treated with H2O2 (35% at 40 °C) to remove SOM and the soil suspension was adjusted to pH 7–8 using 0.5 mol∙L−1 NaOH. The clay fraction smaller than 2 μm was collected via a sedimentation technique according to Stokes’ law using repeated siphoning until the suspension withdrawn was clear [27]. Clay fractions were collected, air dried, and weighed and then ground with an agate mortar to pass through a 300-mesh sieve.
The tested samples were saturated with Mg-glycerol (Mg-gly) and potassium (K). The Mg-gly samples were examined at 25 °C using an X-ray diffractometer (D8 Advance, Bruker, Bremen, Germany). The K-saturated samples were tested at 25 °C and then successively heated to 300 and 550 °C as required, and diffraction scanning was conducted after a constant temperature was maintained for 2 h [28]. The XRD patterns were obtained with CuKα radiation (incident angle = 3°, step size = 0.02°, scanning rate = 4°2θ∙ min−1). The accelerating voltage and applied current were 40 KV and 40 mA, respectively.
The diffraction pattern of clay minerals was obtained by scanning the directional glass slides; clay mineral species were identified based on the clay mineral analysis method of Moore and Reynolds [29] and Środoń [30]. Comparative analysis of the changes of characteristic peaks under different treatments are shown in Table 1. The estimations of their semi-quantitavive proportions were performed as reported by Moore and Reynolds [29], a Gaussian curve with 9-point smoothness, deduction background and peak fitting were utilized for the diffraction pattern of Mg-gly. It calculated the integral area of each mineral diffraction peak and multiplied it by its proportional coefficient (Vermiculite × 2, illite × 3.5, kaolinite × 2, etc.). Then the relative content of each clay mineral was determined according to the percentage of the area of each characteristic peak in the total area [31].

2.4. Statistical Analysis

Microsoft Excel 2017 (Version 2017, Microsoft Corporation, Redmond, WA, USA) was used to initially organize the data. One-way analysis of variance was conducted using the SPSS 22.0 software (Chicago, IL, USA) and used to analyze the differences in the soil properties among different acidification degrees and across the soil layers. The relationship among soil basic properties, surface properties, and clay minerals was analyzed using the Pearson correlation and marked by p < 0.05. All data in the charts are presented as means ± standard deviations. The relationship among basic soil properties, clay minerals, and surface properties was studied using Canoco 5.0 (Microcomputer Power, Huston, TX, USA) for redundancy analysis (RDA) to illustrate the effects of basic soil properties and clay mineral on surface charge properties.

3. Results

3.1. Soil Properties

Soil properties varied with the degree of acidification and depth of the soil profile (Table 2). EH+ values decreased with increasing pH values. Especially in the 0–20-cm layer, EH+ values were significantly different among the three groups, decreasing from 0.55 to 0.13 cmol∙kg−1. EAl3+ values also decreased with increasing pH values. The values of Group I were the highest and were 2.51–3.44, 3.57–7.67, and 7.63–15.27 times higher than those of Groups II and III, respectively. The variations in SOM content and pH value exhibited different trends among the three soil layers. In the 0–20-cm and 20–40-cm layers, the SOM contents of Groups I and II were similar and were significantly different from those of Group III. However, there were no significant differences among the three groups in the 40–60-cm layer. The clay content in the three layers increased with increasing pH values, and the clay contents of Groups II and III in the 0–20-cm layers were similar but differed significantly from those of Group I. There were no significant differences among the other layers.
The soil-layer depth also affected the soil properties. The pH values of soil in the same profile increased with increasing depth, EH+ and EAl3+ values decreased with increasing depth, and SOM content in the 0–20-cm layer was evidently greater compared to that in the 20–40-cm and 40–60-cm layers. The clay content increased with increasing depth.

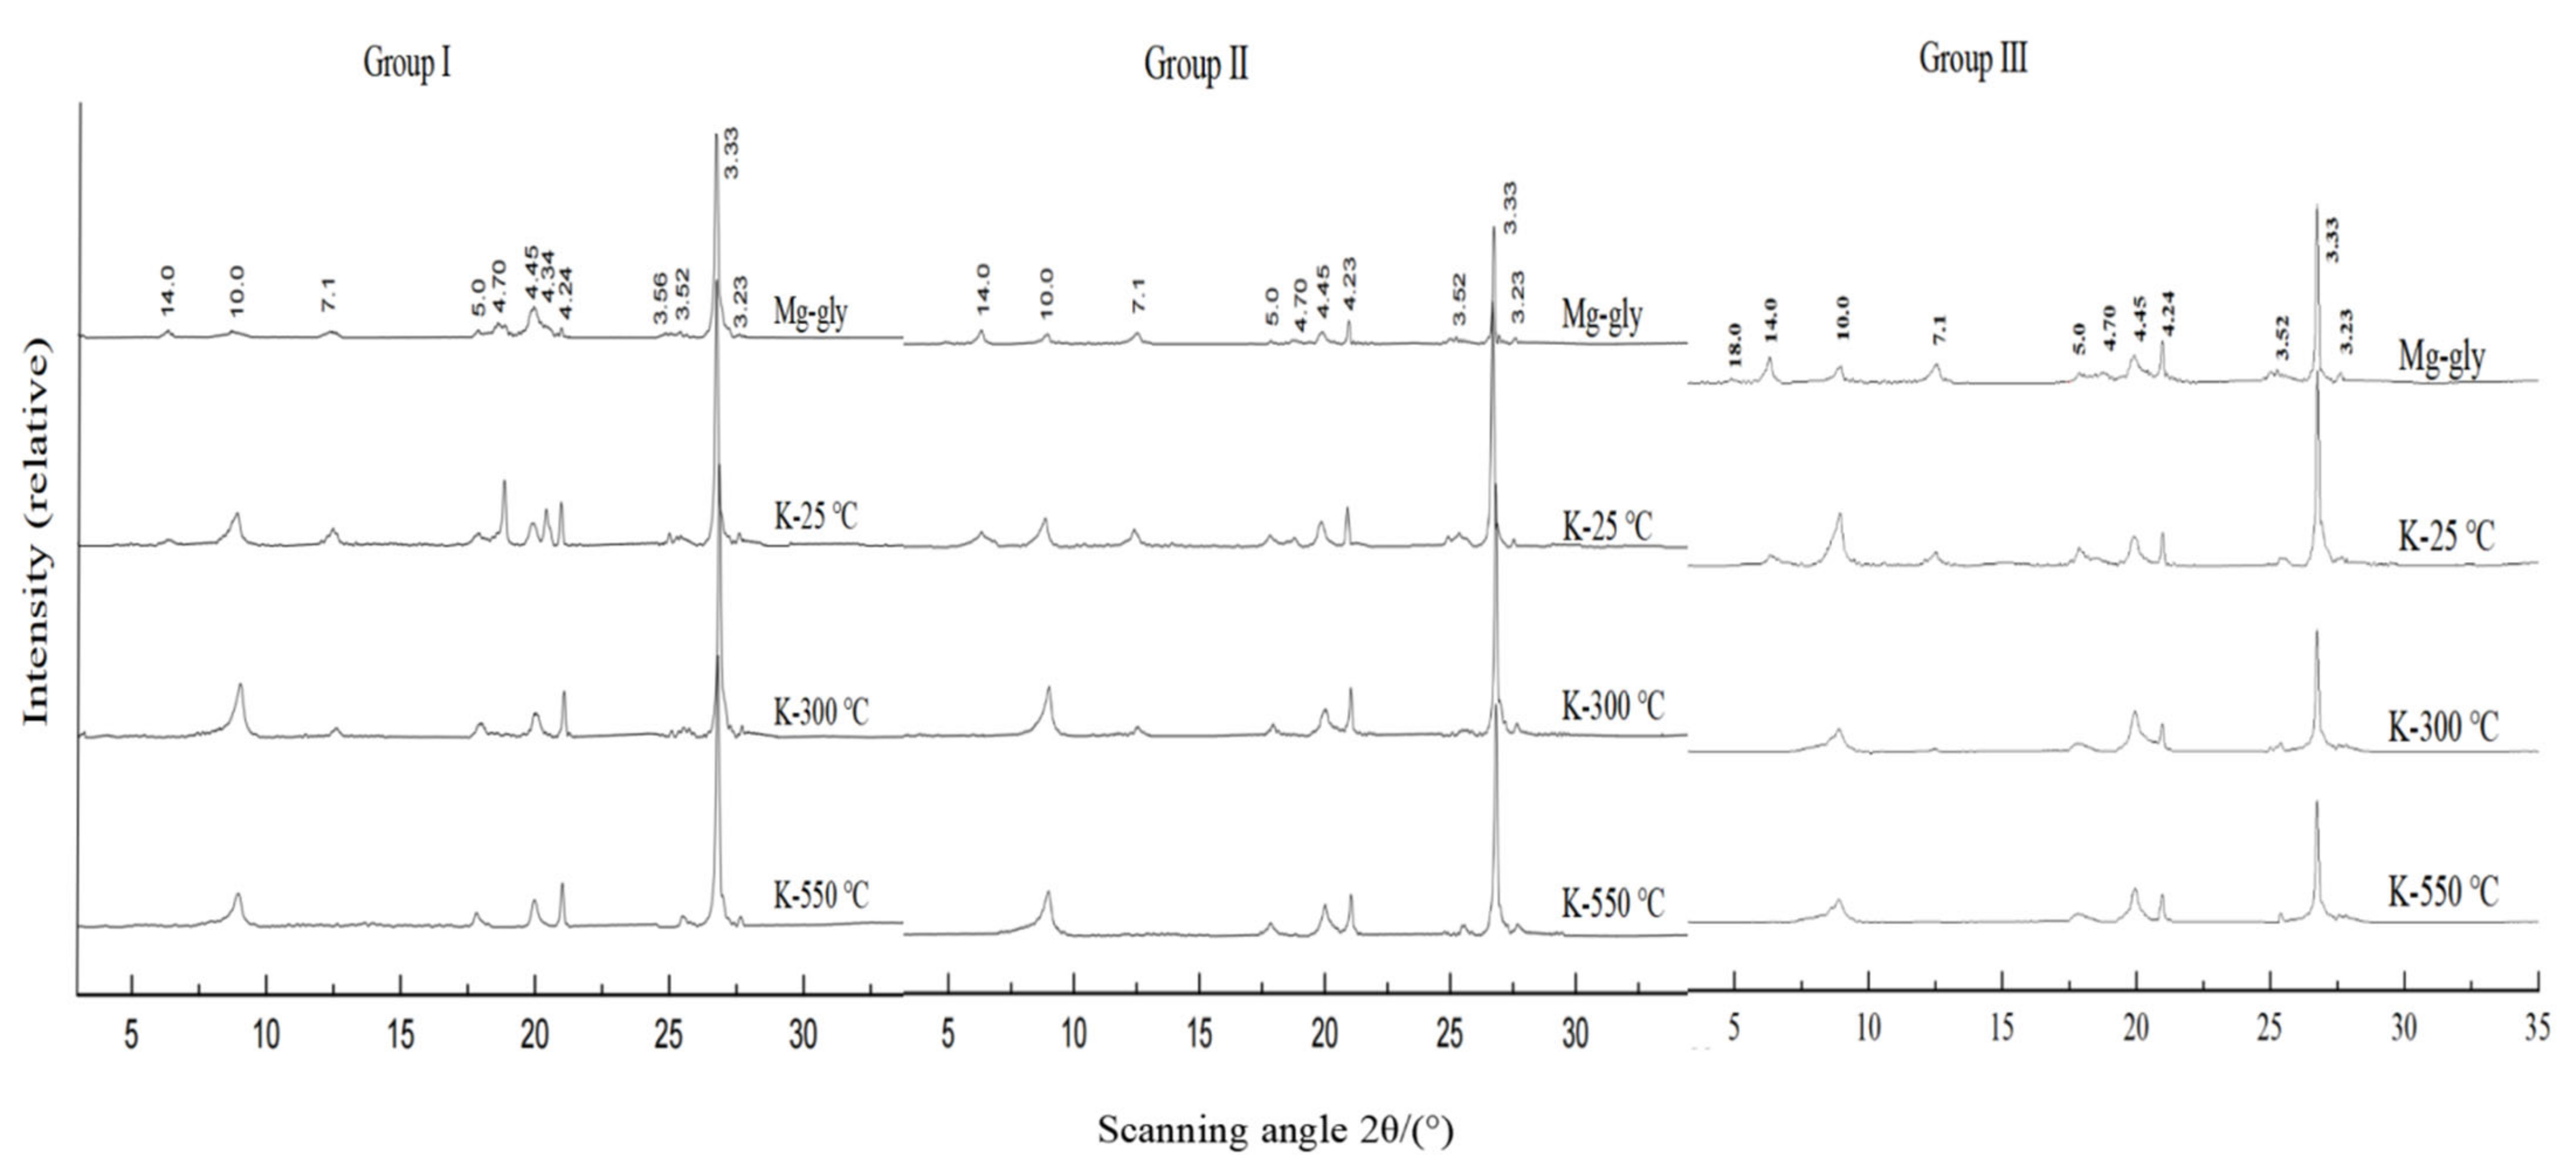
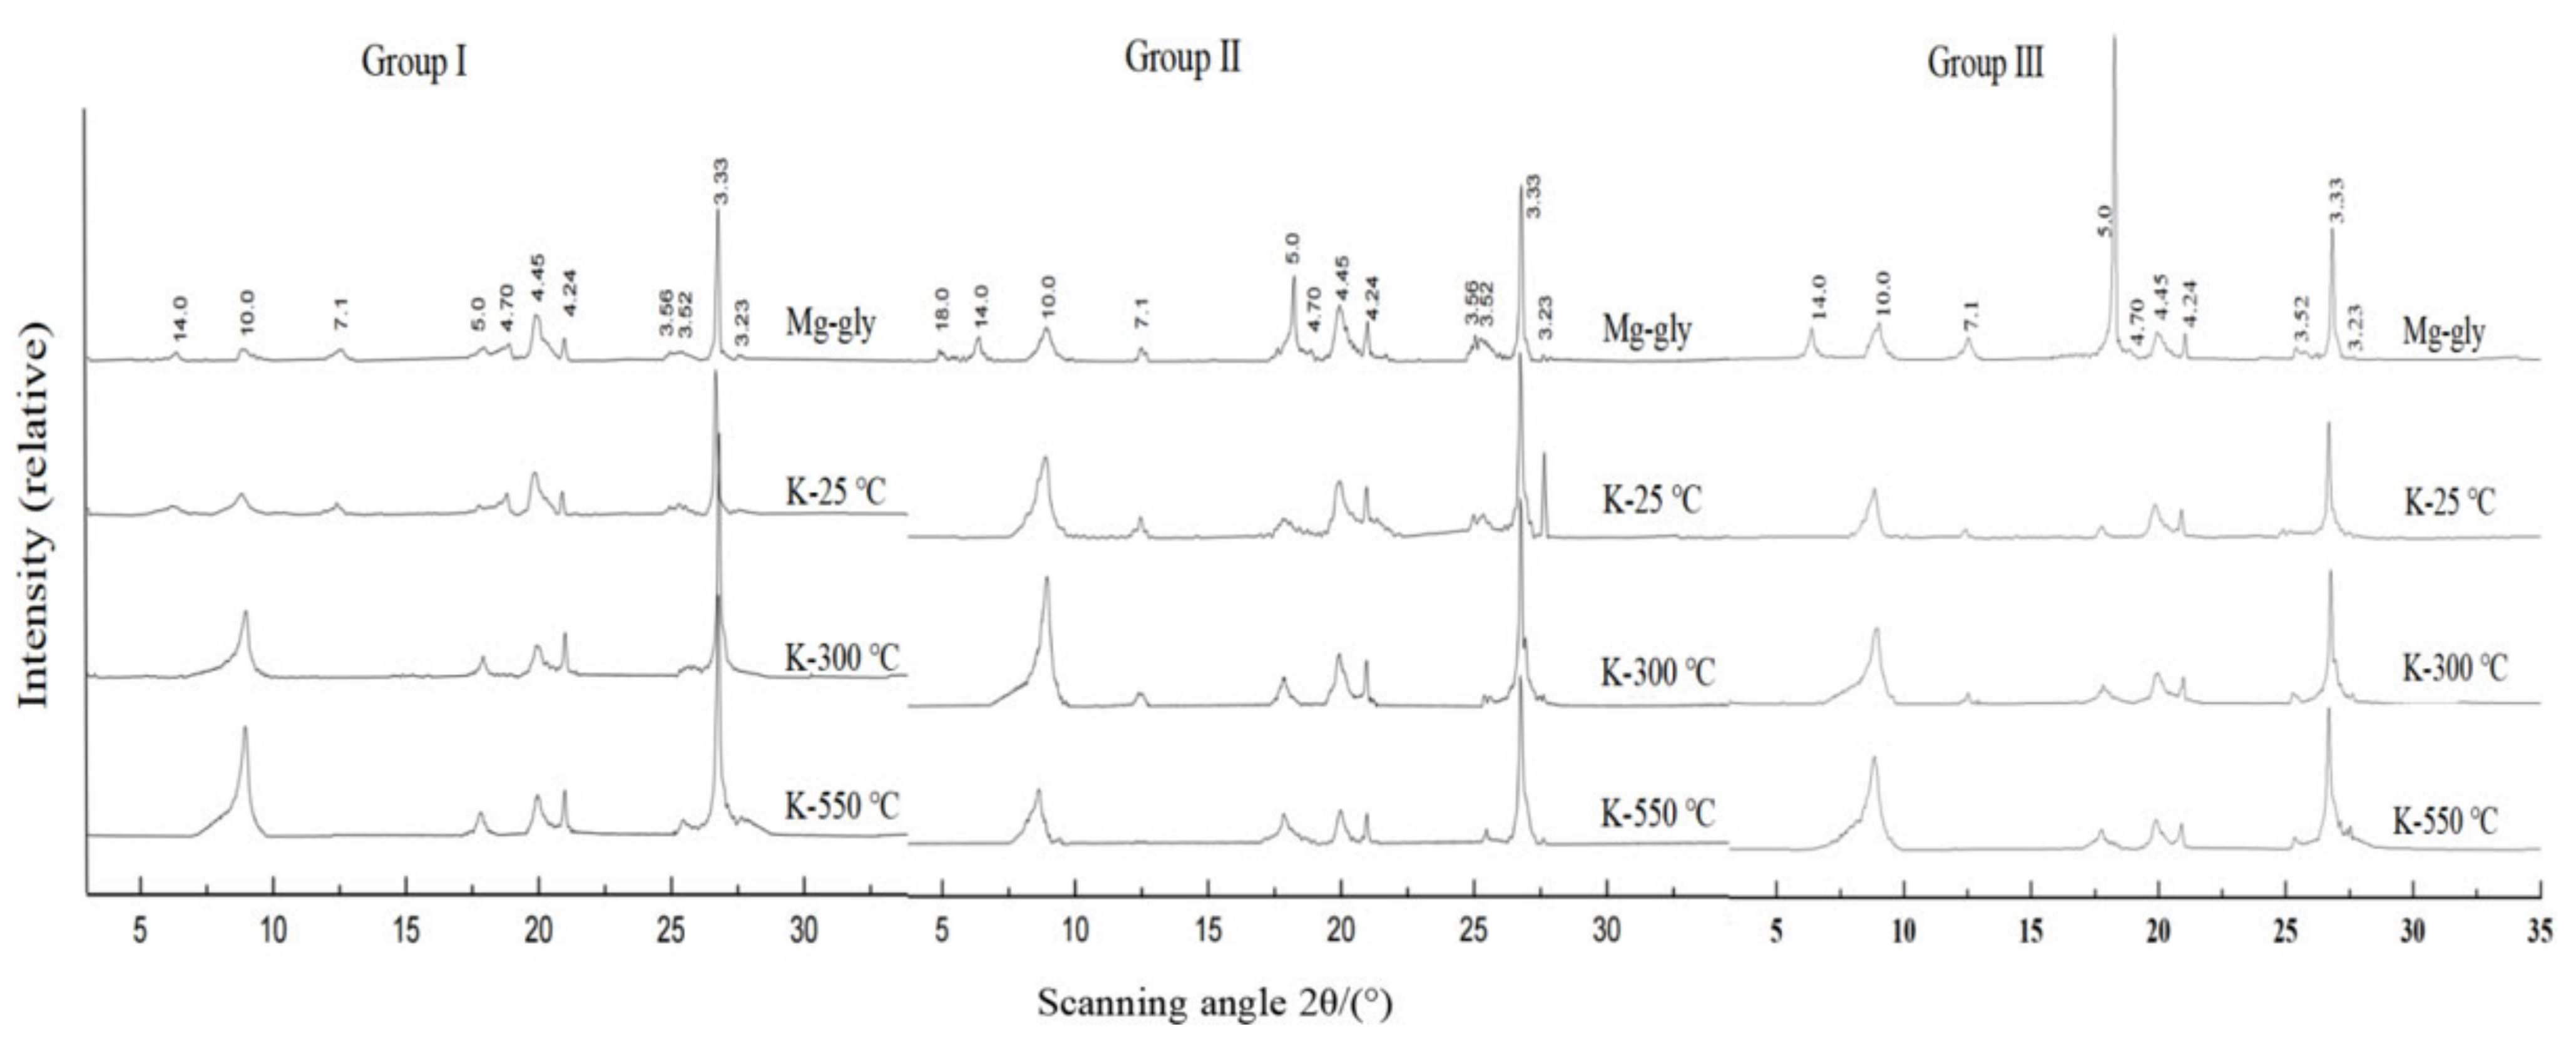
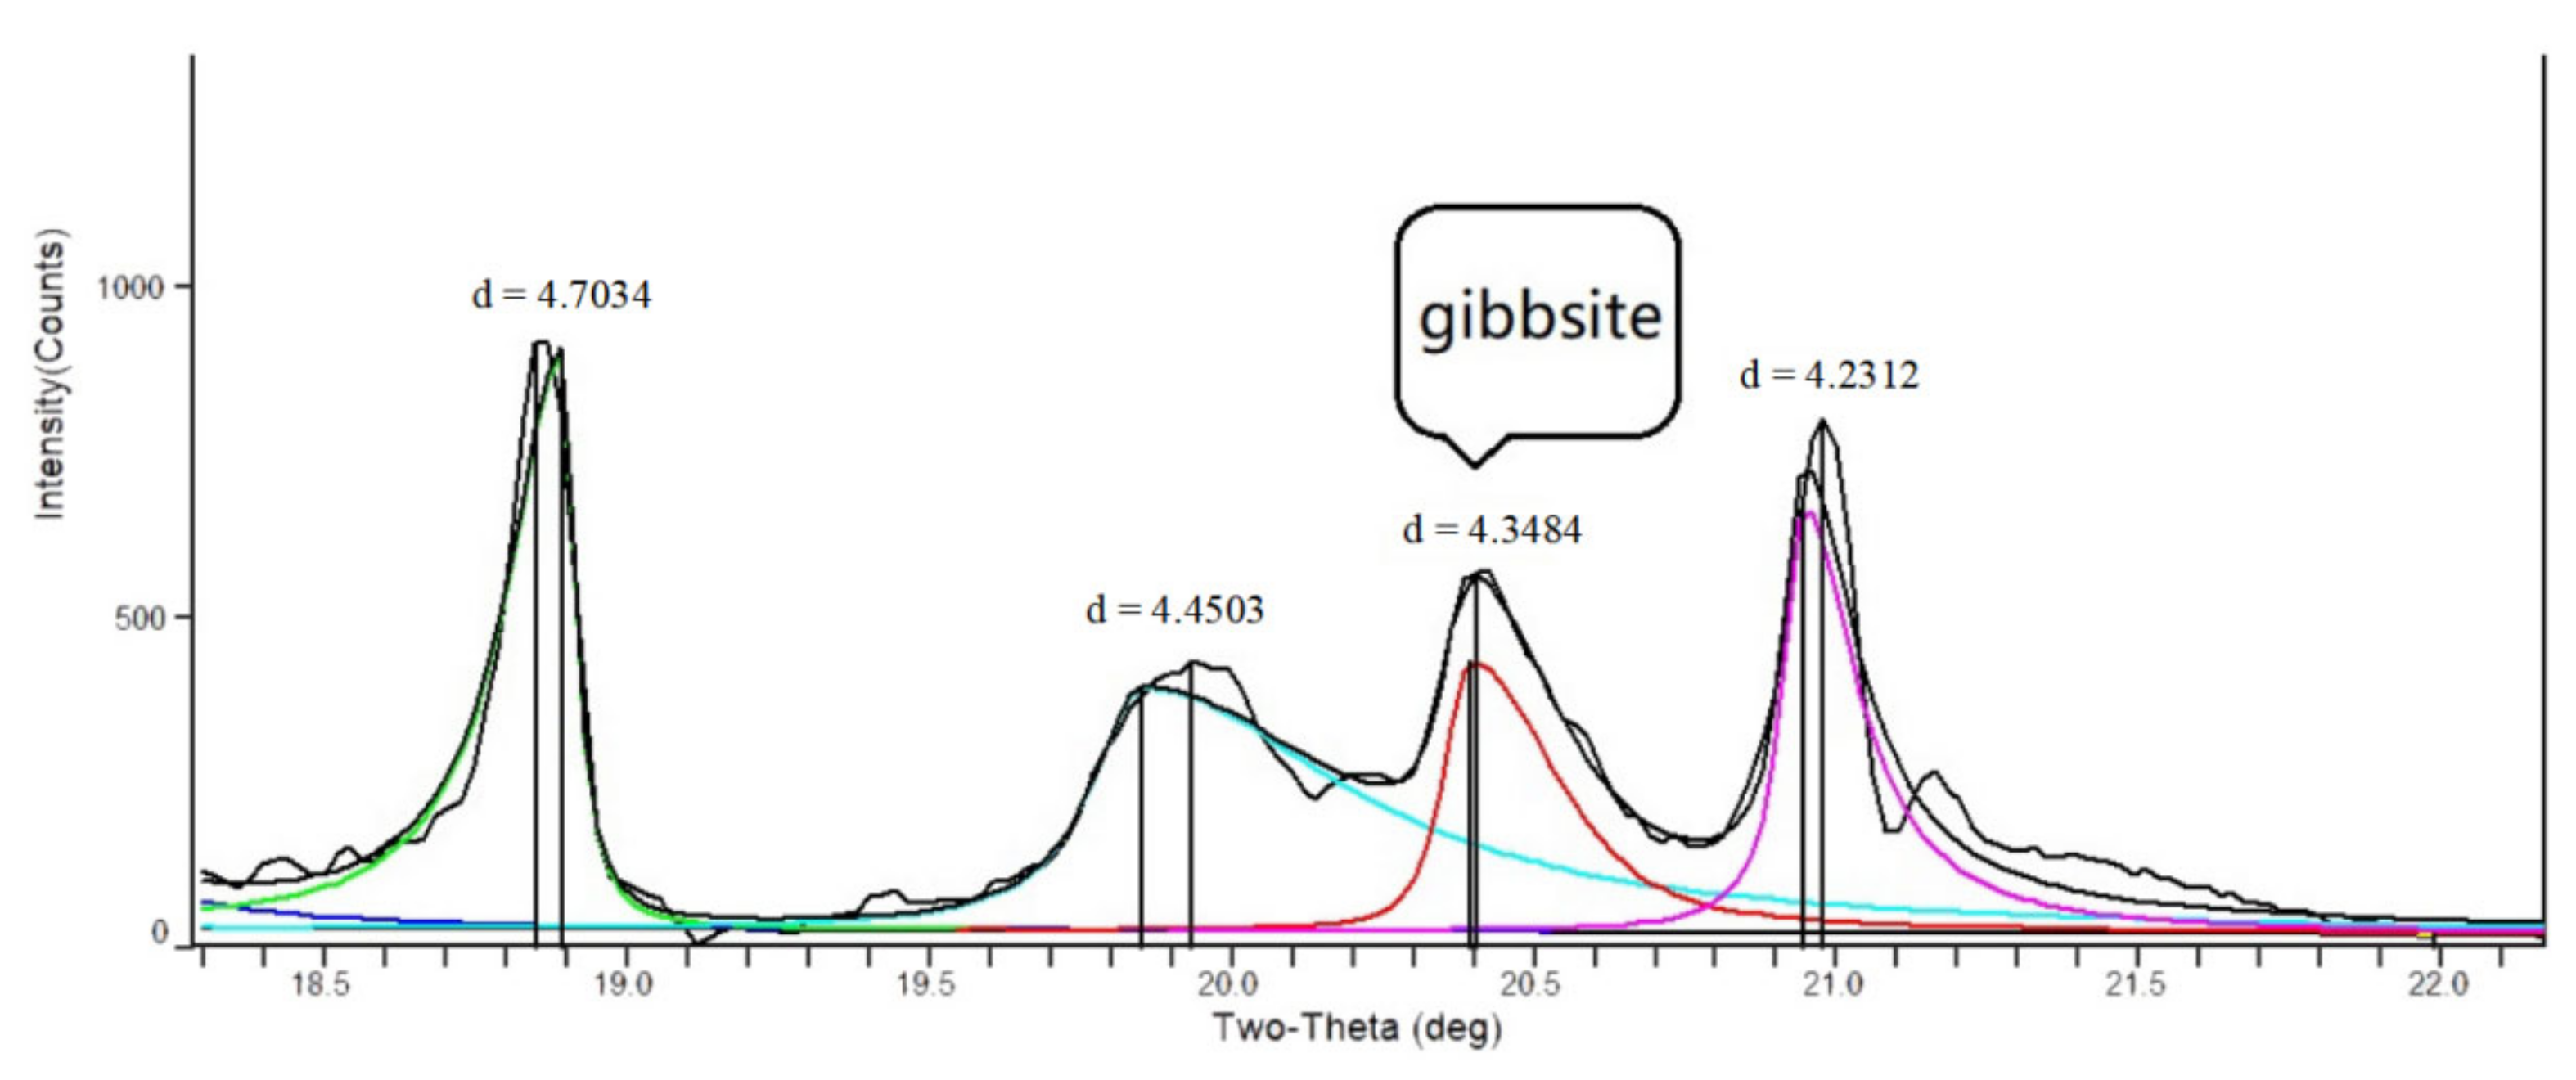
3.2. Species and Content of Clay Minerals

The XRD diffraction patterns of soil clay minerals in the same group were similar, so a representative pattern was selected for analysis in each soil layer and each group (Figure 2, Figure 3 and Figure 4). Ten significant diffraction peaks of the Mg-gly treated oriented glass slides were investigated using diffraction patterns, with d values of 14.2, 10.0, 7.1, 5.0, 4.70, 4.45, 4.24, 3.56, 3.52, and 3.33 Å.
The reflection at 14.2 Å was collapsed to 10.0 Å after K-saturation indicating the presence of vermiculite. The reflections at 10.0, 5.0, 4.45, and 3.33 Å were also observed on the Mg-gly X-ray patterns and remain unchanged after heated K-saturated samples (25, 300 and 550 °C), indicating the presence of illit [26]. As illite is a non-expansive mineral with a strong bonding effect on potassium ions and between crystal layers, it is difficult for other ions to enter the crystal layers. Therefore, illite has excellent stability and the diffraction peak does not disappear after potassium tablets are heated [32]. The diffraction peak at 7.1 Å disappeared after heating at 550 °C and other treatments had no effect, indicating that the peak was kaolinite. The diffraction peak at 4.70 Å was the characteristic spectrum line of chlorite; those at 3.56 and 3.52 Å were bimodal, which were kaolinite and chlorite, respectively [31]. The diffraction peaks at 4.24 and 3.20 Å were not affected by any treatment, indicating the presence of quartz and feldspar [26]. The sample diffraction patterns for sampling depths of 0–20 and 20–40-cm for Group III and 40–60-cm for Group II had peaks at 18.0 Å in the Mg-gly tablet, indicating the presence of montmorillonite. The Mg-gly diffraction patterns of group I samples in 0–20-cm and 20–40-cm layers had 4.34 Å diffraction peaks (Figure 5). They disappeared after heating at 300 °C, indicating that the peaks were gibbsite [33]. Its content was relatively small, 5.92%, 4.96% and 0.00%, respectively. Based on the above comparison and analysis, the clay mineral species were listed in Table 3.
The semi-quantitative analysis results of the main clay minerals are shown in Figure 6; illite, kaolinite, vermiculite, and chlorite were found in the test soils with different acidification degrees, and the contents of these soils varied with these degrees. Montmorillonite was present only in the soil of Group III in the 0–20-cm and 20–40-cm layers and the soil of Group II in the 40–60-cm layer. The illite content in the tested soil at different sampling depths was the highest in each layer, up to approximately 70%, decreasing with increasing pH values. This relationship was enhanced with soil depth (Figure 6a). The kaolinite content increased with increasing pH values, however, the relationship between these properties was not very strong in the three soil layers (Figure 6b). The vermiculite content aslo increased with increasing pH values, this relationship was more significant in 0–20-cm layer (Figure 6c). The relationship of chlorite to pH was not evident (Figure 6d).

3.3. Surface Properties

The total negative charge of test soil CEC8.2, permanent negative charge CECP, and variable negative charge CECV increased with increasing pH values (Figure 7). The relationship between CEC8.2 and pH was significant in all three soil layers (Figure 7a). The relationship between CECP and pH was much stronger in the 20–40-cm and 40–60-cm layers than that in 0–20-cm layer (Figure 7b). In 0–20-cm and 20–40-cm layers, the CECV values of Groups II and III were significantly higher than those of Group I (Figure 7c). The AEC values decreased with increasing pH values in all three soil layers (Figure 7d). The SSA of the soils increased with increasing pH values (Figure 7e). The relationship between CEC8.2 and pH was significant in all three soil layers (Figure 7e). The SSA in the 0–20-cm, 20–40-cm, and 40–60-cm layers increased from 54.96 to 82.85, 47.97 to 84.76, and 54.20 to 102.03 m2∙kg−1, respectively. The relationship of CECV/CEC8.2 to pH was not evident (Figure 7f).

3.4. Correlation of Basic Soil Properties, Clay Minerals, and Surface Properties

The effect of soil basic properties on surface properties and clay minerals was analyzed by redundancy analysis (RDA) (Figure 8). The first and second axes explained 61.18% and 1.05% of the total variations, respectively. The values of SSA, CEC8.2, CECP and illite content had a strong positive correlation with pH values, while the values of AEC, kaolinite and vermiculite content had a significant negative correlation with pH values. The correlation between EH, EAl and these indexes was just opposite. SOM was positively correlated with CECV and CECV/CEC8.2. Soil pH was the main factor affecting surface properties (Table 4). According to importance ranking of basic soil properties on surface properties and clay minerals, the order was pH, clay content, EAl3+, EH+, and SOM.
The effect of soil clay minerals on surface properties was aslo analyzed by RDA (Figure 9). The first and second axes explained 34.70 and 22.80% of the total variations, respectively. The content of illite in the soil had a significant positive correlation with SSA, CEC8.2, and CECP, while kaolinite content had a significant negative correlation with SSA, CEC8.2, and CECP. The content of illite was the main factor affecting the surface properties (Table 5). According to the interpretation rates of clay mineral species to surface properties, the order was illite, chlorite, vermiculite, and kaolinite. Additionally, illite, chlorite, and vermiculite belonged to the 2:1 type clay minerals; this means that content changes of 2:1 type clay minerals had considerable influence on the soil surface properties.
The correlation heatmaps of soil pH, surface properties, and clay minerals (Figure 10) revealed that illite content was positively correlated with pH, CEC8.2, CECP, and SSA but negatively correlated with AEC. The kaolinite content was negatively correlated with the pH values and significantly positively correlated with the AEC values. The vermiculite content had significant negative correlation with pH and SSA values, while chlorite was not significantly correlated with soil properties. The content of clay minerals of various species was not significantly associated with the variable charge CECV.

4. Discussion

Soil acidification refers to the increase in soil H+ and Al3+, which is a natural soil-forming process [34]. Based on the different forms of H+, the acidity of soil can be divided into active acid and exchangeable acid [35]. The intensity of active acid is expressed by pH value, and its change can directly reflect the acidity of soil. Exchangeable acids are acidity caused by EH+ and EAl3+ adsorbed by soil colloids. They are two acids in the same equilibrium system, which can be converted to each other. In this study, EH+ and EAl3+ decreased with increasing pH values, similar results were obtained in earlier studies [36,37,38]. Furthermore, the EAl3+ value in the surface layer (0–20-cm) was close to zero in the red soil at the pH of 5.5 [39]. In this study, for brown soil with pH values between 5.5 and 6.5, the EAl3+ values were 0.54 cmol∙kg−1 (0–20-cm layer), 0.27 cmol∙kg−1 (20–40-cm layer), and 0.15 cmol∙kg−1 (40–60-cm layer). This indicated that for the brown soil in this study, the EAl3+ still existed when the pH was greater than 5.5. This difference may be caused by different soil types and is related to different causes of acidification. Therefore, Al-induced toxicity to plants should not be ignored in the weakly acidified soil due to the presence of EAl3+.
The species and content of clay mineral varied with different acidification degrees. In this study, the clay mineral composition and content varied at different acidification degrees. A small amount of montmorillonite was found only in weakly acidic soils (pH = 5.6–6.5) and gibbsite was found in strongly acidic soils (pH < 4.5). Moreover, although illite, kaolinite, vermiculite, and chlorite were found in soils with different acidification degrees, their contents were different, which attributed to excessive H+ and Al3+ in soil solutions would inevitably affect the structure of the soil clay minerals [35]. Gibbsite is primarily the product of the decomposition and hydrolysis of aluminosilicate minerals, that is, the secondary mineral produced by the weathering of aluminosilicate minerals such as feldspar and clay kaolinite forms of Al2O3 or gibbsite [40]. Generally, tropical and subtropical climates have sufficient water and thermal conditions to favor the formation of gibbsite. For example, in the latosolic clay particles under tropical climates and yellow-red soil under subtropical humid climates in China, there have the phenomenon of Fe and Al enriched as gibbsite [32,41]. Brown soil contains large amounts of illite, as well as gibbsite, which is rare based on the order of soil clay formation. However, the climate of the Jiaodong Peninsula is warm, temperate, and humid, with an average annual relative humidity above 70%. When the soil acidity is strong (pH < 4.5), the clay illite desilication forms Al2O3, namely gibbsite. Al2O3 is generally stable but only exists as complex ions in strongly acidic or basic environments. Therefore, no gibbsite was found in the brown soil with a pH greater than 4.5.
The degree of acidification also affected the conversion of soil clay minerals. The correlation analysis of the relative contents of clay minerals in different acidified soils (Figure 10) revealed that illite was negatively correlated with kaolinite and vermiculite, indicating inter-conversion among illite, kaolinite, and vermiculite in the soil under the acidification conditions. This is consistent with the observations of previous studies on the weathering of clay minerals in the soils of southern China [9]. As the weathering products of primary minerals in specific environments, clay minerals evolved from primary minerals into 2:1 type minerals, then into 1:1 type minerals, and subsequently into Fe and Al oxides. This process typically follows the direction illite → vermiculite → montmorillonite → kaolinite → gibbsite [42]. However, the evolution sequence of clay minerals in different zonal soils is different. In this study, montmorillonite occurred only at pH values greater than 5.5 in the 0–20-cm and 40–60-cm soil layers. Hence, at pH > 5.5, a small amount of illite was converted into montmorillonite and at pH < 5.5, illite was converted into kaolinite or vermiculite. Kaolinite is formed in medium acidic environments and has a high weathering degree. In the acidic environment, illite content decreased because K+ between the illite layers was replaced by other cations, and the kaolinite content increased. When the pH of the soil reached a strongly acidic level (pH < 4.5), clay minerals were completely hydrolyzed to gibbsite. This was consistent with the results of Lindsay [43] that Al in clay mineral kaolinite was activated under strong acidic conditions and then formed gibbsite with H2O. This phenomenon exists even in brown soil.
Clay minerals are the main substrate for soil formation and their mineral types and composition determine other soil properties. The results of RDA (Figure 8 and Figure 9) indicate that the acidification degree (pH) and clay content were the main factors affecting surface properties, especially for CEC8.2, CECP, AEC and SSA as shown in Figure 10. Moreover, the effect of acidification degree on soil surface charge was different in different profiles. The soil surface negative charge CEC8.2 was divided into permanent negative charge CECP and variable negative charge CECV. In the 0–20-cm layer, the CEC8.2 values increased significantly with increasing soil pH, which was responsible for the increased variable charge CECV. This has also been proven by Khawmee et al. and Li et al. [12,13]. The pH values had a significant positive correlation with SOM, which could be inferred that SOM contributed significantly to the negative charge on soil surface. This is consistent with the results of Wisawapipat’s study on soil in Thailand [44]. In 20–40-cm and 40–60-cm layers with less SOM, we found that the pH value had a significant positive correlation with CECP, while the correlation with CECV decreased, indicating that the degree of acidification affected the permanent negative charge. The amount of these negative charges is also an important factor affecting the adsorption of heavy metal ions on the mineral surface. With the increase of the negative charges, the adsorption capacity of heavy metal cations is enhanced. Clay minerals control the migration of metal ions in the soil system through their own charge surface, thus reducing the effectiveness of heavy metals in the soil, which will help to improve the quality of the crops. In addition, the increase of pH will be beneficial to the increase of negative charge and specific surface area, which will increase the absorption of nutrient base ions such as Ca2+, Mg2+, K+, available N, and available P, to improve the fertility of soil [45].
Many studies have indicated that the permanent negative charge does not change with the pH value and that the permanent negative charge of soil primarily originates from the isomorphism substitution; soils containing 2:1 clay minerals have more isomorphic displacement and higher permanent negative charge [13]. The RDA results (Figure 9) and heatmaps (Figure 10) revealed that the contents of illite was the main factor that affected the surface charges CEC8.2 and CECP. Illite belongs to 2:1 clay mineral, which occupies the highest proportion in brown soil. Therefore, the permanent negative charge was not directly affected by pH, but the clay minerals changed from 2:1 to 1:1 under long-term acidification conditions, which led to a decrease in the permanent negative charge. Just as a previous study found that the long-term acidification in tea gardens results in a decrease in the content of 2:1 clay minerals and an increase in the content of 1:1 clay mineral kaolinite, which primarily contributes to the significant decrease in CEC of the soil [9].

5. Conclusions

In this study, the acidification had effect on clay mineral species, content, and surface properties of brown soil. The content of illite in clay particles decreased with the increase of acidification degree, and it was weathered into vermiculite or kaolinite. Kaolinite increased with the increase of acidification degree, and a small amount of gibbsite was formed by complete hydrolysis under the condition of strong acid. Furthermore, with the increase of acidification degree, the CEC8.2, CECP, SSA values of brown soil were lower, but AEC values were higher. The variation of CECP values was caused by the decrease in type 2:1 clay minerals illite with increasing acidification degree. which occupies the highest proportion in brown soil. Our study provides theoretical data on the effect of acidification on clay minerals and surface properties of brown soil, and also give guideline for farmers to take measures, such as the application of organic fertilizers or binding materials to enhance mineral formation, to increase the amount of negative charge that alleviated the soil acidification in the agricultural production.

Author Contributions

N.Y. conducted the experiment, statistical analyses, and wrote the paper; N.G. conducted the experiment and statistical analyses; T.W. conducted the statistical analyses; H.W. provided software; H.P. conducted formal analysis; Q.Y. conducted formal analysis; Y.L. contributed to the study design and reviewed the paper; Y.Z. contributed to the study design and reviewed the paper. All authors have read and agreed to the published version of the manuscript.

Funding

This study was supported by Major Science and Technology Innovation Projects in Shandong Province [grant number 2021CXGC010804]; and the Natural Science Foundation of China [grant number 41771273].

Institutional Review Board Statement

Not applicable.

Informed Consent Statement

No applicable.

Data Availability Statement

All data generated or analyzed during this study are included in this published article.

Conflicts of Interest

The authors declare no competing interests.

References

  1. Raza, S.; Zamanian, K.; Ullah, S.; Kuzyakov, Y.; Virto, I.; Zhou, J. Inorganic carbon losses by soil acidification jeopardize global efforts on carbon sequestration and climate change mitigation. J. Clean. Prod. 2021, 315, 128036. [Google Scholar] [CrossRef]
  2. Tafesse, S.; Braam, C.; Mierlo, B.; Lemaga, B.; Struik, P.C. Association between soil acidity and bacterial wilt occurrence in potato production in Ethiopia. Agronomy 2021, 11, 1541. [Google Scholar] [CrossRef]
  3. Yan, P.; Wu, L.Q.; Wang, D.; Fu, J.; Shen, C.; Li, X.; Zhang, L.P.; Zhang, L.; Fan, L.C.; Han, W.Y. Soil acidification in Chinese tea plantations. Sci. Total. Environ. 2020, 715, 136963. [Google Scholar] [CrossRef] [PubMed]
  4. Yu, Z.P.; Chen, H.Y.; Searle, E.B.; Sardans, J.; Ciais, P.; Peñuelas, J.; Huang, Z.Q. Whole soil acidification and base cation reduction across subtropical China. Geoderma 2020, 361, 114107. [Google Scholar] [CrossRef]
  5. Dong, Y.; Yang, J.L.; Zhao, X.R.; Yang, S.H.; Zhang, G.L. Contribution of different proton sources to the acidification of red soil with maize cropping in subtropical China. Geoderma 2021, 392, 114995. [Google Scholar] [CrossRef]
  6. Hamidi, N.H.; Ahmed, O.H.; Omar, L.; Ch’ng., H.Y. Combined Use of Charcoal, Sago Bark Ash, and Urea Mitigate Soil Acidity and Aluminium Toxicity. Agronomy 2021, 11, 1799. [Google Scholar] [CrossRef]
  7. Mokolobate, M.S. An Evaluation of the Use of Organic Amendments to Ameliorate Aluminum Toxicity and Phosphorus Deficiency in an Acid Soil. Master’s Thesis, University of Natal, Pietermaritzburg, South Africa, 2001. [Google Scholar]
  8. Matocha, C.J.; Grove, J.H.; Karathanasis, T.D.; Vandiviere, M. Changes in soil mineralogy due to nitrogen fertilization in an agroecosystem. Geoderma 2016, 263, 176–184. [Google Scholar] [CrossRef]
  9. Xu, R.K.; Zhao, A.Z.; Jiang, J. Effect of acidification on CEC and mineral compositions of yellow brown soils in tea gardens. Ecol. Environ. Sci. 2011, 20, 1395–1398. [Google Scholar] [CrossRef]
  10. Tao, L.; Wen, X.C.; Li, H.; Huang, C.; Jiang, Y.; Liu, D.; Sun, B. Influence of manure fertilization on soil phosphorous retention and clay mineral transformation: Evidence from a 16-year long-term fertilization experiment. Appl. Clay. Sci. 2021, 204, 106021. [Google Scholar] [CrossRef]
  11. Leng, S.Y.; Song, C.Q. Relationship between soil acidity and surface electrochemical properties. Adv. Earth. Sci. 2013, 28, 1170–1172. [Google Scholar] [CrossRef]
  12. Khawmee, K.; Suddhiprakarn, A.; Kheoruenromne, I.; Singh, B. Surface charge properties of kaolinite from Thai soils. Geoderma 2013, 192, 120–131. [Google Scholar] [CrossRef]
  13. Li, J.Y.; Xu, R.K.; Zhang, H. Iron oxides serve as natural anti-acidification agents in highly weathered soils. J. Soil. Sediment. 2012, 12, 876–887. [Google Scholar] [CrossRef]
  14. Liao, L.X.; Hu, H.G.; He, J.Z. Relationship between surface charge properties of several kinds of zonal soils in central Southern China and pH. Hua Zhong Nongye Xue Xuebao 2005, 24, 29–32. [Google Scholar] [CrossRef]
  15. Antoniadis, V.; Levizou, E.; Shaheen, S.M.; Ok, Y.S.; Sebastian, A.; Baum, C.; Prasad, M.N.V.; Wenzel, W.W.; Rinklebe, J. Trace elements in the soil-plant interface: Phytoavailability, translocation, and phytoremediation-a review. Earth-Sci. Rev. 2017, 171, 621–645. [Google Scholar] [CrossRef]
  16. Yang, W.; Chen, Y.; Yang, L.; Xu, M.Q.; Jing, H.N.; Wu, P.; Wang, P. Spatial distribution, food chain translocation, human health risks, and environmental thresholds of heavy metals in a maize cultivation field in the heart of China’s karst region. J. Soil. Sediment. 2022, 22, 2654–2670. [Google Scholar] [CrossRef]
  17. Zulfiqar, U.; Ayub, A.; Hussain, S.; Waraich, E.A.; Esawi, M.A.; Ishfaq, M.; Ahmad, M.; Ali, N.; Maqsood, M.F. Cadmium Toxicity in Plants: Recent Progress on Morpho-physiological Effects and Remediation Strategies. J. Soil. Sci. Plant. Nutr. 2022, 22, 212–269. [Google Scholar] [CrossRef]
  18. Hao, W.D.; Pudasainee, D.; Gupta, R.; Kashiwabara, T.; Alessi, D.S.; Konhauser, K.O. Effect of acidic conditions on surface properties and metal binding capacity of clay minerals. ACS. Earth. Space. Chem. 2019, 3, 2421–2429. [Google Scholar] [CrossRef]
  19. Wei, H.; Liu, Y.L.; Xiang, H.M.; Zhang, J.E.; Li, S.; Yang, J. Soil pH responses to simulated acid rain leaching in three agricultural soils. Sustainability 2020, 12, 280. [Google Scholar] [CrossRef] [Green Version]
  20. Zhou, J.; Xia, F.; Liu, X.; He, Y.; Xu, J.; Brookes, P.C. Effects of nitrogen fertilizer on the acidification of two typical acid soils in South China. J. Soil. Sediment. 2014, 14, 415–422. [Google Scholar] [CrossRef]
  21. Zhang, Y.; He, X.; Liang, H.; Zhao, J.; Zhang, Y.; Xu, C.; Shi, X.J. Long-term tobacco plantation induces soil acidification and soil base cation loss. Environ. Sci. Pollut. Res. Int. 2016, 23, 5442–5450. [Google Scholar] [CrossRef]
  22. Fu, C.C.; Zhang, H.B.; Chen, T.; Li, L.Z.; Liu, X.H.; Luo, Y.M. Spatial interpolation of orchard soil pH using soil type and planting duration as auxiliary information. Pedosphere 2020, 30, 628–637. [Google Scholar] [CrossRef]
  23. Shen, Y.Y.; Zhang, Z.Q.; Xue, Y. Study on the new dynamics and driving factors of soil pH in the red soil, hilly region of South China. Environ. Monit. Assess. 2021, 193, 304. [Google Scholar] [CrossRef] [PubMed]
  24. Peech, H.M. Hydrogen-Ion Activity, in Methods of Soil Analysis, Part 2: Chemical and Microbiological Properties; American Society of Agronomy and Soil Science Society of America: New York, NY, USA, 1965; pp. 914–926. [Google Scholar]
  25. Di, Z.Z.; Li, X.L. Effect of Phosphorus Applications on Soil charge. Liaoning Agric. Sci. 2014, 5, 12–15. Available online: https://kns.cnki.net/kcms/detail/21.1111.s.20141103.1536.001.html (accessed on 18 December 2022).
  26. Yukselen, Y.; Kaya, A. Comparison of methods for determining specific surface area of soils. J. Geotech. Geoenviron. Eng. 2006, 132, 931–936. [Google Scholar] [CrossRef]
  27. Ndzana, G.M.; Huang, L.; Wang, J.B.; Zhang, Z.Y. Characteristics of clay minerals in soil particles from an argillic horizon of alfisol in central China. Appl. Clay. Sci. 2018, 151, 148–156. [Google Scholar] [CrossRef]
  28. Das, R.; Purakayastha, T.J.; Das, D.; Ahmed, N.; Kumar, R.; Walia, S.S.; Singh, R.; Shukla, V.K.; Yadava, M.S.; Ravisankar, N. Effect of chemical pre-treatment for identifification of clay minerals in four soil orders by X-ray diffraction technique. Natl. Acad. Sci. Lett. 2022, 45, 39–44. [Google Scholar] [CrossRef]
  29. Moore, D.E.; Reynolds, R.C. X-ray Diffraction and the Identification of Clay Minerals, 2nd ed.; Oxford University Press: New York, NY, USA, 1997; p. 378. [Google Scholar]
  30. Środoń, J. Identifification and quantitative analysis of clay minerals. Dev. Clay. Sci. 2006, 1, 765–787. [Google Scholar] [CrossRef]
  31. Ou, J.Q.; Huang, W.H.; Lu, Y.; Li, B.; Yang, Y.; Tang, X.; Jia, C.J.; Qin, H.L. Clay mineral composition and spatial distribution of stagnic anthosols in Guangxi. Soils 2020, 52, 1290–1297. [Google Scholar] [CrossRef]
  32. Barré, P.; Montagnier, C.; Chenu, V.; Abbadie, L.; Velde, B. Clay minerals as a soil potassium reservoir: Observation and quantification through X-ray diffraction. Plant and Soil. 2008, 302, 213–220. [Google Scholar] [CrossRef]
  33. Xu, F.L.; Li, X.Y.; Huang, Q.Y.; Qu, S.X.; Zhou, J.W. Studies on the clay minerals of mountain soils in Hubeil and Hunan Province. I. The clay minerals of soils on the south slop of the Dabie Montains. J. Acta. Pedologica. Sinica. 1990, 27, 293–300. [Google Scholar]
  34. Hao, T.X.; Zhu, Q.C.; Zeng, M.F.; Shen, J.; Shi, X.; Liu, X.j.; Zhang, F.S.; Veries, W. Impacts of nitrogen fertilizer type and application rate on soil acidification rate under a wheat-maize double cropping system. J. Environ. Manag. 2020, 270, 110888. [Google Scholar] [CrossRef] [PubMed]
  35. Sposito, G. The Chemistry of Soils; Oxford University Press: New York, NY, USA, 1989; pp. 209–222. [Google Scholar]
  36. Nkoh, J.N.; Yan, J.; Xu, R.K.; Shi, R.Y.; Hong, Z.N. The mechanism for inhibiting acidification of variable charge soils by adhered Pseudomonas fluorescens. Environ. Pollut. 2020, 260, 114049. [Google Scholar] [CrossRef] [PubMed]
  37. Chen, H.; Ren, H.Y.; Liu, J.J.; Tian, Y.; Lu, S.G. Soil acidification induced decline disease of Myrica rubra: Aluminum toxicity and bacterial community response analyses. Environ. Sci. Pollut. Res. Int. 2022, 29, 45435–45448. [Google Scholar] [CrossRef] [PubMed]
  38. Pan, X.Y.; Baquy, M.A.; Guan, P.; Yan, J.; Wang, R.; Xu, R.K.; Xie, L. Effect of soil acidification on the growth and nitrogen use efficiency of maize in ultisols. J. Soil. Sediment. 2020, 20, 1435–1445. [Google Scholar] [CrossRef]
  39. Liang, W.J.; Cai, Z.J.; Song, F.F.; Zhou, S.W.; Ai, T.C.; Xu, M.G. Relationships between maize growth and the pH, exchangeable aluminum and calcium of red soils derived from different parent materials. J. Agro. Environ. Sci. 2017, 36, 1544–1550. [Google Scholar] [CrossRef]
  40. Kämpf, N.; Scheinost, A.C.; Schulze, D.G. Oxide Minerals in Soils, in Handbook of Soil Sciences: Properties and Processes, 2nd ed.; Taylor & Francis: CRC Press: Boca Raton, FL, USA, 2012; pp. 16–22. [Google Scholar]
  41. Zhang, Z.Y.; Huang, L.; Liu, F.; Wang, M.K.; Ndzana, G.M.; Liu, Z.J. Transformation of clay minerals in nanoparticles of several zonal soils in China. J. Soil. Sediment. 2019, 19, 211–220. [Google Scholar] [CrossRef]
  42. Wilson, M.J. Weathering of the primary rock-forming minerals: Processes, products and rates. Clay. Miner. 2004, 39, 233–266. [Google Scholar] [CrossRef] [Green Version]
  43. Lindsay, W.L. Chemical Equilibria in Soils; John Wiley and Sons Ltd.: New York, NY, USA, 1979; pp. 1–319. [Google Scholar]
  44. Wisawapipat, W.; Kheoruenromne, I.; Suddhiprakarn, A.; Gilkes, R.J. Surface charge characteristics of variable charge soils in Thailand. Soil. Res. 2010, 48, 337. [Google Scholar] [CrossRef]
  45. Zhao, Z.J. Evolution of surface electrochemical properties of typical paddy soils in two climatic zones and their effects on environmental behavior of phosphorus. Master’s Thesis, Nanjing Agricultural University, Nanjing, China, June 2018. [Google Scholar]
Figure 1. Sampling site location of Brown soil in Muping County.
Sustainability 15 00179 g001
Figure 2. Plots exhibiting X-ray diffraction patterns of soil pH range at 0–20-cm soil layer. The pattern of one sample was selected for each group. Mg-gly represents saturated magnesium ions and saturated glycerol. K-25, K-300, and K-550 °C represent saturated potassium ions at 25, 300 and 550 °C after drying, respectively.
Sustainability 15 00179 g002
Figure 3. Plots exhibiting X-ray diffraction patterns of soil pH range at 20–40-cm soil layer. The pattern of one sample was selected for each group. Mg-gly represents saturated magnesium ions and saturated glycerol. K-25, K-300, and K-550 °C represent saturated potassium ions at 25, 300 and 550 °C after drying, respectively.
Sustainability 15 00179 g003
Figure 4. Plots exhibiting X-ray diffraction patterns of soil pH range at 40–60-cm soil layer. The pattern of one sample was selected for each group. Mg-gly represents saturated magnesium ions and saturated glycerol. K-25, K-300, and K-550 °C represent saturated potassium ions at 25, 300 and 550 °C after drying, respective.
Sustainability 15 00179 g004
Figure 5. Characteristic peak of gibbsite in Mg-gly diffraction pattern for samples of Group I. The colored lines are software auto-fitting lines for the peaks.
Sustainability 15 00179 g005
Figure 6. Graphs showing relationships pH between (a) illite; (b) kaolinite; (c) vermiculite; (d) chlorite; ** p < 0.01.
Sustainability 15 00179 g006
Figure 7. Graphs showing relationships pH between (a) the negative charge (CEC8.2); (b) the permanent negative charge (CECP); (c) the variable negative charge (CECV); (d) anion exchange capacity (AEC); (e) Ratio of a variable negative charge to the negative charge (CECv/CEC8.2); (f) specific surface area (SSA); * p < 0.05, ** p < 0.01 and *** p < 0.001.
Sustainability 15 00179 g007
Figure 8. Redundancy analysis (RDA) ordering charts of soil physio-chemical properties, surface properties and clay minerals. 1, 2, and 3 represent Group I, Group II and Group III. The red arrows represent the impact factors.
Sustainability 15 00179 g008
Figure 9. Redundancy analysis (RDA) ordering charts of soil clay minerals and surface properties. I, Ch, V, and K represent illite, chlorite, vermiculite, and kaolinite, respectively. 1, 2, and 3 represent Group I, Group II and Group III. The red arrows represent the impact factors.
Sustainability 15 00179 g009
Figure 10. Heatmap of soil basic properties, surface properties, and clay minerals. Correlations were assessed by Pearson’s correlation coefficient analysis: p < 0.05 (*) and p < 0.01 (**).
Sustainability 15 00179 g010
Table 1. X-ray diffraction characteristics of d001 (Å) of the major clay minerals.
TreatmentMontmorilloniteVermiculiteIlliteKaoliniteChloriteGibbsite
Mg-gly1814.2107.114.24.34
K-25 °C10–1210107.114.24.34
K-300 °C10–1210107.114.2disappear
K-550 °C101010disappear13.8disappear
Mg-gly represents saturated magnesium ions and saturated glycerol. K-25, K-300, and K-550 °C represent saturated potassium ions at 25, 300 and 550 °C after drying, respectively.
Table 2. Basic properties of brown soil under different acidification degrees.
Layer
(cm)
GrouppH ValueEH+
(cmol∙kg−1)
EAl3+
(cmol∙kg−1)
SOM
(g∙kg−1)
Clay
(%)
0–20Group I3.98 ± 0.20 Ba0.55 ± 0.03 Aa1.86 ± 0.03 Aa10.48 ± 1.25 Ab4.61 ± 0.80 Bb
Group II4.78 ± 0.08 Bb0.30 ± 0.04 Ab0.74 ± 0.06 Aab11.93 ± 0.76 Ab7.51 ± 1.13 Aa
Group III5.76 ± 0.24 Bc0.13 ± 0.03 Ac0.54 ± 0.13 Aab15.83 ± 0.85 Aa8.07 ± 0.57 Aa
20–40Group I4.21 ± 0.15 Ba0.37 ± 0.04 ABa2.07 ± 0.18 Aa4.25 ± 0.33 Bb6.08 ± 0.90 ABb
Group II5.95 ± 0.22 Ab0.28 ± 0.01 Aa0.58 ± 0.03 Aab4.97 ± 1.07 Bb7.68 ± 0.82 Aab
Group III6.79 ± 0.02 Ac0.12 ± 0.01 Ab0.27 ± 0.05 Bb7.66 ± 2.24 Ba8.41 ± 0.66 Ba
40–60Group I5.34 ± 0.08 Aa0.28 ± 0.04 Ba2.29 ± 0.47 Aa6.82 ± 0.69 Ba7.52 ± 1.17 Aa
Group II6.23 ± 0.23 Ab0.21 ± 0.02 Ba0.30 ± 0.05 Bb6.13 ± 0.42 Ba8.29 ± 1.91 Ba
Group III7.08 ± 0.02 Ac0.06 ± 0.01 Bb0.15 ± 0.02 Bb5.02 ± 0.22 Bab8.79 ± 0.15 Ba
The results are the mean values (n = 3) with standard deviations. Lower case letters after values indicate the significance at p < 0.05 in the same soil layer for different groups; upper case letters indicate the significance at p < 0.05 for the same group among different soil layers. Group I: strongly acidic (pH < 4.5), Group II: acidic (4.5 < pH < 5.5), Group III: weakly acidic (5.5 < pH < 6.5).
Table 3. The major clay minerals of soil with different acidification degrees at three sampling depths.
Layer (cm)GroupMontmorilloniteVermiculiteIlliteKaoliniteChloriteGibbsite
0–20Group I-+++++
Group II-++++-
Group III+++++-
20–40Group I-+++++
Group II-++++-
Group III+++++-
40–60Group I-++++-
Group II+++++-
Group III-++++-
“+”: detected; “-”: not detected.
Table 4. Importance ranking and significance test results of interpretation of soil properties factors.
NameImportance RankingExplanatory Quantity (%)Pseudo-Fp
pH150.225.20.002
Clay25.83.20.088
EAl33.82.20.128
EH42.01.10.302
SOM50.70.40.56
Table 5. Importance ranking and significance test results of interpretation of soil soil clay minerals and surface properties.
NameImportance RankingExplanatory Quantity (%)Pseudo-Fp
I124.07.90.018
Ch26.72.30.158
V32.91.00.368
K41.00.30.586
I, Ch, V, and K represent illite, chlorite, vermiculite, and kaolinite, respectively.
Disclaimer/Publisher’s Note: The statements, opinions and data contained in all publications are solely those of the individual author(s) and contributor(s) and not of MDPI and/or the editor(s). MDPI and/or the editor(s) disclaim responsibility for any injury to people or property resulting from any ideas, methods, instructions or products referred to in the content.

