Article

An Optimized Machine Learning Approach for Forecasting Thermal Energy Demand of Buildings

1
Department of Architecture, Abhar Branch, Islamic Azad University, Abhar 4561934367, Iran
2
Department of Architecture, Eram Institute of Higher Education, Shiraz 7195746733, Iran
3
Faculty of Architecture and Urban Planning, Department of Architecture, Islamic Azad University of Central Tehran Branch, Tehran 1955847781, Iran
4
Department of Architecture, Built Environment and Construction Engineering, Polytechnic Milan, 20133 Milan, Italy
5
Civil Engineering Department, College of Engineering, Prince Sattam bin Abdulaziz University, Alkharj 16273, Saudi Arabia
6
Department of Civil Engineering, McMaster University, Hamilton, ON L8S 4L8, Canada
*
Author to whom correspondence should be addressed.
Sustainability 2023, 15(1), 231; https://doi.org/10.3390/su15010231
Submission received: 16 November 2022 / Revised: 9 December 2022 / Accepted: 13 December 2022 / Published: 23 December 2022

Abstract

:
Recent developments in indirect predictive methods have yielded promising solutions for energy consumption modeling. The present study proposes and evaluates a novel integrated methodology for estimating the annual thermal energy demand (DAN), which is considered as an indicator of the heating and cooling loads of buildings. A multilayer perceptron (MLP) neural network is optimally trained by symbiotic organism search (SOS), which is among the strongest metaheuristic algorithms. Three benchmark algorithms, namely, political optimizer (PO), harmony search algorithm (HSA), and backtracking search algorithm (BSA) are likewise applied and compared with the SOS. The results indicate that (i) utilizing the properties of the building within an artificial intelligence framework gives a suitable prediction for the DAN indicator, (ii) with nearly 1% error and 99% correlation, the suggested MLP-SOS is capable of accurately learning and reproducing the nonlinear DAN pattern, and (iii) this model outperforms other models such as MLP-PO, MLP-HSA and MLP-BSA. The discovered solution is finally expressed in an explicit mathematical format for practical uses in the future.

1. Introduction

Having an approximation of thermal energy demand is an essential task towards achieving optimal control, proper fault diagnosis and developing intelligent systems in buildings [1]. Generally, investigating the energy performance of buildings is a difficult task, due to the influence of a large number of parameters (e.g., building structure and characteristics, occupancy, etc.) [2]. So far, these complexities have driven engineers to use sophisticated packages for simulating a building, and calculating its energy demand [3].
In a more general sense, recent developments in technology have widely and positively affected many fields of science [4,5,6]. Civil and environmental engineering are among these fields. The building sector comprises several aspects; each needs to be managed in an appropriate time [7,8]. These efforts focus on domains like cost and time efficiency [9], safety of systems [10], material improvement [11,12], etc. Likewise, energy analysis has been of great interest and experts have tried to employ the latest technologies in this domain [13,14].
Thermal energy demand can be represented by a combination of cooling and heating loads (CL and HL), which are directly contributed by heating, ventilation, and air conditioning (HVAC) systems [15] in modern buildings. Depending on the environmental conditions, regulations have been defined over the world for addressing the building properties [16]. Various engineering efforts have focused on developing evaluative techniques for optimizing the performance of these systems [17,18]. However, earlier technologies and conventional techniques used for energy performance analysis are associated with difficulties concerning implementing the methods, the amount of required data and computational costs, as well as lack of generalizability [19]. Hence, machine learning paradigms are broadly regarded as alternative models in this field. Having the capability of nonlinear analysis, these models are able to predict the energy-related parameters from a set of relevant key factors [20,21]. For instance, Huang et al. [22] developed an ensemble of extreme learning machine, extreme gradient boosting, multiple linear regression with support vector regression in order to approximate the energy demand for residential buildings.
Energy scientists have explored prominent predictive algorithms that are based on specific theories like fuzzy [23], least square [24], and nearest-neighbor [25] theories. The primary objective of these models was attaining more reliable predictions of energy parameters compared to empirical approaches [26]. Among several available types of machine learning models, artificial neural networks (ANNs) have gained increasing attention for purposes including energy performance explorations [21,27].
Different types of ANNs (e.g., multilayer perceptron (MLP) [28], general regression neural network (GRNN) [29], and radial basis function (RBF) [30]) have properly served for predicting energy-related parameters. Using these tools has also provided significant advantages over traditional approaches. In a study by Turhan et al. [31], a simulation package named KEP-IYTE-ESS was compared with an ANN in predicting the heat load of residential building in Izmir, Turkey. While the efficiency of both approaches was confirmed by good results, ANN emerged with advantages like simplicity, fast computations, and dealing with limited data.
It is true that diverse parameters of energy have been promisingly simulated with conventional machine learning models, but their incorporation with metaheuristic optimization algorithms is a popular strategy that has been recently used for developing newer and better intelligent models [32,33]. In such hybridizations, the main effect of metaheuristic algorithms is preventing computational deficiencies like local minima from occurring when training ANNs [34]. For instance, Zhao and Foong [35] studied the prediction of electrical power output of combined-cycle power plants based on the ambient temperature, exhausted vacuum, atmospheric pressure, and relative humidity influence. In this way, they incorporated an electrostatic discharge algorithm with an ANN.
Zheng et al. [36] investigated the suitability of a metaheuristic optimizer called shuffled complex evolution (SCE) to tune an ANN in predicting the CL of residential buildings. With around 92% correlation, the proposed model was introduced as a promising predictor. Lin and Wang [37] executed the same methodology with ANN and a water cycle algorithm (WCA) to create an optimized double-target MLP. The suggested model predicted simultaneously the HL and CL in residential buildings with relative errors between 5.8 and 7%. Also, it was found to be more accurate than the hybrid of other algorithms such as equilibrium optimizer, slime mould algorithm, multi-tracker optimization algorithm, electromagnetic field optimization, and multi-verse optimizer. Likewise, Le et al. [38] conducted a comparison and proved the higher efficacy of genetic algorithm (GA) versus among an artificial bee colony (ABC), imperialist competitive algorithm (ICA), and particle swarm optimization (PSO) for the HL prediction. Further applications of metaheuristic-optimized techniques can be sufficiently found in the literature [39,40,41].
Based on the above explanations, the energy sector has been so far well incorporated with the most recent technological developments (software, coding, etc.). Hence, keeping this relationship updated is necessary for increasing the efficiency of energy simulations [42], and applying the findings to real-world projects towards minimizing the cost and computational efforts required for proper designs. Following previous studies that have used previous generations of metaheuristic techniques (e.g., PSO, GA, etc.), this research proposes a novel hybrid technique for analyzing the annual thermal energy demand (DAN) of buildings. For this aim, an MLP ANN [43] is synthesized with a powerful metaheuristic algorithm called symbiotic organism search (SOS) [44]. The hybrid of MLP-SOS predicts the DAN by receiving the characteristics of the building. The major contribution of the SOS algorithm to the mentioned problem can be described by finding the optimal relationship between a large number of key factors and the DAN. Through an optimization process, this algorithm can be applied also to other parts of energy performance analysis, and it can yield fast, accurate, and cost-effective substitutes to laborious and time-consuming traditional solutions.
Moreover, to satisfy the validation of the model, a comparative assessment of the SOS is considered with three capable algorithms, namely, political optimizer (PO), harmony search algorithm (HSA), and backtracking search algorithm (BSA). The models are compared and the best one is introduced in the form of an explicit mathematical equation. The study continues with introducing the used data and employed methodology in Section 2, presenting and discussing the findings in Section 3, and finally, conclusions as Section 4.

2. Materials and Methods
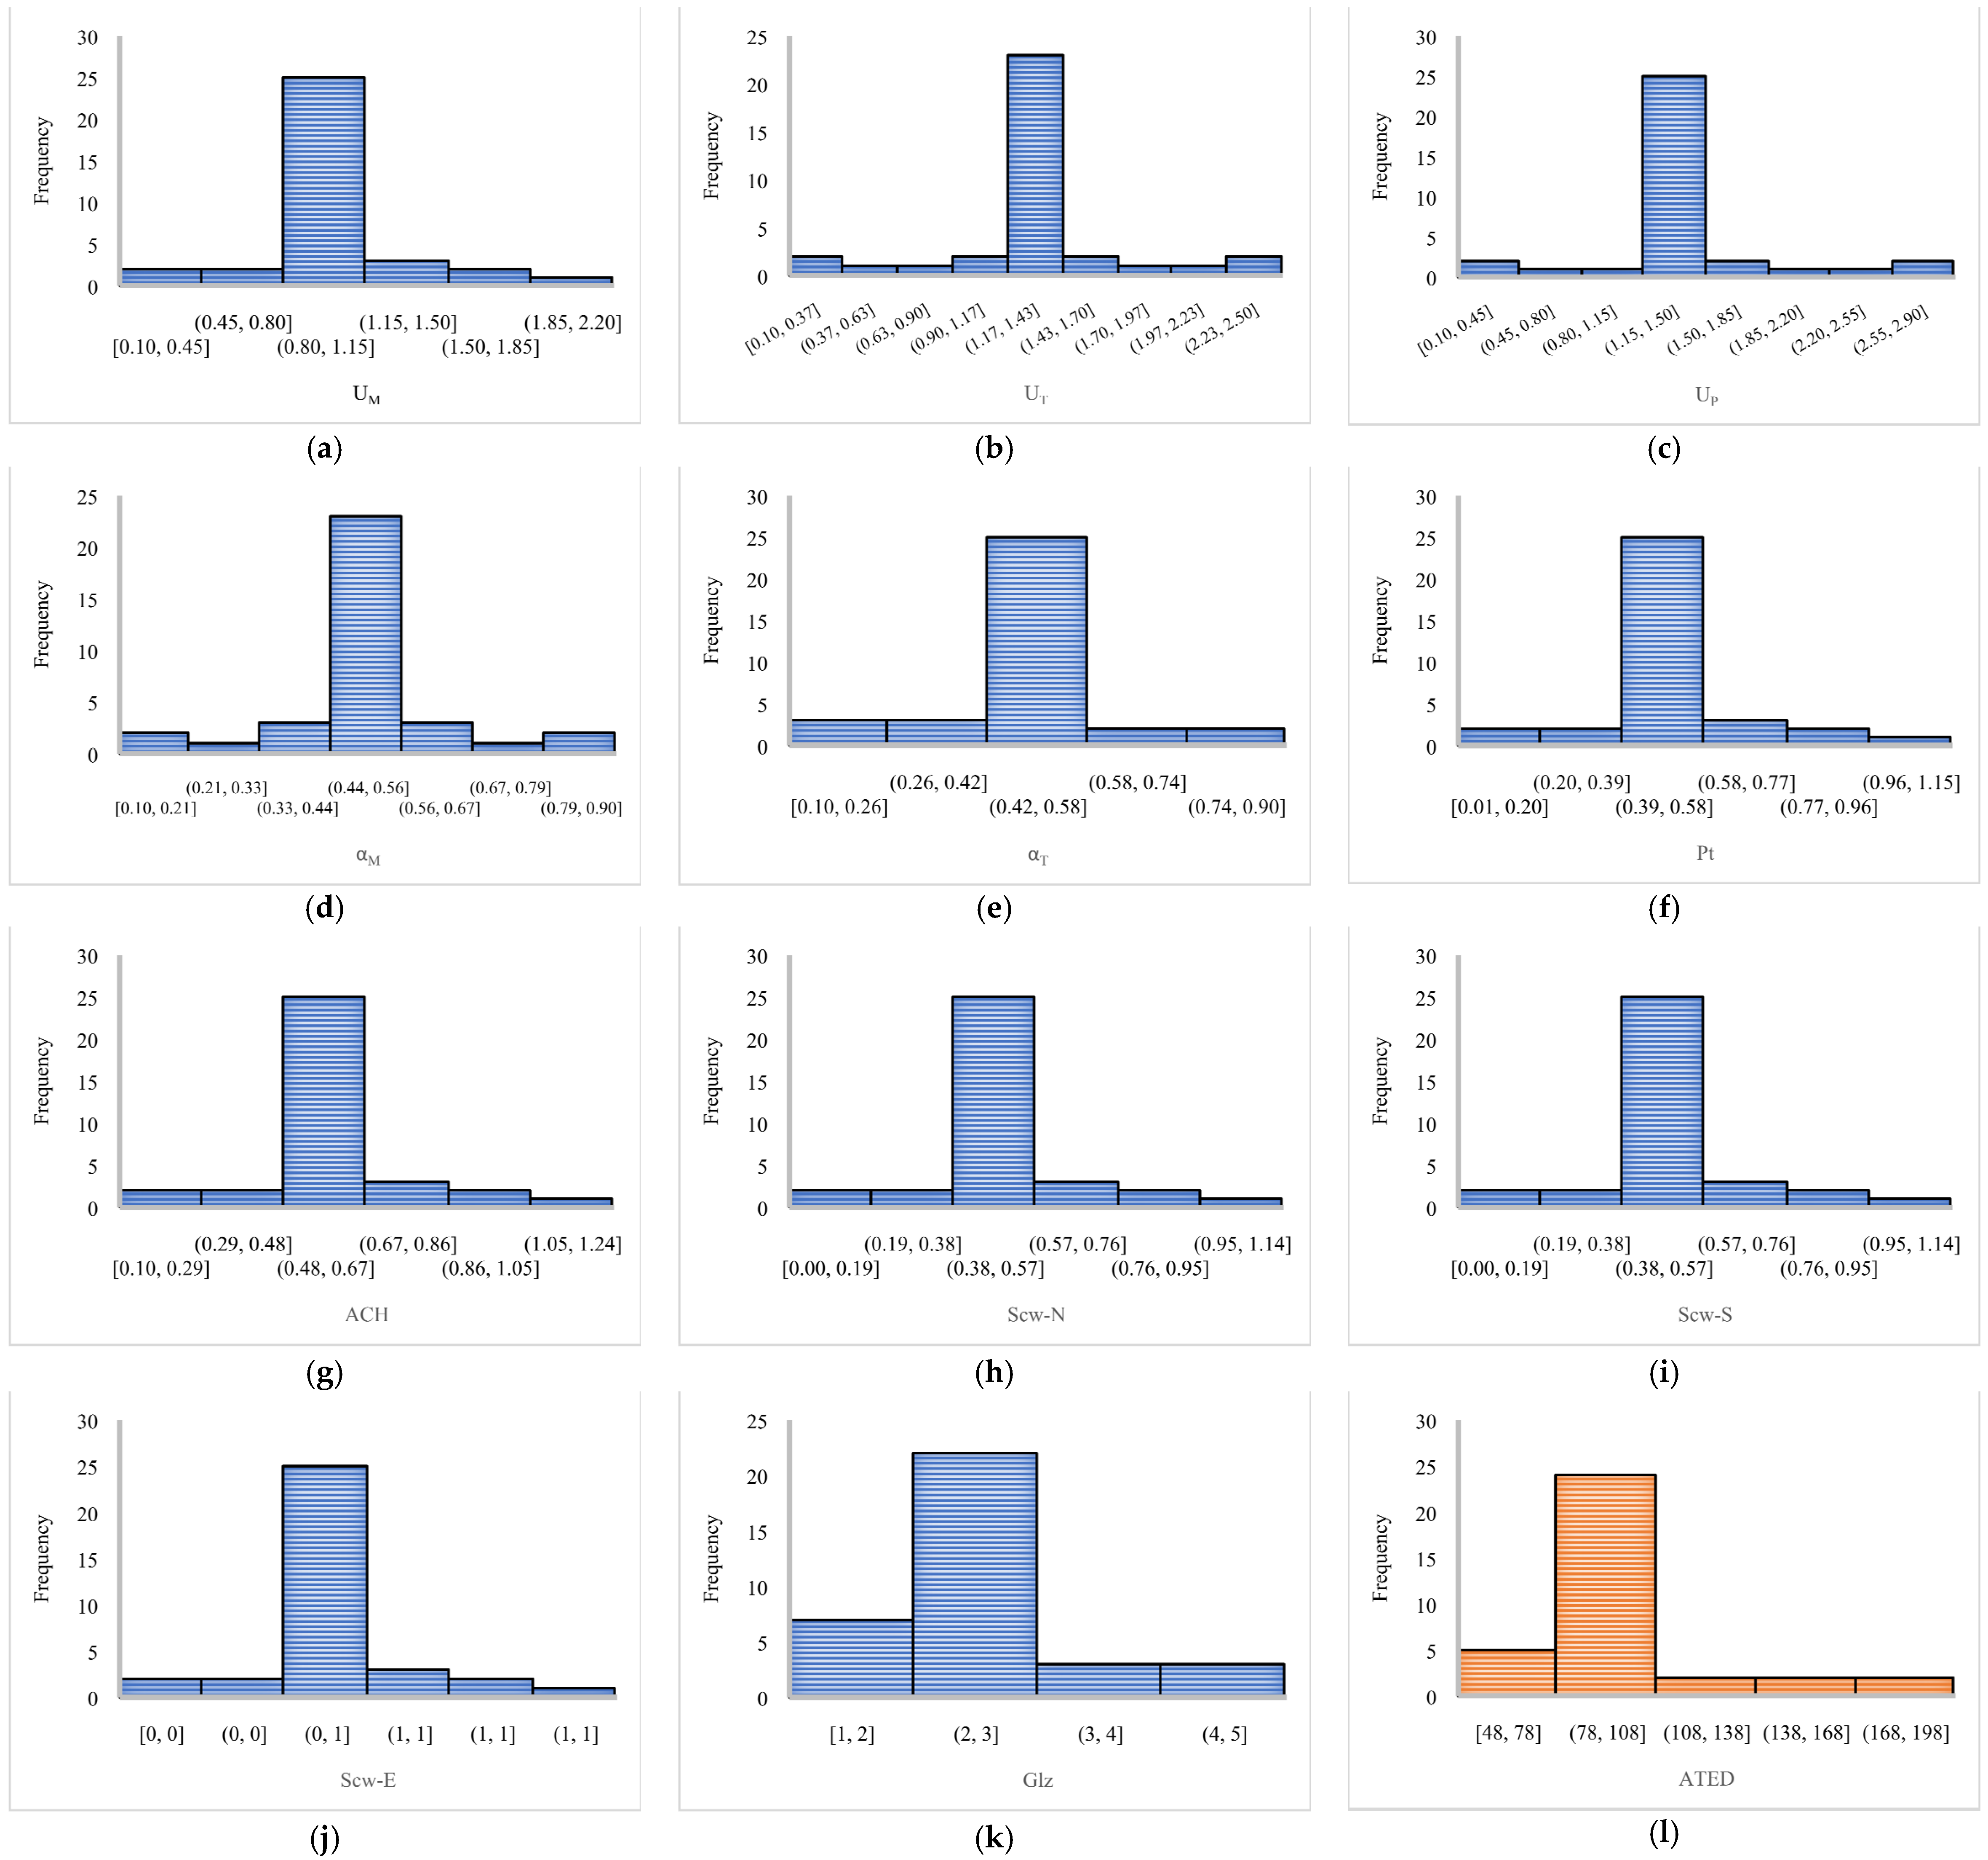
2.1. Used Dataset

To have a proper implementation of the intelligent models, exposing a valid dataset is crucial. When it comes to machine learning, the model digs the data to establish a relationship between the to-be-predicted parameter(s) and key factors affecting it.
As for this study, the to-be-predicted parameter is DAN, assumed as a function of eleven key factors including UM (transmission coefficient of the external walls), UT (transmission coefficient of the roof), UP (transmission coefficient of the floor), αM (solar radiation absorption coefficient of the exterior walls), αT (solar radiation absorption coefficient of the roof), Pt (linear coefficient of thermal bridges), ACH (air change rate), Scw-N (shading coefficient of north-facing windows), Scw-S (shading coefficient of south-facing windows), Scw-E (shading coefficient of east-facing windows), and Glz (glazing).
This dataset was developed by Chegari et al. [45] and is available as an appendix of this paper. Its characteristics and parameters are extensively explained in the reference paper [45]. The dataset was used in its original format (e.g., without any normalization, etc.). The only performed modification was related to quantifying the glazing; for instance, G5 was replaced with 5).
Table 1 expresses the statistical characteristics of the twelve parameters that exist in the dataset. Also in Figure 1, the histogram of the data is shown. As is known, a histogram gives valuable information regarding the distribution of data and their frequencies.

2.2. General Scheme

Figure 2 shows the general scheme of the study. Once the data are prepared, four algorithms are combined with the MLP to create hybrids of MLP-PO, MLP-HSA, MLP-BSA, and MLP-SOS. The optimization is then executed, and the best response is found for each model. Accordingly, the models predict the DAN and their prediction is evaluated by statistical indicators. After comparison and selecting the best model, a mathematical formula is derived in the final step.

2.3. Employed Algorithms

2.3.1. MLP

This model is known as a powerful ANN predictor. The reason for the popularity of the MLP is doing the simulation of many engineering parameters with great accuracy [46,47,48]. Having the ability of nonlinear exploration of a given dataset, this model creates and tunes a set of mathematical calculations to achieve the required knowledge. As Figure 3 depicts the network used in this study, MLPs are a feed-forward network wherein the progress is from left to right, i.e., from one input layer to one or more middle layers (a.k.a., hidden layer), and ends up with one output layer [49,50]. In this work, having eleven input parameters (i.e., UM, UT, UP, αM, αT, Pt, ACH, Scw-N, Scw-S, Scw-E, and Glz), we have eleven input neurons plus one output neuron for releasing the response (i.e., the DAN). In the middle of these two layers, there is a hidden layer with three neurons. Hence, the ANN can be represented as MLP (11, 3, 1).
The general form of equations being formed in the MLP is as follows:
Output = af (Weight × Input + bias)
where af () is an activation function. Such calculations may take place several times to release the main output from the output layer. During the adjustment of the network (called training), proper values are assigned to Weight and bias all over the network. Besides, activation function could be selected from the available ones such as Tansig and Logsig in Matlab [51,52].

2.3.2. Metaheuristic Algorithms

The name PO connotes a recent metaheuristic technique developed by Askari et al. [53]. It is a simulation of political interactions that are implemented in some stages including constituency allocation, election campaign, and parliamentary affairs. The candidate solutions of the PO deal with two roles from political parties and constituencies and update themselves by following elite members. The algorithm benefits from an innovative optimization strategy, namely, recent past-based position updating to perform the optimization with higher efficiency.
Geem et al. [54] proposed the HSA. As the name implies, the basis of this algorithm is the effort of a player to improvise an instrument. In this sense, he/she aims at creating the highest possible harmony. Like many other algorithms, the HSA starts with a stochastic solution in the harmony memory, and afterwards, these solutions are updated and improvised to improve. Having a pool for storing the solutions, the HSA’s strategy resembles genetic algorithm in treating earlier findings.
The BSA was first designed by Civicioglu [55]. To achieve the optimal solution in each search, the algorithm implements two strategies, namely, global exploration and local exploitation. The objective of these two steps is to first discover a solution, and then check the surroundings environment. After creating a random population, the BSA executes mutation and crossover operations to organize the individuals and performs a greedy selection technique to update the solution regularly.
The SOS algorithm was developed by Cheng and Prayogo [44]. The essence of this technique is analyzing and optimizing biological symbiotic-based interactions among organisms to address the outstanding. This process takes place within three stages of mutualism, commensalism, and parasitism, during which the organisms interact to enhance their abilities, and finally, the one with greater power (here fitness) is chosen.
For more information regarding the used algorithms (detailed strategy, mathematical equations, etc.), previous literature can be referred to (PO [56,57], HSA [58,59], BSA [60,61], and SOS [62,63].

2.3.3. Hybridization and Implementation

In order to achieve the proposed hybrids of the study, the prediction task by the MLP needs to be embedded within the problem function of the metaheuristic algorithms. In this function, the inputs are received, and an equation is formed with variable weights and biases to calculate the DAN. This calculation is followed by calculating the error of prediction. In a hybrid model, this error is aimed to be reduced by adjusting the mentioned variables. The number of weights and biases depends on the size of the network and data configuration. Referring to Figure 3, there are a total of 40 to-be-optimized parameters. Every time the MLP completes one prediction by analyzing the training data, an error is calculated. The optimizing algorithm forces MLP to perform this operation many times so that the solution improves going forward.

3. Results and Discussion

In this section, the main results are presented and discussed under a number of sub-sections. Before executing the models, the data need to be divided into two separate parts to be used in the train and test phases. Having 35 samples altogether, 28 and 7 samples are randomly selected to form the train and test datasets, respectively. These numbers are considered based on the ratio of 80:20, which is a well-accepted portioning rule in machine learning-based simulations [64,65].
To evaluate the power of the models, their prediction results must be compared with the expected situation. Using accuracy indices is a well-accepted idea for this purpose. In this work, three indices are used: (i) coefficient of determination (R2) for reporting the harmony between the prediction and expected situation, (ii) root mean square error (RMSE) and mean absolute percentage error (MAPE). Assuming D A n i p r e d i c t i o n and D A n i e x p e c t a t i o n as the models results and expected value, Equations (2)–(4) define these indices. As is known, the RMSE and MAPE should be small to have a good prediction, while this happens for the PCC closer to 1.
R 2 = 1 i = 1 X ( D A n i p r e d i c t i o n D A n i e x p e c t a t i o n ) 2 i = 1 X ( D A n i e x p e c t a t i o n D ¯ A n i e x p e c t a t i o n ) 2
R M S E = 1 X i = 1 X [ ( D A n i e x p e c t a t i o n D A n i p r e d i c t i o n ) ] 2
M A P E = 1 X i = 1 X | D A n i e x p e c t a t i o n D A n i p r e d i c t i o n D A n i e x p e c t a t i o n | × 100
where X shows the number of evaluated DAN pairs.

3.1. Optimization Results

This improvement is shown by reducing the RMSE as presented in Figure 4 for each model.
The PO, HSA, BSA, and SOS were implemented with the population size 100, 200, 300, and 500, respectively. Note that these values were chosen after trying several compatible population sizes (25, 50, 100, 200, 300, 400, and 500) for each algorithm and comparing the final RMSEs. It is a well-accepted approach for attaining a suitable population size in metaheuristic algorithms [66,67,68].

3.2. Training and Comparison

Once the training is finished, the last configuration of the used MLP (corresponding to the 1000th iteration in Figure 4) is considered as the trained model. In this section, the accuracy of the training phase is assessed. The MLP-PO, MLP-HSA, MLP-BSA, and MLP-SOS ended up with RMSEs of 2.94, 4.93, 3.54, and 0.99, respectively. Relative to the magnitude of DAN in Table 1, these RMSE values show a fine level of error. This claim can be quantitively supported by the MAPEs of 2.02, 3.79, 3.16, and 0.83%, showing below 4% error in the training process. Hence, it can be derived that a reliable training has been done by all four metaheuristic algorithms.
Figure 5 shows the graphical results of training. On the left side, the target parameters are chased by an estimated trace. All models have nicely hit the targets. On the right side, correlation charts are presented showing the consistency between the results and expectation. As is seen, R2 values of 0.98, 0.96, 0.98, and 0.99 all prove a great range of correlation for all models.
In the training phase, the performance of the MLP-SOS was comparably more promising than the other three models, due to the lower error and higher correlation results. After that, although the MLP-PO and MLP-BSA have equal R2s, the MLP-PO stands in the second position owing to the smaller RMSE and MAPE. MLP-BSA is the third accurate model and the poorest prediction is presented by the MLP-HSA.

3.3. Testing and Comparison

The training results should be followed by testing assessment to confirm the generalizability of the models. As reported in the previous section, the error of prediction can be reflected by the RMSEs of 8.86, 4.56, 3.45, and 1.57, as well as the MAPEs of 7.84, 4.69, 3.51, and 1.29%. Again, the errors are in a tolerable domain which indicates that the models have successfully predicted the DAN for new samples.
Figure 6 illustrates the test results. According to the charts on the left side, the test pattern of DAN is well followed by the intelligent models. The correlation charts confirm the consistency of prediction with reporting R2s of 0.98, 0.99, 0.99, and 0.99.
In the test phase, the largest error and smallest correlation was obtained by the MLP-PO. While the R2 is equal for the other three models, based on the RMSE and MAPE, the MLP-SOS is the most accurate, followed by the MLP-BSA, and MLP-HSA.
Table 2 gives the numerical results of the two earlier figures. Target and predicted DAN are presented along with the corresponding input values.

3.4. Formula

Although all four techniques could perform successfully for this purpose, based on the quantitative comparisons performed in earlier sections, the superiority of the MLP-SOS was deduced. The solution of this model can therefore be more exposed for convenient usages. Taking a look at Figure 3, Equation (5) calculates the DAN in the MLP-SOS network, but it is a complex equation that is fed by (a) Inputs: the vector of DAN key factors, (b) IW: the weights between the first two layers, (c) b1: biases in the middle layer, (d) LW: the weights between last two layers, and (e) b2: the single bias of the last neuron. These parameters are given in the subsequent equations [69].
D A N = [ L W ]   ·   ( 2 1 + e 2 I W   ·   I n p u t + b 1   1 ) + [ b 2 ] ,  
L W = 0.9077 0.8057 0.6469
I W = 0.4339 0.5699 0.3054 0.6409 0.6302 0.4937 0.4028 0.6401 0.2464 0.1486 0.2841 0.6438 0.2100 0.0744 0.5432 0.0232 0.1241 0.7290 0.5539 0.4089 0.2467 0.7428 0.4835 0.5217 0.5930 0.6100 0.3892 0.5389 0.2019 0.5625 0.3151 0.4262 0.2892
I n p u t = U M U T U P α M α T P t A C H S C W N S C W S S C W E G l z
b 1 = 1.5470 0.0000 1.5470
b 2   =   0.3897

3.5. Discussion

Obtaining an accurate understanding of early energy performance in buildings is an important step towards sustainable construction [2]. In this work, four methodologies were tried for the first time to solve the problem of predicting thermal energy demand. Each model comprises an MLP (11, 3, 1) to explore the relationship between the DAN and eleven key variables, i.e., UM, UT, UP, αM, αT, Pt, ACH, Scw−N, Scw−S, Scw−E, and Glz. The entire network was submitted to a metaheuristic algorithm for finding the optimal connection between these parameters.
By comparison, the performance of the SOS was superior to benchmarks, and it discloses the key innovation of this research, i.e., introducing a new capable technique for the mentioned purpose. Although the methodology is automatic, some parameters such as population size are determined by the user and can affect the performance of the algorithm. Based on Figure 4, the optimization provided by the SOS algorithm reached a more stable solution at the end. The reason for this is that the curve of the SOS remained almost horizontal (see the magnified sections), while others had some trend to further reduce the RMSE. It may represent a higher convergence rate of the SOS.
Along with promising results, this study has some limitations. The principal objective of the study is to explore the performance of the algorithms. A potential extension that can be considered for future studies is applying k-fold cross-validation. The models can further be assessed using another external dataset and with different splitting rations. In addition, it is suggested to incorporate data from different kinds of buildings (residential, office, etc.) in order to enhance the generalizability of the models.
Reducing the number of inputs is also of computational interest. Based on optimization behaviors, the models may be reimplemented with a larger number of iterations (with proper computers) for possible improvement of accuracy. As far as the methodology is concerned, conducting comparative analysis is highly recommended for determining more suitable predictive models in the future of metaheuristic algorithms.

4. Conclusions

Recent literature has recommended the use of machine learning models for energy demand analysis. Accordingly, introducing new methodologies can be helpful towards obtaining optimum solutions. In this work, a symbiotic organism search metaheuristic algorithm aided an MLP neural network to construct the best contribution between the DAN and eleven influential parameters, and subsequently, predicting it. The results show that SOS is a suitable algorithm for this purpose because the suggested model can accurately perform the prediction task. Moreover, this algorithm was more successful than the PO, HSA, and BSA used as comparative benchmarks. In conclusion, using the MLP-SOS technique can be beneficial for practical predictions and pattern recognition in real-world projects. This motivated the study to finally present a mathematical form of the suggested model. However, there were some limitations regarding data curing in this work, which once covered, the results should attain further improvement. Moreover, comprehensive comparisons among metaheuristic algorithms can further help future studies to find a more desirable solution for the problem at hand.

Author Contributions

Conceptualization, M.L.N.; Methodology, M.L.N.; Software, S.R. and F.R.; Validation, Y.D. and M.L.N.; Formal analysis, Y.D. and S.K.; Investigation, S.R., F.R., Y.D., S.K. and O.B.; Resources, O.B.; Data curation, S.R., F.R. and S.K.; Writing—review & editing, O.B. and M.L.N. All authors have read and agreed to the published version of the manuscript.

Funding

The authors extend their appreciation to the Deputyship for Research & Innovation, Ministry of Education in Saudi Arabia for funding this research work through the project number (IF2/PSAU/2022/01/22684).

Institutional Review Board Statement

Not applicable.

Informed Consent Statement

Not applicable.

Data Availability Statement

The codes of the developed models are available upon reasonable request from the corresponding author.

Conflicts of Interest

The authors declare no conflict of interest.

References

  1. Guo, Y.; Wang, J.; Chen, H.; Li, G.; Liu, J.; Xu, C.; Huang, R.; Huang, Y. Machine learning-based thermal response time ahead energy demand prediction for building heating systems. Appl. Energy 2018, 221, 16–27. [Google Scholar] [CrossRef]
  2. Zhao, H.-X.; Magoulès, F. A review on the prediction of building energy consumption. Renew. Sustain. Energy Rev. 2012, 16, 3586–3592. [Google Scholar] [CrossRef]
  3. Castaldo, V.L.; Pisello, A.L. Uses of dynamic simulation to predict thermal-energy performance of buildings and districts: A review. WIREs Energy Environ. 2017, 7, e269. [Google Scholar] [CrossRef]
  4. Zheng, W.; Zhou, Y.; Liu, S.; Tian, J.; Yang, B.; Yin, L. A Deep Fusion Matching Network Semantic Reasoning Model. Appl. Sci. 2022, 12, 3416. [Google Scholar] [CrossRef]
  5. Zheng, W.; Tian, X.; Yang, B.; Liu, S.; Ding, Y.; Tian, J.; Yin, L. A Few Shot Classification Methods Based on Multiscale Relational Networks. Appl. Sci. 2022, 12, 4059. [Google Scholar] [CrossRef]
  6. Tang, Y.; Liu, S.; Deng, Y.; Zhang, Y.; Yin, L.; Zheng, W. An improved method for soft tissue modeling. Biomed. Signal Process. Control 2021, 65, 102367. [Google Scholar] [CrossRef]
  7. Han, Y.; Yan, X.; Piroozfar, P. An overall review of research on prefabricated construction supply chain management. Eng. Constr. Arch. Manag. 2022; ahead-of-print. [Google Scholar] [CrossRef]
  8. Han, Y.; Xu, X.; Zhao, Y.; Wang, X.; Chen, Z.; Liu, J. Impact of consumer preference on the decision-making of prefabricated building developers. J. Civ. Eng. Manag. 2022, 28, 166–176. [Google Scholar] [CrossRef]
  9. Zhang, C.; Ali, A.; Sun, L. Investigation on low-cost friction-based isolation systems for masonry building structures: Experimental and numerical studies. Eng. Struct. 2021, 243, 112645. [Google Scholar] [CrossRef]
  10. Zhang, Z.; Li, W.; Yang, J. Analysis of stochastic process to model safety risk in construction industry. J. Civ. Eng. Manag. 2021, 27, 87–99. [Google Scholar] [CrossRef]
  11. Liu, W.; Huang, F.; Liao, Y.; Zhang, J.; Ren, G.; Zhuang, Z.; Zhen, J.; Lin, Z.; Wang, C. Treatment of CrVI-Containing Mg (OH) 2 Nanowaste. Angew. Chem. 2008, 120, 5701–5704. [Google Scholar] [CrossRef]
  12. Feng, X.; Jiang, L.; Li, D.; Tian, S.; Zhu, X.; Wang, H.; He, C.; Li, K. Progress and key challenges in catalytic combustion of lean methane. J. Energy Chem. 2022, 75, 173–215. [Google Scholar] [CrossRef]
  13. Xie, X.; Sun, Y. A piecewise probabilistic harmonic power flow approach in unbalanced residential distribution systems. Int. J. Electr. Power Energy Syst. 2022, 141, 108114. [Google Scholar] [CrossRef]
  14. Han, J.; Bae, J.; Jang, J.; Baek, J.; Leigh, S.-B. The Derivation of Cooling Set-Point Temperature in an HVAC System, Considering Mean Radiant Temperature. Sustainability 2019, 11, 5417. [Google Scholar] [CrossRef] [Green Version]
  15. Marín-García, D.; Bienvenido-Huertas, D.; Nieto-Julián, E.; Moyano Campos, J.J.; Oliveira, M.J.; Farinha, F. Analysis of the Regulations That Affect Energy Efficiency with Respect to Consumption of HVAC System for Residential Buildings in Southern Spain and Portugal; International Congress on Engineering and Sustainability in the XXI Century, 2019; Springer: Cham, Switzerland, 2019; pp. 478–486. [Google Scholar]
  16. Bienvenido-Huertas, D.; Oliveira, M.; Rubio-Bellido, C.; Marín, D. A Comparative Analysis of the International Regulation of Thermal Properties in Building Envelope. Sustainability 2019, 11, 5574. [Google Scholar] [CrossRef] [Green Version]
  17. Wang, Y.; Kuckelkorn, J.; Zhao, F.-Y.; Liu, D.; Kirschbaum, A.; Zhang, J.-L. Evaluation on classroom thermal comfort and energy performance of passive school building by optimizing HVAC control systems. Build. Environ. 2015, 89, 86–106. [Google Scholar] [CrossRef]
  18. Papadopoulos, S.; Azar, E. Optimizing HVAC operation in commercial buildings: A genetic algorithm multi-objective optimization framework. In Proceedings of the 2016 Winter Simulation Conference (WSC), Washington, DC, USA, 11–14 December 2016; pp. 1725–1735. [Google Scholar] [CrossRef]
  19. D’Amico, A.; Ciulla, G.; Tupenaite, L.; Kaklauskas, A. Multiple criteria assessment of methods for forecasting building thermal energy demand. Energy Build. 2020, 224, 110220. [Google Scholar] [CrossRef]
  20. Gao, W.; Alsarraf, J.; Moayedi, H.; Shahsavar, A.; Nguyen, H. Comprehensive preference learning and feature validity for designing energy-efficient residential buildings using machine learning paradigms. Appl. Soft Comput. 2019, 84, 105748. [Google Scholar] [CrossRef]
  21. Bienvenido-Huertas, D.; Moyano, J.; Rodríguez-Jiménez, C.E.; Marín, D. Applying an artificial neural network to assess thermal transmittance in walls by means of the thermometric method. Appl. Energy 2018, 233–234, 1–14. [Google Scholar] [CrossRef]
  22. Huang, Y.; Yuan, Y.; Chen, H.; Wang, J.; Guo, Y.; Ahmad, T. A novel energy demand prediction strategy for residential buildings based on ensemble learning. Energy Procedia 2019, 158, 3411–3416. [Google Scholar] [CrossRef]
  23. Memiş, S.; Enginoğlu, S.; Erkan, U. A classification method in machine learning based on soft decision-making via fuzzy parameterized fuzzy soft matrices. Soft Comput. 2021, 26, 1165–1180. [Google Scholar] [CrossRef]
  24. Jang, J.; Han, J.; Leigh, S.-B. Prediction of heating energy consumption with operation pattern variables for non-residential buildings using LSTM networks. Energy Build. 2021, 255, 111647. [Google Scholar] [CrossRef]
  25. Memiş, S.; Enginoğlu, S.; Erkan, U. Fuzzy parameterized fuzzy soft k-nearest neighbor classifier. Neurocomputing 2022, 500, 351–378. [Google Scholar] [CrossRef]
  26. Comert, M.M.; Adem, K.; Erdogan, M. Comparative analysis of estimated solar radiation with different learning methods and empirical models. Atmósfera 2022. [Google Scholar] [CrossRef]
  27. Khayatian, F.; Sarto, L.; Dall’O’, G. Application of neural networks for evaluating energy performance certificates of residential buildings. Energy Build. 2016, 125, 45–54. [Google Scholar] [CrossRef]
  28. Comesaña, M.M.; Febrero-Garrido, L.; Troncoso-Pastoriza, F.; Martínez-Torres, J. Prediction of Building’s Thermal Performance Using LSTM and MLP Neural Networks. Appl. Sci. 2020, 10, 7439. [Google Scholar] [CrossRef]
  29. Han, Y.; Fan, C.; Geng, Z.; Ma, B.; Cong, D.; Chen, K.; Yu, B. Energy efficient building envelope using novel RBF neural network integrated affinity propagation. Energy 2020, 209, 118414. [Google Scholar] [CrossRef]
  30. Yu, S.; Wang, K.; Wei, Y.-M. A hybrid self-adaptive Particle Swarm Optimization–Genetic Algorithm–Radial Basis Function model for annual electricity demand prediction. Energy Convers. Manag. 2014, 91, 176–185. [Google Scholar] [CrossRef]
  31. Turhan, C.; Kazanasmaz, T.; Uygun, I.E.; Ekmen, K.E.; Akkurt, G.G. Comparative study of a building energy performance software (KEP-IYTE-ESS) and ANN-based building heat load estimation. Energy Build. 2014, 85, 115–125. [Google Scholar] [CrossRef]
  32. Zhao, Y.; Yan, Q.; Yang, Z.; Yu, X.; Jia, B. A Novel Artificial Bee Colony Algorithm for Structural Damage Detection. Adv. Civ. Eng. 2020, 2020, 1–21. [Google Scholar] [CrossRef] [Green Version]
  33. Guo, Z.; Moayedi, H.; Foong, L.K.; Bahiraei, M. Optimal modification of heating, ventilation, and air conditioning system performances in residential buildings using the integration of metaheuristic optimization and neural computing. Energy Build. 2020, 214, 109866. [Google Scholar] [CrossRef]
  34. Moayedi, H.; Mehrabi, M.; Mosallanezhad, M.; Rashid, A.S.A.; Pradhan, B. Modification of landslide susceptibility mapping using optimized PSO-ANN technique. Eng. Comput. 2019, 35, 967–984. [Google Scholar] [CrossRef]
  35. Zhao, Y.; Foong, L.K. Predicting electrical power output of combined cycle power plants using a novel artificial neural network optimized by electrostatic discharge algorithm. Measurement 2022, 198, 111405. [Google Scholar] [CrossRef]
  36. Zheng, S.; Lyu, Z.; Foong, L.K. Early prediction of cooling load in energy-efficient buildings through novel optimizer of shuffled complex evolution. Eng. Comput. 2020, 38, 105–119. [Google Scholar] [CrossRef]
  37. Lin, C.; Wang, J. Metaheuristic-designed systems for simultaneous simulation of thermal loads of building. Smart Struct. Syst. 2022, 29, 677–691. [Google Scholar]
  38. Le, L.T.; Nguyen, H.; Dou, J.; Zhou, J. A comparative study of PSO-ANN, GA-ANN, ICA-ANN, and ABC-ANN in estimating the heating load of buildings’ energy efficiency for smart city planning. Appl. Sci. 2019, 9, 2630. [Google Scholar] [CrossRef] [Green Version]
  39. Ikeda, S.; Nagai, T. A novel optimization method combining metaheuristics and machine learning for daily optimal operations in building energy and storage systems. Appl. Energy 2021, 289, 116716. [Google Scholar] [CrossRef]
  40. Tran, D.-H.; LuongF, D.-L.; Chou, J.-S. Nature-inspired metaheuristic ensemble model for forecasting energy consumption in residential buildings. Energy 2019, 191, 116552. [Google Scholar] [CrossRef]
  41. Wani, M.; Hafiz, F.; Swain, A.; Ukil, A. Estimating thermal parameters of a commercial building: A meta-heuristic approach. Energy Build. 2020, 231, 110537. [Google Scholar] [CrossRef]
  42. Uribe, O.H.; Martin, J.P.S.; Garcia-Alegre, M.C.; Santos, M.; Guinea, D. Smart Building: Decision Making Architecture for Thermal Energy Management. Sensors 2015, 15, 27543–27568. [Google Scholar] [CrossRef]
  43. Hornik, K.; Stinchcombe, M.; White, H. Multilayer feedforward networks are universal approximators. Neural Netw. 1989, 2, 359–366. [Google Scholar] [CrossRef]
  44. Cheng, M.-Y.; Prayogo, D. Symbiotic Organisms Search: A new metaheuristic optimization algorithm. Comput. Struct. 2014, 139, 98–112. [Google Scholar] [CrossRef]
  45. Chegari, B.; Tabaa, M.; Simeu, E.; Moutaouakkil, F.; Medromi, H. Multi-objective optimization of building energy performance and indoor thermal comfort by combining artificial neural networks and metaheuristic algorithms. Energy Build. 2021, 239, 110839. [Google Scholar] [CrossRef]
  46. Seyedashraf, O.; Mehrabi, M.; Akhtari, A.A. Novel approach for dam break flow modeling using computational intelligence. J. Hydrol. 2018, 559, 1028–1038. [Google Scholar] [CrossRef]
  47. Zhao, Y.; Hu, H.; Song, C.; Wang, Z. Predicting compressive strength of manufactured-sand concrete using conventional and metaheuristic-tuned artificial neural network. Measurement 2022, 194, 110993. [Google Scholar] [CrossRef]
  48. Foong, L.K.; Zhao, Y.; Bai, C.; Xu, C. Efficient metaheuristic-retrofitted techniques for concrete slump simulation. Smart Struct. Syst. Int. J. 2021, 27, 745–759. [Google Scholar]
  49. Zhao, Y.; Moayedi, H.; Bahiraei, M.; Foong, L.K. Employing TLBO and SCE for optimal prediction of the compressive strength of concrete. Smart Struct. Syst. 2020, 26, 753–763. [Google Scholar]
  50. Zhao, Y.; Zhong, X.; Foong, L.K. Predicting the splitting tensile strength of concrete using an equilibrium optimization model. Steel Compos. Struct. 2021, 39, 81–93. [Google Scholar]
  51. Mehrabi, M.; Moayedi, H. Landslide susceptibility mapping using artificial neural network tuned by metaheuristic algorithms. Environ. Earth Sci. 2021, 80, 1–20. [Google Scholar] [CrossRef]
  52. Nguyen, H.; Mehrabi, M.; Kalantar, B.; Moayedi, H.; Abdullahi, M.M. Potential of hybrid evolutionary approaches for assessment of geo-hazard landslide susceptibility mapping. Geomat. Nat. Hazards Risk 2019, 10, 1667–1693. [Google Scholar] [CrossRef] [Green Version]
  53. Askari, Q.; Younas, I.; Saeed, M. Political Optimizer: A novel socio-inspired meta-heuristic for global optimization. Knowl.-Based Syst. 2020, 195, 105709. [Google Scholar] [CrossRef]
  54. Geem, Z.W.; Kim, J.H.; Loganathan, G.V. A new heuristic optimization algorithm: Harmony search. Simulation 2001, 76, 60–68. [Google Scholar] [CrossRef]
  55. Civicioglu, P. Backtracking Search Optimization Algorithm for numerical optimization problems. Appl. Math. Comput. 2013, 219, 8121–8144. [Google Scholar] [CrossRef]
  56. Fathy, A.; Rezk, H. Political optimizer based approach for estimating SOFC optimal parameters for static and dynamic models. Energy 2021, 238, 122031. [Google Scholar] [CrossRef]
  57. Askari, Q.; Younas, I. Improved political optimizer for complex landscapes and engineering optimization problems. Expert Syst. Appl. 2021, 182, 115178. [Google Scholar] [CrossRef]
  58. Zhu, Q.; Tang, X.; Li, Y.; Yeboah, M.O. An improved differential-based harmony search algorithm with linear dynamic domain. Knowl.-Based Syst. 2019, 187, 104809. [Google Scholar] [CrossRef]
  59. Sirjani, R.; Mohamed, A.; Shareef, H. Optimal allocation of shunt Var compensators in power systems using a novel global harmony search algorithm. Int. J. Electr. Power Energy Syst. 2012, 43, 562–572. [Google Scholar] [CrossRef]
  60. Wu, D.; Foong, L.K.; Lyu, Z. Two neural-metaheuristic techniques based on vortex search and backtracking search algorithms for predicting the heating load of residential buildings. Eng. Comput. 2020, 38, 647–660. [Google Scholar] [CrossRef]
  61. Fadel, W.; Kilic, U.; Ayan, K. Optimal reactive power flow of power systems with two-terminal HVDC and multi distributed generations using backtracking search algorithm. Int. J. Electr. Power Energy Syst. 2020, 127, 106667. [Google Scholar] [CrossRef]
  62. Zhou, Y.; Wu, H.; Luo, Q.; Abdel-Baset, M. Automatic data clustering using nature-inspired symbiotic organism search algorithm. Knowl.-Based Syst. 2019, 163, 546–557. [Google Scholar] [CrossRef]
  63. Abdullahi, M.; Ngadi, M.A. Symbiotic organism search optimization based task scheduling in cloud computing environment. Future Gener. Comput. Syst. 2016, 56, 640–650. [Google Scholar] [CrossRef]
  64. Jahanafroozi, N.; Shokrpour, S.; Nejati, F.; Benjeddou, O.; Khordehbinan, M.W.; Marani, A.; Nehdi, M.L. New Heuristic Methods for Sustainable Energy Performance Analysis of HVAC Systems. Sustainability 2022, 14, 14446. [Google Scholar] [CrossRef]
  65. Moayedi, H.; Mosavi, A. An Innovative Metaheuristic Strategy for Solar Energy Management through a Neural Networks Framework. Energies 2021, 14, 1196. [Google Scholar] [CrossRef]
  66. Moayedi, H.; Mehrabi, M.; Kalantar, B.; Mu’Azu, M.A.; Rashid, A.S.A.; Foong, L.K.; Nguyen, H. Novel hybrids of adaptive neuro-fuzzy inference system (ANFIS) with several metaheuristic algorithms for spatial susceptibility assessment of seismic-induced landslide. Geomat. Nat. Hazards Risk 2019, 10, 1879–1911. [Google Scholar] [CrossRef] [Green Version]
  67. Moayedi, H.; Mehrabi, M.; Bui, D.T.; Pradhan, B.; Foong, L.K. Fuzzy-metaheuristic ensembles for spatial assessment of forest fire susceptibility. J. Environ. Manag. 2020, 260, 109867. [Google Scholar] [CrossRef] [PubMed]
  68. Mehrabi, M.; Pradhan, B.; Moayedi, H.; Alamri, A. Optimizing an Adaptive Neuro-Fuzzy Inference System for Spatial Prediction of Landslide Susceptibility Using Four State-of-the-art Metaheuristic Techniques. Sensors 2020, 20, 1723. [Google Scholar] [CrossRef] [Green Version]
  69. Mehrabi, M. Landslide susceptibility zonation using statistical and machine learning approaches in Northern Lecco, Italy. Nat. Hazards 2021, 111, 901–937. [Google Scholar] [CrossRef]
Figure 1. (al) Histogram illustration of the employed dataset.
Sustainability 15 00231 g001
Figure 2. Schematic for the methodology of the study.
Sustainability 15 00231 g002
Figure 3. Illustration of the used MLP topology.
Sustainability 15 00231 g003
Figure 4. Optimization and reducing the training RMSE.
Sustainability 15 00231 g004
Figure 5. Train results of the used models.
Sustainability 15 00231 g005
Figure 6. Test results of the used models.
Sustainability 15 00231 g006aSustainability 15 00231 g006b
Table 1. Dataset statistical assessment results.
FactorUnitMeanMinimumMaximumModeStandard DeviationSample Variance
UMW.m−2.K−11.000.101.901.000.330.11
UTW.m−2.K−11.300.102.501.300.440.19
UPW.m−2.K−11.500.102.901.500.510.26
αM-0.500.100.900.500.150.02
αT-0.500.100.900.500.150.02
PtW.m−1.K−10.510.011.000.510.180.03
ACHv.h−10.600.101.100.600.180.03
Scw (north)-0.500.001.000.500.180.03
Scw (south)-0.500.001.000.500.180.03
Scw (east)-0.500.001.000.500.180.03
Glz-2.941.005.003.001.001.00
DANkWh.m−2.year−196.1548.19188.94#N/A27.92779.72
Table 2. Numerical inputs and results.
GroupUMUTUPαMαTPtACHScw (North)Scw (South)Scw (East)GlzTarget DANMLP-POMLP-HSAMLP-BSAMLP-SOS
Train1.0001.3001.5000.5000.5000.5050.6000.5000.5000.5005.00082.91083.15480.79584.06583.728
0.2800.3400.3800.1800.1800.1090.2000.1000.1000.1005.00048.19058.70855.92859.75548.676
1.0001.3001.5000.5000.5800.5050.6000.5000.5000.5003.00091.51090.98192.75594.24092.434
1.0001.3001.5000.5000.5000.5050.6000.6000.5000.5003.00090.00090.57088.64188.30091.156
1.0001.3001.5000.5000.5000.5050.6000.5000.5000.4003.00089.99089.87289.86087.69389.653
1.9002.5002.9000.9000.9001.0001.1001.0001.0001.0001.000188.940188.993185.498189.441189.144
1.0001.0601.5000.5000.5000.5050.6000.5000.5000.5003.00085.90085.27590.39985.43684.986
1.0001.3001.5000.5000.5000.5050.5000.5000.5000.5003.00087.16087.19888.50586.71586.714
1.0001.3001.5000.5000.5000.5050.6000.5000.5000.5003.00090.04089.73490.15189.48090.033
1.0001.3001.5000.5000.4200.5050.6000.5000.5000.5003.00088.63088.35487.77085.02488.654
1.0001.3001.5000.5000.5000.6040.6000.5000.5000.5003.00090.32090.39589.34589.03691.017
1.1801.5401.7800.5800.5800.6040.7000.6000.6000.6002.000113.820116.915115.309117.054111.786
1.0001.3001.5000.4200.5000.5050.6000.5000.5000.5003.00089.45090.02884.44090.40288.906
1.0001.3001.5000.5000.5000.5050.6000.5000.5000.5002.00099.99098.10694.58999.89098.372
1.0001.3001.7800.5000.5000.5050.6000.5000.5000.5003.00089.93089.95091.83087.67591.229
1.0001.3001.5000.5000.5000.4060.6000.5000.5000.5003.00089.74089.67791.10691.30789.357
0.8201.0601.2200.4200.4200.4060.5000.4000.4000.4003.00076.48077.83375.35374.34376.327
1.1801.3001.5000.5000.5000.5050.6000.5000.5000.5003.00094.74094.95495.27197.19395.705
1.0001.3001.5000.5800.5000.5050.6000.5000.5000.5003.00090.66091.43696.67788.78291.199
0.8201.3001.5000.5000.5000.5050.6000.5000.5000.5003.00085.38085.88085.54682.35085.389
1.0001.3001.5000.5000.5000.5050.6000.5000.5000.5004.00087.98085.11684.68782.98685.111
0.1000.1000.1000.1000.1000.0100.1000.0000.0000.0005.00069.84060.01955.25760.06669.375
1.0001.3001.5000.5000.5000.5050.6000.5000.6000.5003.00090.09091.61494.56393.12891.125
1.3601.7802.0600.6600.6600.7030.8000.7000.7000.7002.000141.820139.390140.729139.231140.860
1.0001.3001.5000.5000.5000.5050.7000.5000.5000.5003.00092.96092.43691.79793.11093.604
1.0001.3001.5000.5000.5000.5050.6000.5000.5000.5001.000108.820108.35796.953107.890109.602
1.5402.0202.3400.7400.7400.8020.9000.8000.8000.8001.000153.900154.766163.507155.089154.826
1.0001.3001.5000.5000.5000.5050.6000.5000.5000.6003.00090.10089.48890.45792.41690.765
Test0.6400.8200.9400.3400.3400.3070.4000.3000.3000.3004.00066.77067.45162.03562.06446.955
1.0001.5401.5000.5000.5000.5050.6000.5000.5000.5003.00094.21093.99889.89194.03694.843
1.0001.3001.2200.5000.5000.5050.6000.5000.5000.5003.00090.15089.63188.41992.58388.779
0.4600.5800.6600.2600.2600.2080.3000.2000.2000.2004.00063.85065.65757.72459.44154.067
1.7202.2602.6200.8200.8200.9011.0000.9000.9000.9001.000170.870173.840177.947175.898178.255
1.0001.3001.5000.5000.5000.5050.6000.5000.4000.5003.00090.03087.96586.67587.10088.946
1.0001.3001.5000.5000.5000.5050.6000.4000.5000.5003.00090.08089.70491.73391.47388.097
Disclaimer/Publisher’s Note: The statements, opinions and data contained in all publications are solely those of the individual author(s) and contributor(s) and not of MDPI and/or the editor(s). MDPI and/or the editor(s) disclaim responsibility for any injury to people or property resulting from any ideas, methods, instructions or products referred to in the content.

