Abstract
Proper analysis of building energy performance requires selecting appropriate models for handling complicated calculations. Machine learning has recently emerged as a promising effective solution for solving this problem. The present study proposes a novel integrative machine learning model for predicting two energy parameters of residential buildings, namely annual thermal energy demand (DThE) and annual weighted average discomfort degree-hours (HDD). The model is a feed-forward neural network (FFNN) that is optimized via the electrostatic discharge algorithm (ESDA) for analyzing the building characteristics and finding their optimal contribution to the DThE and HDD. According to the results, the proposed algorithm is an effective double-target model that can predict the required parameters with superior accuracy. Moreover, to further verify the efficiency of the ESDA, this algorithm was compared with three similar optimization techniques, namely atom search optimization (ASO), future search algorithm (FSA), and satin bowerbird optimization (SBO). Considering the Pearson correlation indices 0.995 and 0.997 (for the DThE and HDD, respectively) obtained for the ESDA-FFNN versus 0.992 and 0.938 for ASO-FFNN, 0.926 and 0.895 for FSA-FFNN, and 0.994 and 0.995 for SBO-FFNN, the ESDA provided higher accuracy of training. Subsequently, by collecting the weights and biases of the optimized FFNN, two formulas were developed for easier computation of the DThE and HDD in new cases. It is posited that building engineers and energy experts could consider the use of ESDA-FFNN along with the proposed new formulas for investigating the energy performance in residential buildings.
1. Introduction
As a well-known objective of many research efforts, engineers have tried to address complex problems using new scientific developments and emerging computational tools [1,2,3]. In this way, they have focused on solving newly risen issues, as well as improving previous solutions (e.g., maximizing efficiency [4,5,6]). These strategies can be classified as laboratory measurements, computer-based simulations, numerical and empirical calculations, soft computing, and artificial intelligence techniques, etc.
Buildings, as a primary residence for people and location of governmental and private entities and industries, are receiving large attention from the perspective of both consumers and authorities [7,8,9]. With the advances in the economy and population growth, buildings are consuming a noticeable share of the total energy worldwide [10,11]. This excess consumption is associated with adverse effects such as air pollutant emissions which itself can impact human health (e.g., respiratory and heart diseases) and cause climate change and global warming issues [12,13,14]. These effects call for investigating the buildings energy performance and developing ideas for enhancing it.
This issue has formed the motivation of many recent studies to look for efficient and effective evaluative methods for approximating the building’s behavior in terms of energy consumption [13,15]. Among a wide variety of methods suggested for this purpose, machine learning tools have received considerable attention. These methods propose accurate and inexpensive approaches for analyzing the energy parameters in buildings with various usages (e.g., predicting required thermal loads [16,17]).
The advent of new computational approaches like artificial intelligence has highly influenced the world of science [18,19]. Programming experts have so far introduced a wide variety of machine learning techniques for prediction purposes [20,21]. Famous models rely on theories such as neuro-fuzzy, support vector, and tree-based approaches for training the network and attaining a reliable understanding of the intended parameters. Artificial neural networks (ANNs) [22] are another well-known set of algorithms that contribute to an extensive range of machine learning applications. These models have also shown high promise for simulating different energy parameters [23,24,25]. Energy performance included, many authors have applied ANN-based techniques for analyzing the buildings characteristics towards predicting the required energies such as thermal loads [26]. In this process, the network receives the building’s characteristics including dimensions, glazing, positions, etc., and performs neural calculations to establish the best relationship between these factors and the parameters of interest.
The training process in machine learning models is conducted by specific algorithms that are embedded in the model. Apart from typical training algorithms, recent studies have proposed the use of sophisticated optimization techniques for this purpose. These algorithms are known as population-based metaheuristic techniques that are mostly inspired by nature [27,28]. The application of metaheuristic algorithms in combination with various machine learning models, covers a wide range of subjects including building energy performance [29,30,31]. For instance, Alkhazaleh, et al. [32] applied a machine learning adaptive neuro-fuzzy-inference system (ANFIS) to predict building energy demand. The ANFIS was trained using equilibrium optimization (EO), Harris hawks optimization (HHO), grey wolf optimizer (GWO), and slap swarm algorithm (SSA), and a comparison among them revealed the better capability of the first two algorithms for this task.
Earlier generations of metaheuristic techniques comprise algorithms like particle swarm optimization, genetic algorithm, imperialist competitive algorithm, etc. that have effectively served for optimizing intelligent models in predicting energy parameters such as building thermal loads [33,34]. On the other hand, many similar studies have reported the excellent optimization ability of the newer members of this family as well [35,36]. Hence, this promotes the need for continual testing of recent algorithms to keep the solution of energy problems updated with methodological advances.
Existing literature indicates that intelligent models like ANNs are very suitable for analyzing the energy performance of various types of buildings. On the other hand, it was stated that the performance of these models can be optimized when they are associated with appropriate metaheuristic optimizers. Based on these advantages, this work pursues three pivotal objectives:
- (i)
- A new methodology, based on the combination of feed-forward neural network (FFNN) and a metaheuristic technique called electrostatic discharge algorithm (ESDA), is proposed for energy performance analysis in residential buildings. This task is carried out by predicting annual thermal energy demand (DThE) and annual weighted average discomfort degree-hours (HDD) by analyzing the building’s architecture. Notably, the FFNN is one of the most capable neural predictors that supports double-target prediction, i.e., simultaneous prediction of two parameters [37]. Likewise, the ESDA is among the powerful metaheuristic optimizers that have successfully optimized FFNN for different purposes such as predicting electrical power [38], footing bearing capacity [39], and more relevantly optimizing heating, ventilation and air-conditioning (HVAC) systems [36].
- (ii)
- A comparison is conducted among the ESDA and similar algorithms to comparatively validate the performance of the suggested model. The benchmark algorithms are the future search algorithm (FSA) [40], atom search optimization (ASO) [41], and satin bowerbird optimization (SBO) [42]. In such studies, due to the performance of several algorithms, the main solution is excerpted among numerous candidates, which increases the reliability of solving the problem.
- (iii)
- Knowing that a reliable early approximation of the required thermal load of a building can be very beneficial, the methodology presented in this study can contribute to practical applications such as optimizing relevant designs (e.g., building characteristics and energy systems).
2. Materials and Methods
2.1. Data Provision
In order for the machine learning model to implement the prediction task, a dataset is prepared. The dataset is the analysis result of a residential building in Marrakech (Morocco) which was carried out in transient system simulation tool (TRNSYS) environment [43] based on a study by Chegari, et al. [44]. The used package, associated with appropriate standards, enables experts to perform energy analysis of a building by using its characteristics such as geometry, thermo-physical parameters, orientation, etc. The main outcomes of the analysis were two energy parameters:
- (i)
- DThE (annual thermal energy demand): calculated as the sum of heating and cooling loads over the building’s total conditioned area,
- (ii)
- HDD (annual weighted average discomfort degree-hours): calculated as the annual weighted average of the degree-hours, during which, the resident feels uncomfortable where he/she should feel more comfortable.
Further details regarding the simulation conditions and relevant assumptions can be found in the reference paper [44].
Overall, the dataset is composed of thirteen factors, classified as two target factors:
- (a)
- DThE in kWh.m−2.year−1
- (b)
- HDD in °C.h.year−1
- (c)
- and eleven input factors given below:
- (d)
- Transmission coefficient of the external walls (UM) in W.m−2.K−1
- (e)
- Transmission coefficient of the roof (UT) in W.m−2.K−1
- (f)
- Transmission coefficient of the floor (UP) in W.m−2.K−1
- (g)
- Solar radiation absorption coefficient of the exterior walls (αM),
- (h)
- Solar radiation absorption coefficient of the roof (αT),
- (i)
- Linear coefficient of thermal bridges (Pt) in W.m−1.K−1,
- (j)
- Air change rate (RA-CH) in v.h−1,
- (k)
- Shading coefficient of North-facing windows (ShCW-N),
- (l)
- Shading coefficient of South-facing windows (ShCW-S),
- (m)
- Shading coefficient of East-facing windows (ShCW-E), and
- (n)
- Glazing (GZ).
The correlation matrix of the used dataset is illustrated in Figure 1. The main diagonal of this matrix shows the histogram of the factors (e.g., the first element on the main diagonal shows the histogram of the UM). Other elements are depicted in scatter charts showing the relationship between the corresponding factor and the other twelve factors. Also, the reported value expresses the correlation between two factors in each chart. According to the last two rows of this matrix, the DThE is meaningfully correlated with all input factors, while the HDD is not so.
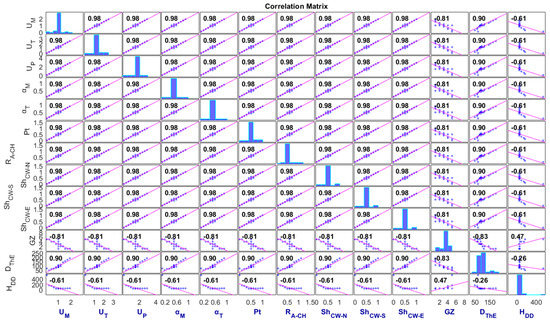
Figure 1.
Scatter and histogram charts of the dataset factors.
Moreover, the dataset was statistically analyzed in Excel environment through Data Analysis Section—Descriptive Statistics tool. Table 1 presents the results of this process.

Table 1.
Dataset statistical assessment results.
A total of 35 samples constitutes the used dataset (size = 35 × 13). For this research, it was split into two sub-sets with 28 and 7 samples for the training and testing operations, respectively. Calculating the ratios indicate that 80% of data is devoted to the training task, while the testing task uses 20% of them. To have an equal data division, a random selection was applied here.
2.2. Electrostatic Discharge Algorithm
As is known, metaheuristic algorithms are mostly inspired by natural behaviors like animal foraging actions [45,46]. On the other hand, there are some of them which follow the famous rules of the physics world in order to perform the optimization (e.g., optics inspired optimization [47]). The ESDA algorithm is another member of the latter family that is developed inspired by the electrostatic discharge phenomenon [48]. In definition, two bodies with different levels of electrostatic potential share a charge [49].
The optimization using ESDA begins with generating a population. The capability of each individual in this population is determined by a fitness value that represents the individual’s immunity. In each implementation (i.e., iteration) of the ESDA, three individuals are randomly taken into consideration for performing the discharge. Next, a random value is produced. Based on the value of this random number, two cases are possible:
- (a)
- If the random value is greater than 0.5, two individuals with positions and execute the discharge as follows:
- (b)
- If the random value is smaller than 0.5,
In the above equations, (i = 1, 2, 3) signify random values and represents the new position of the individual i.
Following this, a comprehensive check is done by the algorithm to confirm that all individuals are inside the boundaries. Finally, another check identifies the individuals that have been through more than 3 discharges, because the algorithm must treat them as eliminated individuals and replace them with newly generated ones. The explained process is repeated for each iteration with new individuals and the outstanding solution (i.e., the best fitness) is thereby discovered [48].
2.3. Feed-Forward Neural Network and Used Structure
So far, different versions of ANNs have been proposed and used for diverse simulations. These models are simulated on the basis of natural neural networks in the human brain [22,50]. Hence, the interaction between neural components forms a consistent network that is able to recognize and learn the pattern in the data. As a feedforward network, the FFNNs are first fed by appropriate data and this data is processed as it moves forward within the network [51]. For instance, in the MLP ANNs, the output of layer i is the input for layer i+1 [52]. In the following, the mechanism of these networks is explained.
Figure 2 shows the configuration of the FFNN that is optimized by metaheuristic algorithms in this research. As is seen, this network is composed of three layers:
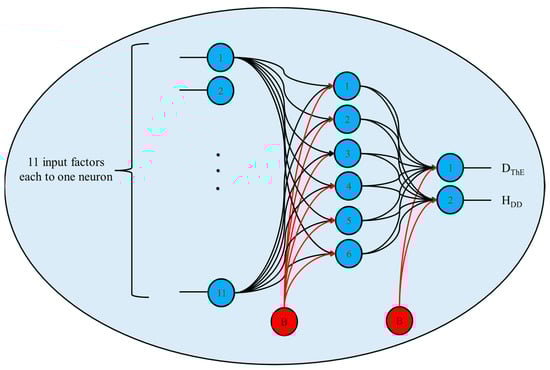
Figure 2.
The ANN topology.
- (i)
- Input layer which is fed by receiving eleven inputs of the dataset.
- (ii)
- Hidden layer which processes them.
- (iii)
- Output layer which releases the DThE and HDD.
In this figure, each blue circle represents a computational unit of the FFNN which are 11, 6, and 2 in the first, second, and third layers, respectively. Throughout the network, the neurons are forwardly connected using black arrows (named weights). Also, red arrows are considered as the bias of calculations (B stands for bias). Note that in the training of an FFNN, these weights and biases are adjusted and improved several times until meeting a stopping criterion. Thus, the ESDA algorithm is responsible for tuning these variables to create the best contribution from the UM, UT, UP, αM, αT, Pt, RA-CH, ShCW-N, ShCW-S, ShCW-E, GZ to the DThE, and HDD.
3. Results and Discussion
The pivotal objective of conducting this study is to examine the suitability of the FFNN-ESDA algorithm for predicting two parameters related to the energy performance of residential buildings. After model creation and data arrangement, the results are presented and discussed in the following parts.
The prediction reliability of the models is assessed in two phases:
- (i)
- Training phase during which the models acquire the knowledge of relationship between the DThE and HDD with eleven input factors. A pattern is finally created in this phase using the training dataset.
- (ii)
- Testing phase for assessing the accuracy of the developed pattern.
In order to do these accuracy assessments, well-known accuracy criteria of root mean square error (RMSE), mean absolute error (MAE), and Pearson correlation coefficient (RP) are employed. Equations (3)–(5) express how these criteria are calculated.
In the above equations, represents the expected target values (i.e., real DThE and real HDD), signifies the corresponding estimated values, and K shows the size of datasets which equals 28 in the training phase and 8 in the testing phase.
It is widely accepted that depending on the type of problem at hand (i.e., regression or classification problem) there are various statistical measures for evaluating the performance of machine learning models. In many similar works, utilizing a correlation index along with error criteria provided a reliable accuracy assessment for prediction tasks that use regression data [53,54,55], which is why the RP is taken into consideration associated with two well-known error criteria (i.e., the RMSE and MAE). Specifically, while the RMSE and MAE focus on the difference between the prediction and reality, RP addresses the consistency of results by reporting a value in [0, 1]. Hereupon, smaller values of the RMSE and MAE, as well as greater values of RP, demonstrate a better prediction.
3.1. Optimization
The first set of results is concerned with the optimization outcome. It was earlier mentioned that the ESDA, as well as FSA, ASO, and SBO, aim to provide the optimum weights and biases for the FFNN network. The steps below are taken for running a combination of the FFNN and the mentioned algorithms [56]:
- (i)
- Converting the FFNN into pure mathematical equations which predict the DThE and HDD, where the inputs are UM, UT, UP, αM, αT, Pt, RA-CH, ShCW-N, ShCW-S, ShCW-E, and GZ.
- (ii)
- Determining an appropriate population size for each algorithm.
- (iii)
- Defining the number of iterations for each algorithm.
- (iv)
- Defining an objective function that measures the accuracy of training in each iteration.
- (v)
- Saving the best solution and constructing the final FFNN using optimized weights and biases.
The objective function for all models was the RMSE of training which is minimized to attain a better training. Since there are two outputs simultaneously predicted in this study, the objective function was set to be an average of the RMSE of both parameters, as expressed in the following equation:
However, due to different magnitudes of DThE and HDD, their single RMSE was also controlled at the end of optimization. The number of iterations was 1000, based on the algorithms’ behavior, while the population size was separately determined for each model after trying some relevant values. Figure 3a shows the results of this process for the ESDA algorithm with population size of 50–500. It was revealed that the ESDA, FSA, ASO, and SBO perform the best optimization when their population size is 300, 400, 400, and 400, respectively. Figure 3b illustrates the resulted optimization curves for the reported population sizes of the ESDA versus the benchmark algorithms. This figure gives important information from the optimization behavior of the algorithms such as initial and eventual error, convergence rate, and a comparison among the algorithms.
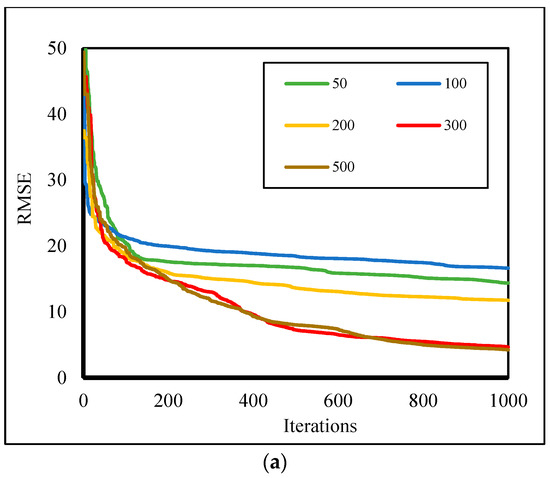
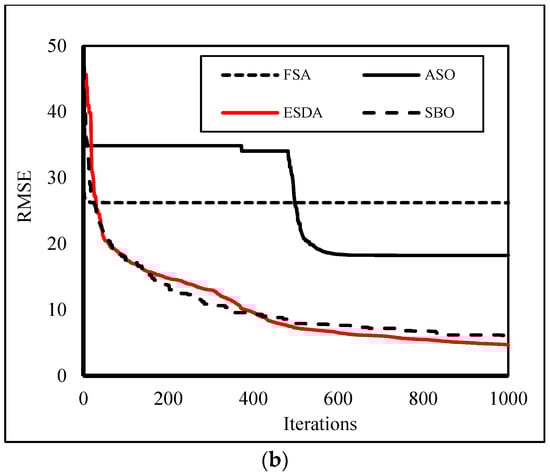
Figure 3.
Optimization results in (a) different population sizes of the ESDA and (b) final curves for all algorithms.
3.2. Training and Results Assessment
The outcomes of the previous section are optimized (i.e., trained) FFNNs that have analyzed the training data to discover the non-linear relationship between the UM, UT, UP, αM, αT, Pt, RA-CH, ShCW-N, ShCW-S, ShCW-E, GZ with the DThE, and HDD. To examine the accuracy of this process, the predictions of the selected networks are compared one-by-one to the expected values. The goodness of these results indicates how good the models have been trained, while their performance when applied to testing data indicates a more important feature, namely generalizability. This feature answers the question “How is the accuracy of the models when they are applied to building conditions they never met before?”
For this purpose, using Equations (3)–(5), the error of prediction and correlation of results are measured for the training and testing datasets. Table 2 collects all calculated MAEs, RMSEs, and RPs.
Table 2.
The accuracy indicators obtained for predicting energy parameters.
For the DThE, the training RMSEs of 2.53, 3.37, 10.58, and 2.84 are obtained for the FFNN model trained optimized with the ESDA, ASO, FSA, and SBO, respectively. The corresponding MAE values are 1.70, 2.50, 6.70, and 2.38. Concerning the testing phase, RMSEs are 8.88, 8.28, 4.75, and 8.93 along with the MAEs of 5.44, 6.06, 3.81, and 6.03. All these results indicate that the errors of learning and prediction of the DThE are at an acceptable level.
As far as the RP is concerned, Figure 4 depicts the regression charts of both training and testing data containing the correlation values. As it can be seen, all data points are well gathered around the “Best fit” line which represents an ideal prediction. Quantitatively speaking, the harmony between the expected and estimated DThE values are stated by the training RPs 0.995, 0.992, 0.926, and 0.994 and testing RPs 0.971, 0.983, 0.995, and 0.970.
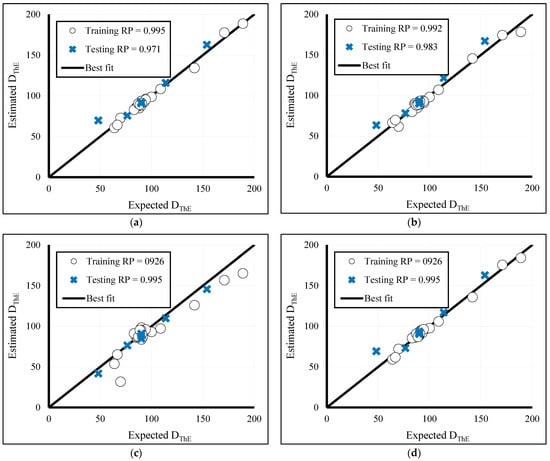
Figure 4.
Correlation results for training and testing phases of the (a) ESDA, (b) ASO, (c) FSA, and (d) SBO corresponding to the DThE.
The same assessment is conducted for the HDD. According to Table 2, training RMSEs 6.79, 33.10, 41.84, and 9.39, as well as the testing RMSEs 97.54, 72.16, 76.33, and 90.59 demonstrate a satisfying training. This claim can be supported by the training MAEs 4.04, 14.98, 26.17, and 6.00, as well as testing MAEs, 43.01, 37.16, 48.98, and 41.91.
Note that during optimization, an average of the training RMSEs obtained for the the DThE and HDD determined the objective function of each iteration in Figure 3. Accordingly, the curves of the ESDA, ASO, FSA, and SBO ended up with values 4.66, 18.235, 26.21, and 6.115, respectively.
Figure 5 presents the correlation charts of the testing results. It is reported along with the charts that in the training phase, the RPs are 0.997, 0.938, 0.895, and 0.995, and for the testing phase, 0.996, 0.990, 0.980, and 0.996. Both data groups (i.e., training and testing points) are nicely correlated around the “Best fit line”, which indicates the great accuracy of all models in predicting the HDD.
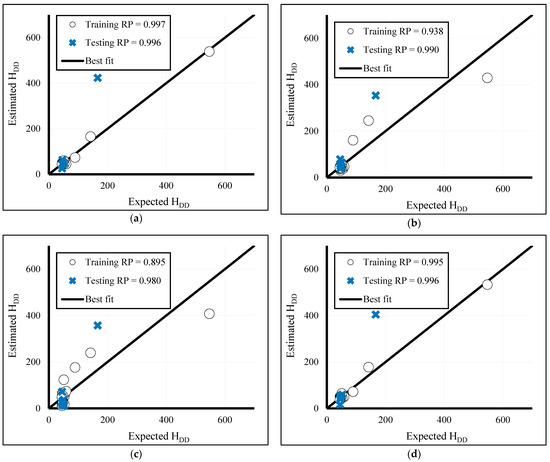
Figure 5.
Correlation results for training and testing phases of the (a) ESDA, (b) ASO, (c) FSA, and (d) SBO corresponding to the HDD.
3.3. Overall Assessment and Discussion
Along with buildings’ analysis concerning civil/safety engineering [57,58,59], understanding the behavior of buildings in terms of required thermal load has economic and environmental advantages. It has been the motivation of many studies for developing sophisticated techniques to solve this problem. Recently, large attention has been paid to metaheuristic-optimized models, particularly newly developed algorithms. For example, the use of the symbiotic organism search algorithm for analyzing building thermal load was recommended by Rastbod, Rahimi, Dehghan, Kamranfar, Benjeddou and Nehdi [55]. This model also was found to outperform the political optimizer, harmony search algorithm, and backtracking search algorithms.
This study employed a powerful notion of these algorithms, i.e., the ESDA comparatively assessed with respect to ASO, FSA, and SBO. Based on the results given in the above section, it is shown that all models have been successful in analyzing the energy parameters of buildings. Hence, a significant finding can be the suitability of the ESDA, ASO, FSA, and SBO for training (i.e., optimizing) the FFNN. However, a comparative examination demonstrates that the performance of the ESDA was superior to three other algorithms. As explained in Section 2.2, a possible reason for this excellent optimization performance could be the strategy of eliminating exhausted individuals (i.e., those who experienced a certain number of discharges) and replacing them with new members [48]. The competency of this algorithm in optimizing FFNN has also been professed by scholars like Zhao and Foong [38] and Mu’azu [39]. After that, the SBO may stand as the second potential algorithm. It should be regarded that while the FSA was characterized with a weaker training compared to others, its testing results were quite promising.
Once again, due to the satisfying performance of the four models, a particularly the ESDA, in the training and testing phases, it is concluded that they are well capable of simultaneously understanding the DThE and HDD patterns, and also, reproducing these patterns for unseen building conditions. In almost all cases, the RP values computed for the testing data were greater than 0.90, indicating above 90% agreement between the expected and estimated values.
Considering Figure 2, the analyzed network consisted of 86 variables (i.e., 78 weights + 8 biases) that were optimized consistently. What is quite clear is that adjusting such a bulky network should be a computer-supervised process and cannot be handled by humans. This study revealed that artificial intelligence can overcome this difficulty for good. As can be observed in Figure 3, each algorithm discarded 999 solutions to reach the optimal one in the 1000th iterations. Moreover, extensive trial and error efforts were executed to find the optimal population size for the algorithms (Section 3.1). Therefore, the obtained solutions are optimally selected among a wide range of candidates.
The FFNN used in this study was a double-target network that established a complicated relationship between two energy parameters (i.e., DThE and HDD) with eleven building characteristics. It enables the engineers and energy experts to use the applied methods for the early analysis of buildings. This advantage is helpful for the proper design of the building and relevant energy systems such as HVAC.
However, there are some potential ideas that may be considered for the following research efforts. Due to the large number of algorithms that are being developed for optimization objectives, the ESDA can be compared with further benchmarks in order to see whether the solution can be further enhanced. The experts may also make some improvements regarding the used data. As a limitation of this study, the dataset was restricted to 35 samples. Although the training was protected from undesirable phenomena such as local minima by the optimization algorithms, the models could extract reliable patterns, utilizing more datasets (e.g., the one used in [26,60]), which could be of interest for augmenting the generalizability of the models. Furthermore, developers may examine the effect of building characteristics which were UM, UT, UP, αM, αT, Pt, RA-CH, ShCW-N, ShCW-S, ShCW-E, and GZ in this study, and decide on their importance in predicting the DThE and HDD. It can help to remove negligible parameters and reach a problem with smaller dimensions. This idea is further highlighted when it comes to double-target networks.
3.4. A Formula for Predicting Thermal Energy Demand and Discomfort Degree-Hours
An advantage of the FFNN-based model is that they can return a mathematical configuration of the trained network to act as a predictive formula [61,62]. To achieve the formula of the ESDA-FFNN model, the below steps are taken:
- (iv) Giving the above produced values to the output layer to calculate the DThE and HDD (see Figure 2):
DThE = −0.3740 × A − 0.6589 × B + 0.7669 × C − 0.5731 × D + 0.3722 × E − 0.0999 × F + 0.1832
HDD = 0.0921 × A − 0.0355 × B − 0.0056 × C + 0.0073 × D − 0.0151 × E − 1.7295 × F + 0.6601
4. Conclusions
This study reported a successful effort of employing a state-of-the-art computational technique for analyzing the energy performance of residential buildings. The model was constructed on the basis of a feed-forward neural network which was optimized by a metaheuristic algorithm, namely the electrostatic discharge algorithm. The main findings can be drawn as follows:
- The hybrid model could analyze the building’s characteristics and reach an accurate understanding of the behavior of two energy parameters simultaneously, i.e., annual thermal energy demand and annual weighted average discomfort degree-hours. The correlation results for both DThE and HDD reached above 90% agreement between the actual data and the simulation results.
- Moreover, based on several accuracy representatives, the ESDA exhibited better performance compared to benchmark algorithms including future search algorithm, atom search optimization, and satin bowerbird optimization.
- A double-target formula was extracted from the proposed model for convenient calculations of the energy parameters.
- Based on this study, it is recommended to pursue the practical use of the ESDA to confirm its efficient analysis of building energy performance in real world applications such as optimizing air conditioning systems. This could provide insight into whether the proposed methodology would need some modifications and improvements that could be investigated in future relevant works.
Author Contributions
Data Curation, A.M.F., E.G., L.S.S., H.G. and B.A.; Formal Analysis, A.M.F., E.G., L.S.S., H.G. and B.A.; Investigation, A.M.F., E.G., L.S.S., H.G. and B.A.; Software, A.M.F., E.G., L.S.S., H.G. and B.A.; Visualization, A.M.F., E.G., L.S.S., H.G. and B.A.; Writing–Original Draft; A.M.F., E.G., L.S.S., H.G. and B.A.; Conceptualization, M.L.N.; Funding Acquisition, M.L.N.; Methodology, M.L.N.; Project Administration, M.L.N.; Resources, M.L.N.; Writing–Review & Editing, M.L.N. All authors have read and agreed to the published version of the manuscript.
Funding
This research received no funding.
Institutional Review Board Statement
Not applicable.
Informed Consent Statement
Not applicable.
Data Availability Statement
The data used in this research is taken from a study by Chegari, et al. [44] and is available in that study.
Conflicts of Interest
The authors declare no conflict of interest.
References
- Lu, C.; Zhu, R.; Yu, F.; Jiang, X.; Liu, Z.; Dong, L.; Hua, Q.; Ou, Z. Gear rotational speed sensor based on FeCoSiB/Pb (Zr, Ti) O3 magnetoelectric composite. Measurement 2021, 168, 108409. [Google Scholar] [CrossRef]
- Guo, L.; Ye, C.; Ding, Y.; Wang, P. Allocation of centrally switched fault current limiters enabled by 5G in transmission system. IEEE Trans. Power Deliv. 2020, 36, 3231–3241. [Google Scholar] [CrossRef]
- Lu, C.; Zhou, H.; Li, L.; Yang, A.; Xu, C.; Ou, Z.; Wang, J.; Wang, X.; Tian, F. Split-core magnetoelectric current sensor and wireless current measurement application. Measurement 2022, 188, 110527. [Google Scholar] [CrossRef]
- Lei, W.; Hui, Z.; Xiang, L.; Zelin, Z.; Xu-Hui, X.; Evans, S. Optimal remanufacturing service resource allocation for generalized growth of retired mechanical products: Maximizing matching efficiency. IEEE Access 2021, 9, 89655–89674. [Google Scholar] [CrossRef]
- Hao, W.; Xie, J. Reducing diffusion-induced stress of bilayer electrode system by introducing pre-strain in lithium-ion battery. J. Electrochem. Energy Convers. Storage 2021, 18, 020909. [Google Scholar] [CrossRef]
- Li, S.; Geng, Z. Bicriteria scheduling on an unbounded parallel-batch machine for minimizing makespan and maximum cost. Inf. Process. Lett. 2023, 180, 106343. [Google Scholar] [CrossRef]
- Han, Y.; Xu, X.; Zhao, Y.; Wang, X.; Chen, Z.; Liu, J. Impact of consumer preference on the decision-making of prefabricated building developers. J. Civ. Eng. Manag. 2022, 28, 166–176. [Google Scholar] [CrossRef]
- Han, Y.; Wang, L.; Kang, R. Influence of consumer preference and government subsidy on prefabricated building developer’s decision-making: A three-stage game model. J. Civ. Eng. Manag. 2023, 29, 35–49. [Google Scholar] [CrossRef]
- Han, Y.; Yan, X.; Piroozfar, P. An overall review of research on prefabricated construction supply chain management. Eng. Constr. Archit. Manag. 2022. ahead-of-print. [Google Scholar] [CrossRef]
- Hu, S.; Wang, J.; Hoare, C.; Li, Y.; Pauwels, P.; O’Donnell, J. Building energy performance assessment using linked data and cross-domain semantic reasoning. Autom. Constr. 2021, 124, 103580. [Google Scholar] [CrossRef]
- Kim, D.D.; Suh, H.S. Heating and cooling energy consumption prediction model for high-rise apartment buildings considering design parameters. Energy Sustain. Dev. 2021, 61, 1–14. [Google Scholar] [CrossRef]
- Dandotiya, B.; Sharma, H.K. Climate Change and Its Impact on Terrestrial Ecosystems. In Research Anthology on Environmental and Societal Impacts of Climate Change; IGI Global: Hershey, PA, USA, 2022; pp. 88–101. [Google Scholar]
- Olu-Ajayi, R.; Alaka, H.; Sulaimon, I.; Sunmola, F.; Ajayi, S. Machine learning for energy performance prediction at the design stage of buildings. Energy Sustain. Dev. 2022, 66, 12–25. [Google Scholar] [CrossRef]
- Lin, L.; Chen, C.; Wei, B.; Li, H.; Shi, J.; Zhang, J.; Huang, N. Residential electricity load scenario prediction based on transferable flow generation model. J. Electr. Eng. Technol. 2023, 18, 99–109. [Google Scholar] [CrossRef]
- Do, H.; Cetin, K.S. Residential building energy consumption: A review of energy data availability, characteristics, and energy performance prediction methods. Curr. Sustain. /Renew. Energy Rep. 2018, 5, 76–85. [Google Scholar] [CrossRef]
- Ding, Y.; Zhang, Q.; Yuan, T.; Yang, K. Model input selection for building heating load prediction: A case study for an office building in Tianjin. Energy Build. 2018, 159, 254–270. [Google Scholar] [CrossRef]
- Lumbreras, M.; Garay-Martinez, R.; Arregi, B.; Martin-Escudero, K.; Diarce, G.; Raud, M.; Hagu, I. Data driven model for heat load prediction in buildings connected to District Heating by using smart heat meters. Energy 2022, 239, 122318. [Google Scholar] [CrossRef]
- Qin, X.; Liu, Z.; Liu, Y.; Liu, S.; Yang, B.; Yin, L.; Liu, M.; Zheng, W. User OCEAN personality model construction method using a BP neural network. Electronics 2022, 11, 3022. [Google Scholar] [CrossRef]
- Meng, Q.; Lai, X.; Yan, Z.; Su, C.-Y.; Wu, M. Motion planning and adaptive neural tracking control of an uncertain two-link rigid-flexible manipulator with vibration amplitude constraint. IEEE Trans. Neural Netw. Learn. Syst. 2021, 33, 3814–3828. [Google Scholar] [CrossRef]
- Baduge, S.K.; Thilakarathna, S.; Perera, J.S.; Arashpour, M.; Sharafi, P.; Teodosio, B.; Shringi, A.; Mendis, P. Artificial intelligence and smart vision for building and construction 4.0: Machine and deep learning methods and applications. Autom. Constr. 2022, 141, 104440. [Google Scholar] [CrossRef]
- Debrah, C.; Chan, A.P.; Darko, A. Artificial intelligence in green building. Autom. Constr. 2022, 137, 104192. [Google Scholar] [CrossRef]
- Yegnanarayana, B. Artificial Neural Networks; PHI Learning Pvt. Ltd.: New Delhi, India, 2009. [Google Scholar]
- Cho, J.H.; Moon, J.W. Integrated artificial neural network prediction model of indoor environmental quality in a school building. J. Clean. Prod. 2022, 344, 131083. [Google Scholar] [CrossRef]
- Geraldi, M.S.; Ghisi, E. Data-driven framework towards realistic bottom-up energy benchmarking using an Artificial Neural Network. Appl. Energy 2022, 306, 117960. [Google Scholar] [CrossRef]
- Zhang, H.; Feng, H.; Hewage, K.; Arashpour, M. Artificial Neural Network for Predicting Building Energy Performance: A Surrogate Energy Retrofits Decision Support Framework. Buildings 2022, 12, 829. [Google Scholar] [CrossRef]
- Gao, W.; Alsarraf, J.; Moayedi, H.; Shahsavar, A.; Nguyen, H. Comprehensive preference learning and feature validity for designing energy-efficient residential buildings using machine learning paradigms. Appl. Soft Comput. 2019, 84, 105748. [Google Scholar] [CrossRef]
- Gupta, T.K.; Raza, K. Optimization of ANN architecture: A review on nature-inspired techniques. In Machine Learning in Bio-Signal Analysis and Diagnostic Imaging; Academic Press: Cambridge, MA, USA, 2019; pp. 159–182. [Google Scholar]
- Hemeida, A.M.; Hassan, S.A.; Mohamed, A.-A.A.; Alkhalaf, S.; Mahmoud, M.M.; Senjyu, T.; El-Din, A.B. Nature-inspired algorithms for feed-forward neural network classifiers: A survey of one decade of research. Ain Shams Eng. J. 2020, 11, 659–675. [Google Scholar] [CrossRef]
- Chou, J.-S.; Ngo, N.-T. Time series analytics using sliding window metaheuristic optimization-based machine learning system for identifying building energy consumption patterns. Appl. Energy 2016, 177, 751–770. [Google Scholar] [CrossRef]
- Moayedi, H.; Mosavi, A. Suggesting a stochastic fractal search paradigm in combination with artificial neural network for early prediction of cooling load in residential buildings. Energies 2021, 14, 1649. [Google Scholar] [CrossRef]
- Liang, R.; Le-Hung, T.; Nguyen-Thoi, T. Energy consumption prediction of air-conditioning systems in eco-buildings using hunger games search optimization-based artificial neural network model. J. Build. Eng. 2022, 59, 105087. [Google Scholar] [CrossRef]
- Alkhazaleh, H.A.; Nahi, N.; Hashemian, M.H.; Nazem, Z.; Shamsi, W.D.; Nehdi, M.L. Prediction of Thermal Energy Demand Using Fuzzy-Based Models Synthesized with Metaheuristic Algorithms. Sustainability 2022, 14, 14385. [Google Scholar] [CrossRef]
- Le, L.T.; Nguyen, H.; Dou, J.; Zhou, J. A comparative study of PSO-ANN, GA-ANN, ICA-ANN, and ABC-ANN in estimating the heating load of buildings’ energy efficiency for smart city planning. Appl. Sci. 2019, 9, 2630. [Google Scholar] [CrossRef]
- Tien Bui, D.; Moayedi, H.; Anastasios, D.; Kok Foong, L. Predicting heating and cooling loads in energy-efficient buildings using two hybrid intelligent models. Appl. Sci. 2019, 9, 3543. [Google Scholar] [CrossRef]
- Guo, Z.; Moayedi, H.; Foong, L.K.; Bahiraei, M. Optimal modification of heating, ventilation, and air conditioning system performances in residential buildings using the integration of metaheuristic optimization and neural computing. Energy Build. 2020, 214, 109866. [Google Scholar] [CrossRef]
- Jahanafroozi, N.; Shokrpour, S.; Nejati, F.; Benjeddou, O.; Khordehbinan, M.W.; Marani, A.; Nehdi, M.L. New Heuristic Methods for Sustainable Energy Performance Analysis of HVAC Systems. Sustainability 2022, 14, 14446. [Google Scholar] [CrossRef]
- Seyedashraf, O.; Mehrabi, M.; Akhtari, A.A. Novel approach for dam break flow modeling using computational intelligence. J. Hydrol. 2018, 559, 1028–1038. [Google Scholar] [CrossRef]
- Zhao, Y.; Foong, L.K. Predicting Electrical Power Output of Combined Cycle Power Plants Using a Novel Artificial Neural Network Optimized by Electrostatic Discharge Algorithm. Measurement 2022, 198, 111405. [Google Scholar] [CrossRef]
- Mu’azu, M.A. Hybridized artificial neural network with metaheuristic algorithms for bearing capacity prediction. Ain Shams Eng. J. 2022, 14, 101980. [Google Scholar] [CrossRef]
- Elsisi, M. Future search algorithm for optimization. Evol. Intell. 2019, 12, 21–31. [Google Scholar] [CrossRef]
- Zhao, W.; Wang, L.; Zhang, Z. Atom search optimization and its application to solve a hydrogeologic parameter estimation problem. Knowl. -Based Syst. 2019, 163, 283–304. [Google Scholar] [CrossRef]
- Moosavi, S.H.S.; Bardsiri, V.K. Satin bowerbird optimizer: A new optimization algorithm to optimize ANFIS for software development effort estimation. Eng. Appl. Artif. Intell. 2017, 60, 1–15. [Google Scholar] [CrossRef]
- Klein, S.; Beckman, W.; Mitchell, J.; Duffie, J.; Duffie, N.; Freeman, T.; Mitchell, J.; Braun, J.; Evans, B.; Kummer, J. TRNSYS 17: A Transient System Simulation Program, Solar Energy Laboratory; University of Wisconsin: Madison, WI, USA, 2010. [Google Scholar]
- Chegari, B.; Tabaa, M.; Simeu, E.; Moutaouakkil, F.; Medromi, H. Multi-objective optimization of building energy performance and indoor thermal comfort by combining artificial neural networks and metaheuristic algorithms. Energy Build. 2021, 239, 110839. [Google Scholar] [CrossRef]
- Safayenikoo, H.; Nejati, F.; Nehdi, M.L. Indirect Analysis of Concrete Slump Using Different Metaheuristic-Empowered Neural Processors. Sustainability 2022, 14, 10373. [Google Scholar] [CrossRef]
- Mehrabi, M.; Pradhan, B.; Moayedi, H.; Alamri, A. Optimizing an adaptive neuro-fuzzy inference system for spatial prediction of landslide susceptibility using four state-of-the-art metaheuristic techniques. Sensors 2020, 20, 1723. [Google Scholar] [CrossRef]
- Kashan, A.H. A new metaheuristic for optimization: Optics inspired optimization (OIO). Comput. Oper. Res. 2015, 55, 99–125. [Google Scholar] [CrossRef]
- Bouchekara, H.R. Electrostatic discharge algorithm: A novel nature-inspired optimisation algorithm and its application to worst-case tolerance analysis of an EMC filter. IET Sci. Meas. Technol. 2019, 13, 491–499. [Google Scholar] [CrossRef]
- Masugi, M. Multiresolution analysis of electrostatic discharge current from electromagnetic interference aspects. IEEE Trans. Electromagn. Compat. 2003, 45, 393–403. [Google Scholar] [CrossRef]
- Hassoun, M.H. Fundamentals of Artificial Neural Networks; MIT Press: Cambridge, MA, USA, 1995. [Google Scholar]
- Reed, R.; MarksII, R.J. Neural Smithing: Supervised Learning in Feedforward Artificial Neural Networks; Mit Press: Cambridge, MA, USA, 1999. [Google Scholar]
- Moayedi, H.; Mehrabi, M.; Mosallanezhad, M.; Rashid, A.S.A.; Pradhan, B. Modification of landslide susceptibility mapping using optimized PSO-ANN technique. Eng. Comput. 2019, 35, 967–984. [Google Scholar] [CrossRef]
- Wu, D.; Foong, L.K.; Lyu, Z. Two neural-metaheuristic techniques based on vortex search and backtracking search algorithms for predicting the heating load of residential buildings. Eng. Comput. 2022, 38, 647–660. [Google Scholar] [CrossRef]
- Almutairi, K.; Algarni, S.; Alqahtani, T.; Moayedi, H.; Mosavi, A. A TLBO-Tuned Neural Processor for Predicting Heating Load in Residential Buildings. Sustainability 2022, 14, 5924. [Google Scholar] [CrossRef]
- Rastbod, S.; Rahimi, F.; Dehghan, Y.; Kamranfar, S.; Benjeddou, O.; Nehdi, M.L. An Optimized Machine Learning Approach for Forecasting Thermal Energy Demand of Buildings. Sustainability 2023, 15, 231. [Google Scholar] [CrossRef]
- Mehrabi, M.; Moayedi, H. Landslide susceptibility mapping using artificial neural network tuned by metaheuristic algorithms. Environ. Earth Sci. 2021, 80, 804. [Google Scholar] [CrossRef]
- Zhang, C.; Ali, A.; Sun, L. Investigation on low-cost friction-based isolation systems for masonry building structures: Experimental and numerical studies. Eng. Struct. 2021, 243, 112645. [Google Scholar] [CrossRef]
- Zhang, Z.; Li, W.; Yang, J. Analysis of stochastic process to model safety risk in construction industry. J. Civ. Eng. Manag. 2021, 27, 87–99. [Google Scholar] [CrossRef]
- Guo, C.; Ye, C.; Ding, Y.; Wang, P. A multi-state model for transmission system resilience enhancement against short-circuit faults caused by extreme weather events. IEEE Trans. Power Deliv. 2020, 36, 2374–2385. [Google Scholar] [CrossRef]
- Lin, C.; Wang, J. Metaheuristic-designed systems for simultaneous simulation of thermal loads of building. Smart Struct. Syst. 2022, 29, 677–691. [Google Scholar]
- Nguyen, H.; Mehrabi, M.; Kalantar, B.; Moayedi, H.; Abdullahi, M.A.M. Potential of hybrid evolutionary approaches for assessment of geo-hazard landslide susceptibility mapping. Geomat. Nat. Hazards Risk 2019, 10, 1667–1693. [Google Scholar] [CrossRef]
- Zhou, G.; Moayedi, H.; Foong, L.K. Teaching–learning-based metaheuristic scheme for modifying neural computing in appraising energy performance of building. Eng. Comput. 2021, 37, 3037–3048. [Google Scholar] [CrossRef]


Disclaimer/Publisher’s Note: The statements, opinions and data contained in all publications are solely those of the individual author(s) and contributor(s) and not of MDPI and/or the editor(s). MDPI and/or the editor(s) disclaim responsibility for any injury to people or property resulting from any ideas, methods, instructions or products referred to in the content. |
© 2023 by the authors. Licensee MDPI, Basel, Switzerland. This article is an open access article distributed under the terms and conditions of the Creative Commons Attribution (CC BY) license (https://creativecommons.org/licenses/by/4.0/).