Article

Dynamics of Territorial Spatial Pattern and Landscape Impact under Different Economic Gradients: A Case Study of the Beijing-Tianjin-Hebei (BTH) Region, China

School of Public Administration and Policy, Renmin University of China, Beijing 100872, China
*
Author to whom correspondence should be addressed.
Sustainability 2023, 15(1), 259; https://doi.org/10.3390/su15010259
Submission received: 10 November 2022 / Revised: 16 December 2022 / Accepted: 21 December 2022 / Published: 23 December 2022

Abstract

:
This study analyzes territorial spatial pattern changes and landscape pattern changes under different economic development gradients in 1980, 1990, 2000, 2010 and 2018 in the Beijing-Tianjin-Hebei (BTH) region of China. Then it discusses the relationship between territorial area and landscape patterns. The results indicate that: (1) area changes for middle- and low-development regions are characterized by “continuous shrinkage of agricultural space, continuous expansion of urban space, and a decrease followed by an increase of ecological space”; (2) the higher the level of regional economic development, the more severe the spatial change of national territory; (3) the common trend of structural transformation is the obvious flow of agricultural production space into rural living space and urban space—the difference is that the outflow of ecological space in low-development regions is more than the inflow, while the opposite holds true in medium- and high-development regions; and (4) the fragmentation degree of middle- and low-development regions is increasing, while that of high-development regions is decreasing. With the increase in regional economic development, the degree of spread and diversity decreases and increases, respectively. The correlation between territorial spatial pattern and landscape metrics shows distinct regional differences.

1. Introduction

With the advancement of global urbanization, various resources and production factors continue to flow and be reallocated [1], and the spatial distribution pattern of human economic and social activities has undergone significant changes. According to the UN-Habitat World Cities Report, 4.379 billion people are living in cities around the world, and the urbanization rate has reached 56.2% and is projected to increase to about 62% in 2035 [2]. Affected by the process of urbanization, the territorial spatial pattern of many countries or regions has changed dramatically. Especially in developing countries, the shift between spaces is more pronounced as a result of the increased demand for food due to large population growth and the continued expansion of the demand for construction land due to economic development [3,4,5].
From 1992 to 2020, China’s urban space growth was approximately 1.1 × 10⁵ km2, the most of any country in the world. At the beginning of the 21st century, the area of cultivated land continued to decrease, and the reduction increased with fluctuations. Owing to the implementation of a policy “linking the increase of construction land with a decrease of arable land” (i.e., new urban construction land area is consistent with the rural construction land area reclaimed for arable land, so as to achieve no reduction of arable land) [6], the difference in the amount of cultivated land changed from a slow decrease to a positive slow increase, showing a small net increase. However, due to the need for urban construction, there is still a large amount of high-quality arable land and ecological land occupied [7], and so the outlook for the protection of agricultural production and ecological space is not optimistic. At the same time, the changing trend of China’s interregional territorial spatial pattern shows obvious differences by region. In the eastern, developed region, the spatial expansion of urban construction has slowed down, while in the northeast and western regions, the speed of urban development has increased. There are also significant differences in the speed of increase and decrease as well as the direction of cultivated land production, woodlands, grasslands, and other ecological spaces [8]. To ensure food security and ecological security, the Chinese government has sought to balance the protection and development of territorial space by formulating a comprehensive territorial space planning system.
The territorial spatial pattern is formed under the joint action of natural environmental and human activities, which not only has profound significance for the sustainable development of territorial resources but also is an important factor leading to the change of landscape patterns [9]. The types, magnitude, marginal features, and spatial distribution and configuration of landscapes constitute landscape patterns [10]. When the number, area, shape, and other characteristics of territorial space change and type succession occurs, the abovementioned landscape pattern elements are directly affected, resulting in structural and functional changes, which can reflect the tension between the social–economic system and natural ecosystem to a certain extent [11]. For example, population growth, agricultural mechanization, urban sprawl, traffic network construction, and other human activities intensify the competitive relationship among agriculture, ecology, and urban space; influence the original combination mode among patches, corridors, and matrices; change the material cycle and energy-flow path; and then lead to the fragmentation, heterogeneity, and complexity of the landscape, with ecosystem service values and functions also being disturbed [12]. Therefore, analyzing the evolutionary characteristics of landscape patterns, along with changes in territorial spatial patterns, is helpful for identifying the impact of urbanization on the ecological environment, thereby providing a scientific basis for natural-resource government departments to formulate green and sustainable land management policies.
Promoting the construction of ecological conservation from the perspective of optimizing territorial space pattern has become a research focus. To formulate a well-developed, territorial spatial planning system, it is necessary to understand the evolution of the territorial spatial pattern. Therefore, a large number of studies have been conducted to identify the spatiotemporal variation characteristics of the territorial spatial pattern, and to analyze the influencing factors of spatial pattern changes. Previous studies have shown that the main change characteristic of urban spaces is outward expansion, and under the influence of industrial development, transportation construction, and other factors, the urban structure has changed from single-center to multi-center [13]. In the meantime, urban sprawl also affects industry and transportation development [14]. European cities have increased their urban coverage by 78% since the 1950s, mostly in the form of low-density zones, resulting in outward extension of the original urban areas, and there are differences in the effects of the built-up area expansion on the promotion of economic development between different functional urban systems [15]. Due to obvious differences in endowment between regions, there are significant variations in agricultural space in terms of modernization level [16]. Influenced by urbanization, territorial spaces tend to undergo aggressive mutual transformation between urban and agricultural spaces, mainly manifesting in the inflow and outflow of construction land, cultivated land, and garden land [17,18]. This is true in China as well as other countries [19]. This is partly due to the ineffective supervision of land use by local governments, and if not controlled at the institutional level, it will hinder the realization of sustainable development of territorial space [20]. In addition, the increasing pressure on resources and the environment has led to a growing emphasis on the important role played by ecological space in ecosystem services, but most studies have focused on the impact of a particular type of ecological land, such as watersheds, on sustainable socio-economic development [21,22]. The spatial and temporal scale dependence on the drivers of land use change has also been studied, providing a scientific reference for land use decisions [23]. At present, researchers have developed many models to simulate the dynamic changes of territorial spatial patterns to support the decision-making processes of spatial planning, such as meta-cellular automata, the agent-based model (ABM), etc., and these are continuously optimized in practice to improve simulation accuracy and provide the basis for making scientific plans [24,25]. However, rather few studies have comprehensively analyzed the change characteristics of urban, agricultural, and ecological space from the perspective of economic development heterogeneity or have explored the ecological impact of the evolution of territorial spatial patterns in conjunction with the landscape pattern index [26].
Considering the above shortcomings, this study selects the Beijing-Tianjin-Hebei (BTH) region, a mega-urban agglomeration in northern China, as the research area. Taking the county-level administrative unit as the analysis scale, this study aims to (a) construct a conceptual framework of territorial spatial classification, (b) explore the temporal and spatial differentiation characteristics and landscape pattern changes of the evolution of the territorial spatial pattern at different levels of economic development, and (c) clarify the relationship between territorial dynamics and the changes in landscape patterns. This study extends existing research by systematically analyzing the temporal and spatial evolutionary trends of changes in urban space, agricultural space, and ecological space based on differences in spatial economic development gradients and their impacts on changes in landscape patterns. These findings could provide a scientific basis for building a spatial planning system with sustainable development as its core value.
The rest of the paper is structured as follows. The second section introduces the territorial space classification system and theoretical analysis framework used. The third section presents the research area and methods. The fourth section analyzes the evolution characteristics and landscape pattern changes of the territorial spatial pattern in BTH counties with different economic development gradients and identifies the relationship between them. The fifth section discusses the results, and the sixth section presents the conclusion.

2. Conceptual Framework

The territorial system theory of human-environment interaction holds that people and land are different but closely related. Land is the only material basis and space upon which human beings live. Geographical environment conditions play an important role in determining the type, intensity, and scope of human activities [27]. Meanwhile, under the influence of subjective initiative, people can take the initiative to understand, use, change, and protect their geographical environment so as to make the land serve humankind better. Therefore, the relationship between human activity and the geographical environment is not immutable but dynamically changing under the joint action of the material cycle and energy conversion and social evolution [28,29]. Territorial space is a geographical entity reflecting the human–environment relationship, which also follows the abovementioned change mechanism. The evolution of territorial space patterns reflects the interaction between the natural environment and social and economic activities in a certain region during a specific period of time.
A comprehensive analysis framework for territorial spatial patterns is shown in Figure 1, which consists of four parts: the area change range, intensity of spatial variation, the structural transition trend, and landscape formation. Each component is described in detail below.
Historically, territorial space has undergone slow and subtle changes over a long period of evolution. With the emergence, increase, and intensification of human production and living behaviors, the speed of change in territorial spatial patterns has begun to accelerate, and functional differentiation has occurred. The main function of the original geographical environment was to maintain the balance of the ecological system. The emergence of human civilization and the continuous development of urbanization has split the natural ecological space into a variety of functional spaces, such as agricultural production and urban construction, and the territorial spatial pattern has become increasingly complex. Since China’s reform and opening up, its modernization has been comprehensively promoted, and great changes have taken place in human–environment relations. The territorial spatial pattern is the response of the human–environment relationship in different stages of economic development to spatial entities, and is influenced by natural resources, geographical location, population economy, policy systems, and other geographical conditions [30,31]. Among them, natural factors are the basic conditions that influence national spatial types [32,33]; ecological spaces with characteristics of low altitude, gradual slope, and small topographic relief are less likely to maintain their use, and humans will gradually transform them into urban and agricultural space given the ease of cultivation, convenience of transportation, richness of resource endowment, and the formulation of development planning. As a result, due to the flow of labor force, capital, technology, and other production factors and the guidance of policies [31], the number and structure of territorial spaces change dynamically, and there is continuous adjustment of utilization mode and intensity, which has a certain impact on landscape morphology, forming a new distribution pattern of space. In terms of the time dimension, urbanization relies on a massive input of land resources at the initial stage of social development, attracting a large number of people and capital agglomeration, which further leads to the outward expansion of urban space. During this process, agriculture is an important foundation for urban construction. On the one hand, some high-quality agricultural production space becomes occupied by urban construction space. On the other hand, some ecological space becomes reclaimed as a supplement for cultivated land resources. The long-term advancement of urbanization has led to a continuous influx of population, which has driven the massive growth of infrastructure construction, road transport, and housing. China’s territorial spatial structure has changed [34], and the intensity of spatial change has increased. When sustainable development becomes the new norm and economic development changes from high-speed to high-quality [35], urbanization should not occur at the expense of ecological and agricultural space but needs to vigorously protect and restore the natural ecology so as to achieve the goal of the sustainable development of human society. At that time, the proportion of territorial space changes again, which inevitably leads to transformation among different space types. In summary, in the process of social development, territorial space undergoes iterative changes in quantity, structure, distribution, and form, resulting in new spatial patterns (Figure 1).

3. Materials and Methods
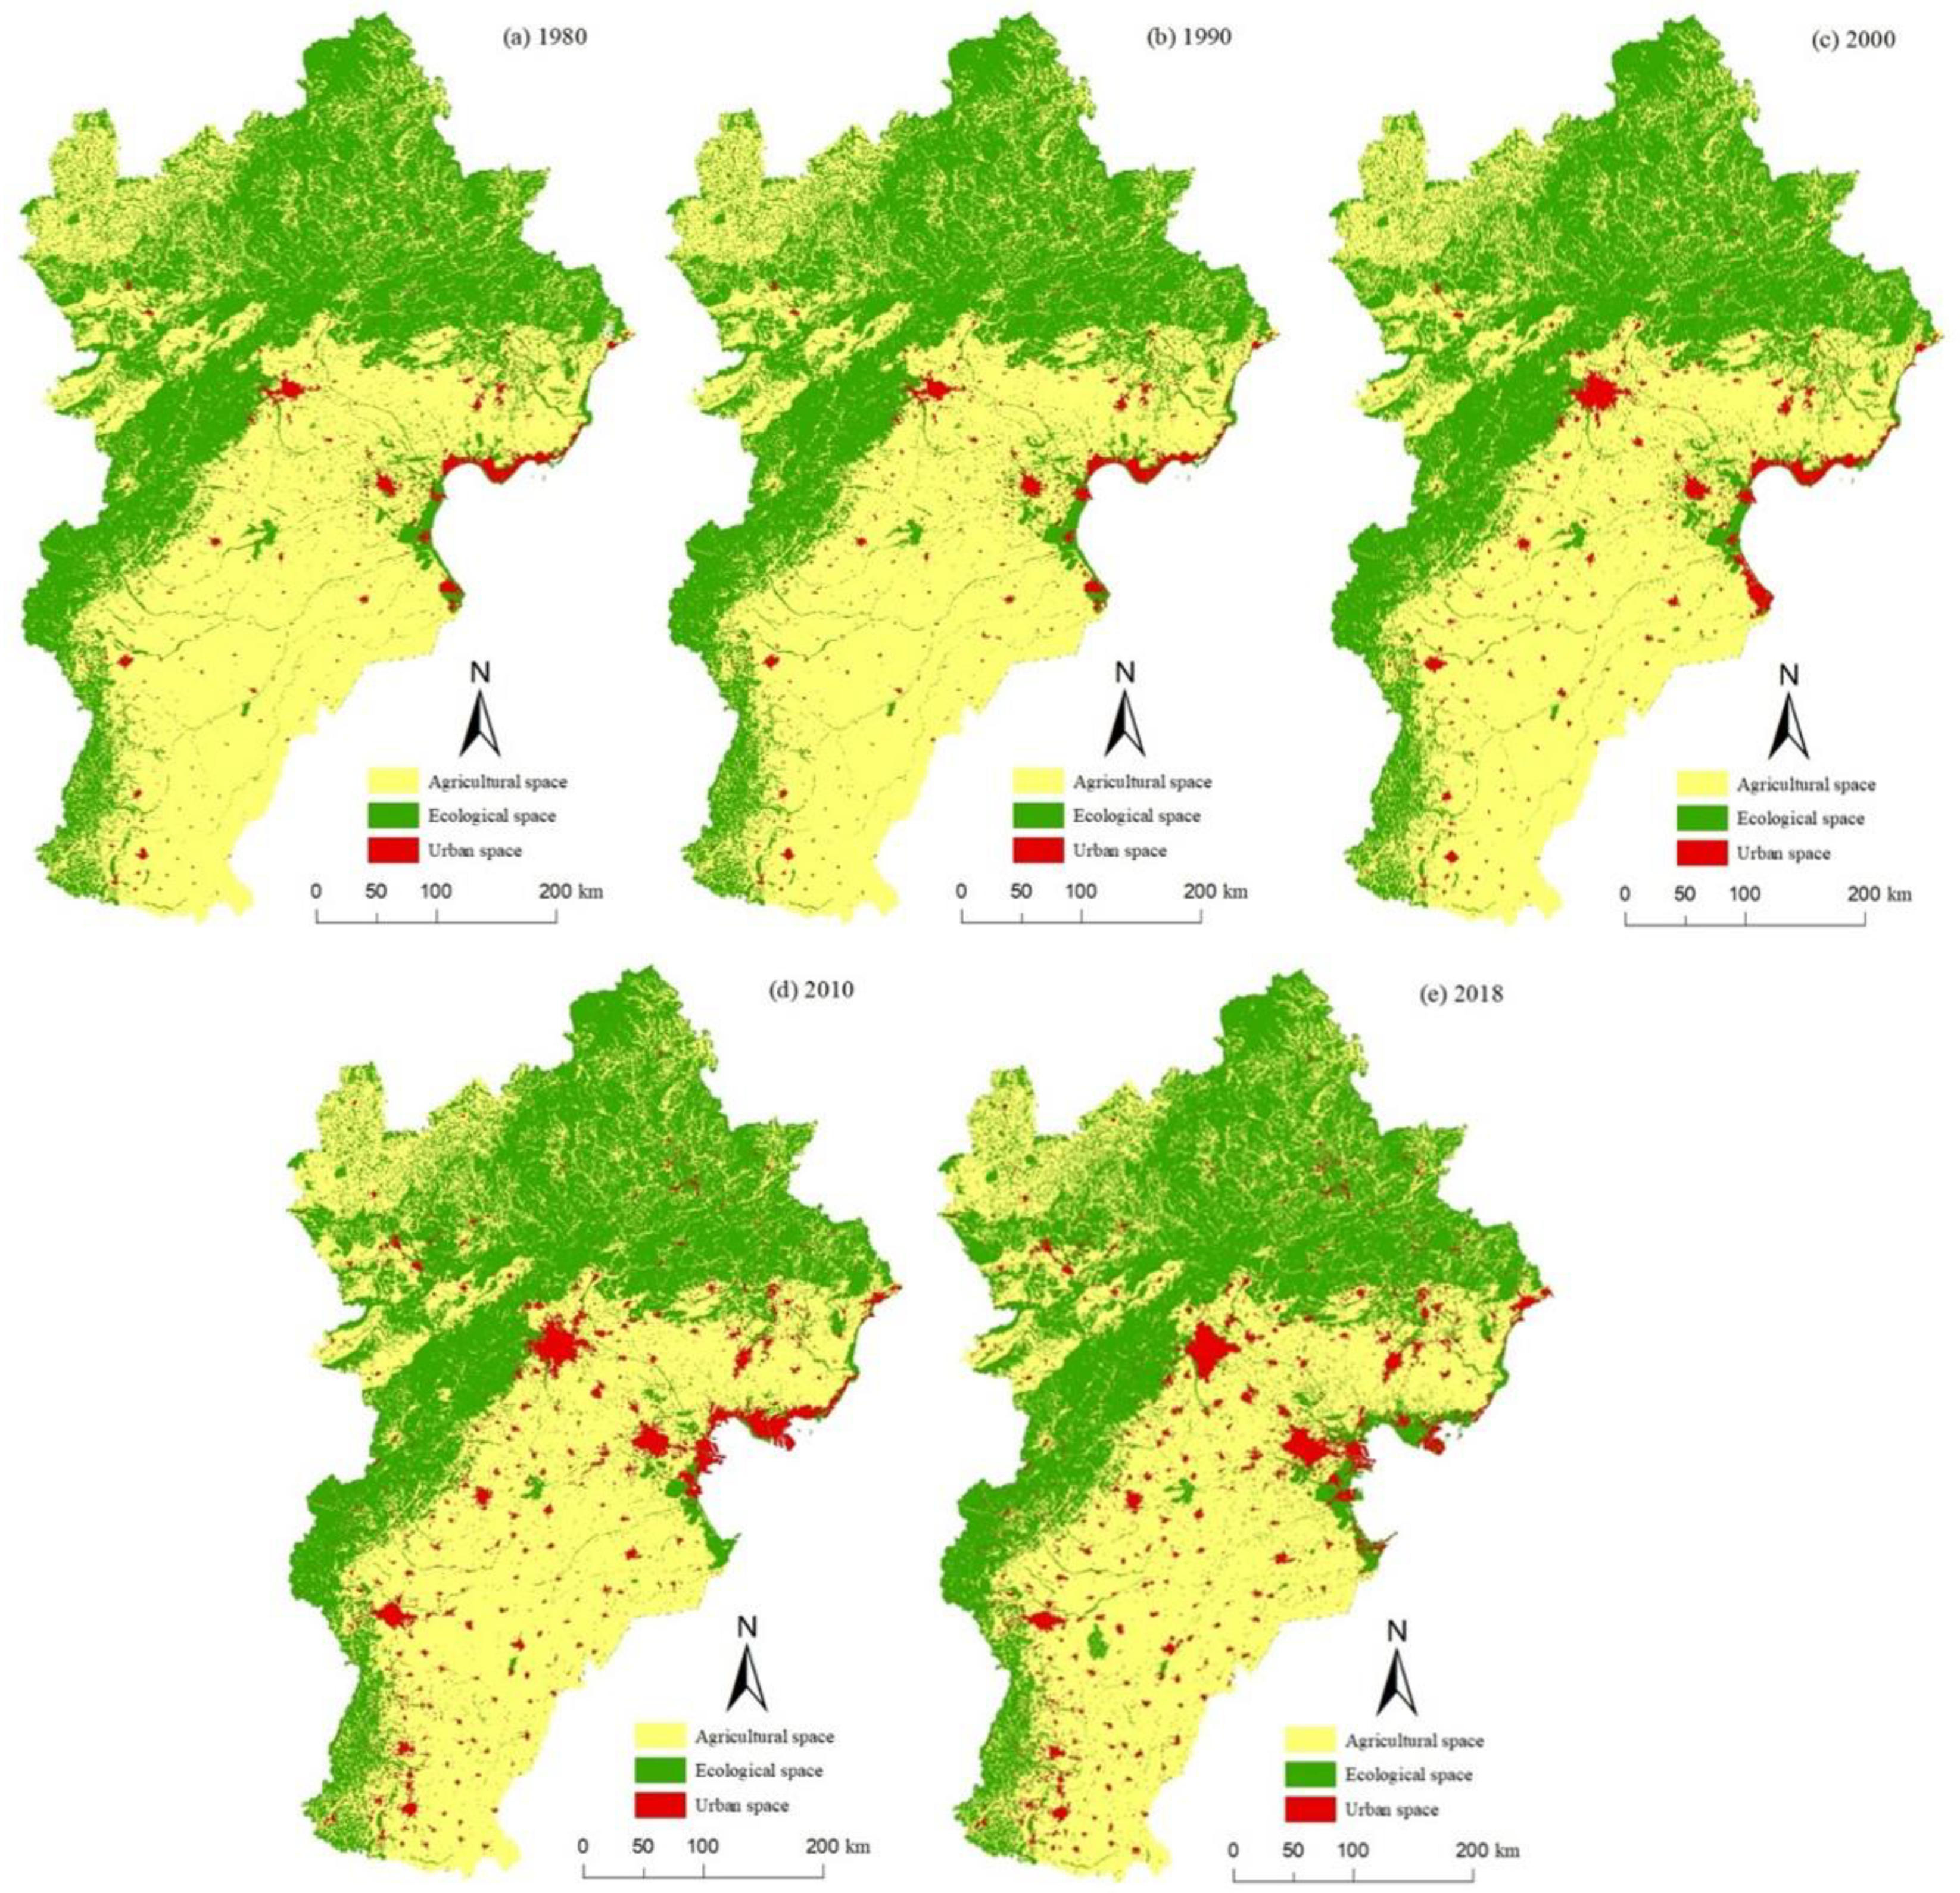
This section includes: study area; data sources; the territorial spatial classification system; and research methods. Each component is described in detail in the following subsections.

3.1. Study Area

The BTH region is located in northern China (36°05′ N–42°40′ N and 113°27′ E–119°50′ E) and has a continental monsoon climate. The area includes 199 county-level administrative units under the jurisdiction of the Beijing, Tianjin, and Hebei Provinces, with a total area of 218,000 square kilometers (km²) and a population of 113.1 million at the end of 2019. In recent years, owing to the rapid economic and industrial development of the BTH region, extensive land use has been prominent, resulting in serious air and water pollution problems and insufficient resources and environment-carrying capacity, restricting the balanced development of the region. To accelerate the construction of a regional integration pattern of the Beijing, Tianjin, and Hebei Provinces with “more reasonable regional economic structure, generally well ecological environment quality and balanced public service level,” the Outline of the Beijing-Tianjin-Hebei Coordinated Development Plan [36], reviewed and adopted by the Political Bureau of the CPC Central Committee in 2015, identified the need to accelerate industrial transformation, upgrading, and transfer docking; strengthen ecological environment protection and governance; and optimize the urban layout and spatial structure.
In view of the large differences in development levels within the BTH region which directly or indirectly affect the composition and evolution of territorial spatial patterns, this study intends to divide the BTH region into different economic development gradients to analyze the characteristics of regional territorial spatial patterns horizontally. By analyzing 27 variables of 101 countries in the economic and social database of the World Bank, the economist Hollis B. revealed the significance of per capita GRDP in the division of economic stages, making it the most common indicator to judge economic development stages internationally [37]. Therefore, the present study used the per capita GRDP index as the basis for the classification of the economic development gradient, and the per capita GRDP data of county (district) administrative units of the BTH region in 2019 as the classification basis. This study used the geometric interval classification method, which has the advantages of being specially used for continuous data, ensuring the same number of samples of all types, and integrating the advantages of the natural breakpoint method and quantile method. Specifically, we used this method to divide the BTH region into three levels: high development, medium development, and low development. Each level includes 24, 87, and 88 county-level administrative units, respectively (Figure 2).

3.2. Land Use/Land Cover Mapping

The land-use data in 1980, 1990, 2000, 2010, and 2018 were derived from the 30 × 30 m land-use remote sensing image database of the Resource and Environment Data Cloud Platform (https://www.resdc.cn/DOI/DOI.aspx?DOIID=54, accessed on 1 November 2021). The land-use/cover data of 1980, 1990, 2000, and 2010 were obtained by Landsat-TM/ETM images, and the land-use/cover data of 2018 were mainly generated through Landsat OTI images interpreted using manual visual interpretation. To improve the accuracy of interpretation and mapping, the remote sensing data of the above phases were selected from different sensor types and data of different phases in the same area. To consider seasonal differences between regions, images from early May to mid-October were selected for the area in this study to accurately distinguish different vegetation coverage. All images were geometrically corrected with an average position error of no more than 50 m [38], with an overall recognition accuracy of more than 95% [32]. Then, according to the land resources and their utilization attributes, the land resources were divided into six categories: cultivated land, forest land, grassland, water area, construction land, and unused land. Starting from the practicability of remote sensing monitoring, and closely combined with China’s county-level land-use status classification system, this classification system is convenient for connection and additional data processing between the monitoring results of land-cover remote sensing and the results of a conventional ground land-use survey, and has strong universality.

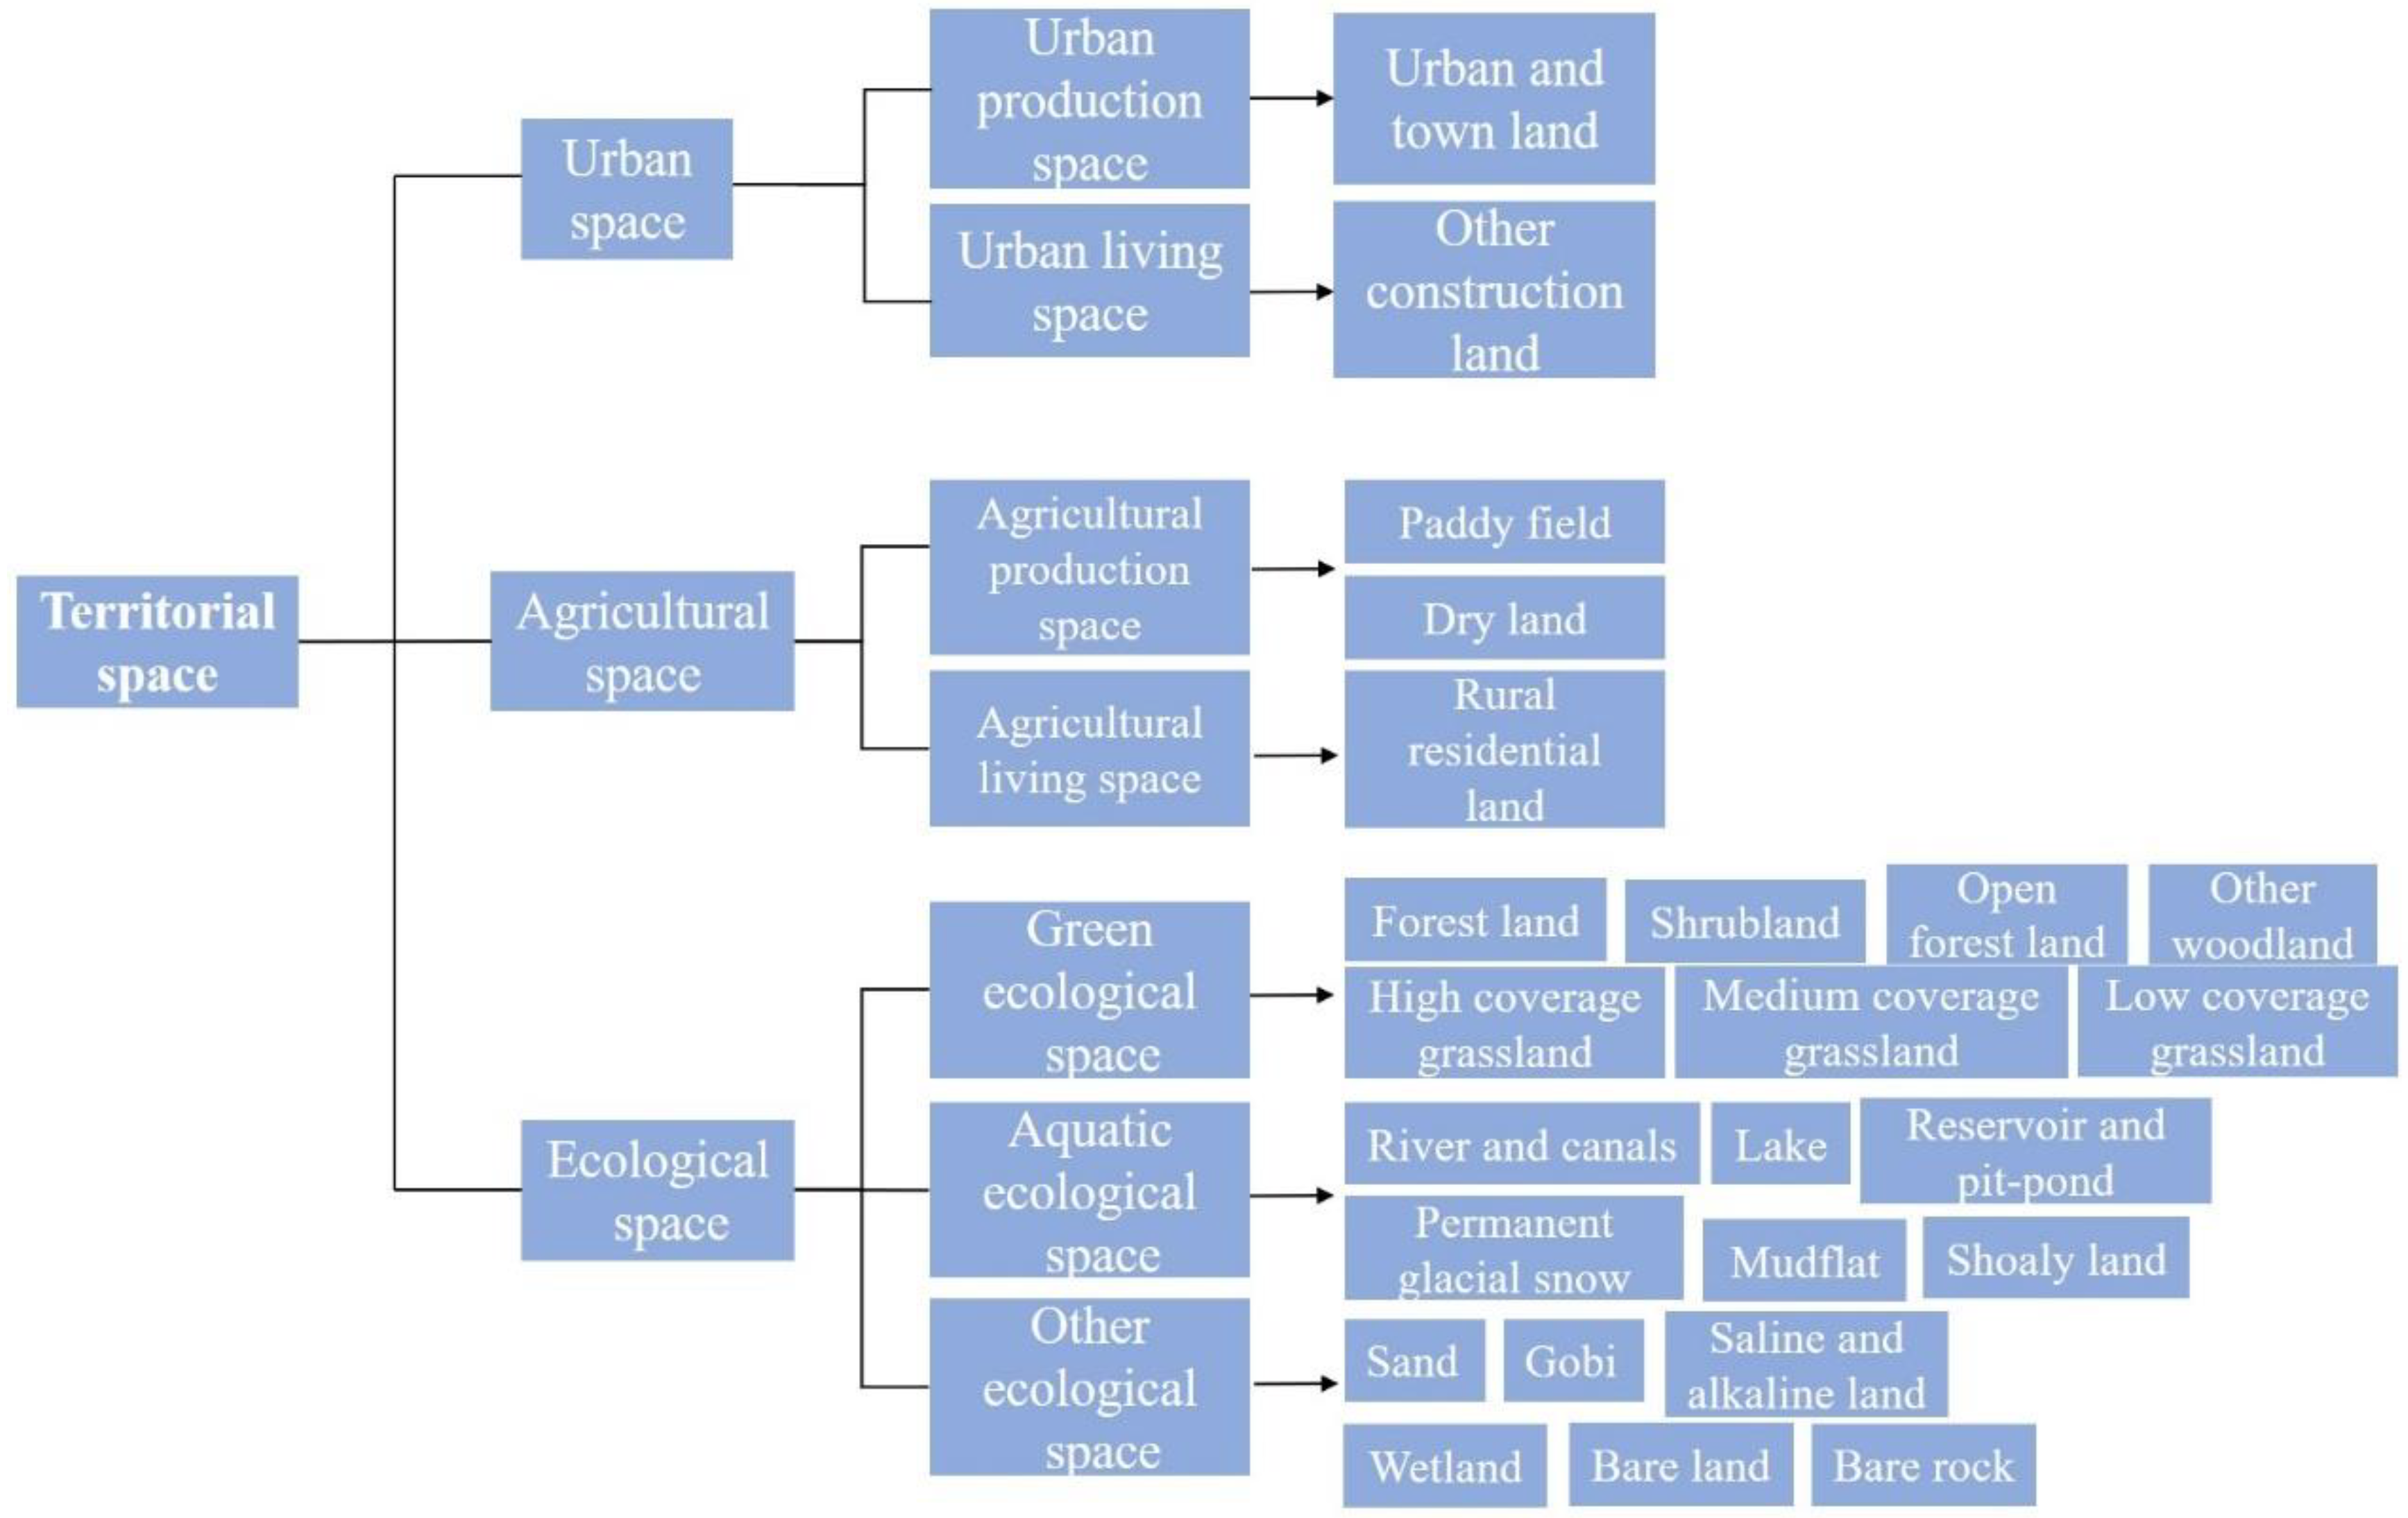
3.3. Construction of a Territorial Space Classification System

The classification of territorial space mainly serves for territorial space planning, different planning backgrounds, objectives, and tasks resulting in a diversity of territorial space classification standards. On account of the three-dimensional nature of territorial space, the Netherlands divides space into basic, network, and application layers. The basic layer mainly focuses on the natural, ecological environment; the network layer comprises the infrastructure network and transportation network; and the application layer mainly comprises cities and villages [39]. According to the functions of territorial space, Japan is divided into five zones (urban, agricultural, forest, natural park, and nature reserve) and implements differentiated regulation policies with gradation and refinement [40,41]. Germany divides urban land into four categories: residential, commercial, mixed, and special land; however, different types are not strictly independent and mutually exclusive. For example, under certain conditions of a license, residential land can provide public services, such as healthcare, culture, and religion, reflecting the distinctive characteristics of a mixed use of space [42].
Taking land resources as the carrier, China has formed a variety of territorial space-division methods according to the characteristics and purposes of different types of space utilization. The existing territorial space classification systems pay more attention to urban and rural space but ignore ecological space, while there is a lot of overlap and intersection in the classification results [43]. There are planning requirements for “scientific and orderly overall layout of ecological, agricultural, and urban space” put forward in the Several Opinions on Establishing Territorial Spatial Planning System and Supervising the Implementation [44], jointly issued by the CPC Central Committee and the State Council in 2019. Based on that classification, this study divides the territorial space of the BTH region into urban, agricultural, and ecological space, which is consistent with the top-level design of the national space planning system. Then, considering the multiple functions of territorial space and the dominance of spatial function [45], urban space is divided into urban production space and urban living space; agricultural space is divided into agricultural production space and agricultural living space; and ecological space is divided into green space, water space, and other ecological space. Then, the type-merging method is used to connect the abovementioned spatial types to China’s land use/cover classification remote sensing monitoring data classification system, forming the territorial space classification system shown in Figure 3. The system not only meets the requirements of territorial spatial zoning and is consistent with the research results on existing spatial function identification [46], but also facilitates practical operations, such as the identification, extraction, and summary of various spatial areas, which reflects its strategic and scientific nature.

3.4. Methods

The appropriate method is selected to measure the changing characteristics of the territorial spatial pattern according to the theoretical framework established in the second section, and the connection between them is shown in Figure 4, which will be described in detail.

3.4.1. Area Changes of Territorial Space

This study calculated the area changes of urban, agricultural, and ecological space in the BTH region over time from 1980 to 1990, 1990 to 2000, 2000 to 2010, and 2010 to 2018, and reflected the expansion or contraction speeds of various types of space through the change rate of the area. The change and change rate of territorial space were calculated as follows [9]:
Δ S m = S m t 2 S m t 1
s m = S m t 2 S m t 1 S m t 1 × 100 %
In the formula, Δ S m is the area change of m spatial types, and s m is the area change rate of m spatial types. S m t 1 and S m t 2 are the areas of m spatial types in t1 and t2, respectively (t1 = 1980, 1990, 2000, 2010; t2 = 1990, 2000, 2010, 2018).

3.4.2. Comprehensive Dynamic Index for Territorial Space

The comprehensive dynamic degree of territorial space can represent the strength of the change of territorial space structure and reflect the overall situation of regional territorial space change through the magnitude of the index. Based on previous discussion in the literature on the land-use change index model methodology, the improved dynamic index was used for the calculation [47]. The formula is as follows:
L C T = i = 1 n Δ L U i j i = 1 n L U i × 100 %
L U i is the area of class i territorial space at the beginning of the study period, and Δ L U i j is the area of class i territorial space turning into non-class i territorial space (j = 1, 2, 3…n); T is the research period. In this study, T is 28.

3.4.3. Territorial Type Transfer Matrix

The territorial type transfer matrix can describe the structural characteristics of regional spatial change and the direction of each spatial type change in detail and reflect the specific characteristics of regional spatial change by analyzing the transition between spatial types. The form of the transfer matrix is [48]:
S i j = S 11 S 1 n S n 1 S n n
S represents the area, n represents the number of territorial space types, and S i j represents the total area from category I territorial space at the beginning of the study to category j territorial space at the end of the study.

3.4.4. Landscape Pattern Analysis

In a broad sense, landscape can be understood as spatial units with heterogeneity or patchy characteristics on different scales [49,50,51]. In a narrow sense, it refers to heterogeneous geographical units with repetitive patterns composed of different types of ecosystems in a certain range [52]. Landscape pattern is the result of multiple factors, such as nature and culture at different time and space scales which overlap with land use and cover in space, and is directly affected by land use and cover change. There are two main methods for landscape pattern analysis: the landscape index and spatial statistics methods. The landscape index is widely used to reflect structural composition and spatial configuration through quantitative metrics that can highly concentrate landscape pattern information [53]. Based on previous studies, Su et al. (2014) [54] summarized three selection principles of landscape metrics: (1) metrics should reflect different aspects of landscape pattern characteristics, such as area, shape, diversity, etc.; (2) metrics should not be highly redundant; and (3) metrics should have been applied in related studies. Given the abovementioned principles, this study synthesized the existing research and selected metrics related to the characteristics of landscape pattern fragmentation, connectivity, and heterogeneity. The PARA-area ratio (PARA), patch density (PD), aggregation index (AI), contagion index (CONTAG), and Shannon’s diversity index (SHDI) were used to analyze the landscape pattern of the BTH region using FRAGSTATS 4.2 (Table 1).

3.4.5. The Interaction between Territorial Spatial Change and Landscape Pattern

The Pearson correlation coefficient method was used to analyze the relationship between territorial spatial change and landscape pattern. A change of territorial space causes the change of corresponding landscape elements, thereby resulting in a change of landscape pattern characteristics [55]. Therefore, the area and landscape pattern index data of urban, agricultural, and ecological spaces during the study period were used to explore the impact of territorial spatial changes with different economic gradients on landscape fragmentation, diversity, and aggregation.
r x y = X X ¯ Y Y ¯ i = 1 m X i X ¯ 2 j = 1 n Y j Y ¯ 2 r x y represents the Pearson correlation coefficient between territorial change and landscape pattern. X is the area of i spatial types, Y is the landscape pattern index of j types, and X ¯ , Y ¯ are their average values, respectively.

4. Results

4.1. Evolution of Territorial Space Area

As shown in Table 2 and Figure 5, we studied the area changes of urban, agricultural, and ecological territorial space in the BTH region in 1980, 1990, 2000, 2010, and 2018. The results show that the territorial space of different economic gradients has changed significantly, and there are some differences. Overall, the area changes in urban space and agricultural space were significant, with an increase of 7849 km² and a decrease of 6836 km², respectively, while the change of ecological space was not obvious. In the development region, urban space continued to increase from 1980 to 2018, and the sharpest increase occurred from 2000 to 2010; the decreasing trend of agricultural space was accelerated with time; the ecological space decreased at first and then increased. In the middle-development region, the urban, agricultural, and ecological space showed a similar change trend as that in the low-development region, but the area of urban space increased and the area of agricultural space decreased more than that in the low-development region. It is noteworthy that the high-development areas have undergone different changes from the first two regions. First, the area of urban space experienced negative growth from 2010 to 2018. Second, the ecological space decreased only from 2000 to 2010, and increased in other periods, reaching the maximum growth rate of 31.93% after 2010. Third, the change range of the agricultural spatial area was the largest.

4.2. Evolution of Territorial Spatial Change Intensity

Table 3 presents the comprehensive dynamic index of territorial space in three kinds of regions with different development levels. The results indicate that regional territorial space changes are more drastic with a higher level of economic development. During the period 1980–2018, 18.99% of the territorial space in the low-development region changed, while nearly one-third of the territorial space in the medium-development region changed, and the index reached 73.69% in the high-development region. The comprehensive dynamic index of different time periods also conformed to the above characteristics, and as time went by, the comprehensive dynamic index of the three types of development regions gradually increased. This trend diverged after 2010. From 2010 to 2018, only the high-development region showed more active territorial and spatial changes, with the composite dynamic index of the medium- and low-development regions decreasing by 57% and 33%, respectively. Changes in urban production space and agricultural production space were more severe than those of other spaces and had a greater impact on the comprehensive dynamic index.

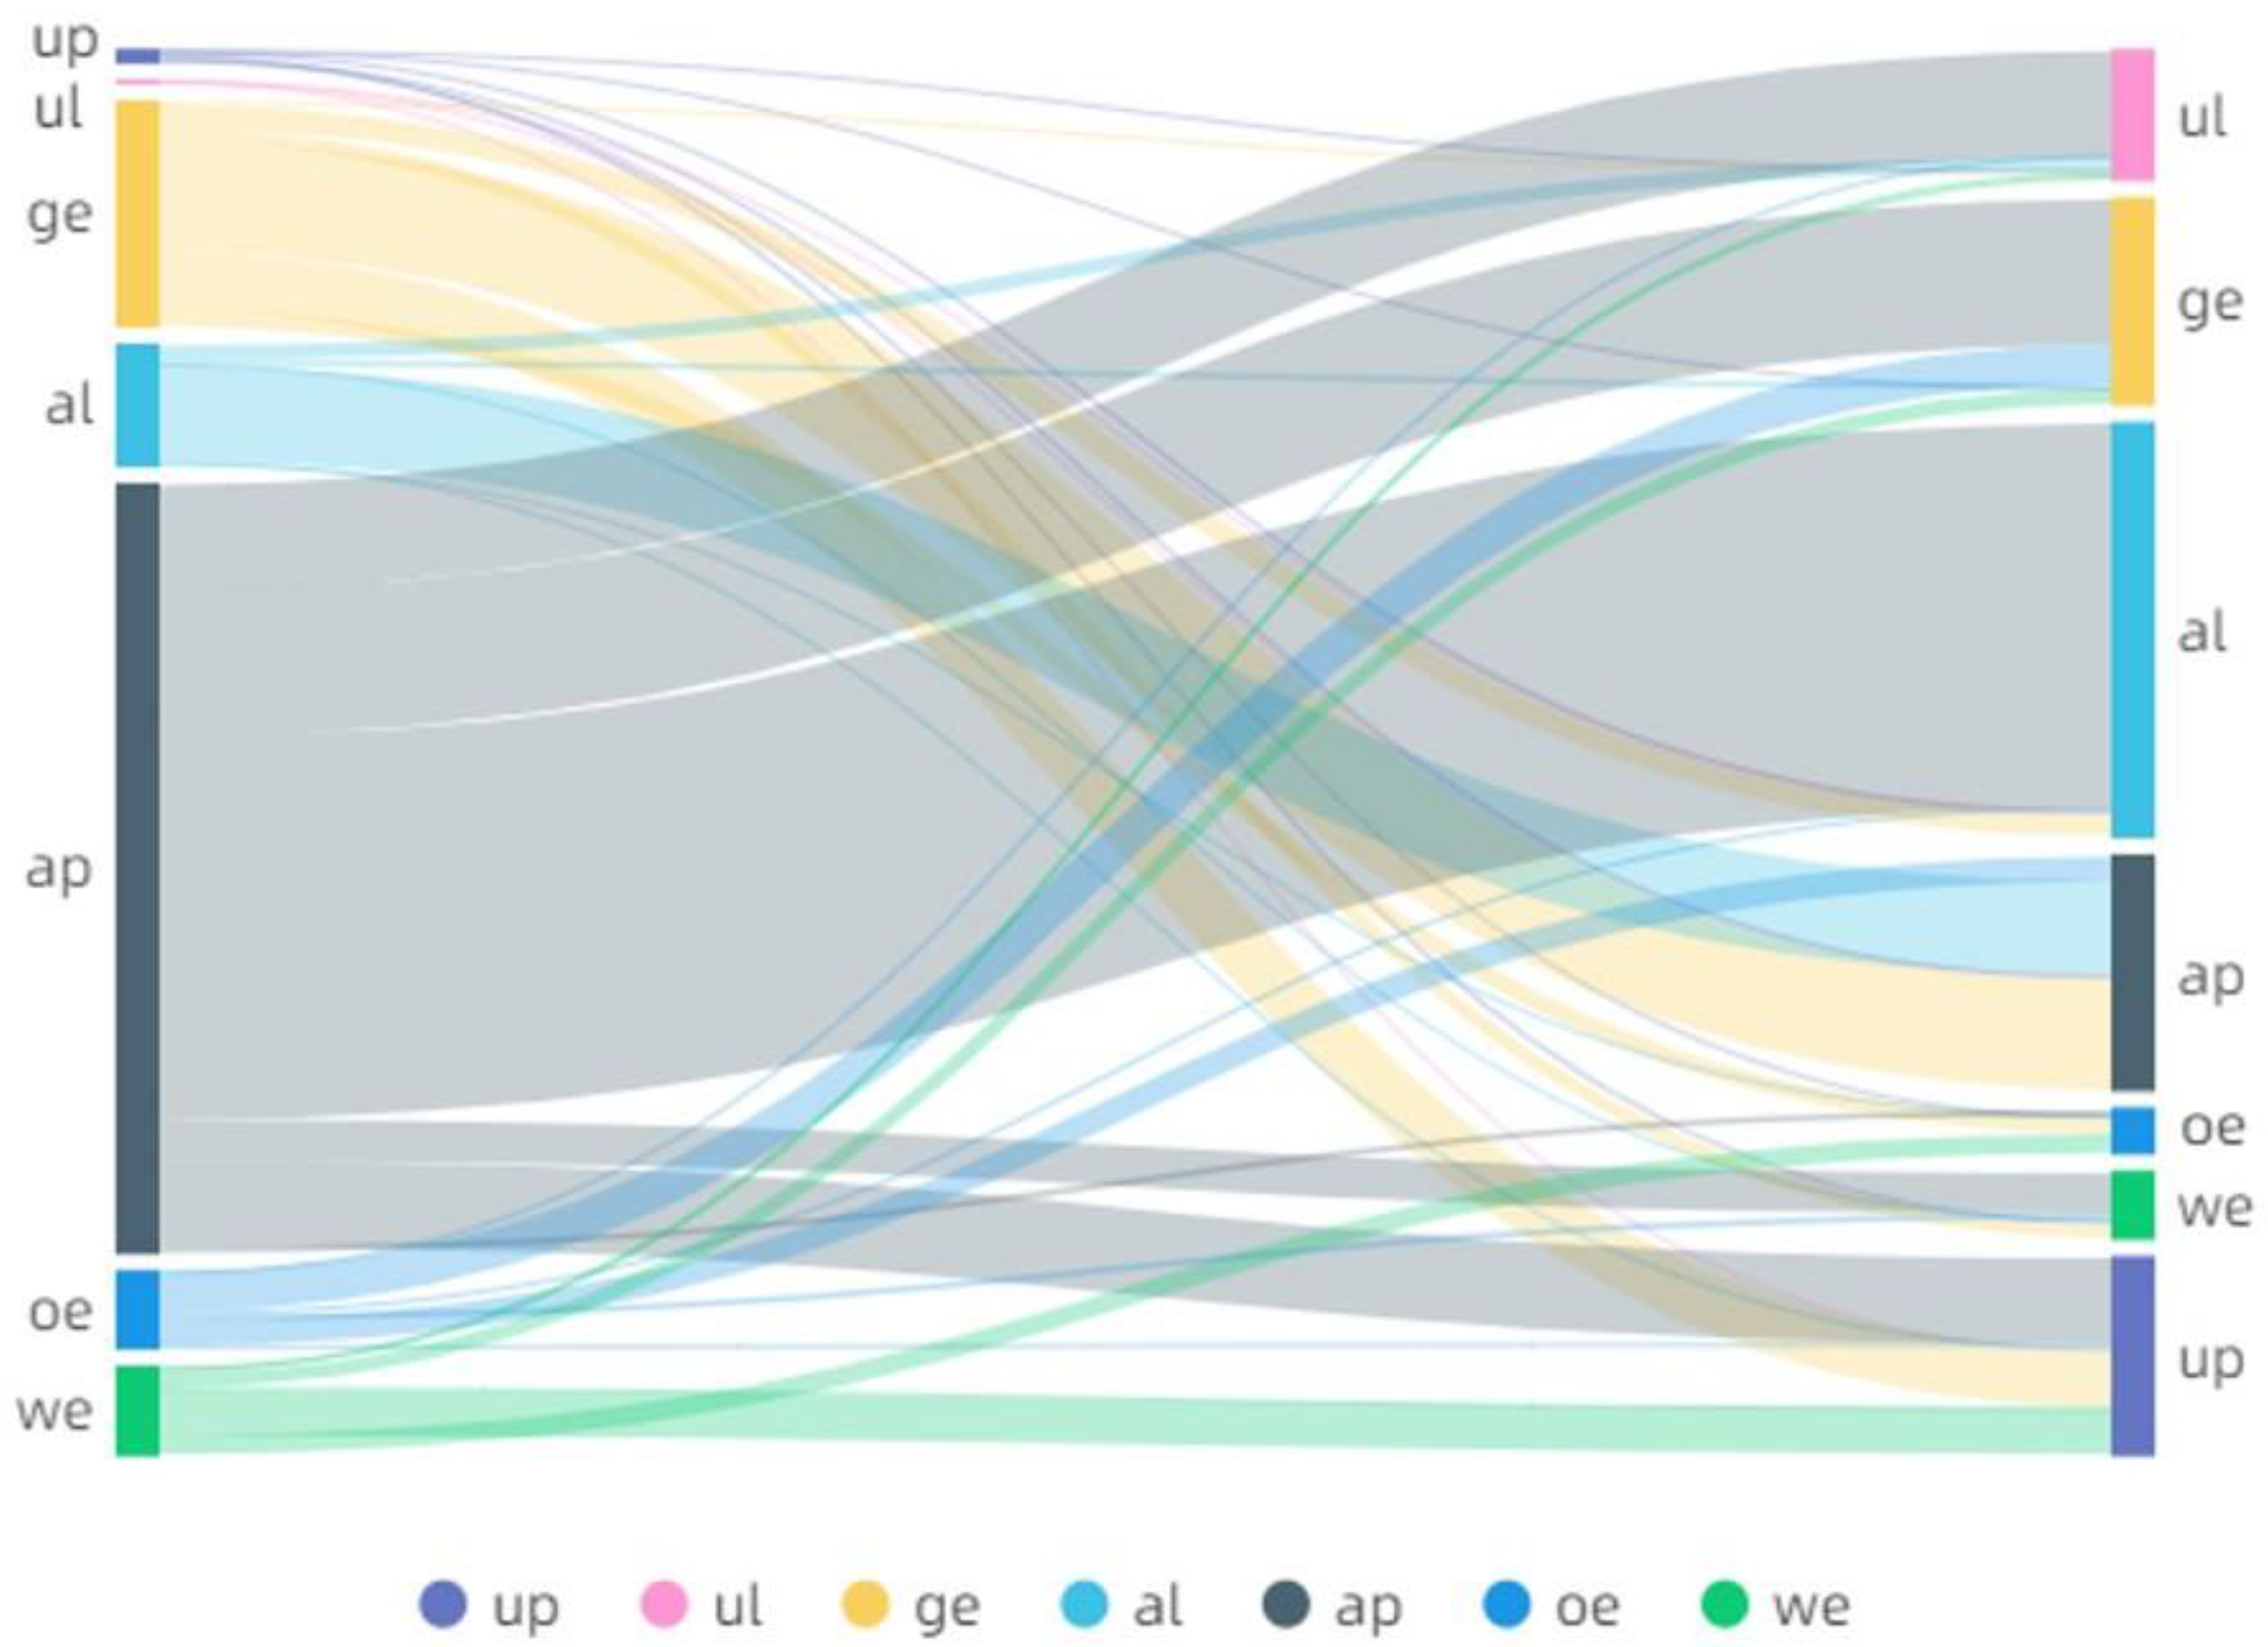
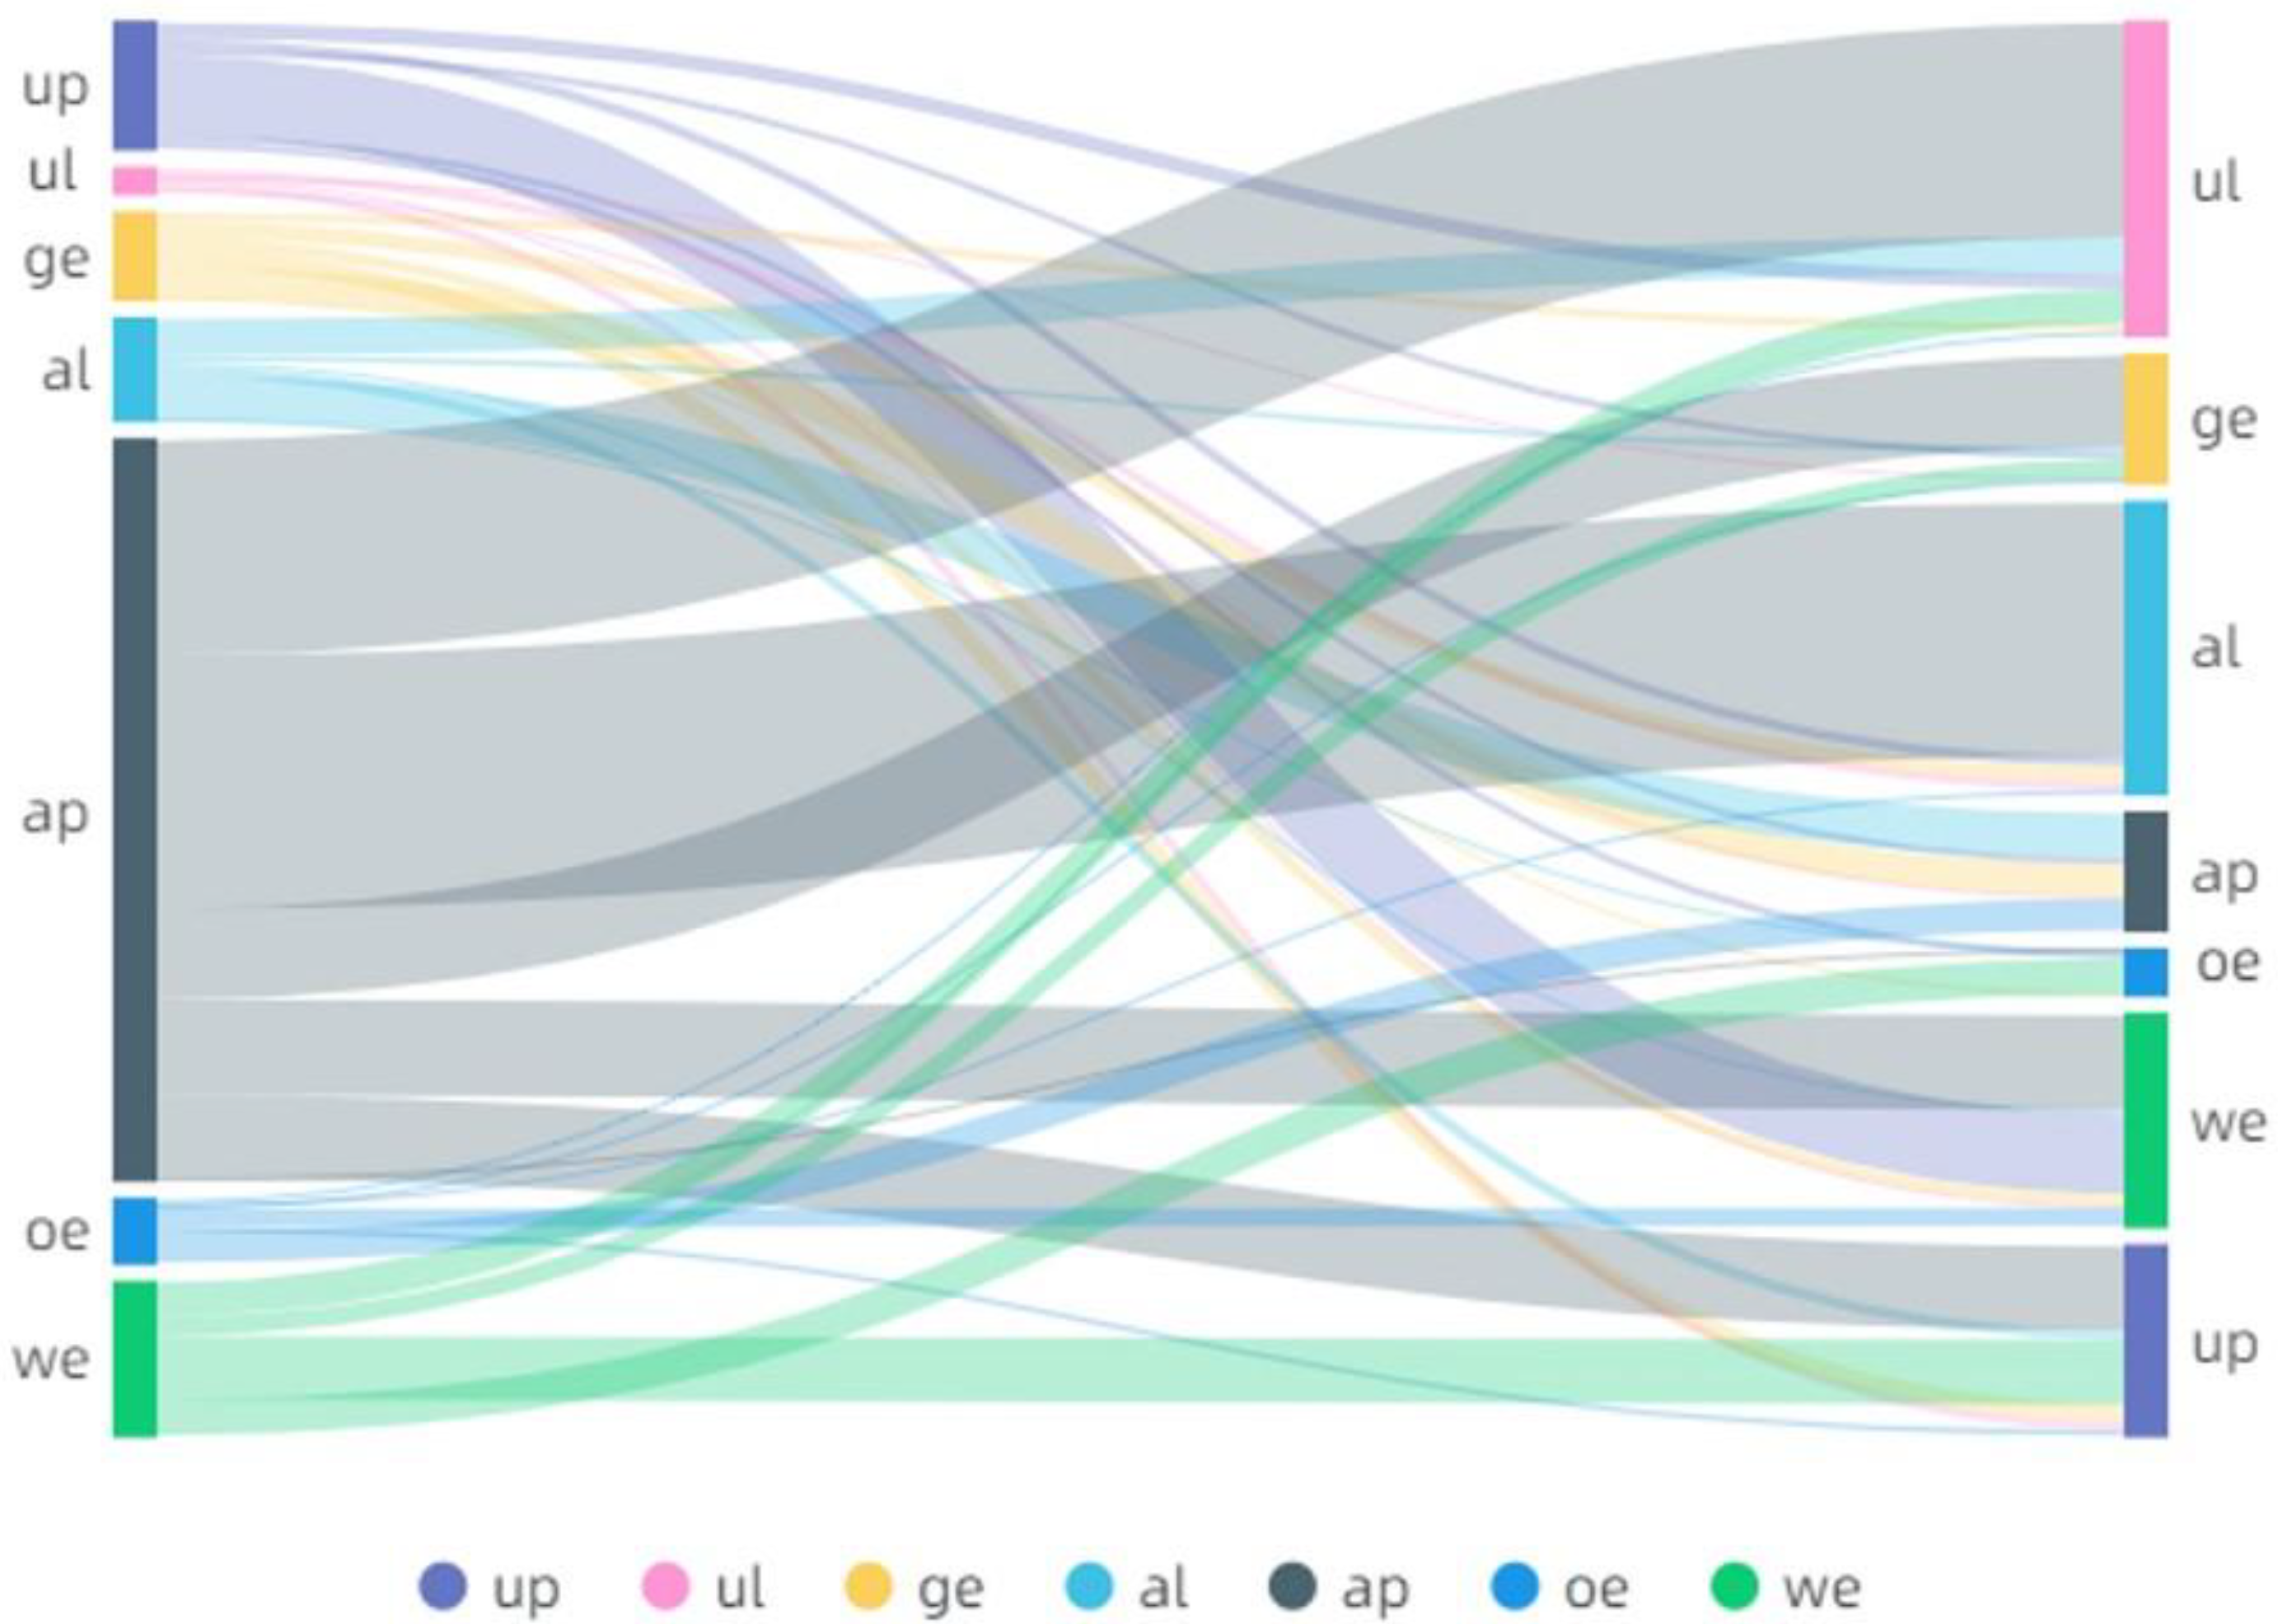
4.3. Structural Transformation and Evolution of Territorial Space Types

Taking the secondary spatial classification as the object, the spatial area transfer matrix was used to analyze the spatial structure changes of the BTH region with different economic gradients. The results are shown in Figure 6, Figure 7 and Figure 8. The three types of regions show different transformation patterns, and the similarities are as follows: (1) there was a high degree of mutual transformation of territorial use types within agricultural space, which finally manifested as a transformation from agricultural production space to rural living space; (2) the area of agricultural production space that shifted to urban production and urban living space was large, and was the main source of urban space expansion; (3) agricultural production space was the main turning direction of other ecological space; and (4) the one-way transition of urban living space was obvious. The differences are as follows: (1) the area of green ecological space in relation to urban production and agricultural production spaces in the low- and medium-development regions was more than that in high-development regions; (2) the conversion of water ecological space and agricultural production space was common, and the amount of conversion of water ecological space and agricultural production space was almost the same in the low-development region, while in the middle- and high-development regions, it manifested in an increase in water ecological space, and the ecological protection effect was more prominent; and (3) water ecological space in the middle- and high-development regions was increasing on the whole, and it was mainly transferred from urban production space, but in the low-development region, the scope of such space was reduced.

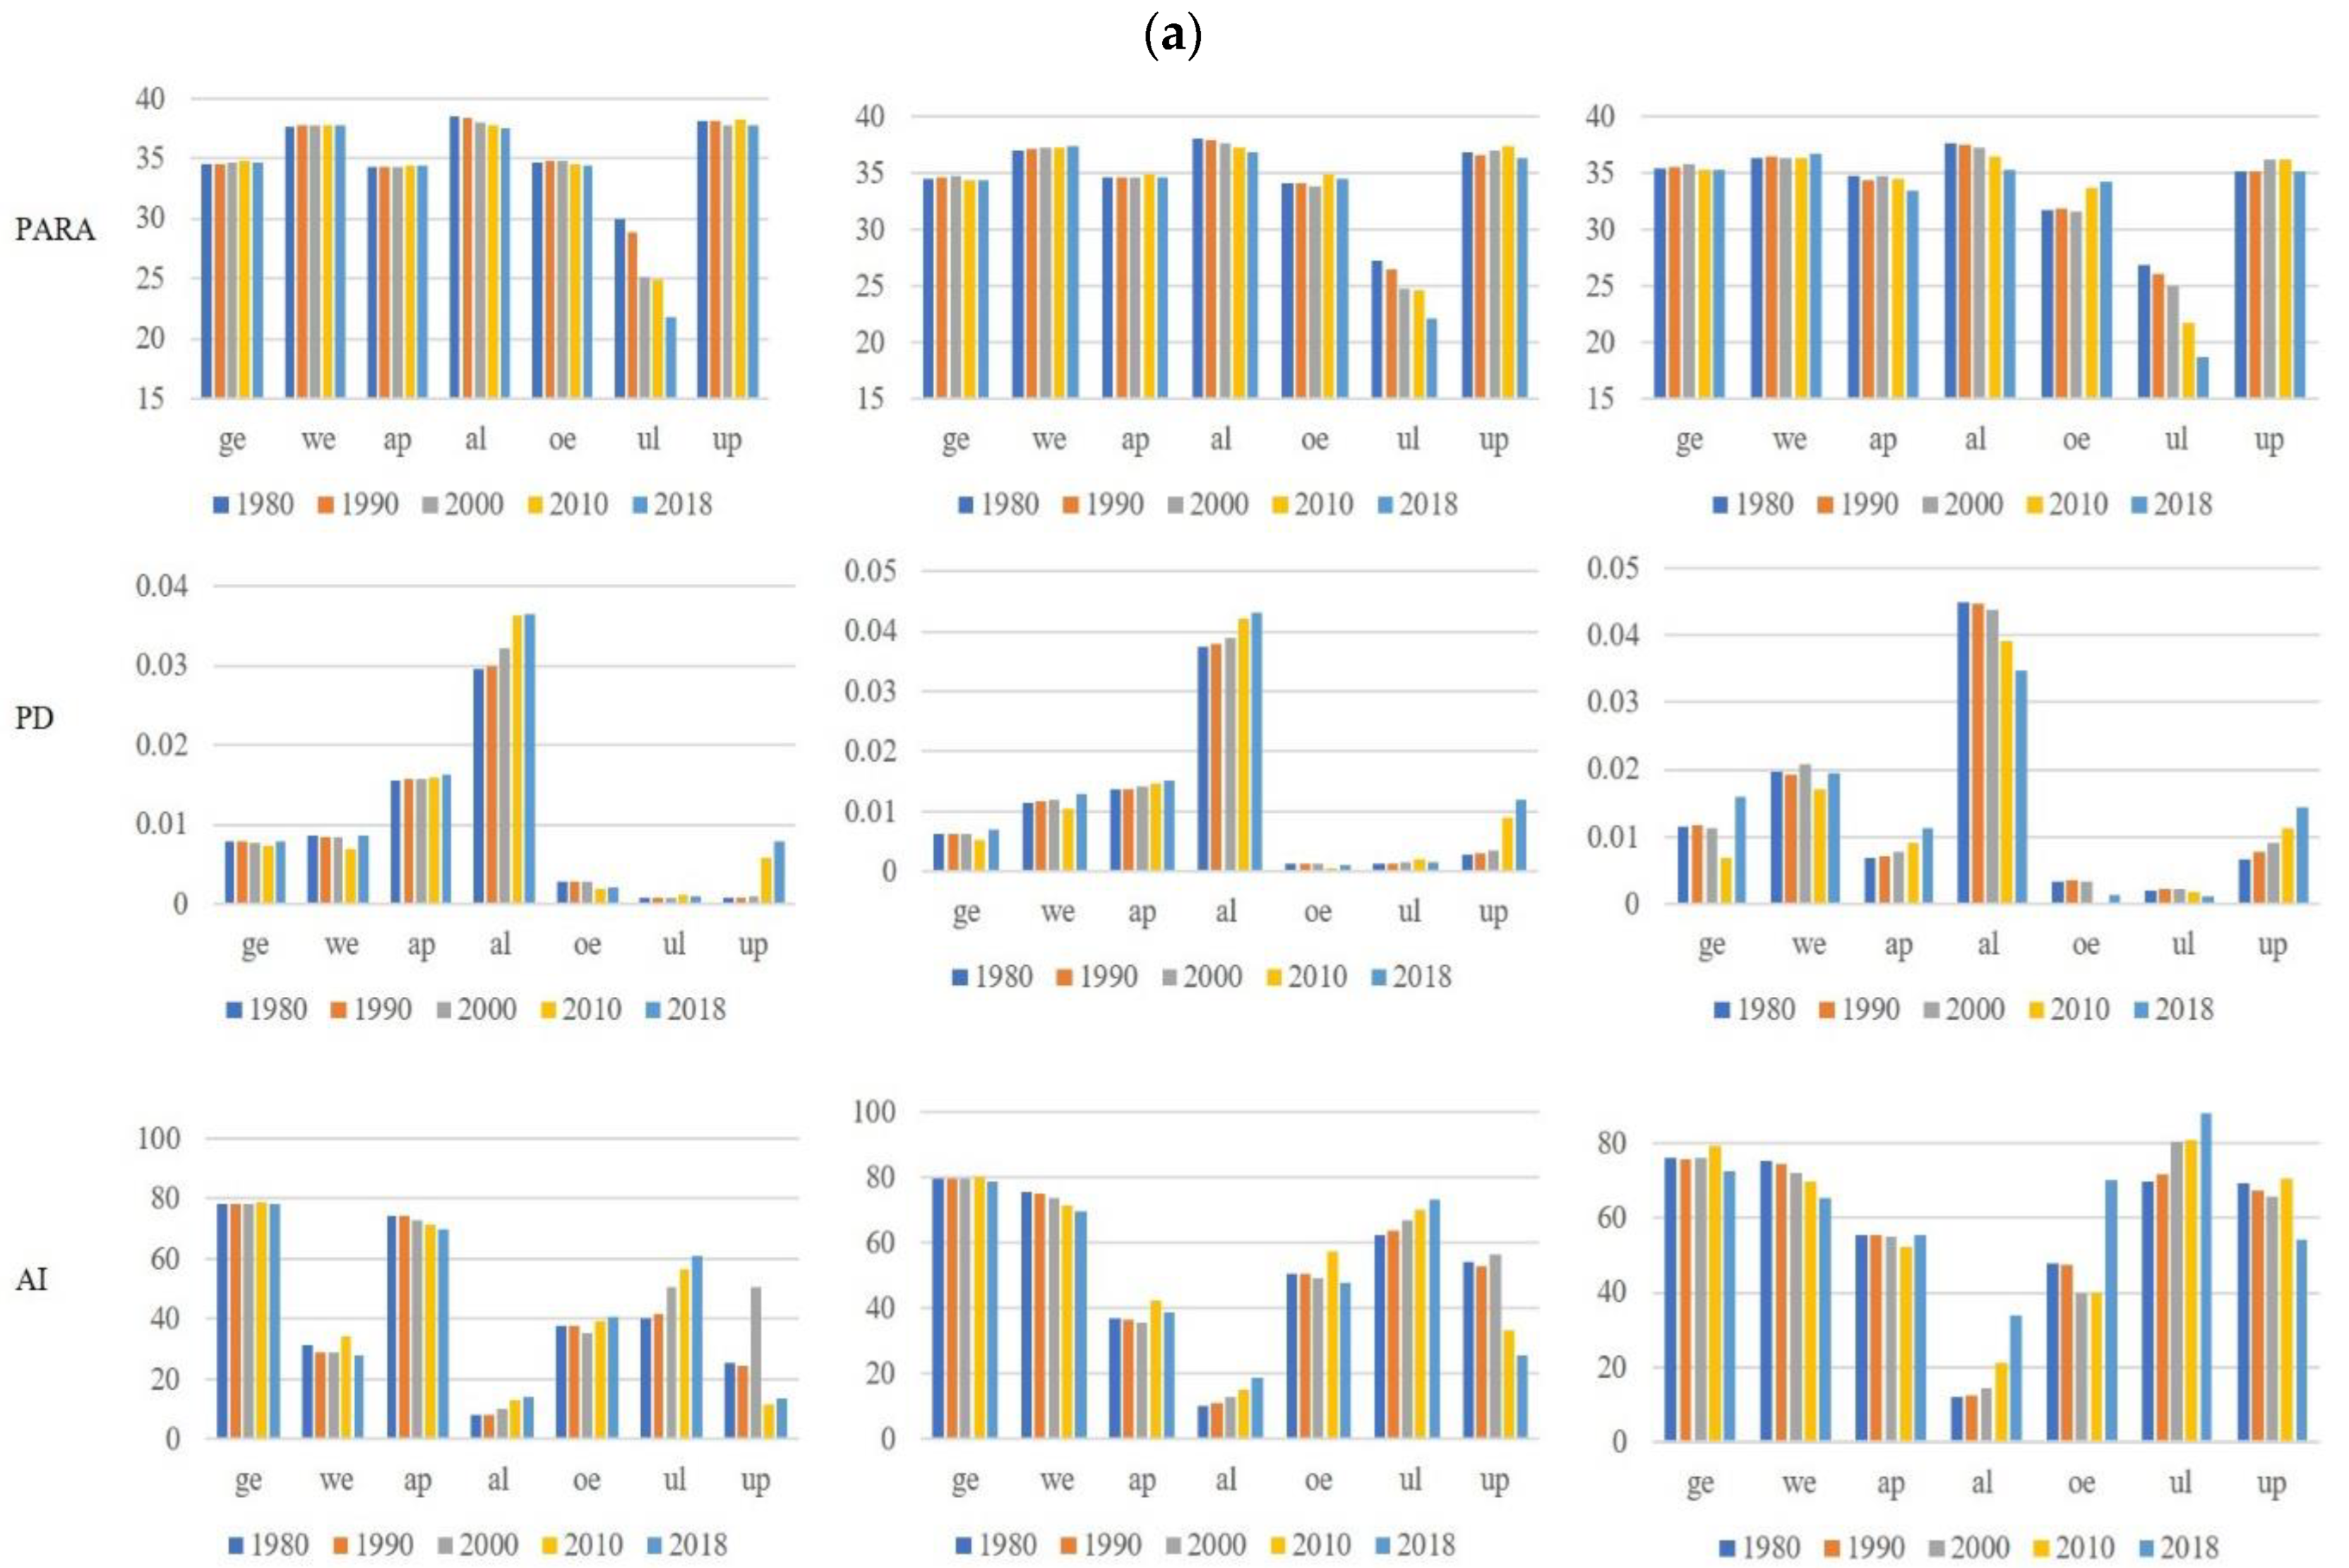
4.4. Evolution of Landscape Pattern

PARA, PD, AI, CONTAG, and SHDI were selected to measure the landscape pattern of BTH counties using patch, type, and landscape levels. As shown in Figure 9, the changes in landscape pattern in three regions of low-, medium-, and high-development levels have the following characteristics: (1) The PARA of patches in rural and urban living space decreased, and the latter decreased more significantly. This could be because either the patch shapes have not changed significantly but have increased in size, or the patch shapes have become simpler. (2) The PD of rural living space was the largest among all spatial types, indicating that it had the highest degree of fragmentation. Among the regions, the degree of fragmentation in the middle- and low-development regions increased, while the degree of fragmentation in the high-development region decreased. The PD of urban production space was on the rise, and its change rate was inversely proportional to the level of economic development; that is, the change rate of the low-development region was the largest, while the change rate of the high-development region was the smallest, but the magnitude of the high-development region was the largest, indicating that the degree of fragmentation tends to be stable. (3) The AI metric of rural living space and urban living space gradually increased with time, the degree of agglomeration of the latter was greater than the former, and the higher the development level of the region, the greater the degree of agglomeration of urban living space. This finding shows that the policy of “village merging” in rural residential areas has achieved initial results and that the spatial agglomeration degree of developed cities is higher than less-developed cities. The AI metric of water ecological space in medium- and high-development regions was about 70%, while that in the low-development region was only about 30%, and characteristics of scattered distribution were evident. (4) On the whole, the CONTAG metric of landscape patterns in the BTH counties decreased over time. It was largest in the low-development region and smallest in the high-development region, indicating that the distribution uniformity of various types of landscapes rose and the overall landscape heterogeneity increased, being more significant in areas with a high economic level. (5) The SHDI metric rose as a whole; the higher the level of economic development, the greater the regional SHDI metric, confirming the balanced distribution trend of various spatial types.

4.5. The Relationship between Territorial Spatial Pattern Changes and Landscape Index

Based on the territorial space area and landscape indexes for the three types of space in 1980, 1990, 2000, 2010, and 2018, the relationship between territorial space area and landscape index change was analyzed; the results are shown in Table 4. In the low-development region, the change of urban space showed a significantly positive correlation with the fragmentation and diversity of the overall landscape, and a significantly negative correlation with the degree of aggregation and sprawl. The change of agricultural space showed a significantly negative correlation with overall landscape fragmentation and diversity of the overall landscape, and a significantly positive correlation with the degree of aggregation and sprawl. In the middle-development region, the results are similar to the low-development region, except that the relationship between urban and agricultural space and sprawl becomes insignificant, indicating that in the middle- and low-development regions, although urban space is expanding, there is a scattered distribution, a gradual increase in landscape fragmentation, and a low level of connectivity between urban production and living space. Meanwhile, agricultural space decreased owing to the impact of human economic construction activities, resulting in fragmentation and enrichment of landscape. In the high-development region, the change in urban space showed a significant positive correlation with landscape diversity, the change of agricultural space showed a significant negative correlation with landscape diversity, and the change of ecological space showed a significant positive correlation with landscape fragmentation, while other results were not significant. Therefore, with the reduction of urban space and the increase in ecological space in the high-development region, the fragmentation characteristics of the landscape pattern become increasingly obvious. The original single and continuous patch has gradually become a complex, heterogeneous, and discontinuous mixed-patch mosaic [56].

5. Discussion

5.1. Driving Factors and Regional Differences of Territorial Spatial Pattern Change

Population mobility and GRDP growth are the main factors for the change of territorial spatial pattern in the BTH region. From 1980 to 2018, the registered population of the BTH region increased by nearly 40 million, and its GRDP increased from CNY 46.1 billion to CNY 8162.4 billion. As China’s capital economic circle, the BTH region is more attractive to labor, capital, and other resource factors than surrounding cities. A large number of migrants enter the BTH region to seek better development opportunities and settle down. Population expansion has led to an increase in the demand for residential, transport, infrastructure, and other spaces, so that the structure and quantity of urban space have undergone drastic changes. Regions with a high development level in the study are mainly concentrated in the Beijing-Tianjin regions. First, they have a higher urbanization rate; gather more production factors, such as labor force, capital, and technology; and have active and intensive human production activities. This enables them to show more obvious space utilization changes. Second, according to the calculation formula of the comprehensive dynamic degree of territorial space, the intensity of territorial space change depends on the relative size of the space’s area of type transformation and the total area of the space in the initial period. Although the number of territorial spaces that changed in the low-development region is more than that in the high-development region, the former has a larger space-area base than the latter and thus a greater impact on the index calculation results. This is another reason for the drastic territorial space change in the high-development region. Third, the high-development region has a faster development speed and priority status than other cities, and its requirements to transform urbanization development from high-speed to high-quality are more advanced [57]. Therefore, the focus of territorial space development has gradually shifted to improving the intensity of space utilization and concentrating on the distribution of construction land, instead of blindly pursuing the expansion of territorial space scale. Therefore, the area of urban space in this region showed negative growth, and the type changed to other spaces after 2010. This is consistent with the national policy goal of ensuring that the total amount of construction land does not increase.
National policies also play a certain role in promoting the change of territorial spatial patterns. In the 1990s, to promote regional economic development, China approved the establishment of several development zones across the country. As a result, a large number of high-quality arable land resources around cities and towns was developed and occupied, and thus the agricultural production space has been squeezed. Zhao et al. (2014) [58] found that from 1987 to 2010, the proportion of newly added construction land occupying cultivated land in the BTH region exceeded 70%, and the proportion of construction land occupying cultivated land in Heilongjiang, Jilin, Liaoning, Yunnan, and other northeastern and western regions of China also continued to increase. Given the severe situation of cultivated land protection, China has provided a rapid policy response, and successively formulated such documents as the “Notice on effectively balancing the occupation and compensation of cultivated land” and “Regulations on the protection of basic farmland.” These policies not only have emphasized the important position of cultivated land protection in national administration in the revised Land Management Law, but also canceled the agricultural tax and financially improved the grain subsidy policy. Overall, they have strengthened the cultivated land protection system, effectively alleviating the practical problem of a large reduction of cultivated land, and the intensity of territorial spatial change in medium- and low-development regions with more agricultural space has gradually decreased. In the 21st century, China has comprehensively promoted rural revitalization, and many villages have entered a new stage of transformation, upgrading, and reconstruction [59]. The planting of cash crops, the construction of rural industrial parks, and the development of cultural tourism have led to further shrinkage of agricultural production space and the spread of agricultural living space in regions with both high and low development level, with only the change of degree differing. These results are similar to those of Long and Li (2012) [60]. With the increasingly prominent contradiction between environmental protection and economic development and the gradual deepening of the concept of sustainable development, the Chinese government has begun to implement afforestation and ecological restoration projects in many places [61,62]. Therefore, ecological space has undergone many changes. The results of this study show that, in the high-development region, the overall ecological space increased, mainly because of the increase in green space and water space, such as forest, grass, and lakes. In the middle- and low-development regions, although there is additional ecological space, more ecological space has been simultaneously transformed into urban and agricultural space, and thus the scope of ecological space has been reduced on the whole. The difference in regional development level leads to this result. Since 2001, Beijing and Tianjin have issued a number of government documents to guide and improve the work of returning farmland to forest and launched projects to control the sources of sandstorms and to return farmland to forest in Beijing and Tianjin, achieving remarkable results in ecological restoration. However, most low-development counties in Hebei Province cannot bear the financial pressure brought by the implementation of construction projects such as green production and environmental governance owing to their limited economic capacity. For example, to adjust the industrial structure, Hebei Province implemented the 6643 Project in 2013 in which, by the end of 2017, 60 million tons of steel production capacity, 61 million tons of cement production capacity, 40 million tons of coal consumption, and 36 million weight boxes of plate glass production capacity had been reduced; this project further widened the economic gap between Beijing/Tianjin and Hebei Province [63]. Therefore, affected by the level of economic development, the positive externalities of ecological spatial changes in the low-development region are lagging behind those of the high- and medium-development regions.

5.2. The Influence of Territorial Space Change on Landscape Pattern

The results show that the landscape pattern indexes of the BTH counties changed from 1980 to 2018, manifested as an increase in patch number and increasing complexity of patch types. There are significant differences in the magnitude and change of landscape-pattern indexes of different types of territorial space. A city is a gathering place with concentrated population and frequent economic, social, and cultural activities [64]. Various activities of human beings strongly affect the patches, corridors, and pattern characteristics in urban landscapes. In the process of the rapid development of urbanization, the urban boundary, scope, and spatial structure are constantly changing, and the corresponding urban landscape pattern is also changing, making the urban landscape unstable. Complex and diverse human activities have formed rich modes of territorial space development and utilization so that urban landscape units are segmented by transport networks, residential production, leisure and entertainment, and other planning contents, and thus the urban landscape is characterized by a high degree of fragmentation. In addition, the continuous growth of the population and the expansion of production demand have tightened resource constraints. The mixed use of space has become an effective way to promote urban sustainable development, leading to integration of urban production and living spaces in the business districts, residential areas, parks, and so on, so as to maximize the heterogeneity and diversity of landscape patterns. Therefore, PD and SHDI show a significant positive correlation with urban space in low- and medium-development-level regions with rapid urbanization, accompanied by the transformation of other spatial types into urban space. While high-development-level regions tend to have more urgent needs for controlling the total amount of construction land and the construction of ecological conversation, during the implementation of the plan, some small and scattered plots are gradually dismantled for reclamation and converted to agricultural or ecological uses.
While agricultural space is squeezed by urban space, the production mode is also changing. With the expansion of the scope of urban construction activities and the intensification of human interference activities, patches such as gardens, woodlands, and grasslands appear in the original single farmland landscape components; the mechanized production of agriculture increases the density of field roads, which increases the diversity of landscape patterns. At the same time, it also plays a positive role in promoting the agglomeration of cultivated land patches. Therefore, the reduction of agricultural space is negatively correlated with SHDI and PD, and is more significant in the low- and middle-development regions where the loss of arable land is high. In the correlation analysis between ecological spatial change and landscape index change, only the results of the high-development region are significant. On the one hand, the ecological space area may be supplemented more in this area (Table 2), and ecological restoration has achieved initial results. On the other hand, AI, PD, CONTAG, and other metrics in the high-development region change more significantly than those in the low- and medium-development regions. According to the development orientation and natural conditions of different functional areas, the Planning of Beijing’s Main Functional Areas [65] has put forward differentiated ecological construction measures, such as “increasing the area of various forms of green space such as scattered small green space and roof greening” in the core functional area of the capital, and “moderately increasing urban parks and community green space” in the urban functional development area. These planning contents of ecological space are consistent with the following results: “the increase of ecological space has a significant positive impact on landscape fragmentation and a significant negative impact on aggregation.”

5.3. Implications for the Optimal Management of Territorial Space

The evolution of territorial spatial patterns is essentially a complex process of land-use change. It is deeply affected by social and economic development. At the same time, as a response to human activities, it also plays a certain role in shaping the landscape pattern, and then affects the material cycle and energy flow of the ecosystem. Therefore, the evolution of territorial spatial patterns is very important to regional development. By analyzing the evolution process of territorial spatial patterns in historical stages and summarizing the characteristics of regional differentiation, and accordingly regulating and optimizing the functional space of different regions, so as to continuously improve the territorial spatial planning system. According to the characteristics of territorial space and landscape pattern of counties with different economic gradients, this study proposes corresponding policy suggestions.
Low-development-level counties in the BTH region are concentrated in the northwest and central south of Hebei Province, with rich forest and grass ecological space. Although these cities are in the accelerated stage of urbanized development and the urban space has increased by more than six times during the study period, the proportion of agricultural space to total land space has always exceeded 50%, indicating that this primary industry is still the leading industry. For such counties, on the one hand, it is necessary to actively carry out the revitalization and utilization of rural idle houses through the standardized management of rural homesteads so as to prevent the disorderly occupation of cultivated land and other production space by rural living space and improve the utilization efficiency of territorial space resources. On the other hand, the government should reasonably plan the scale of cities and towns, form a “point-axis” spatial organization mode through the construction of transportation networks, accelerate the development of urban clusters and industrial clusters, and strengthen the protection and restoration of the ecological conservation zones in the northwest, so as to provide an ecological space guarantee for the urban development of the BTH region.
Middle-development-level counties are mainly located in the periphery of the main urban area of Beijing and Tianjin, and a few are scattered in the middle and south of Hebei Province. These cities are also in a rising period of urbanization growth rate, but the growth rate has gradually stabilized. The structural transformation of territorial space is dominated by the one-way transfer from agriculture to urban space and the two-way transfer between agriculture and ecological space. The fragmentation and diversity of the agricultural landscape have increased, indicating that this region is greatly affected by human interference activities. In the future, the centralized production capacity of cultivated land can be enhanced through comprehensive land reclamation, and the level of agricultural modernization can be improved under the guidance of science and technology, so as to make up for the loss of grain output caused by the reduction of agricultural production space and ensure regional food security. Moreover, increasing the construction of green space inside the city and peripheral natural ecological reserves to create a good production and living environment is essential.
High-development-level counties are mainly distributed in the central urban areas of Beijing and Tianjin. They are the areas with the most active production factors, such as population, capital, and technology. The intensity of territorial space development and utilization is the highest, and the change of territorial space utilization is the most intense. These cities have initially formed an industrial development pattern with a clear division of labor, but the spatial structures of public services and ecological protection need to be further optimized to improve the coordinated development level of the economic–social–environmental system. Therefore, China needs to improve the incremental control of construction land, improve the capacity of space conservation and intensive utilization at first, further enhance the proportion and agglomeration of ecological space, then improve the ecological function and value of natural ecosystems by establishing a balanced and stable landscape pattern in order to promote the high-quality development of the region.

5.4. Limitation

Territorial space is a multi-functional, organic, geographical space which is affected by natural, economic, policy, and other factors. This study establishes the territorial spatial classification system and the analysis framework of territorial spatial pattern change, identifies the temporal and spatial characteristics of territorial spatial pattern and landscape metric change in regions with different economic development levels in the BTH region, and preliminarily analyzes the relationship between them, which is different from other studies that have analyzed the region as a whole and to a certain extent make up for the shortcomings of the study, but there are still some limitations. First, in measuring the intensity of spatial variation, the modified model can be used for in-depth analysis at three levels: interval, category, and hierarchy [66]. Second, in addition to using landscape pattern indicators, the ecological impact of changes in the territorial spatial pattern can also be reflected by calculating the value of ecosystem services. Third, based on the results of this paper, the temporal heterogeneity of the drivers of changes in territorial spatial patterns can be explored in the future. It has been found that the influence of the same drivers on the dynamics of regional spatial patterns may vary or even be diametrically opposed depending on the development period, but there are still very few relevant studies [23].

6. Conclusions

In this study, 199 counties in the BTH region are divided into differentiated regional spaces according to levels of economic development. Based on the establishment of the urban–agricultural–ecological spatial classification system, from the perspectives of area change range, spatial change intensity, structural transformation trends, and landscape morphological characteristics, this study researches the evolution of territorial spatial patterns and their impact on the change of landscape form in the BTH region from 1980 to 2018. The results provide a basis for formulating and optimizing the territorial spatial planning system in the future.
The results show that the territorial spatial pattern of the BTH region changed significantly from 1980 to 2018, mainly reflected in the rapid increase in urban space and the significant decrease in agricultural space in the low- and medium-development regions. The higher the level of economic development, the more drastic the changes in the internal structure of territorial space, and the more remarkable the effect of ecological restoration. The three types of development regions all show characteristics of agricultural production flowing into rural living space and urban space, reflecting the sustained and rapid development of China’s urbanization process during the study period, as well as the severe practical problems of cultivated land and ecological protection. This study finds that the degree of landscape fragmentation in high-development areas is the most serious, although it tends to be stable, while the degree of landscape fragmentation in low- and medium-development regions is increasing. With the improvement of regional development levels, landscape diversity also shows a trend of continuous and slow increase. The degree of landscape aggregation is related to the type of territorial space and the level of economic development. The correlation analysis shows that the spatial change of territorial space in the high-development region is related to landscape fragmentation and diversity, while the spatial change of urban space in the low- and medium-development-level areas has a positive correlation with landscape diversity and fragmentation and a negative correlation with sprawl and agglomeration; the spatial change of agricultural space has the opposite relationship with the landscape pattern index. These differences may be due to the varying content of regional planning policies and their implementation effects, as well as the variations of spatial changes in the types of territorial space. According to the differences in evolutionary characteristics of the regional territorial spatial pattern, this study proposes different measures for the development, utilization, and protection of territorial space so as to provide a scientific reference for the construction of a new spatial pattern guided by the concept of green development, centered on the strategy of main functional areas, and aimed at achieving high-quality development.

Author Contributions

Conceptualization, Z.L.; methodology, Z.L.; software, Z.L.; validation, Z.L. and Z.Z.; formal analysis, Z.L.; data curation, Z.L.; writing—original draft preparation, Z.L.; writing—review and editing, Z.L.; visualization, Z.L.; supervision, Z.Z.; project administration, Z.Z.; funding acquisition, Z.Z. All authors have read and agreed to the published version of the manuscript.

Funding

This research was funded by the National Social Science Foundation of China (21AZD041), National Natural Science Foundation of China (71874196; 71974220), and the Outstanding Innovative Talents Cultivation Funded Programs 2021 of Renmin University of China.

Data Availability Statement

Not applicable.

Conflicts of Interest

The authors declare no conflict of interest.

References

  1. Yang, R.; Zhang, J.; Xu, Q.; Luo, X. Urban-rural spatial transformation process and influences from the perspective of land use: A case study of the Pearl River Delta Region. Habitat Int. 2020, 104, 102234. [Google Scholar] [CrossRef]
  2. UN-HABITAT. World Cities Report 2020: The Value of Sustainainable Urbanization; UN-HABITAT: Nairobi, Kenya, 2020. [Google Scholar]
  3. Abdullah, S.A.; Nakagoshi, N. Changes in landscape spatial pattern in the highly developing state of Selangor, peninsular Malaysia. Landsc. Urban Plan. 2006, 77, 263–275. [Google Scholar] [CrossRef]
  4. Chang, G.H.; Brada, J.C. The paradox of China’s growing under-urbanization. Econ. Syst. 2006, 30, 24–40. [Google Scholar] [CrossRef]
  5. Wu, Y.; Zhang, X.; Shen, L. The impact of urbanization policy on land use change: A scenario analysis. Cities 2011, 28, 147–159. [Google Scholar] [CrossRef]
  6. Huang, X.; Li, Y.; Yu, R.; Zhao, X. Reconsidering the Controversial Land Use Policy of “Linking the Decrease in Rural Construction Land with the Increase in Urban Construction Land”: A Local Government Perspective. China Rev. 2014, 14, 175–198. [Google Scholar]
  7. Wang, J.; He, T.; Lin, Y. Changes in ecological, agricultural, and urban land space in 1984–2012 in China: Land policies and regional social-economical drivers. Habitat Int. 2018, 71, 1–13. [Google Scholar] [CrossRef]
  8. Ning, J.; Liu, J.; Kuang, W.; Xu, X.; Zhang, S.; Yan, C.; Li, R.; Wu, S.; Hu, Y.; Du, G. Spatio-temporal patterns and characteristics of land-use change in China during 2010–2015. J. Geogr. Sci. 2018, 28, 547–562. [Google Scholar] [CrossRef] [Green Version]
  9. Wang, S.; Wang, S. Land use/land cover change and their effects on landscape patterns in the Yanqi Basin, Xinjiang (China). Environ. Monit. Assess. 2013, 185, 9729–9742. [Google Scholar] [CrossRef]
  10. Forman, R.T.T.; Godron, M. Landscape Ecology; Wiley: New York, NY, USA, 1986. [Google Scholar]
  11. Hubacek, K.; van den Bergh, J. Changing concepts of ‘land’ in economic theory: From single to multi-disciplinary approaches. Ecol. Econ. 2006, 56, 5–27. [Google Scholar] [CrossRef]
  12. Bai, L.M.; Xiu, C.L.; Feng, X.H.; Liu, D.Q. Influence of urbanization on regional habitat quality:a case study of Changchun City. Habitat Int. 2019, 93, 13. [Google Scholar] [CrossRef]
  13. Gu, Y. The Study of Hangzhou Spatial Structure and Evolution Law in 2000–2010; Zhejiang University: Hangzhou, China, 2016. [Google Scholar]
  14. Ewing, R.; Pendall, R.; Chen, D. Measuring Sprawl and Its Transportation Impacts. Transp. Res. Rec. 2003, 1831, 175–183. [Google Scholar] [CrossRef]
  15. Andersen, H.T.; Møller-Jensen, L.; Engelstoft, S. The End of Urbanization? Towards a New Urban Concept or Rethinking Urbanization. Eur. Plan. Stud. 2011, 19, 595–611. [Google Scholar] [CrossRef]
  16. Niu, M. Research on Evaluation and Optimization of Agricultural Spatial Pattern Based on Eco-Civilization in China; Chinese Academy of Agricultural Sciences: Beijing, China, 2016. [Google Scholar]
  17. Li, X.; Yeh, A.G.-O. Analyzing spatial restructuring of land use patterns in a fast growing region using remote sensing and GIS. Landsc. Urban Plan. 2004, 69, 335–354. [Google Scholar] [CrossRef]
  18. Dadashpoor, H.; Azizi, P.; Moghadasi, M. Land use change, urbanization, and change in landscape pattern in a metropolitan area. Sci. Total Environ. 2019, 655, 707–719. [Google Scholar] [CrossRef]
  19. Ahmad, S.; Avtar, R.; Sethi, M.; Surjan, A. Delhi’s land cover change in post transit era. Cities 2016, 50, 111–118. [Google Scholar] [CrossRef]
  20. Galacho Jiménez, F.B.; Reyes Corredera, S. The urban regulation of rural land from the perspective of the new Law for the Promotion of Territorial Sustainability in Andalusia (Andalusian Land Law). Bol. Asoc. Geógr. Esp. 2022, 94. [Google Scholar] [CrossRef]
  21. Zhou, P.; Huang, J.; Pontius, R.; Hong, H. Land Classification and Change Intensity Analysis in a Coastal Watershed of Southeast China. Sensors 2014, 14, 11640–11658. [Google Scholar] [CrossRef] [Green Version]
  22. Di, D.Y.; Wu, Z.N.; Wang, H.L.; Zhang, F.Y. Spatial pattern analysis on the functions of water resources economic–social–ecological complex system. J. Clean. Prod. 2022, 336, 130323. [Google Scholar] [CrossRef]
  23. Luo, Y.; Lü, Y.; Liua, L.; Liang, H.; Li, T.; Ren, Y. Spatiotemporal scale and integrative methods matter for quantifying the driving forces of land cover change. Sci. Total Environ. 2020, 739, 139622. [Google Scholar] [CrossRef]
  24. Chia-An, K. Incorporating spatial regression model into cellular automata for simulating land use change. Appl. Geogr. 2016, 69, 1–9. [Google Scholar] [CrossRef]
  25. Ralha, C.G.; Abreu, C.G.; Coelho, C.G.C.; Zaghetto, A.; Macchiavello, B.; Machado, R.B. A multi-agent model system for land-use change simulation. Environ. Model. Softw. 2013, 42, 30–46. [Google Scholar] [CrossRef]
  26. Su, S.; Jiang, Z.; Zhang, Q.; Zhang, Y. Transformation of agricultural landscapes under rapid urbanization: A threat to sustainability in Hang-Jia-Hu region, China. Appl. Geogr. 2011, 31, 439–449. [Google Scholar] [CrossRef]
  27. Wu, C. Man-Land Relationship and Economic Layout; Academic Press: Beijing, China, 1998. [Google Scholar]
  28. Wu, C. Comment on the core of the study of geography—The regional system of human and land relations. Econ. Geogr. 1991, 11, 1–6. (In Chinese) [Google Scholar]
  29. Wu, C. The theoretical research and regulation of the regional system of human–land relations. J. Yunnan Norm. Univ. (Philos. Soc. Sci.) 2008, 40, 1–3. (In Chinese) [Google Scholar]
  30. Ma, Y.L.; Xu, R.S. Remote sensing monitoring and driving force analysis of urban expansion in Guangzhou City, China. Habitat Int. 2010, 34, 228–235. [Google Scholar] [CrossRef]
  31. Wu, R.; Li, Z.; Wang, S. The varying driving forces of urban land expansion in China: Insights from a spatial-temporal analysis. Sci. Total Environ. 2021, 766, 142591. [Google Scholar] [CrossRef]
  32. Liu, J.; Zhang, Z.; Xu, X.; Kuang, W.; Zhou, W.; Zhang, S.; Li, R.; Yan, C.; Yu, D.; Wu, S.; et al. Spatial patterns and driving forces of land use change in China during the early 21st century. J. Geogr. Sci. 2010, 20, 483–494. [Google Scholar] [CrossRef]
  33. Verburg, P.H.; Steeg, J.V.D.; Veldkamp, A.; Willemen, L. From land cover change to land function dynamics: A major challenge to improve land characterization. J. Environ. Manag. 2009, 90, 1327–1335. [Google Scholar] [CrossRef]
  34. Angel, S.; Parent, J.; Civco, D.L. The dimensions of global urban expansion: Estimates and projections for all countries, 2000–2050. Prog. Plan. 2011, 75, 53–107. [Google Scholar] [CrossRef]
  35. Pan, W.; Wang, J.; Lu, Z.; Liu, Y.; Li, Y. High-quality development in China: Measurement system, spatial pattern, and improvement paths. Habitat Int. 2021, 118, 102458. [Google Scholar] [CrossRef]
  36. Outline of Coordinated Development of the Beijing-Tianjin-Hebei Region. Available online: http://www.bjchp.gov.cn/cpqzf/315734/tzgg27/1277896/ (accessed on 1 November 2021).
  37. Chenery, H.; Robinson, S.; Syrquin, M. Industrialization and Growth: A Comparative Study; Oxford University Press: London, UK, 1986. [Google Scholar]
  38. Xu, X.L.; Liu, J. A 5-year Spatial Distribution dataset of Terrestrial ecosystems in China (1990–2010). J. Glob. Chang. Data Discov. 2017, 1, 52–59. [Google Scholar]
  39. Sun, Z. Research Progress and Prospect of Spatial Planning at China and Abroad. Planners 2015, 31, 207–210. (In Chinese) [Google Scholar]
  40. Xu, Y. The Characteristics and Enlightenment of the Land Classification System in Japan. Urban Plan. Int. 2012, 27, 22–29. (In Chinese) [Google Scholar]
  41. Zhu, H.; Li, T. Japan’s Experience in Territorial Space Use Control and Its Enlightenments to China. Nat. Resour. Econ. China 2020, 33, 51–58. (In Chinese) [Google Scholar]
  42. Zhang, Y.; Ying, T.; Chen, H. Space Planning and Land Use Classifications in Foreign Countries and Their Enlightenments to China. Stand. Surv. Mapp. 2017, 33, 1–5. (In Chinese) [Google Scholar]
  43. Lin, Y.; Zhao, J.; Zhang, M.; Chen, G. Identification of Territory Space Pattern and Spatio-temporal Evolution Analysis of Urban Agglomeration in Central Yunnan. Trans. Chin. Soc. Agric. Mach. 2019, 50, 176–191. (In Chinese) [Google Scholar]
  44. The Several Opinions on Establishing Territorial Spatial Planning System and Supervising the Implementation. Available online: http://www.gov.cn/zhengce/2019-05/23/content_5394187.htm (accessed on 1 November 2021).
  45. Si, H. Spatial Regulation and Comprehensive Function Zoning of National Land Space in Qinghai Province; China University of Geosciences: Beijing, China, 2018. [Google Scholar]
  46. Li, G.; Fang, C. Quantitative function identification and analysis of urban ecological-production-living spaces. Acta Geogr. Sin. 2016, 71, 49–65. (In Chinese) [Google Scholar]
  47. Zhu, H.; Li, X. Discussion on the index method of regional land use change. Acta Geogr. Sin. 2003, 5, 643–650. (In Chinese) [Google Scholar]
  48. Pang, R.; Hu, N.; Zhou, J.; Sun, D.; Ye, H. Study on Eco-Environmental Effects of Land-Use Transitions and Their Influencing Factors in the Central and Southern Liaoning Urban Agglomeration: A Production–Living–Ecological Perspective. Land 2022, 11, 937. [Google Scholar] [CrossRef]
  49. Pickett, S.T.A.; Cadenasso, M.L. LANDSCAPE ECOLOGY—SPATIAL HETEROGENEITY IN ECOLOGICAL-SYSTEMS. Science 1995, 269, 331–334. [Google Scholar] [CrossRef]
  50. Wiens, J.A.; Milne, B.T. Scaling of ‘landscapes’ in landscape ecology, or, landscape ecology from a beetle’s perspective. Landsc. Ecol. 1989, 3, 87–96. [Google Scholar] [CrossRef]
  51. Wu, J.G.; Levin, S.A. A spatial patch dynamic modeling approach to pattern and process in an annual grassland. Ecol. Monogr. 1994, 64, 447–464. [Google Scholar] [CrossRef]
  52. Forman, R.T.T. Land Mosaics: The Ecology of Landscapes and Regions; Cambridge University Press: New York, NY, USA, 1995. [Google Scholar]
  53. Wu, J. Landscape Ecology—Pattern, Process, Scale and Hierarchy, 2nd ed.; Higher Education Press: Beijing, China, 2007. [Google Scholar]
  54. Su, S.; Wang, Y.; Luo, F.; Mai, G.; Pu, J. Peri-urban vegetated landscape pattern changes in relation to socioeconomic development. Ecol. Indic. 2014, 46, 477–486. [Google Scholar] [CrossRef]
  55. Tang, J.; Li, Y.; Cui, S.; Xu, L.; Ding, S.; Nie, W. Linking land-use change, landscape patterns, and ecosystem services in a coastal watershed of southeastern China. Glob. Ecol. Conserv. 2020, 23, e01177. [Google Scholar] [CrossRef]
  56. Li, H.; Peng, J.; Yanxu, L.; Yi’na, H. Urbanization impact on landscape patterns in Beijing City, China: A spatial heterogeneity perspective. Ecol. Indic. 2017, 82, 50–60. [Google Scholar] [CrossRef]
  57. Zhou, J.-H.; Zhu, Y.-M.; He, L.; Mu, B.-X. Recognizing and coordinating multidimensional dynamic stakeholder value conflicts for sustainability-oriented Construction Land Reduction projects in Shanghai, China: An integrated SA-SNA-TRIZ approach. J. Clean. Prod. 2022, 348, 131343. [Google Scholar] [CrossRef]
  58. Zhao, X.; Zhang, Z.; Wang, X.; Zuo, L.; Liu, B.; Yi, L.; Xu, J.; Wen, Q. Analysis of Chinese cultivated land′s spatio-temporal changes and causes in recent 30 years. Trans. Chin. Soc. Agric. Eng. 2014, 30, 1–11. (In Chinese) [Google Scholar]
  59. Jiang, Y.; Long, H.; Tang, Y.T.; Deng, W.; Zheng, Y. The impact of land consolidation on rural vitalization at village level: A case study of a chinese village. J. Rural Stud. 2021, 3, 485–496. [Google Scholar] [CrossRef]
  60. Long, H.; Li, T. The coupling characteristics and mechanism of farmland and rural housing land transition in China. J. Geogr. Sci. 2012, 22, 548–562. [Google Scholar] [CrossRef]
  61. Dong, J.; Liu, J.; Shi, W. China’s Sloping Land Conversion Program at the Beginning of 21st Century and Its Habitat Suitability in Typical Region of Loess Plateau. J. Resour. Ecol. 2010, 1, 36–44. [Google Scholar]
  62. Zhang, D.J.; Jia, Q.Q.; Xu, X.; Yao, S.B.; Chen, H.B.; Hou, X.H. Contribution of ecological policies to vegetation restoration: A case study from Wuqi County in Shaanxi Province, China. Land Use Policy 2018, 73, 400–411. [Google Scholar] [CrossRef]
  63. Liu, T.; Tian, X. The progress, Achievements and Prospects of the Collaborative Development in Beijing-Tianjin-Hebei Region. China Bus. Mark. 2019, 33, 116–128. (In Chinese) [Google Scholar]
  64. Wang, R. Efficient and Harmonious—Principles and Methods of Urban Regulation and Control; Hunan University: Changsha, China, 1988. [Google Scholar]
  65. Beijing Urban Master Planning (2004–2020). Available online: http://www.bjzx.gov.cn/zhuanti/20140321/01.html (accessed on 1 November 2021).
  66. Quan, B.; Pontius, R.G., Jr.; Song, H. Intensity Analysis to communicate land change during three time intervals in two regions of Quanzhou City, China. GISci. Remote Sens. 2020, 57, 21–36. [Google Scholar] [CrossRef]
Figure 1. Comprehensive analysis framework of territorial spatial pattern.
Sustainability 15 00259 g001
Figure 2. The BTH region location and county economic gradient maps. Notes: The administrative unit boundary is from the Data Center for Resources and Environmental Sciences, Chinese Academy of Sciences, updated in 2020.
Sustainability 15 00259 g002
Figure 3. The classification system of territorial space.
Sustainability 15 00259 g003
Figure 4. The framework of research methods.
Sustainability 15 00259 g004
Figure 5. Spatial pattern of the BTH counties in 1980, 1990, 2000, 2010, and 2018.
Sustainability 15 00259 g005
Figure 6. The territorial space area transfer in low-development regions during the period 1980–2018. Notes: up = urban production space; ul = urban living space; ge = green ecological space; al=agricultural living space; ap = agricultural production space; oe = other ecological space; we = water ecological space.
Sustainability 15 00259 g006
Figure 7. The territorial space area transfer in medium-development regions during the period 1980–2018. Notes: up = urban production space; ul = urban living space; ge = green ecological space; al = agricultural living space; ap = agricultural production space; oe = other ecological space; we = water ecological space.
Sustainability 15 00259 g007
Figure 8. The territorial space area transfer in high-development regions during the period 1980–2018. Notes: up = urban production space; ul = urban living space; ge = green ecological space; al = agricultural living space; ap = agricultural production space; oe = other ecological space; we = water ecological space.
Sustainability 15 00259 g008
Figure 9. Change of landscape index of territorial spatial patterns in different economic development regions. (a), the graphs from left to right represent the landscape pattern index levels of low-, medium-, and high-development regions, respectively; the graphs from top to bottom are for PARA, PD, and AI; (b) shows CONTAG and SHDI results, respectively.
Sustainability 15 00259 g009aSustainability 15 00259 g009b
Table 1. The description of the landscape index.
The Landscape IndexDescriptionCalculation
PARAThe ratio of the perimeter to the area of a given patch, which is a simple measure of shape complexity P i j a i j
PDThe number of patches per unit area of a certain type of the landscape elements, reflecting the degree of landscape fragmentation N A
AIIndicates the trend of spatial aggregation of patch types i = 1 m g i j m a x g i j × P i
CONTAGThe degree of agglomeration or extension of different patch types in the landscape 1 + i = 1 m j = 1 n P i j l n P i j 2 l n m
SHDIA reflection of the richness and complexity of different landscape types i = 1 m P i l n P i
Table 2. The spatial change in high-, medium-, and low-development regions from 1980 to 2018.
Low Development LevelUrban SpaceAgricultural SpaceEcological Space
Area (km²)Change rateArea (km²)Change rateArea (km²)Change rate
1980–19904610.50%1380.20%−184−0.33%
1990–200046195.25%−166−0.24%−295−0.53%
2000–20101249132.17%−473−0.68%−776−1.39%
2010–201870332.04%−1286−1.87%5831.06%
Middle development levelUrban spaceAgricultural spaceEcological space
Area (km²)Change rateArea (km²)Change rateArea (km²)Change rate
1980–199017110.72%−35−0.08%−59−0.21%
1990–200084047.57%−787−1.87%−127−0.46%
2000–2010179068.69%−1197−2.90%−481−1.76%
2010–201855412.60%−922−2.30%4041.51%
High development levelUrban spaceAgricultural spaceEcological space
Area (km²)Change rateArea(km²)Change rateArea (km²)Change rate
1980–199017311.09%−265−2.25%921.73%
1990–200060534.91%−631−5.47%110.20%
2000–2010177976.09%−559−5.13%−861−15.84%
2010–2018−522−12.68%−653−6.32%146031.93%
Total7849−6836−233
Table 3. Comprehensive dynamic of territorial space in high-, medium-, and low-development regions.
1980–19901990–20002000–20102010–20181980–2018
Low development level0.55%2.82%14.94%6.44%18.99%
Medium development level1.69%5.48%21.77%14.57%31.29%
High development level4.96%12.36%33.32%49.29%73.69%
Table 4. Correlation between territorial space change and landscape index.
Low development levelPDAICONTAGSHDI
Urban space0.999 **−0.988 **−0.998 **0.997 **
Agricultural space−0.934 *0.923 *0.929 *−0.918 *
Ecological space−0.7350.7290.741−0.759
Medium development levelPDAICONTAGSHDI
Urban space0.957 **−0.968 **−0.8560.994 **
Agricultural space−0.982 *0.991 *0.871−0.999 **
Ecological space−0.5500.5750.536−0.0.687
High development levelPDAICONTAGSHDI
Urban space−0.559−0.531−0.5210.903 *
Agricultural space0.1380.8440.840−0.997 **
Ecological space0.887 *−0.693−0.7010.200
* p < 0.05; ** p < 0.01; *** p < 0.001.
Disclaimer/Publisher’s Note: The statements, opinions and data contained in all publications are solely those of the individual author(s) and contributor(s) and not of MDPI and/or the editor(s). MDPI and/or the editor(s) disclaim responsibility for any injury to people or property resulting from any ideas, methods, instructions or products referred to in the content.

