Article

Comprehensive Analysis of PV and Wind Energy Integration into MMC-HVDC Transmission Network

by
Md Ismail Hossain
1,
Md Shafiullah
1,
Fahad A. Al-Sulaiman
1,2 and
Mohammad A. Abido
1,3,4,*
1
Interdisciplinary Research Center for Renewable Energy and Power Systems (IRC-REPS), King Fahd University of Petroleum and Minerals (KFUPM), Dhahran 31261, Saudi Arabia
2
Mechanical Engineering Department, King Fahd University of Petroleum and Minerals, Dhahran 31261, Saudi Arabia
3
Electrical Engineering Department, King Fahd University of Petroleum and Minerals, Dhahran 31261, Saudi Arabia
4
K.A. CARE Energy Research and Innovation Center, King Fahd University of Petroleum and Minerals, Dhahran 31261, Saudi Arabia
*
Author to whom correspondence should be addressed.
Sustainability 2023, 15(1), 253; https://doi.org/10.3390/su15010253
Submission received: 15 November 2022 / Revised: 15 December 2022 / Accepted: 20 December 2022 / Published: 23 December 2022
(This article belongs to the Special Issue Renewable Energy and Greenhouse Gas Emissions Reduction)

Abstract

:
Renewable energy will play a vital role in greenhouse gas emissions reduction. However, renewable energy is located far away from the load center. Modular multilevel converter-(MMC) based VSC-HVDC systems became competitive for remotely located renewable energy grid integration. Unlike the average model for MMC and renewable energy side converter, this paper presents a detailed model-based control and analysis of the MMC-HVDC system for solar and wind energy integration. Furthermore, it optimally tracks PV energy employing the modified incremental conductance method and wind energy using field-oriented control. Instead of decoupled control, a feedforward controller is utilized to establish a standalone AC voltage for renewable energy grid integration. This work considers a doubly fed induction generator (DFIG), permanent magnet synchronous generator (PMSG), and squirrel cage induction generator (SCIG) for wind energy integration. The results from MATLAB/SIMULINK platform agree with the controller hardware in the loop results from RTDS-dSPACE platform. The results confirmed the optimum solar and wind energy tracking during wind speed, irradiance, and temperature variations. However, it improved the fault ride-through capability during balanced and unbalanced low voltage disturbances at the point of common coupling (PCC) of AC grid.

1. Introduction

Renewable energy became economically competitive due to continuous price decreases and improved technology over the decades [1,2,3]. Wind energy is one of the dominant renewable energy technology that accounted for 16% of global renewable energy in 2016, and rose from 7.5 GW in 1997 to 564 GW in 2018 [4,5]. Many places have strong winds, and are attractive for offshore and onshore wind farms [6]. Offshore wind farms became attractive for their low carbon footprint, no CO2 emission, improved technology, steady wind flow direction, stronger wind, not interfering with birds’ paths, and not creating noise for the people. The most popular type of wind generator for onshore/offshore platforms is doubly fed induction generators (DFIGs) and permanent magnet synchronous generator (PMSG). As two-thirds of DFIG is delivered directly from the stator terminal to the grids, a smaller power electronics converter is required to transmit power from the rotor side to the grids. Hence, switching power loss is small. However, it faces challenges in meeting the strict grid code requirements due to direct stator terminal connection with the grids. In addition, grid side faults complicate its operation. On the other hand, PMSG integrates wind energy through a full-scale converter, which separates the generation from direct integration. Therefore, it can quickly fulfill strict grid code requirements and deliver reactive power under adverse conditions. However, it requires rare earth materials to construct the rotor magnet controlled by a few countries. Due to low cost, made from widely available materials, and long life, a full-scale converter-based squirrel cage induction generator (SCIG) also has potential instead of expensive rare earth material-based PMSG [7].
PV is one of the fastest growing renewable energy technologies and shares a significant part in global renewable energy generation. The cost of manufacturing solar panels has dropped significantly in the last decade. As with other remotely located renewable energy, an appropriate place for the PV panels is situated in the deserts where the efficiency is maximized, and the land is not used for agriculture, forestry, or city and countryside development. Among maximum power point tracking (MPPT) techniques, perturb and observe method (P&O) [8,9,10] and incremental conductance (IC) method [11,12,13] are the most popular for tracking the maximum power due to their simplicity and ease of implementation. Due to the continuous perturbation-based tracking, P&O produces oscillation in the output. The incremental conductance technique is comparatively more computationally expensive than the P&O method, but it extracts maximum power point rapidly. However, the IC algorithm comprises a PV voltage difference in the denominator, which creates problems in digital implementation. Abrupt irradiance variation does not change the PV voltage, resulting in zero in the denominator and undefined incremental conductance.
VSC-HVDC system does not require charging current, can connect variable frequency source, does not create sub-synchronous resonances, can provide reactive power support, does not propagate AC side faults, can control independently real and reactive power, and supply voltage, frequency, and black start support [14,15]. These advantages have made the VSC-HVDC transmission system competitive for remotely located renewable energy grid integration. The MMC is dominant in VSC-HVDC transmission due to modular characteristics, negligible harmonics distortion, and small switching power loss compared to a two-level converter [16,17,18]. During faults, control strategies for HVDC grids have been presented [19,20,21,22]. However, the control for the arm circulating current and balancing submodule capacitor voltage was not discussed. However, a simplified average model was adopted for VSC, and experimental results were not presented. The literature [23,24] counts the whole wind farm as a single unit and did not consider the actual dynamics of wind farms. However, no real-time simulation was performed while preparing the results. The articles reported in [24,25,26,27] used a simplified current source for representing renewable energy integration where complete dynamics of wind generator side converter have been ignored. Similarly, a detailed model-based offshore energy-connected HVDC system has not been investigated for unbalanced fault analysis, and the experimental result was not provided in Refs. [28,29]. Resonance identification was presented for offshore-wind farms connected MMC-HVDC system [30]. Improved AC frequency and voltage control was discussed for offshore MMC station in [31]. Both of these works [30,31] employed capacitance on the high voltage AC side of MMC to establish standalone AC grids for wind energy integration and employed decouple control. Consequently, it consumes a significant amount of reactive power. However, MMC creates almost sine wave AC voltage due to the large number of submodules that do not develop harmonics distortion, and often operate without the expensive filter.
During normal operating conditions and good AC grids, the converter utilizes its total capacity to inject wind energy into AC grids. However, any severe fault in the PCC of AC grids dramatically reduces the converter capacity for transferring energy to the AC grids. The low impedance three-phase-to-ground fault at the PCC of AC grids decreases the converter’s power transfer capacity to approximately zero. Consequently, the HVDC link voltage is increased due to surplus energy in the HVDC link. The active current injection in the HVDC link could be significantly reduced by changing the electromagnetic torque from the wind generator. Similarly, the modulation index of the wind farm’s converter could be varied to regulate the wind energy injection in the HVDC link. Still, reliability problems and any communication failure for controlling the surplus energy in the HVDC link for the period of the AC side faults could undermine the stability of the HVDC link. However, response time is slow due to large rotor inertia and is not suitable for minimizing the HVDC link’s rapid energy accumulation during a transient fault on the AC side. Bridge type fault current limiter was used to restrict the fault current during balanced and unbalanced faults in AC grids [32,33]. The resistor is placed in series to minimize the fault current. However, the method employs many power electronics switch at healthy AC grids to allow large current to pass, resulting in continuous switching power loss. In addition, isolated AC voltage forming for DFIG-based wind energy integration and optimum wind energy tracking has not been addressed. Communication-dependent central control, power reduction, sharing, and coordination technique between the converter stations control surplus energy in the HVDC link [34,35,36,37]. Contrasting slow response out of multilayer control, communication delay, and failure, locally placed dynamic braking resistor (DBR)-based HVDC link voltage protection is fast and reliable to dissipate surplus energy in the HVDC transmission during AC side faults [38,39]. DBR is connected with the transmission line in parallel and dissipates surplus energy to regulate the HVDC link voltage during severe AC side faults. Hence, HVDC link voltage remains regulated within limits. Usually, the dynamic braking resistor is designed in such a way as to fully dissipate the excess energy throughout the three-phase to ground faults at the PCC of AC grids [40,41,42].
In this work, MMC detailed model-based HVDC network is developed. A comprehensive analysis for DFIG, SCIG, and PMSG-based optimal wind energy employed vector control and optimal solar energy employed modified incremental conductance is thoroughly analyzed in MATLAB/SIMULINK and compared with the controller hardware in the loop results from RTDS-dSPACE platform. The renewable energy farm is enlarged by multiplying one complete unit dynamics. Instead of capacitance-included decoupled control, a feedforward controller is used to establish an isolated AC network. The full system with all comprehensive model-based controllers and converters is modeled and simulated in RTDS and dSPACE. The effectiveness of the MMC controller is assessed against the severe symmetrical and unsymmetrical low voltage disturbances at the PCC of AC grids. In summary, the following contributions have been made:
  • Detailed model-based renewable energy integrated MMC-HVDC system has been investigated and thoroughly analyzed.
  • Comprehensive model-based full system with real-time simulation results has been provided.
The rest of the paper is organized as follows. Section 2 provides the mathematical modeling and controller design for the converters used in PV, DFIG, SCIG, and PMSG-based renewable energy-integrated MMC-HVDC systems. Section 3 provides detailed simulation results of high voltage DC and AC regulation, optimum renewable energy integration into MMC-HVDC system.

2. Mathematical Modeling and Controller Design

This section provides detailed mathematical modeling for optimally solar and wind energy-integrated MMC-HVDC networks. It develops an optimal controller from the solar array and wind turbine characteristics. It also presents the MMC controller to establish the HVDC network.

2.1. Solar Energy Included MMC-HVDC Transmission Network

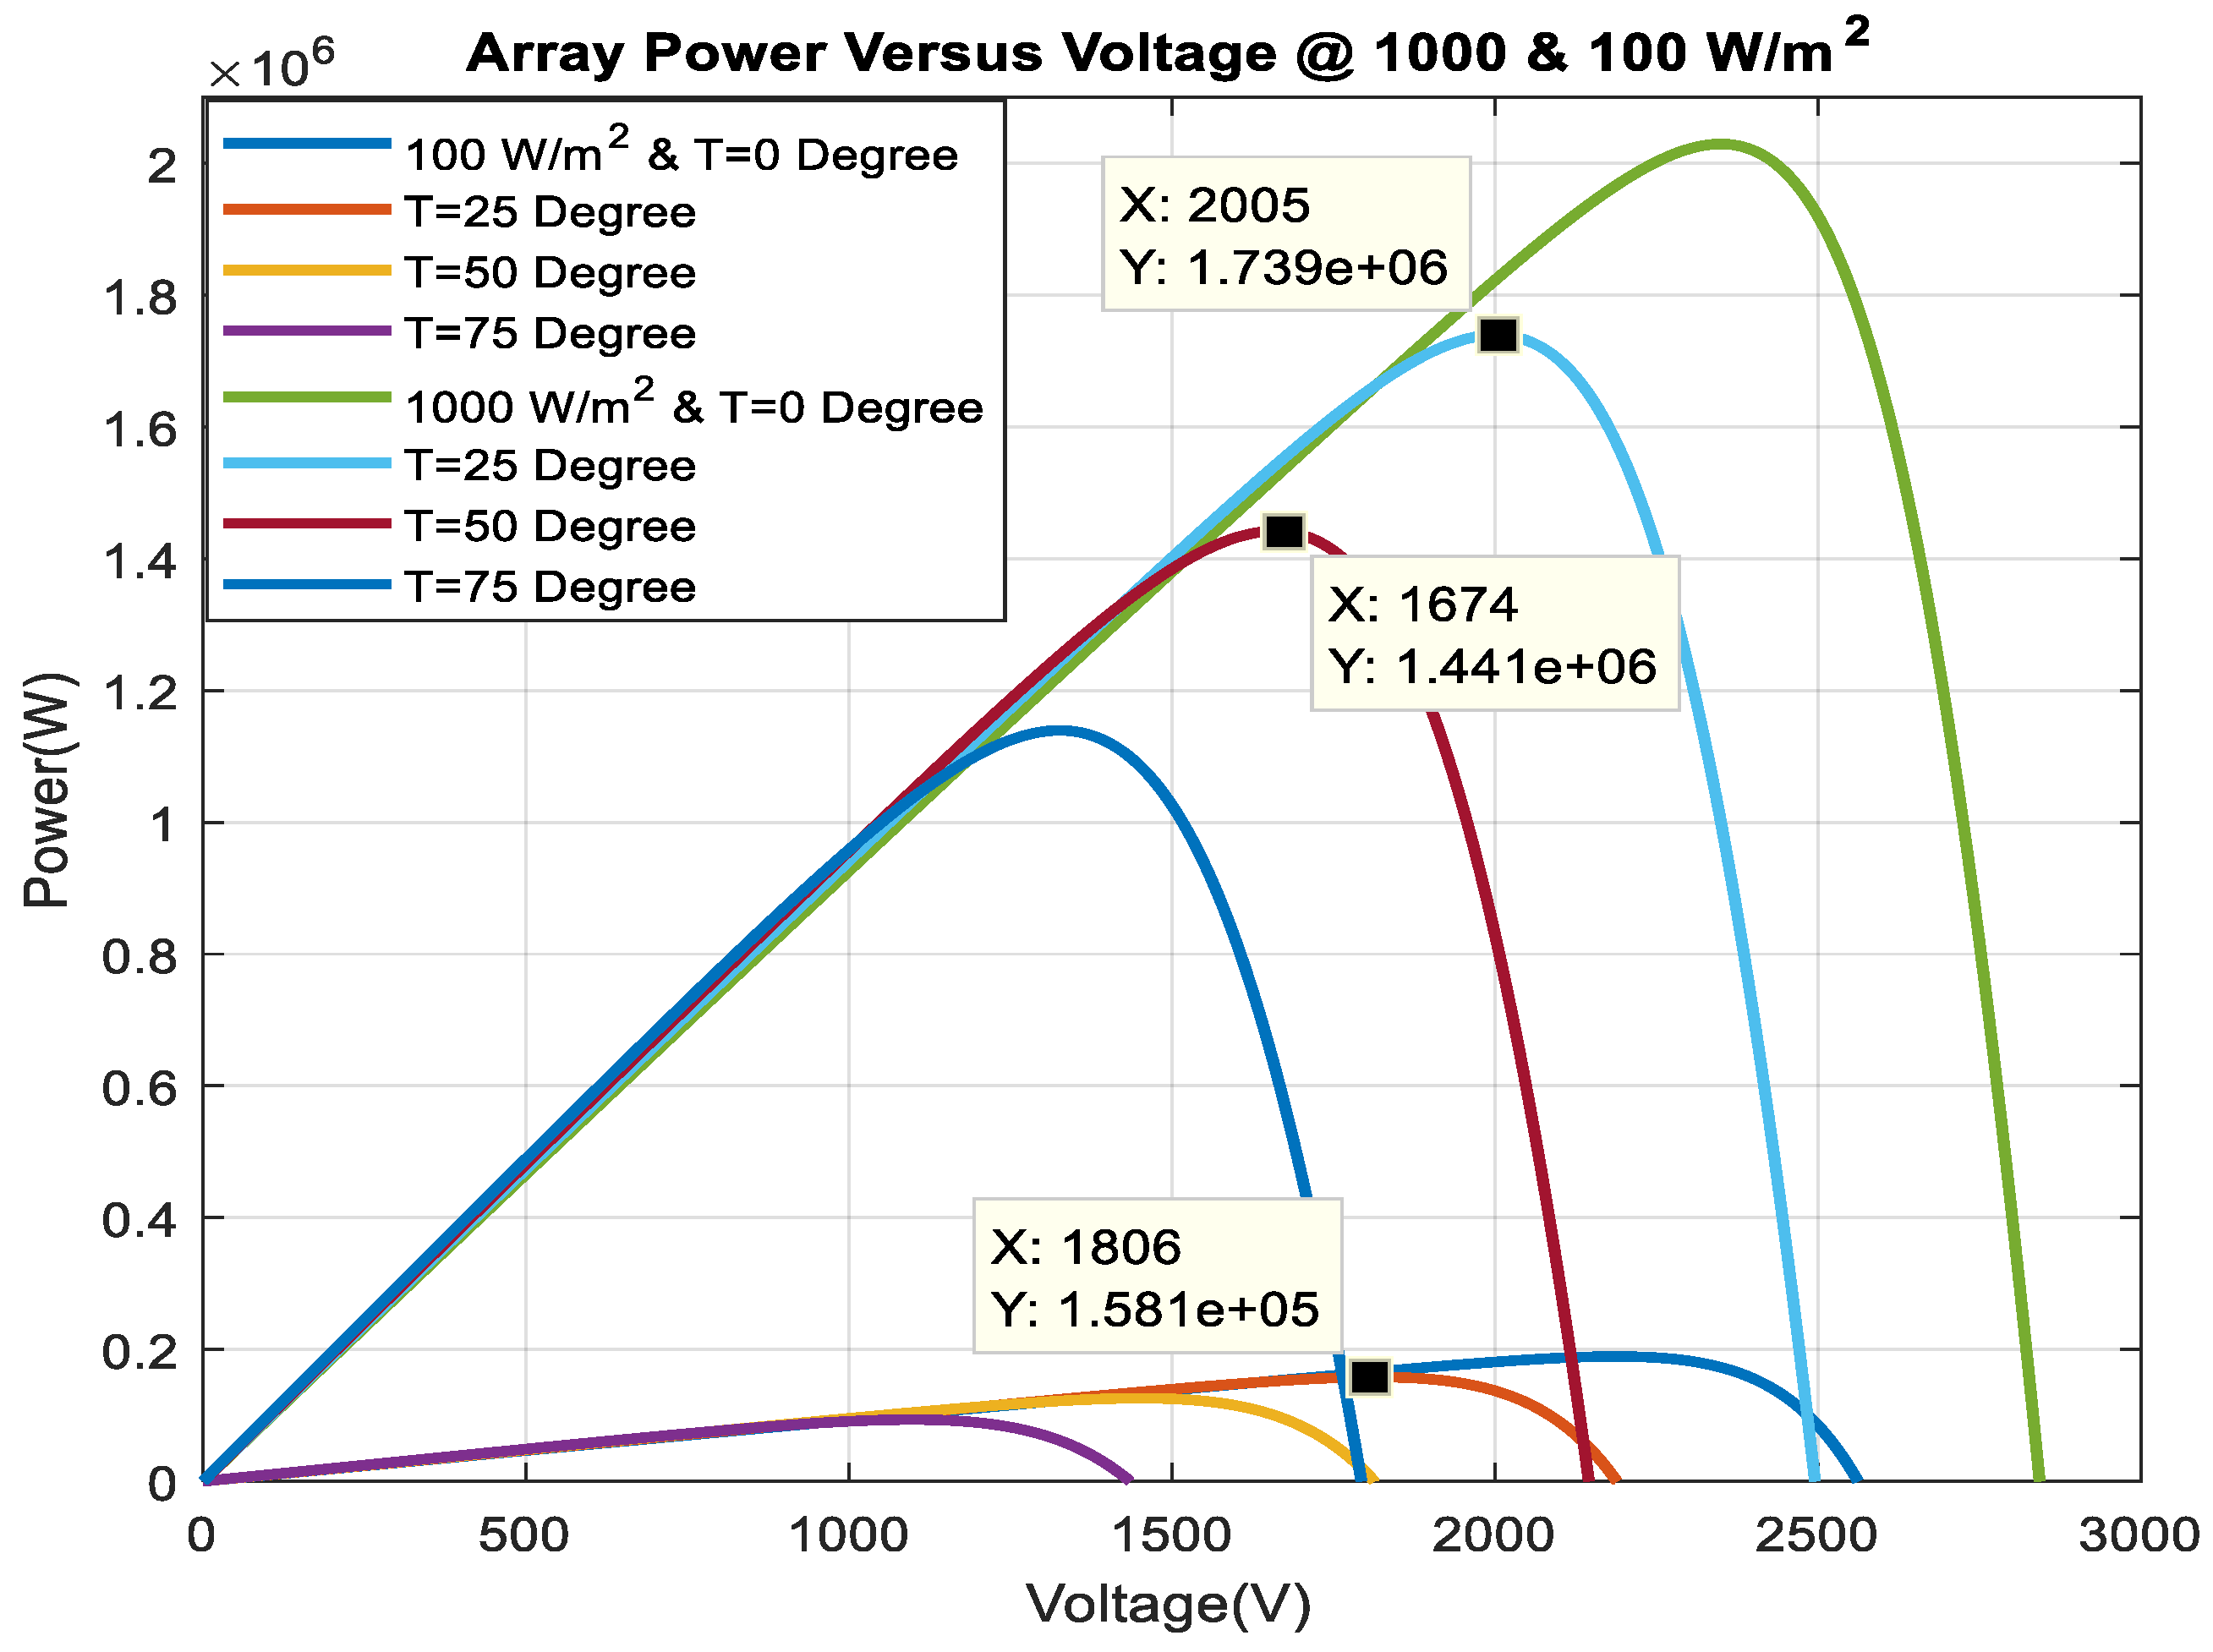
The solar energy-connected MMC-HVDC network is illustrated in Figure 1. MMC1 regulates the HVDC link voltage, and MMC2 creates the AC voltage for solar farm integration. From the PV panel’s power versus voltage characteristics curve, as shown in Figure 2, the optimum output power of the PV panel changes with solar radiation and temperature. Therefore, the purpose of the PV side converter is to adjust the DC link voltage to extract the peak PV energy under temperature and solar radiation variation. The inner current dynamics of the grid side converter (GSC) in the steady state are denoted by the following equation [43].
L d i g d d t + R i g d = L ω 0 i g q + V d V g d
L d i g q d t + R i g q = L ω 0 i g d + V q V g q
The following equation controls the DC link voltage dynamics of GSC:
C d V d c d t = i d c i g d
DC link reference voltage for the GSC is provided from the modified incremental conductance method for the MPPT of the PV panel.
The slope is found at the MPP point:
d P d V = 0   or   d V I d V = 0   or   I + V d I d V = 0   or   d I d V = I V
However, rapid environmental conditions change makes Equation (4) undefined as dV becomes zero. Therefore, this work modifies the incremental conductance method by multiplying both sides of Equation (4) by dV.
Hence, we have,
d P = I d V + V d I
If the PV voltage remains constant in the following sample, then d V = 0 .
We can write:
d P = V d I
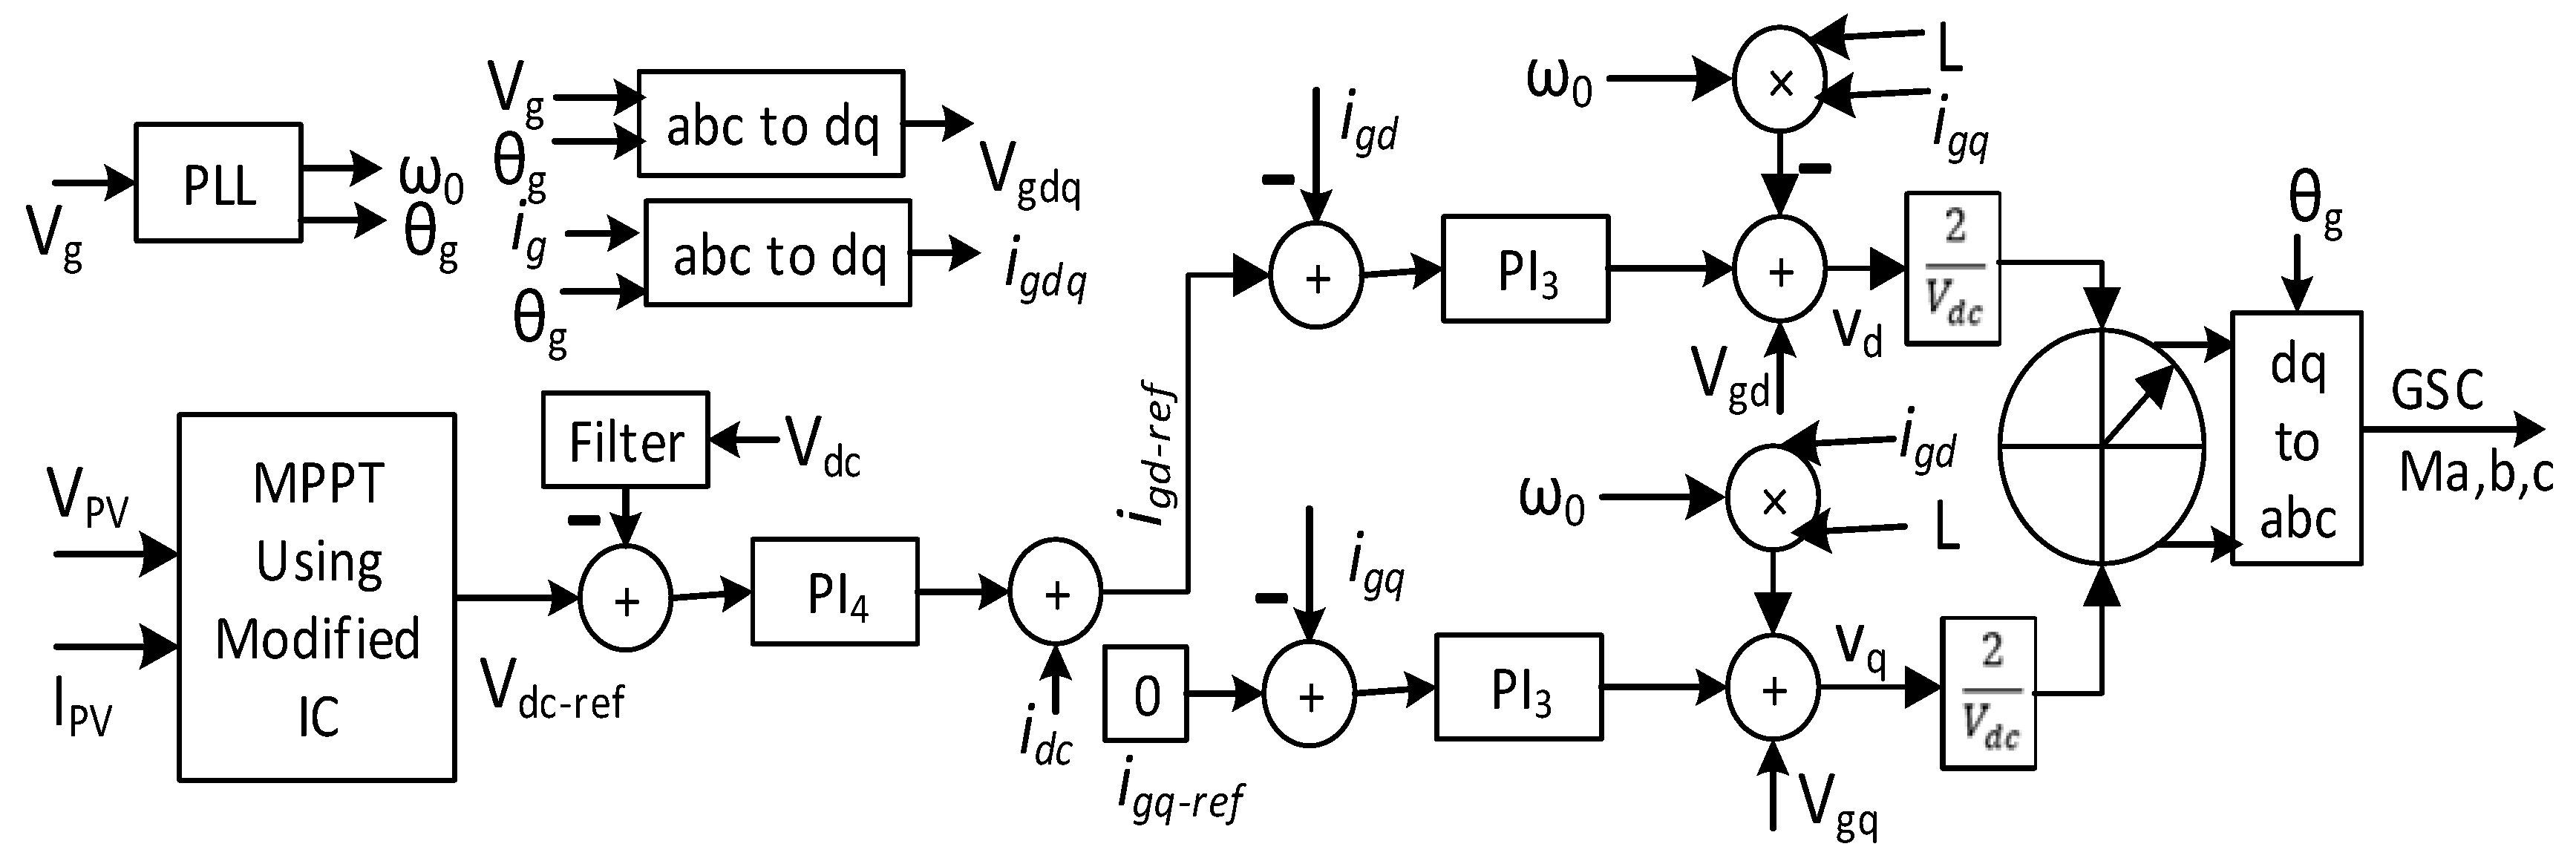
Finally, Equations (1)–(3) governs the complete dynamics of GSC, whereas Equations (5) and (6) provides the reference DC link voltage for maximum PV power tracking. Figure 3 shows the PV side converter control. If the successive sample yields the same PV voltage, then the change of PV power, d P is measured using Equation (6). DC link voltage of the PV side converter is increased with the positive increase in d P . However, the DC link voltage of the PV side converter is decreased with the negative increase in d P .
On the other hand, Equation (4) is utilized for the change of DC link voltage of the PV side converter to find the conductance. Now, the DC link voltage of the PV side converter is changed with the increase and decrease in conductance until both sides of Equation (4) are equal. A PI controller (PI4) generates the reference active current for controlling the DC link voltage provided in Equation (3). Similarly, the PI controller (PI3), along with current control dynamics presented in Equations (1) and (2), is used to follow the reference current. As shown in Figure 1, a high pass filter (HPF) is employed to bypass the high-frequency harmonics components, which arise from switching frequency.

2.2. DFIG-Based Wind Energy Included MMC-HVDC Transmission Network

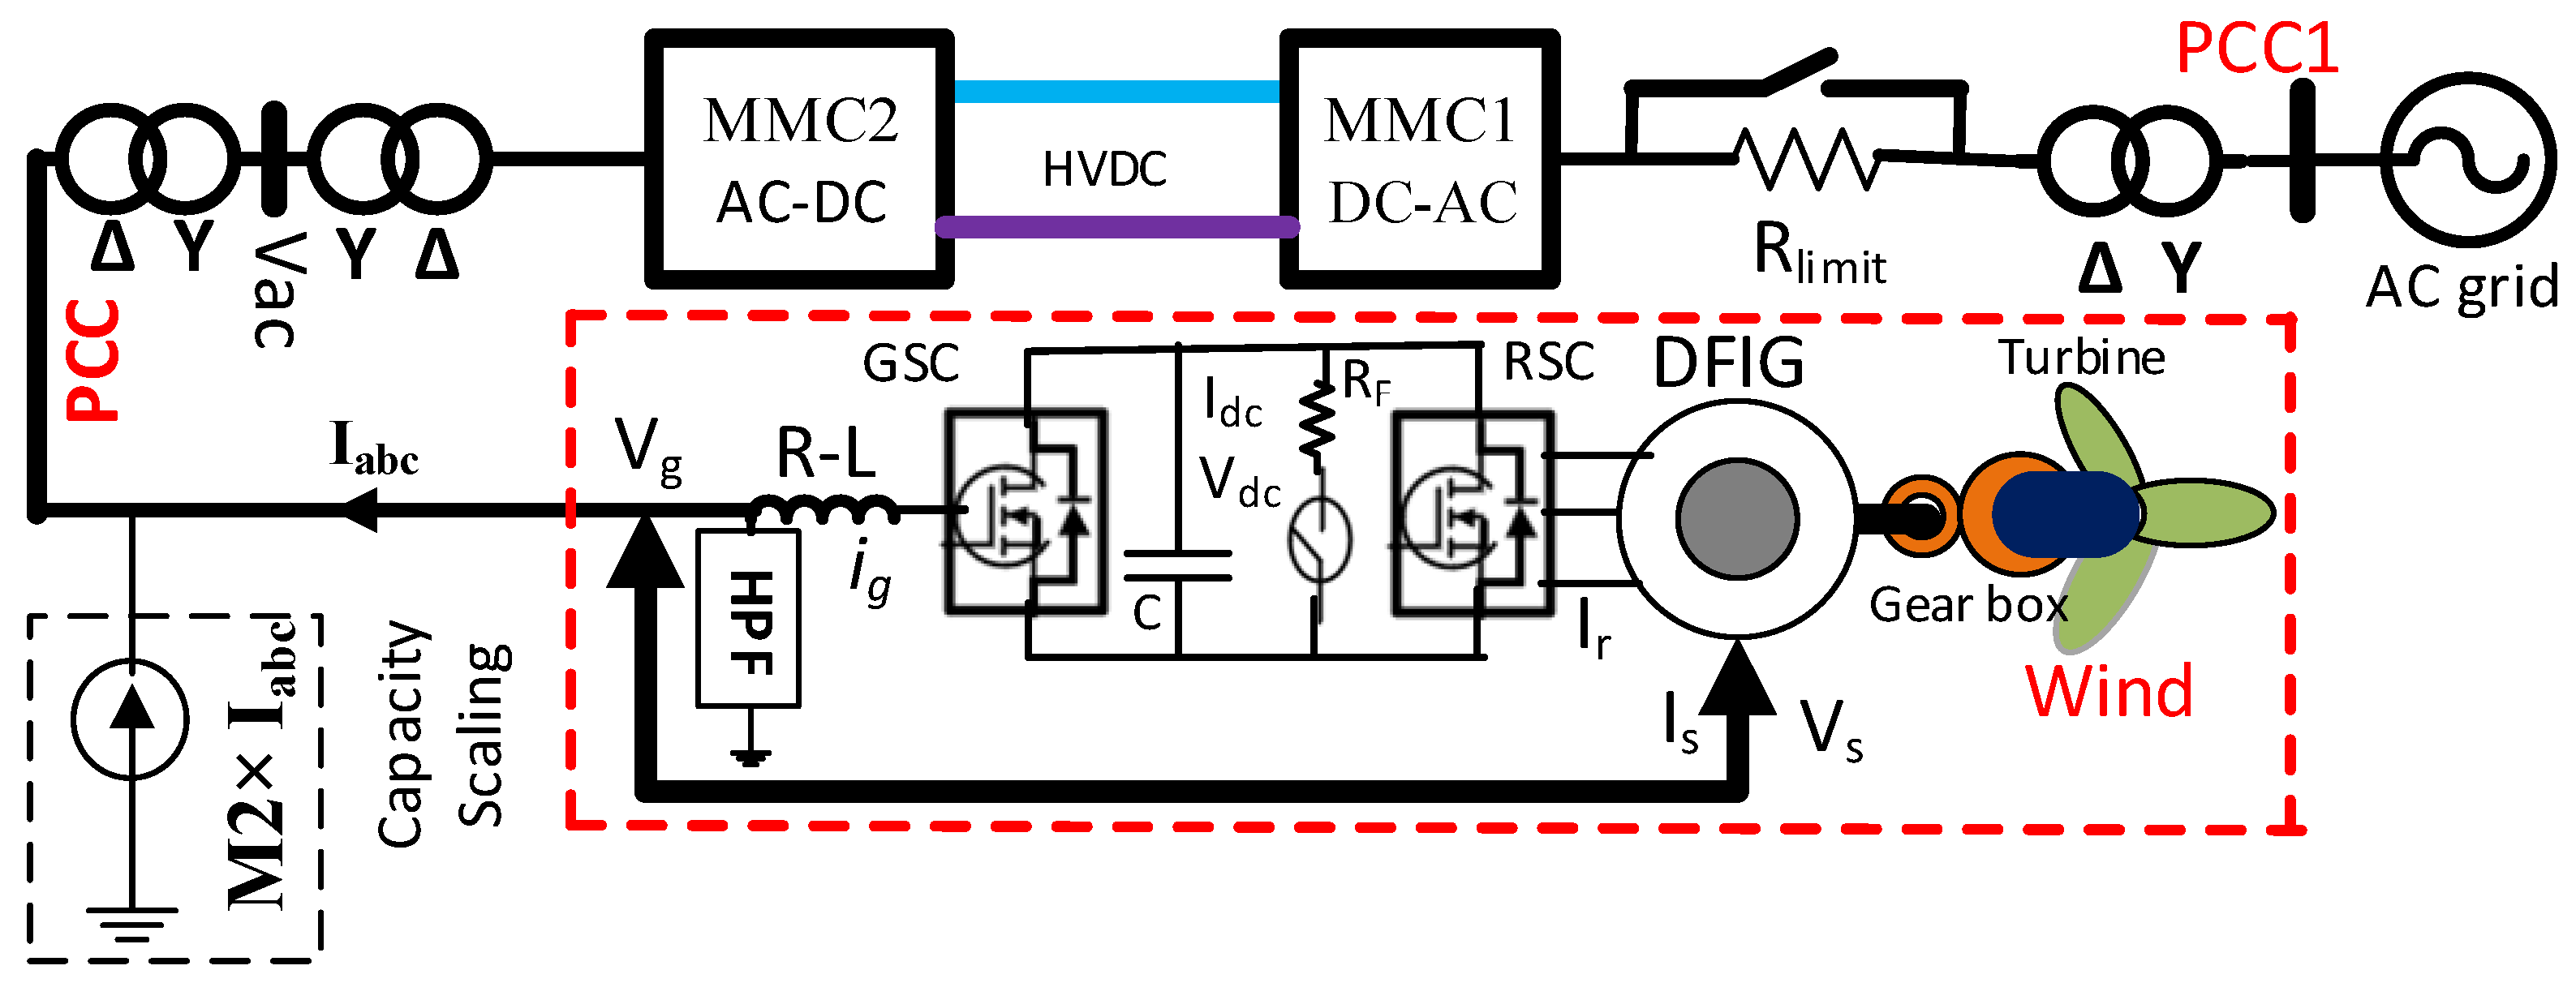
DFIG-based wind energy, including the MMC-HVDC network, is illustrated in Figure 4. MMC1 regulates the HVDC link voltage, and MMC2 creates the AC voltage for wind farm integration.
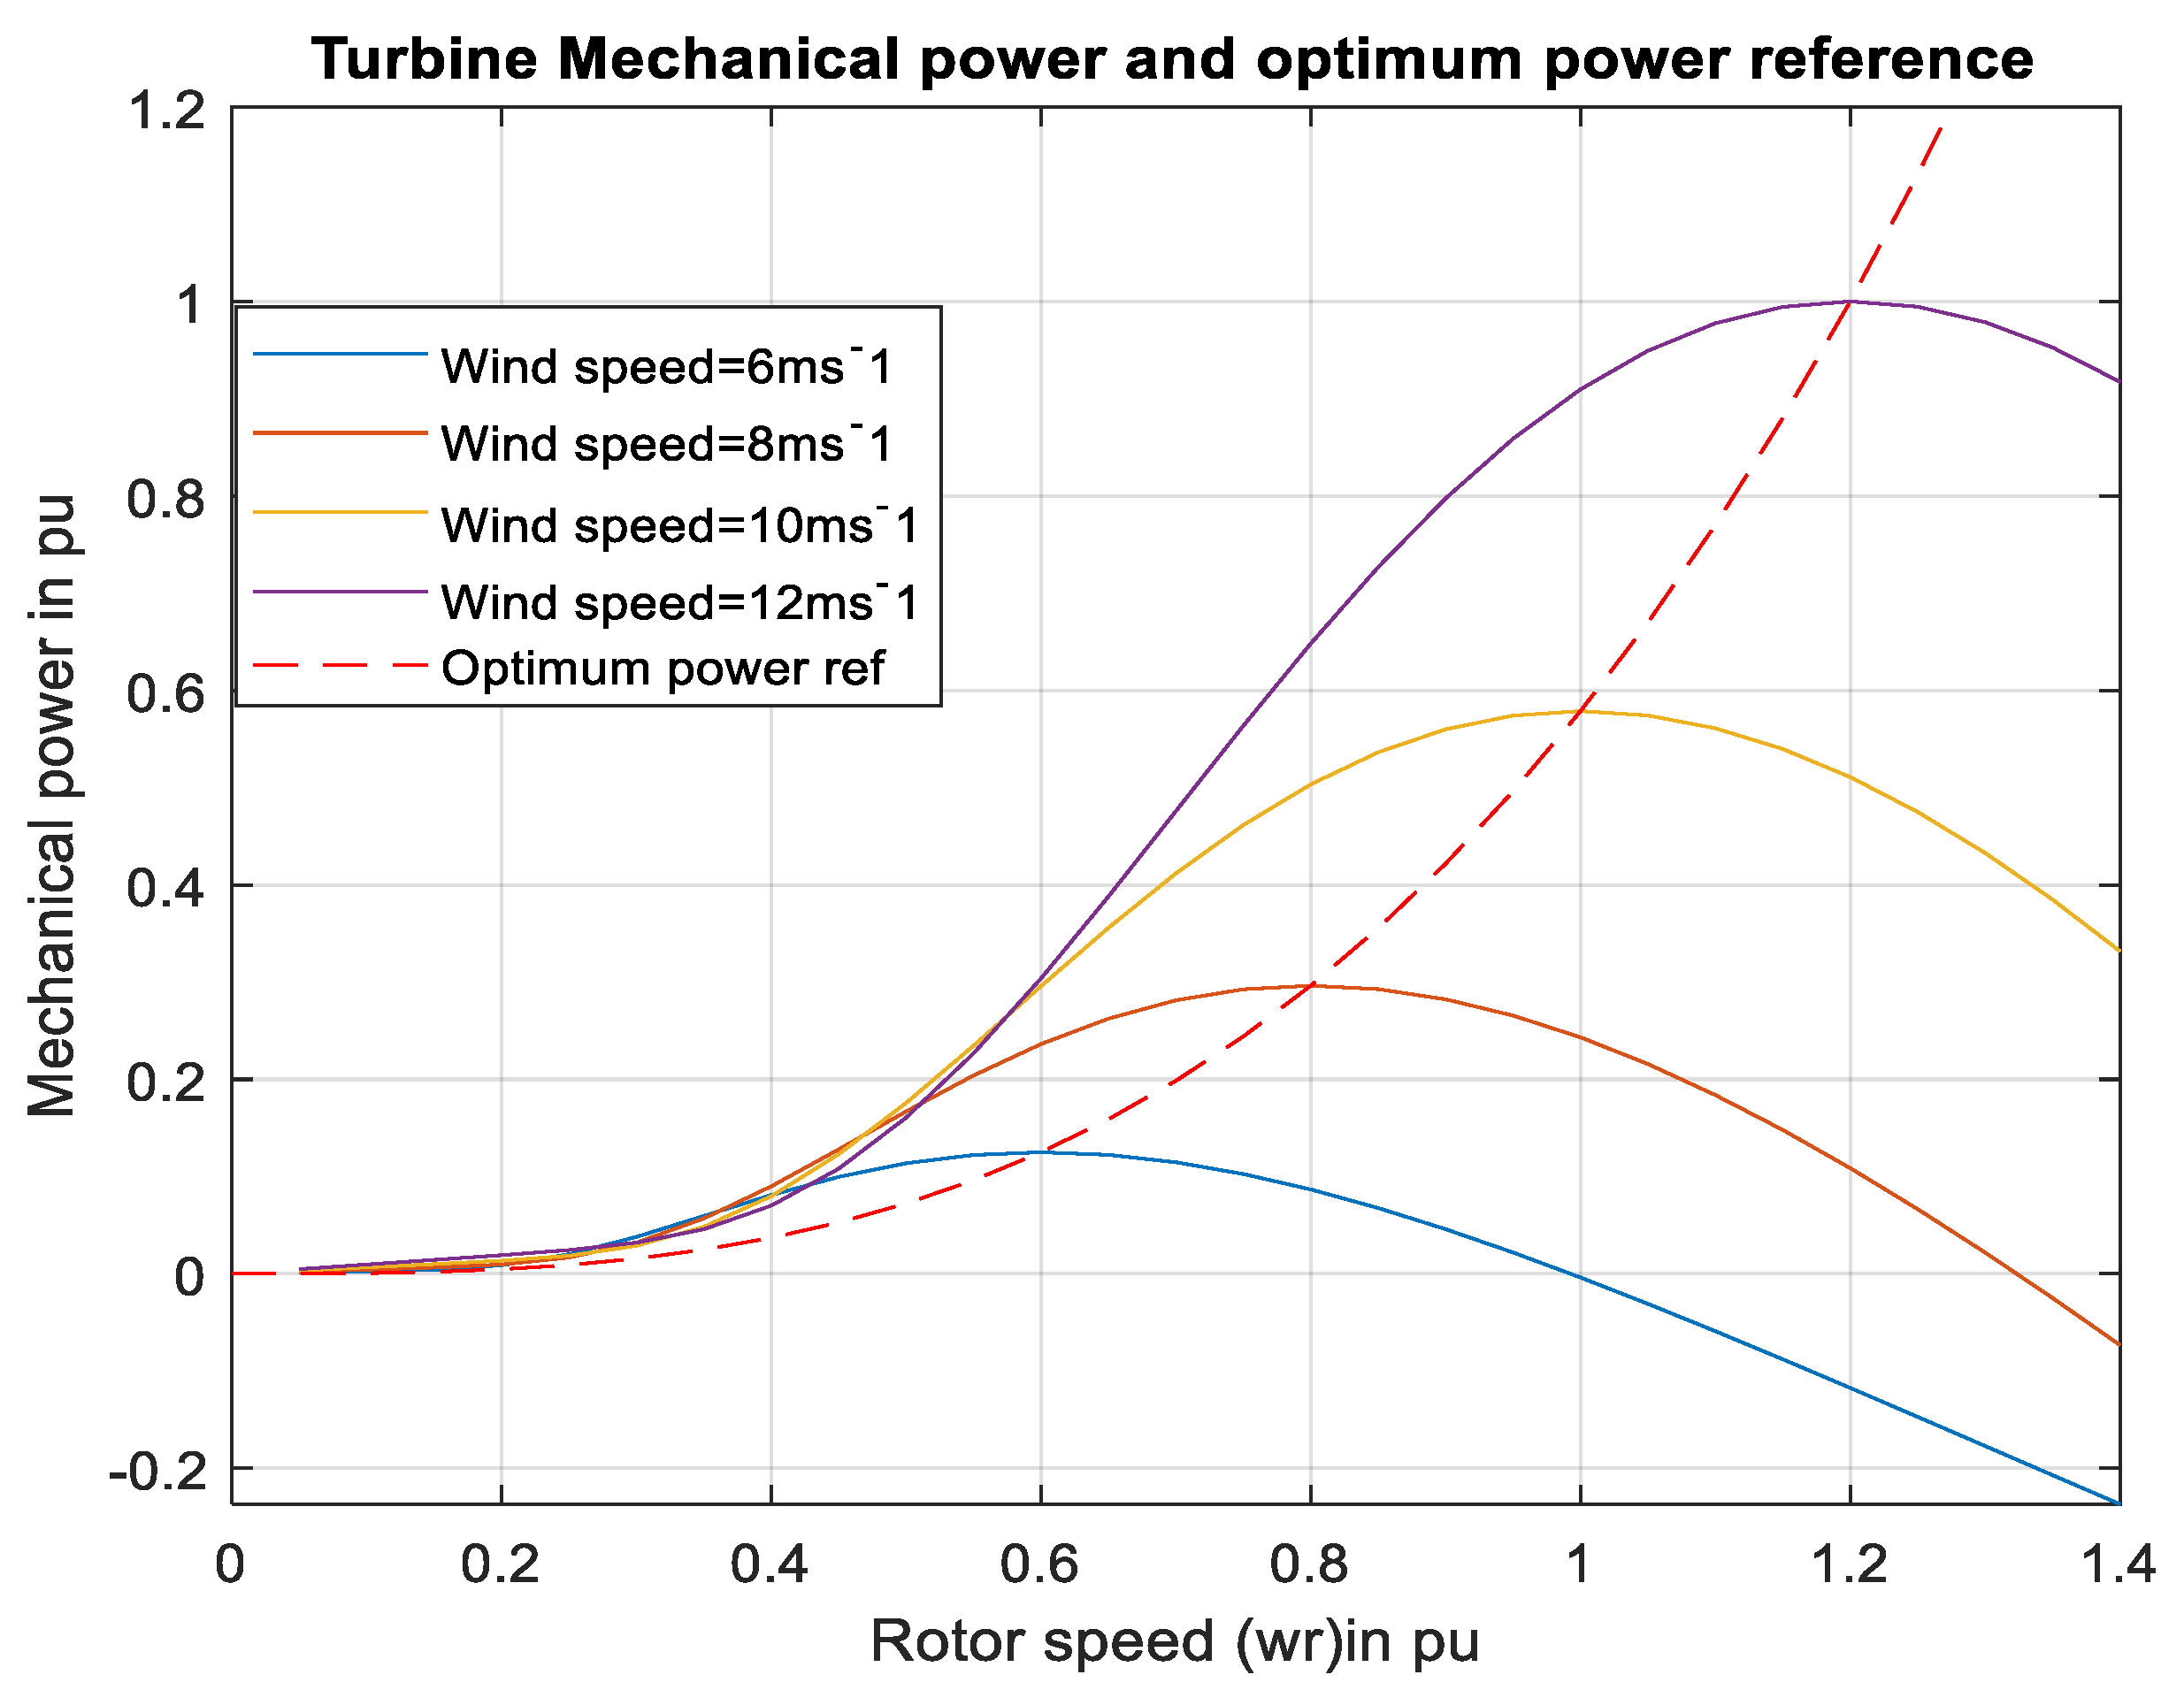
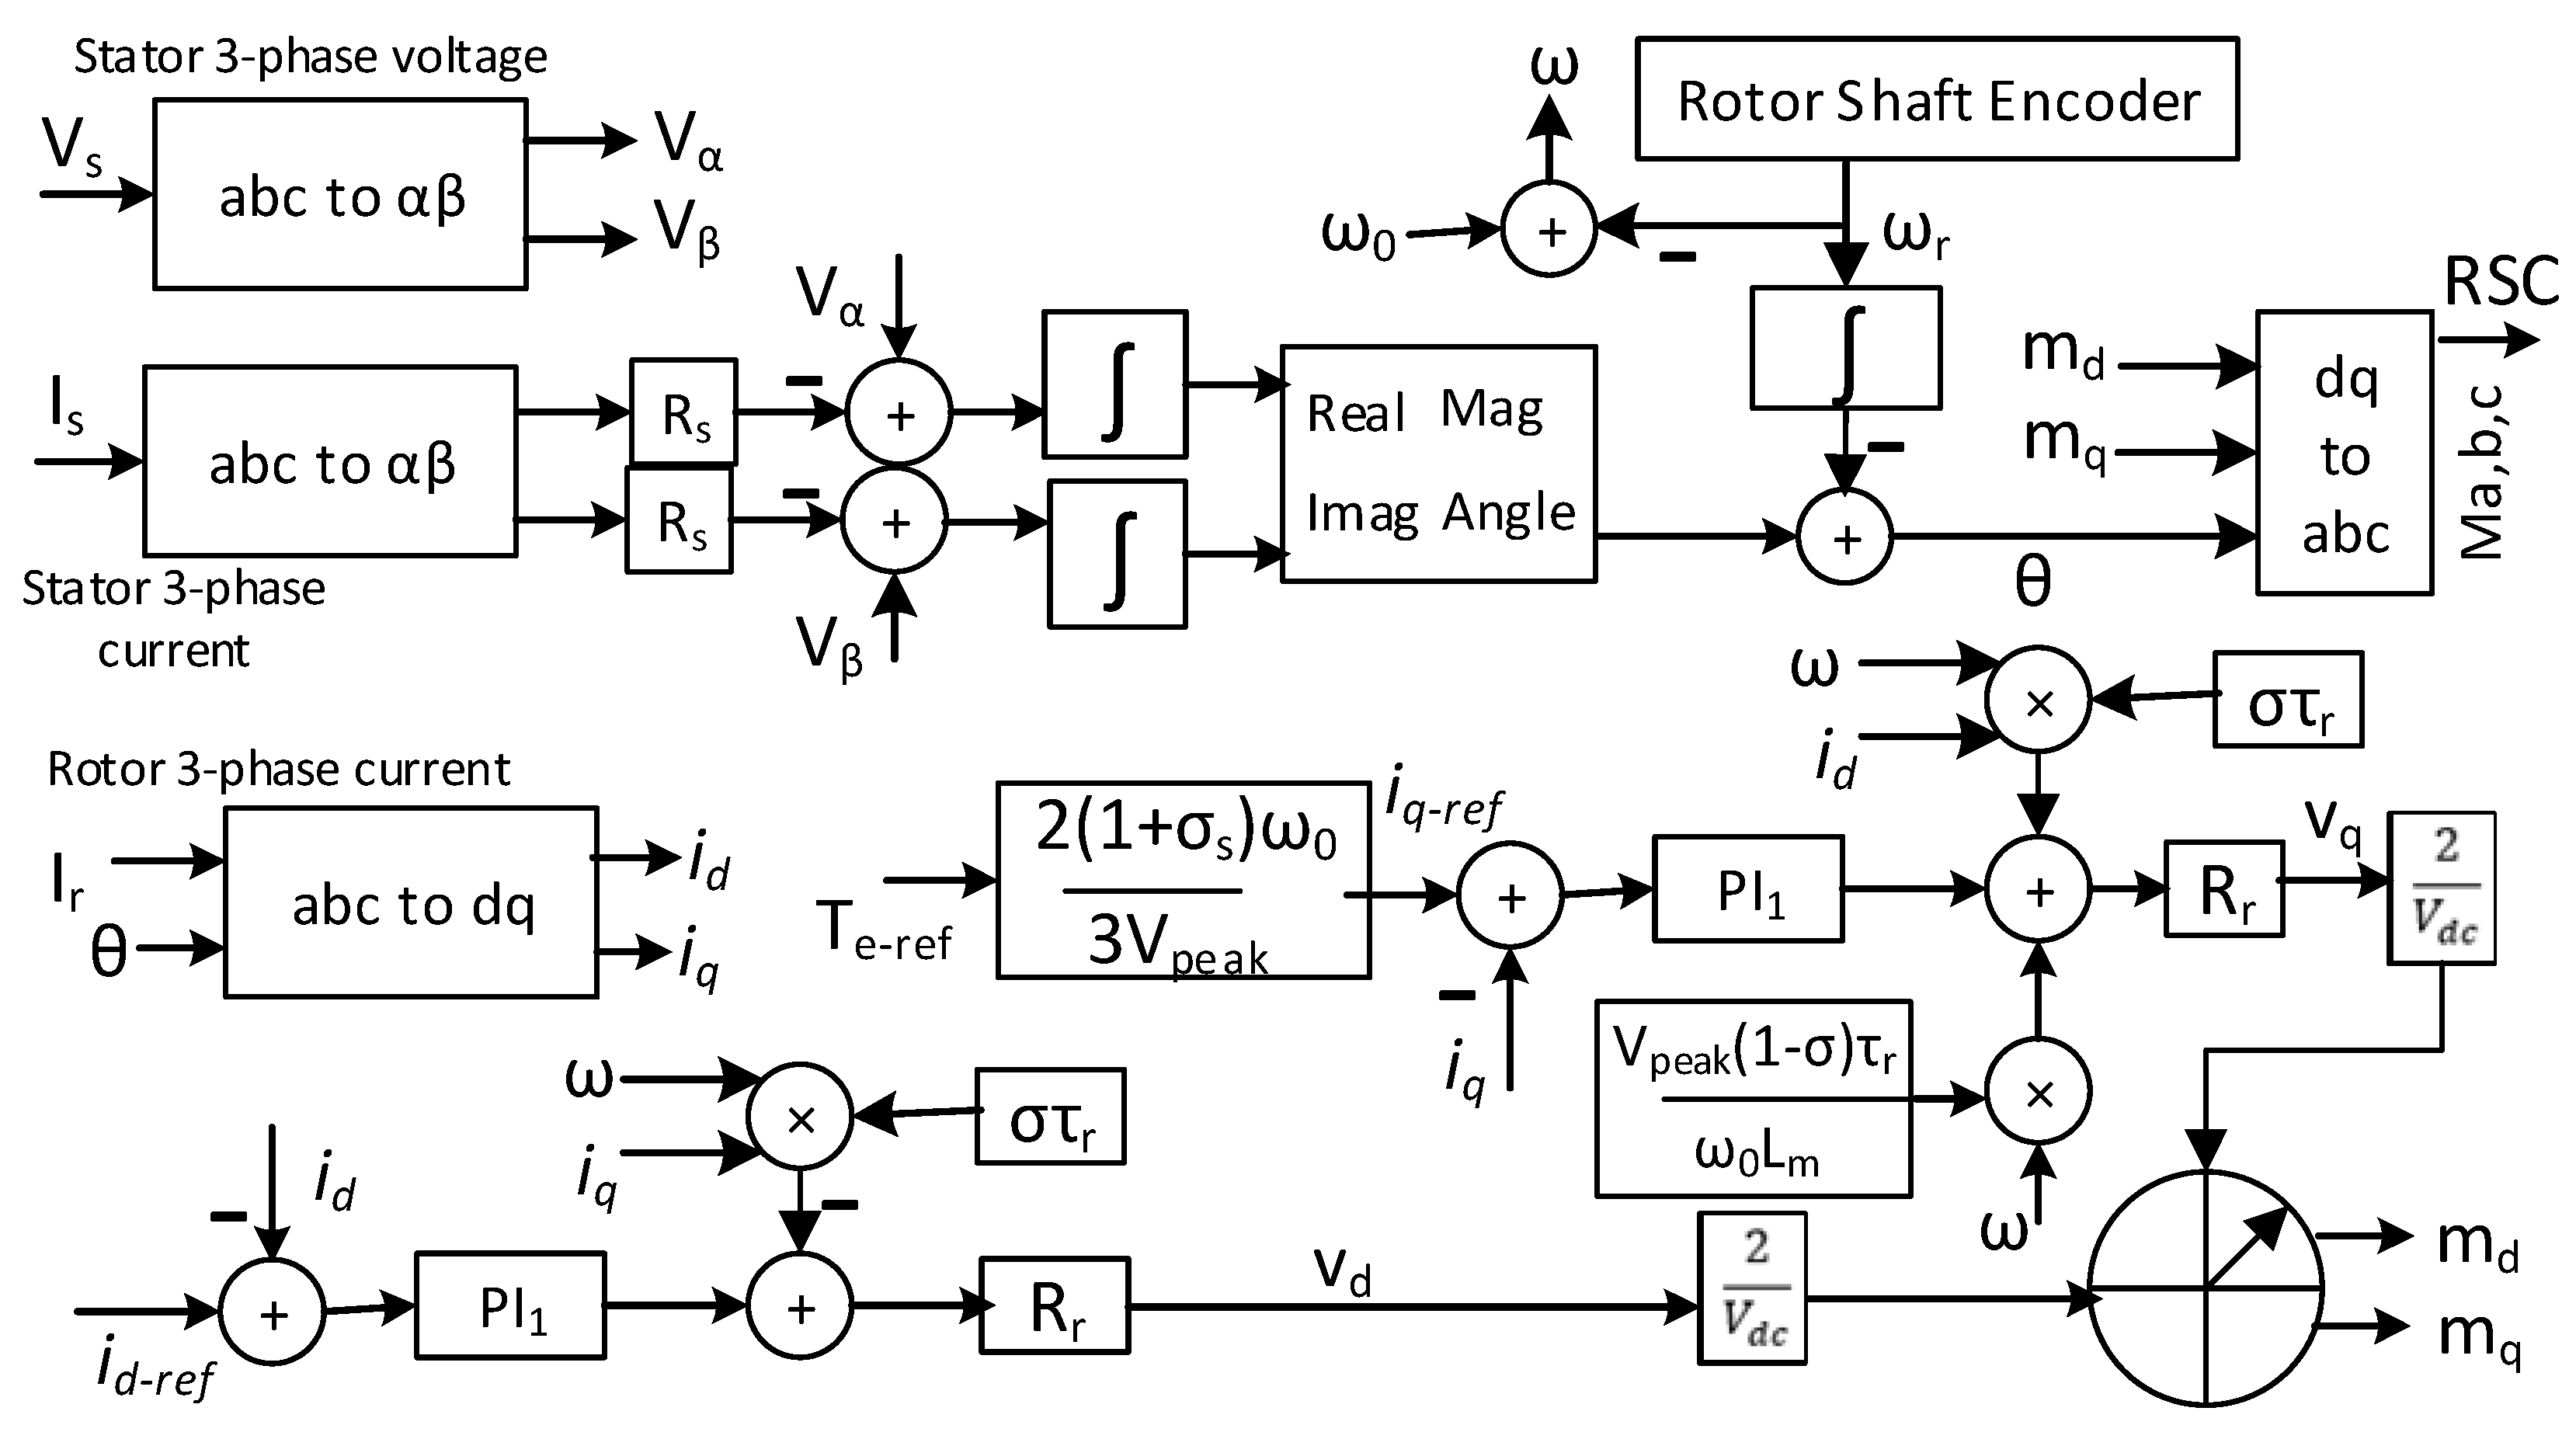
The doubly fed induction generator (DFIG) transfers two-thirds of wind energy through the stator terminal, while the rotor side converter might deliver or receive energy depending on rotor speed. From the wind turbine power versus generator speed curve, as shown in Figure 5, the optimal point of turbine mechanical energy varies with wind speed. The rotor side converter (RSC) controls the optimal electromagnetic torque set by the optimal point of wind energy employed field-oriented control. Since the DFIG is controlled from the rotor side converter, the slip angle (stator flux angle and rotor angle difference) is used to convert stationary rotor current into rotary dq current, and it is also used for generating the modulating signal. The stator flux is given in α-β frame as [43].
λ s α = V s α R s i s α d t
λ s β = ( V s β R s i s β ) d t
So, stator flux: λ s = λ s α + j λ s β
The magnitude of stator flux: λ s = λ s α 2 + λ s β 2
and angle of stator flux: λ s =   t a n λ s β λ s α 1
The rotor angle: θ r = ω r d t and slip angle θ = λ s - θ r
In the rotor-field coordinate, the following equation represents the machine d-q current [43]:
σ τ r d i d d t + i d = σ τ r ω i q + V d R r
σ τ r d i q d t + i q = σ τ r ω i d 1 σ τ r L m ω λ s + V q R r
where Stator time constant: τ s = 1 + σ s R s L m
Rotor time constant: τ r = 1 + σ r R r L m
Stator leakage factor: σ s = L s L m 1
Rotor leakage factor: σ r = L r L m 1
Leakage factor of DFIG: σ = 1 1 1 + σ r 1 + σ s , and slip frequency: ω = ω 0 ω r
i d   and   i q   are the dq current in rotor field coordinate.
The reactive power ( Q s ) the interchange between the stator and the AC system is given by Q s = Magnetizing reactive power in the DFIG stator–rotor side reactive power of DFIG
= 3 2 V 2 L N p e a k 1 + σ s L m ω 0 3 2 V L N p e a k 1 + σ s i d
Reactive current of RSC could be controlled by the id, but magnetizing reactive power drawn from the stator voltage remains constant. Therefore, based on the value of id, DFIG can work as a unity, lagging, and leading power factor generator. The electromagnetic torque:
T e = 3 V L N p e a k 2 1 + σ s ω 0 i q
Apart from the i q current, the remaining parameters in Equation (12) are constant, which means the i q current controls the electrical torque.
Reference electrical torque is obtained from the wind turbine characteristics curve, which further generates the reference q-axis current using Equation (12). In contrast, the d-axis reference current is obtained from Equation (11). Finally, the reference dq axis current is controlled by the Equations (9) and (10). Figure 6 shows the rotor side control of DFIG. Any current deviation is processed through a PI controller (PI1), which is further added with the decoupling term and produces dq axis voltage for the rotor side converter (RSC). Finally, the modulating signal (abc signal) is generated from the dq axis voltage with the help of slip angle. On the other hand, the grid side converter (GSC) maintains the fixed DC link voltage. Power flow is bidirectional in the grid side converter since it receives power if the rotor speed is lower than the synchronous speed and vice versa. The operation of the grid side converter is the same as the GSC of PV illustrated in Figure 1. However, DC link voltage reference is constant.

2.3. SCIG-Based Wind Energy Included MMC-HVDC Transmission Network

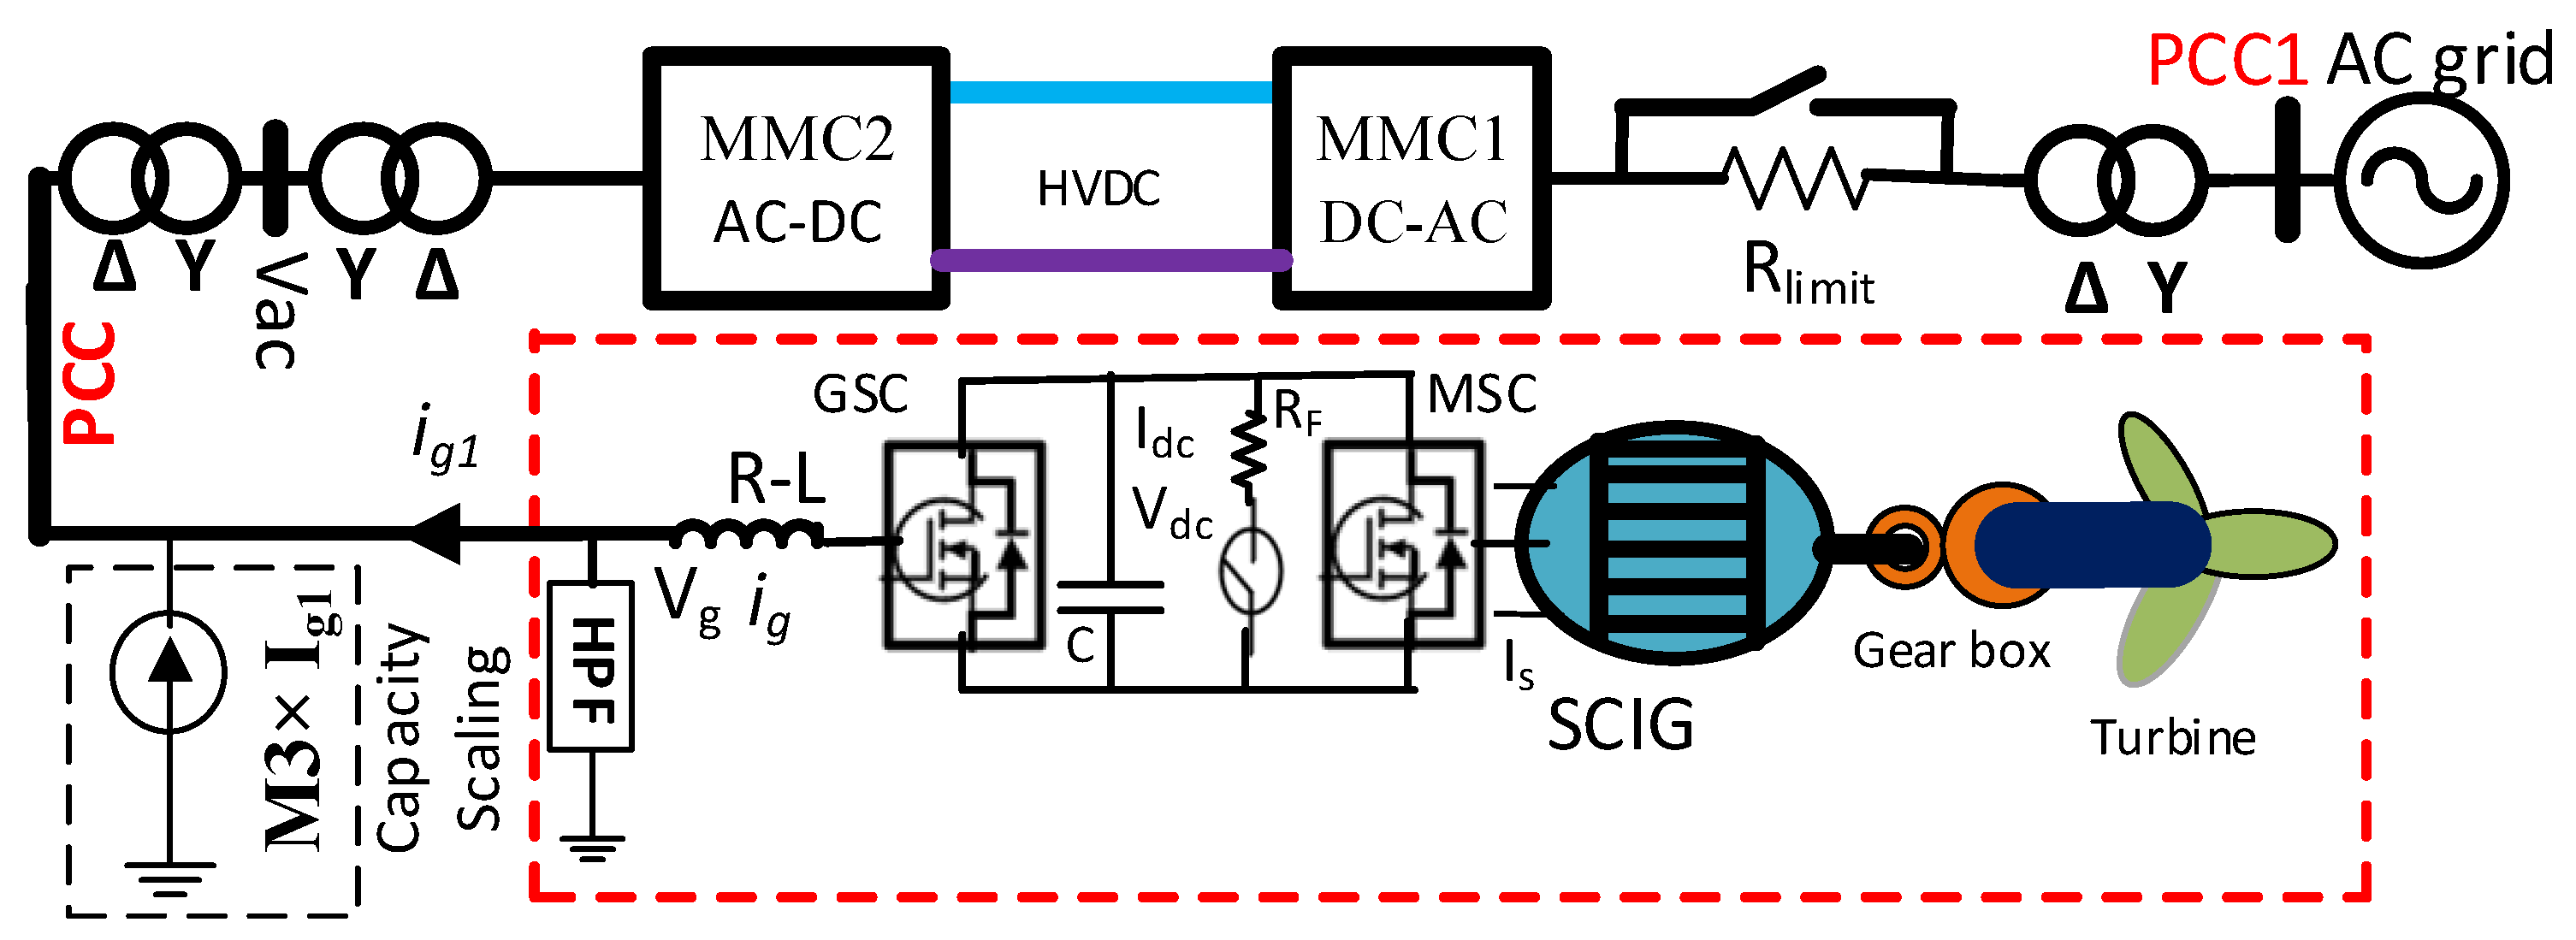
SCIG-based wind energy connected MMC-HVDC network is illustrated in Figure 7. MMC1 regulates the HVDC link voltage, and MMC2 creates the AC voltage for the wind farm integration. The full-scale converter integrates wind energy generated from SCIG with the PCC. The machine-side converter (MSC) and grid side converter (GSC) operations are almost identical to the converter used in DFIG. However, finding the slip angle for SCIG differs from DFIG. Unlike DFIG, the stator voltage of SCIG is not sinusoidal but PWM wave, which introduces complications of using Equations (7) and (8). The rotor speed, parameters, and stator current information are used to find the rotor flux position. The slip angle is used in the rotor side converter of DFIG for dq conversion, while the rotor flux angle is used in the stator side converter of SCIG for such conversion. The grid side converter operates similarly to the GSC converter of DFIG. Therefore, further discussion is not repeated here. In the rotor-field dq coordinate, the following equation dictates the SCIG stator current [43]:
σ τ s d i d d t + i d = σ τ s ω i q + V d R s
σ τ s d i q d t + i q = σ τ s ω i d 1 σ τ s ω i m r + V q R s
The rotor flux position is the central part of the field-oriented control. The following equation provides the rotor flux position:
θ = ω d t = ω r + i q τ r i m r d t
The following equation relates the magnetizing current with the d-axis current:
τ r d i m r d t + i m r = i d
The generated electrical torque is:
T e = 3 L m 2 1 + σ r i m r i q
As the magnetizing current ( i m r ) of SCIG is constant, i q current controls the generated electrical torque. The following equation denotes the required magnetizing current of SCIG:
i m r _ r e f = i d _ r e f = 2 3   V l i n e   t o   l i n e   r m s 1 + σ s L m ω 0
Stator time constant: τ s = 1 + σ s R s L m
Rotor time constant: τ r = 1 + σ r R r L m
Stator leakage factor: σ s = L s L m 1
Rotor leakage factor: σ r = L r L m 1
Leakage factor of SCIG: σ = 1 1 1 + σ r 1 + σ s
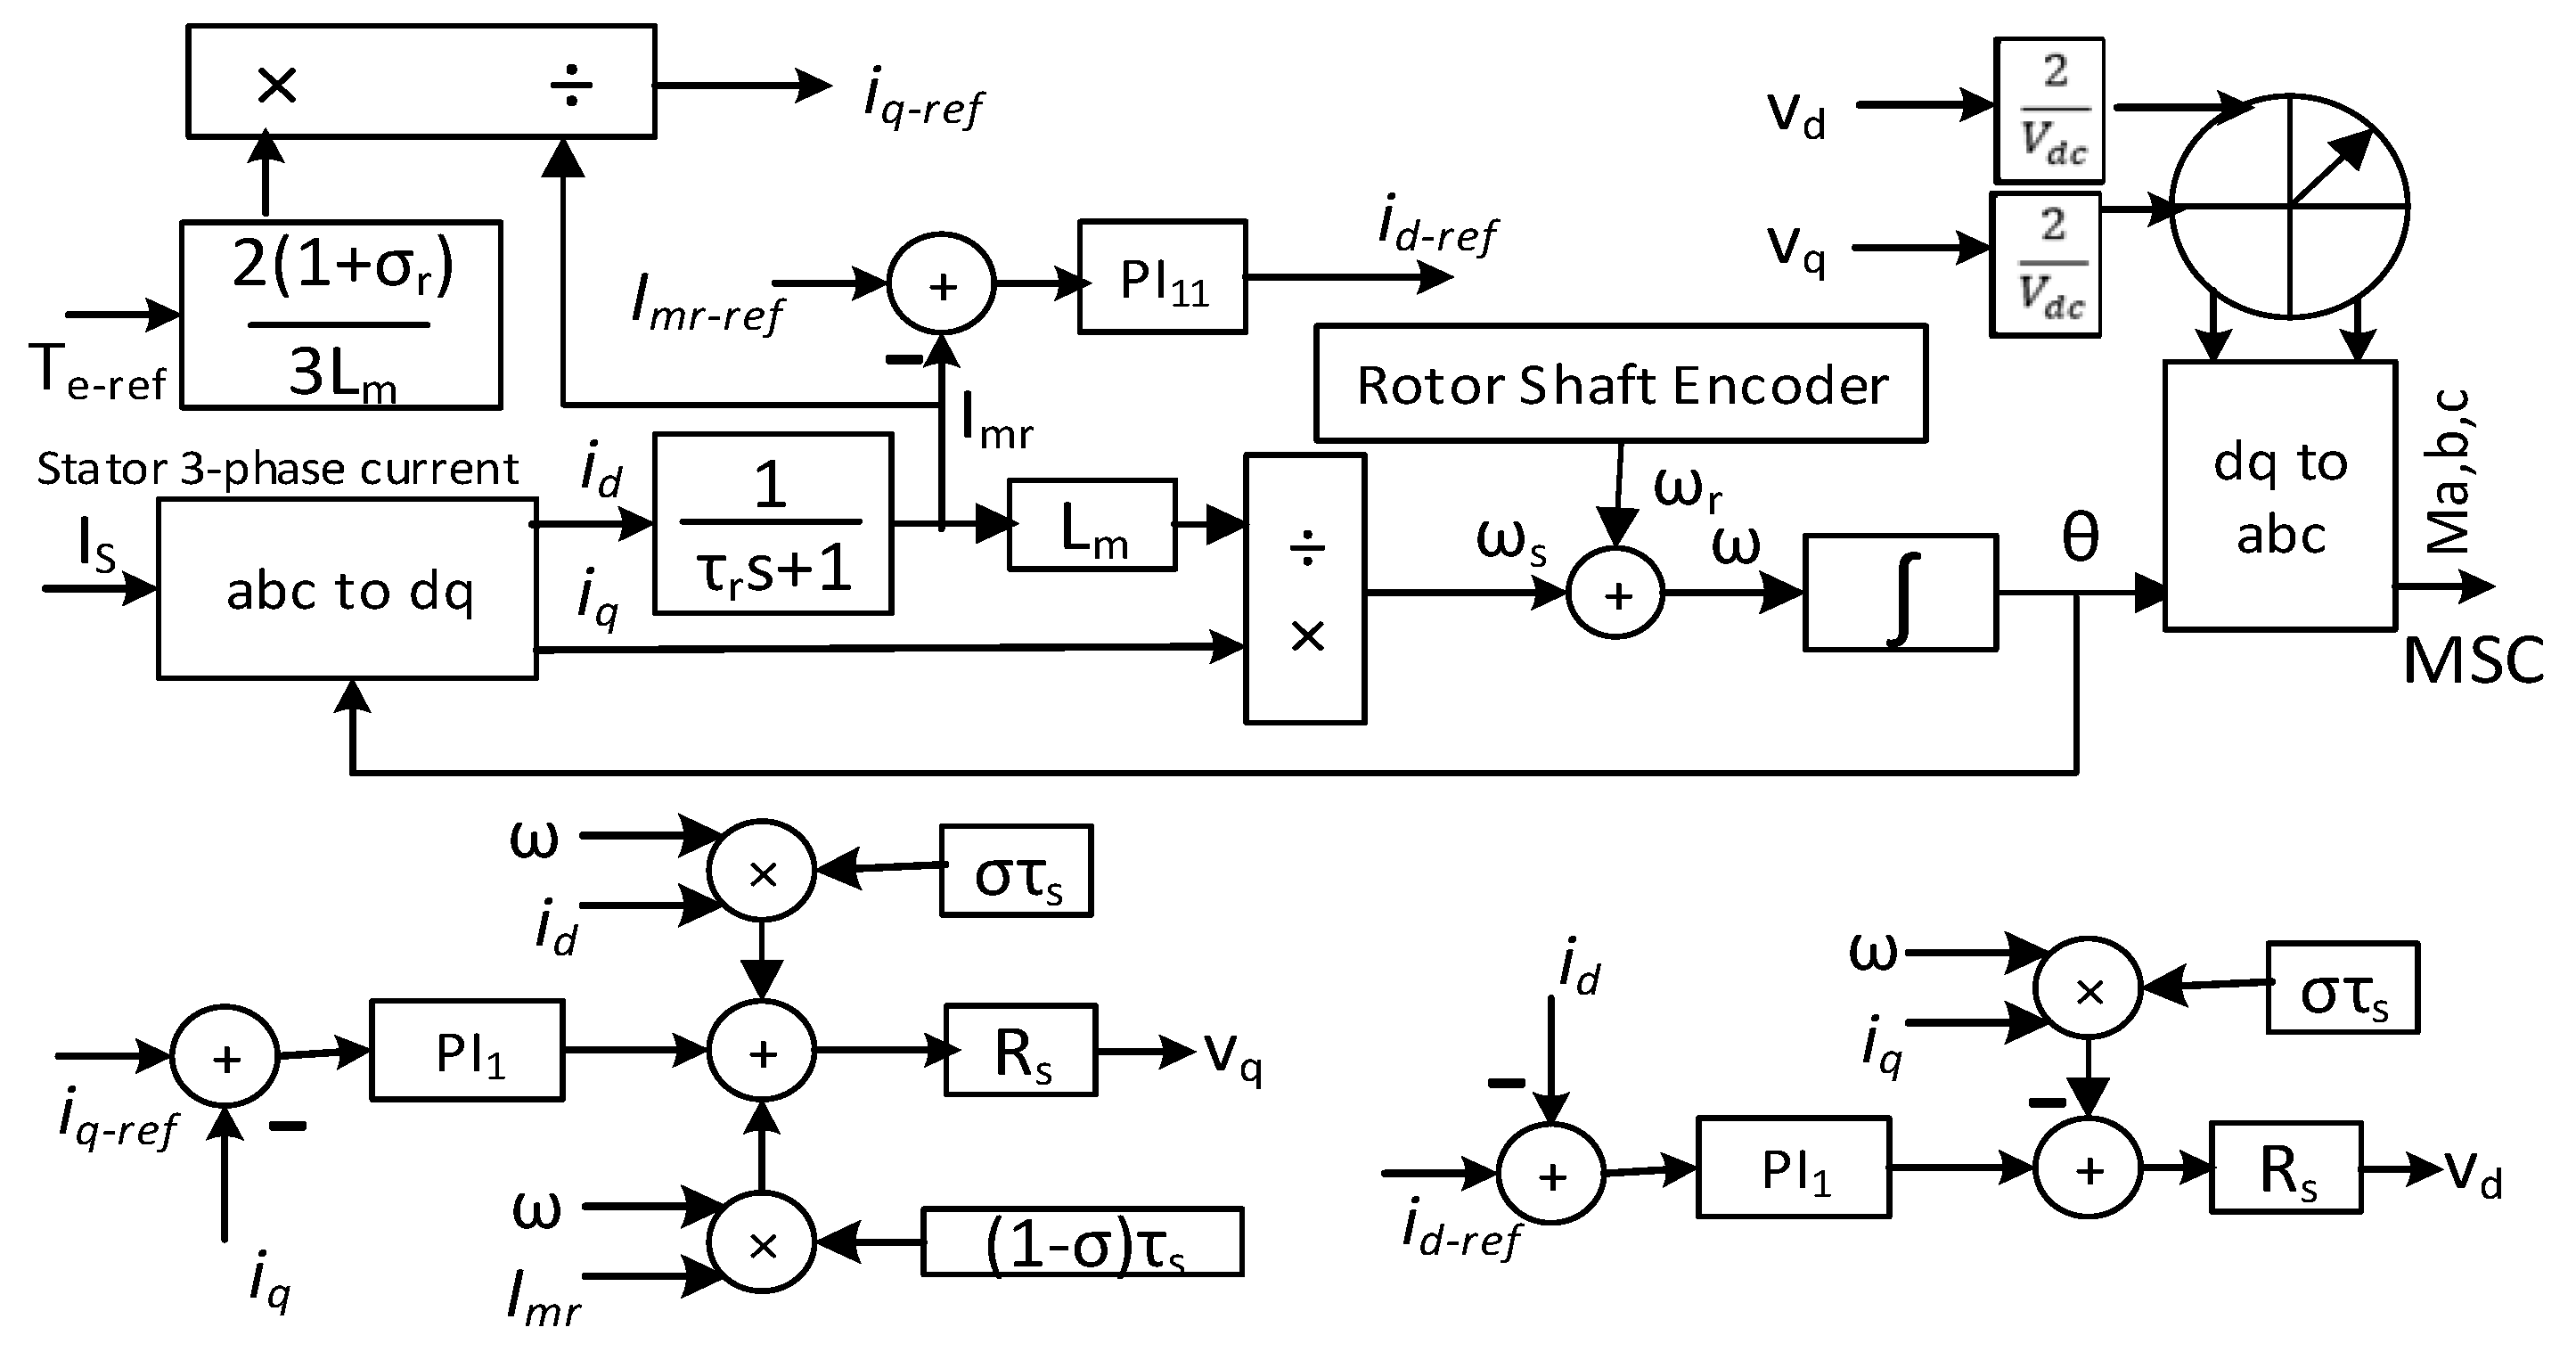
The wind turbine characteristics curve generates the optimum electrical torque reference, which further produces reference q-axis current using Equation (17). Instead of externally connected fixed capacitance, the MSC provides the required reference magnetizing current, which is found in Equation (18). Figure 8 shows the SCIG side converter control. Equation (16) consists of a PI controller (PI11) to control the magnetizing current and produce reference d-axis current. Finally, the converter dq axis voltage is generated based on Equations (13) and (14) to control the reference dq axis current. Any current deviation is processed through a PI controller (PI1), which is further added with the decoupling term and produces the dq axis voltage for the MSC. Finally, the modulating signal (abc signal) is generated from the dq axis voltage with the help of the rotor flux angle.

2.4. PMSG-Based Wind Energy Included MMC-HVDC Transmission Network

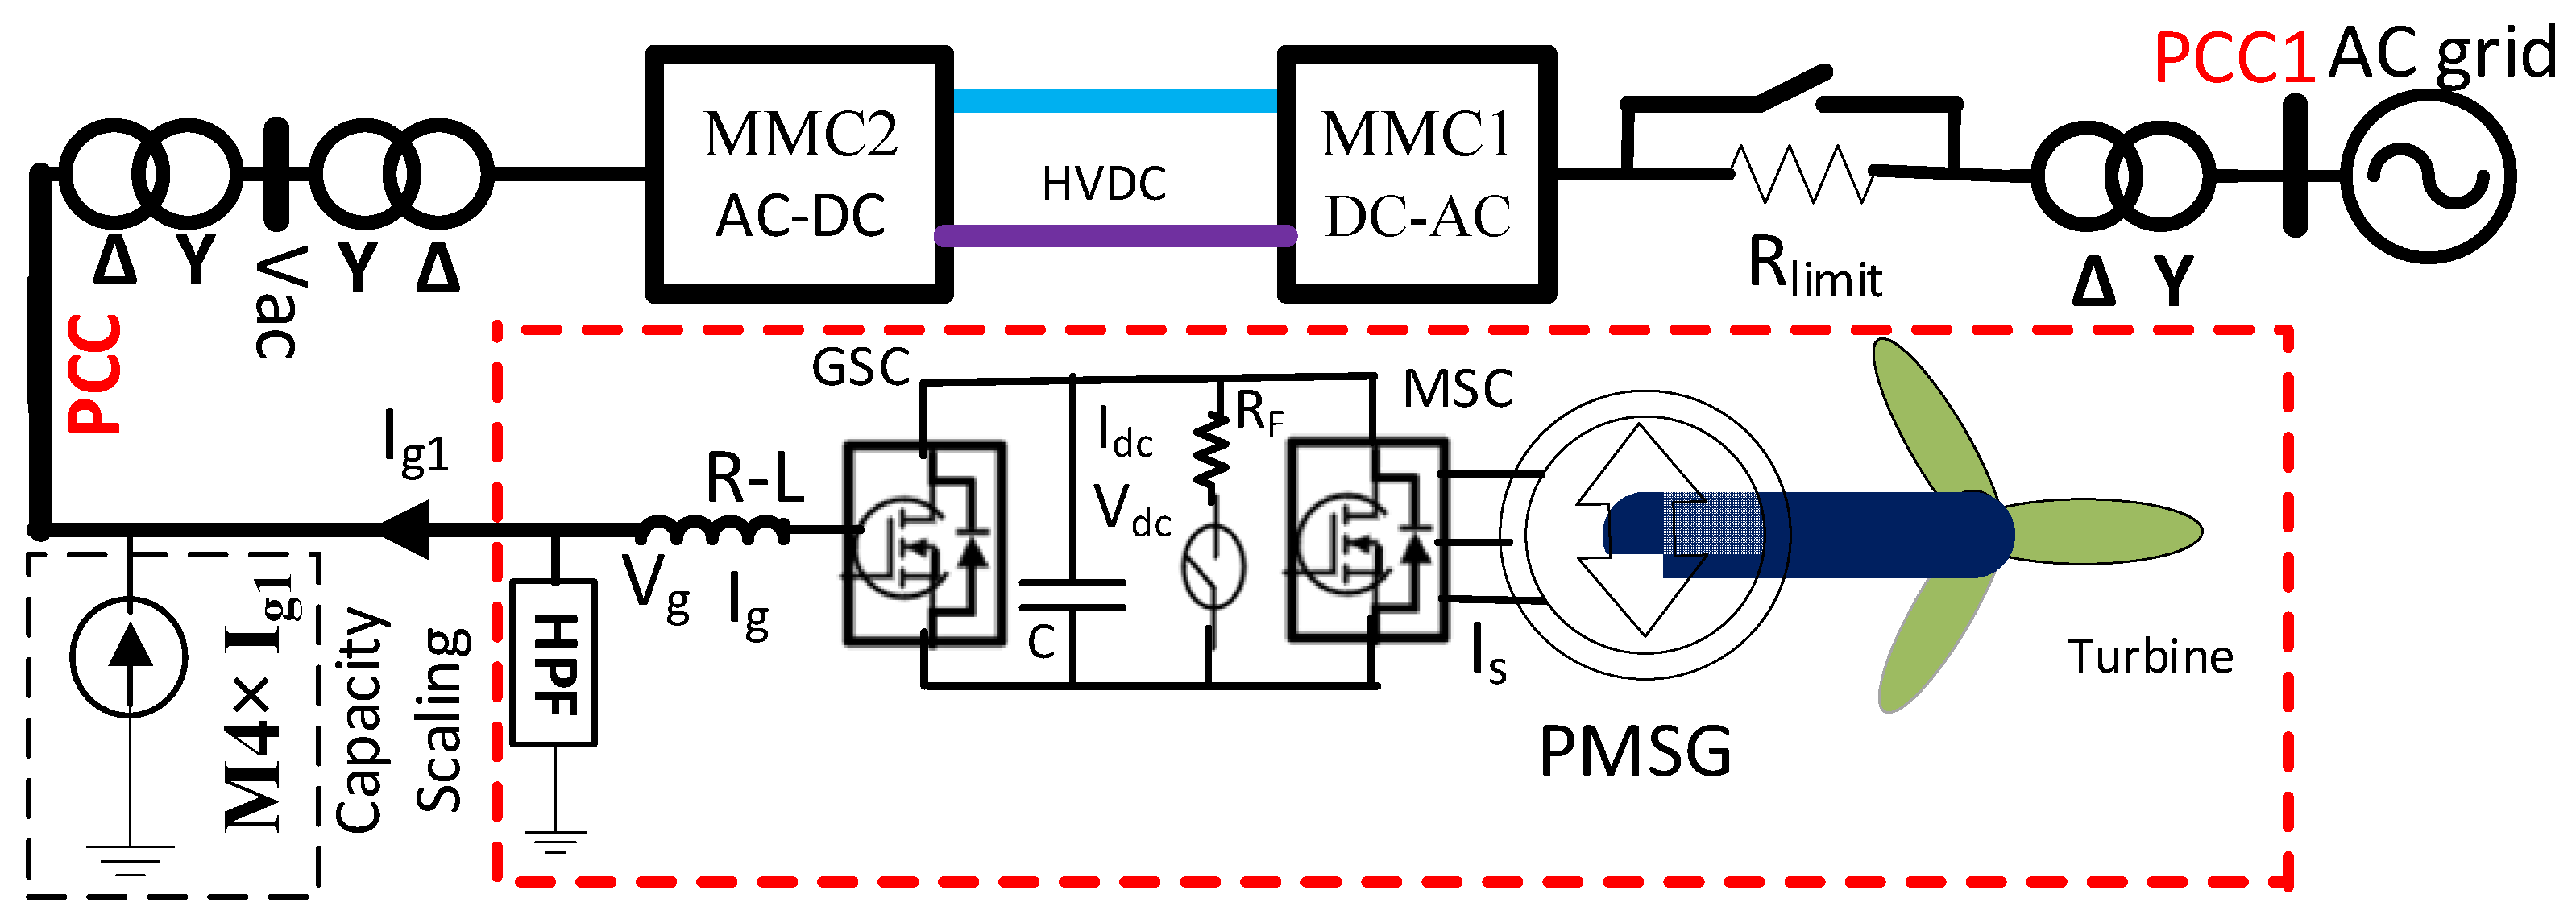
PMSG-based wind energy comprised MMC-HVDC network is illustrated in Figure 9. MMC1 regulates the HVDC link voltage, and MMC2 creates the AC voltage for the wind farm integration. The full-scale converter is also used to integrate wind energy generated from PMSG with the PCC. The grid side converter operates similarly to the grid side converter of SCIG. Hence, it is not repeated here. By controlling electromagnetic torque employing field-oriented control (FOC), machine side converter (MSC) tracks the peak point of wind energy at different wind speed. However, wind turbine characteristics is same as SCIG. In rotor-field dq coordinate, the following equation dictates the PMSG stator current [43]:
L d d i d d t + R s i d = L q ω i q + V d
L q d i q d t + R s i q = L d ω i d λ m ω + V q
Unlike DFIG and SCIG, only the encoder retrieves the rotor flux position of PMSG. Therefore, no external reactive power is required to operate PMSG. Hence, the reactive current of MSC is regulated at zero. As a result, the stator phase current is transformed into dq current with the angle of rotor flux position.
The electromagnetic torque:
T e = 3 2 λ m P i q
Equation (21) indicates that the q-axis current controls the electrical torque while the reactive current remains zero.
Finally, MSC current controller is formed based on Equations (19) and (20). Figure 10 shows the PMSG side converter control. Then, any current deviation is processed through a PI controller (PI1), which is further added with the decoupling term and produces the dq axis voltage for the MSC. Finally, the modulating signal (abc signal) is generated from the dq axis voltage with the help of the rotor flux angle.

2.5. MMC1-HVDC Link Voltage and MMC2-AC Link Voltage Control

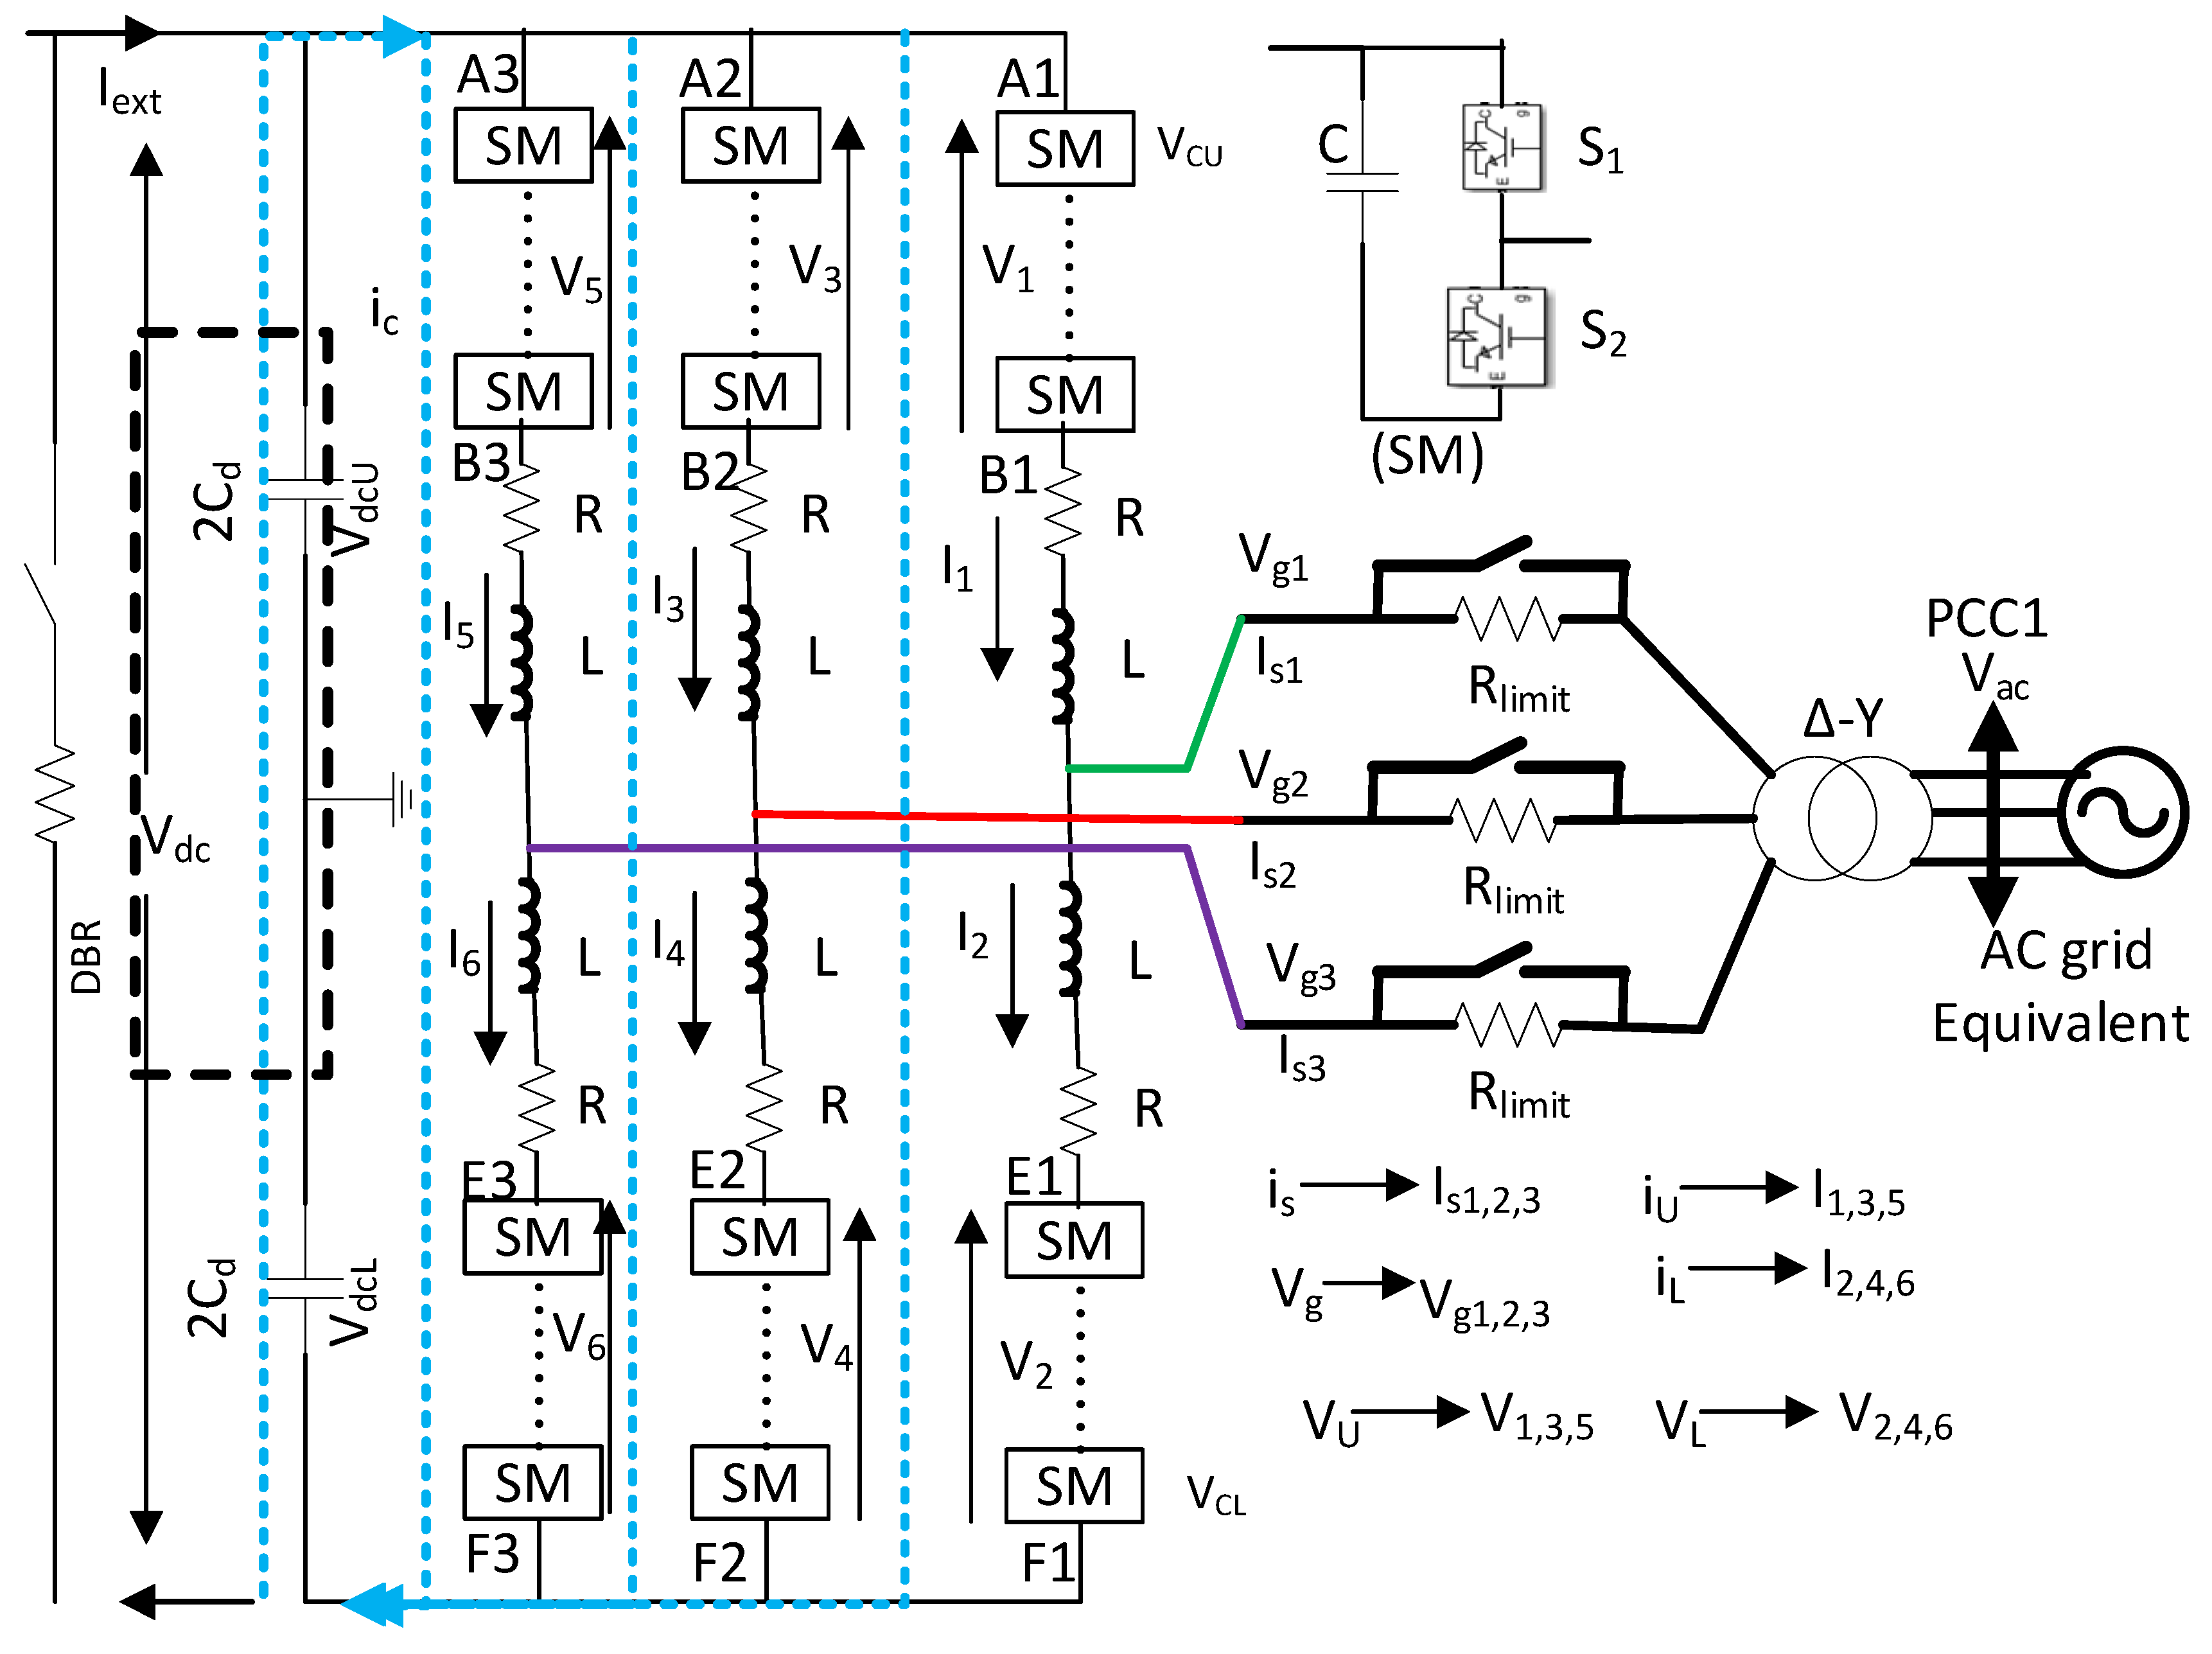
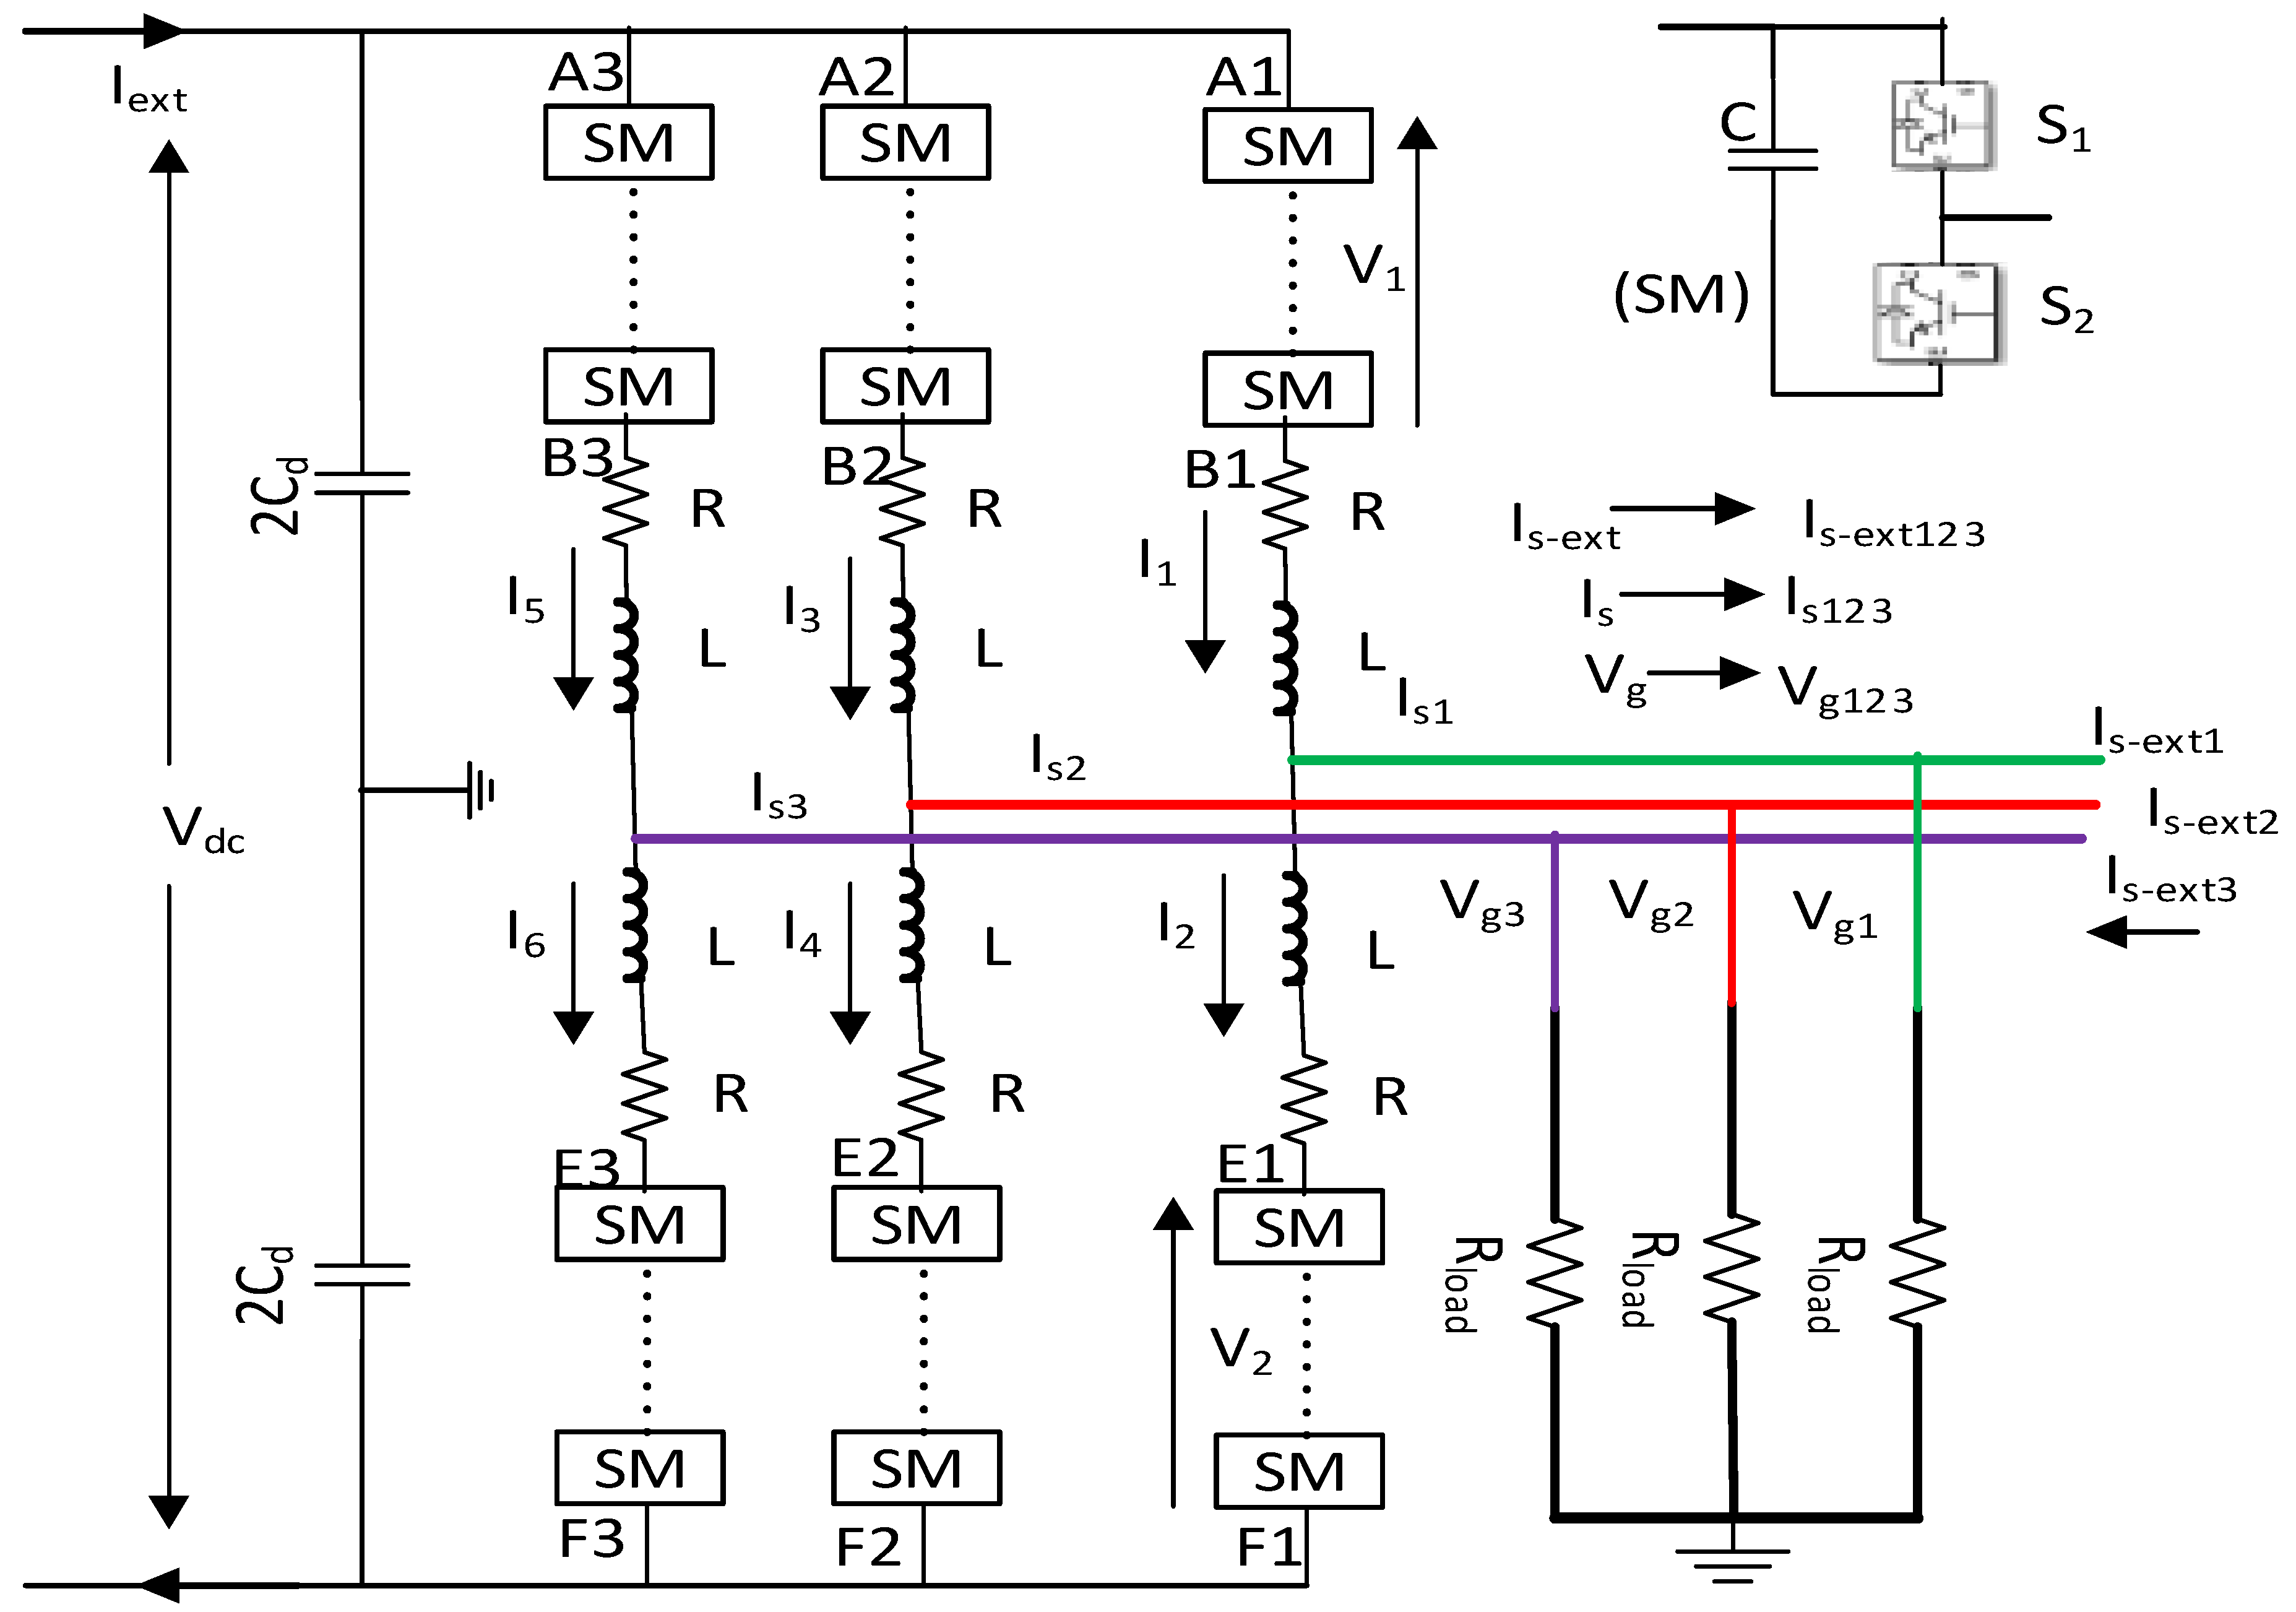
The MMC is the fundamental unit of the VSC-HVDC transmission network. Figure 11 and Figure 12 show the equivalent circuit for the MMC1 and MMC2, respectively. Circulating arm current and submodule balancing control are required from the outer loop and outer current control loop.

2.5.1. High-Level Control

High-level control generates the reference current for the MMC1 and MMC2. MMC1 controller generates the positive sequence real current from the HVDC link voltage controller loop. The following equation describes the effective HVDC link voltage dynamics of MMC1, where V d c 2 is the HVDC link voltage, P a c is the AC side power, and P dc is the HVDC link power:
C d 2 d V d c 2 dt = P dc P a c  
Positive sequence reactive current comes from the reactive power support due to voltage drops at PCC1, defined by the following equation:
i s q r e f + = K + 0.9 V d +
AC voltage controller provides reference current for the MMC2. As an alternative to capacitance, a small resistive load is placed on the AC side of MMC2 to employ a feedforward controller for the AC voltage control of MMC2. Along with the feedforward controller, the PI controller is also used to take counter adjustments for the AC voltage difference. The q-axis AC voltage (Vsq-ref) is controlled to zero. Negative sequence currents for MMC1 and MMC2 are regulated at zero. Usually, zero-sequence current does not flow in the Δ-transformer. Therefore, the Δ-side voltage of MMC1 in the αβ frame is:
V g = V g α + j V g β
The two second order generalized integrator quadrature signal generator (SOGI-QSG) are used for the positive and negative sequence voltage extraction. The following equation gives the direct and quadrature component of V g α β [44]:
V g α β = k ω 1 s s 2 + k ω 1 s + ω 1 2 V g α β
q V g α β = k ω 1 2 s 2 + k ω 1 s + ω 1 2 V g α β
The positive and negative sequence component of V g is given as:
V g + = V α + + j V β + = 1 2 ( ( V g α q V g β ) + j ( q V g α + V g β ) )
V g = V α + j V β = 1 2 ( ( 2 V α + q V g β ) + j 2 V β + )
The high-level control and reference current generation of MMC1 and MMC2 is presented in Figure 13.
The PI controller generates a steady-state error during sinusoidal current tracking [44]. This work uses a proportional resonant (PR) controller for sinusoidal current tracking.

2.5.2. Low Level Control

The outer current (is) dynamics of MMC, as shown in Figure 11 and Figure 12 is given as:
L 2 di s dt + R 2 i s = V s V g
PR = K p + K R s s 2 + ω 1 2
Apart from outer current control, a circulating arm current controller is required to convert the circulating current into only the dc component. The circulating current consist of a negative sequence current with angular frequency 2 ω 0 , and the following equation dictates its dynamics [45]:
L di cd dt + Ri cd + 2 L ω 0 i cq = V ccd
L di cq dt + Ri cq 2 L ω 0 i cd = V ccq
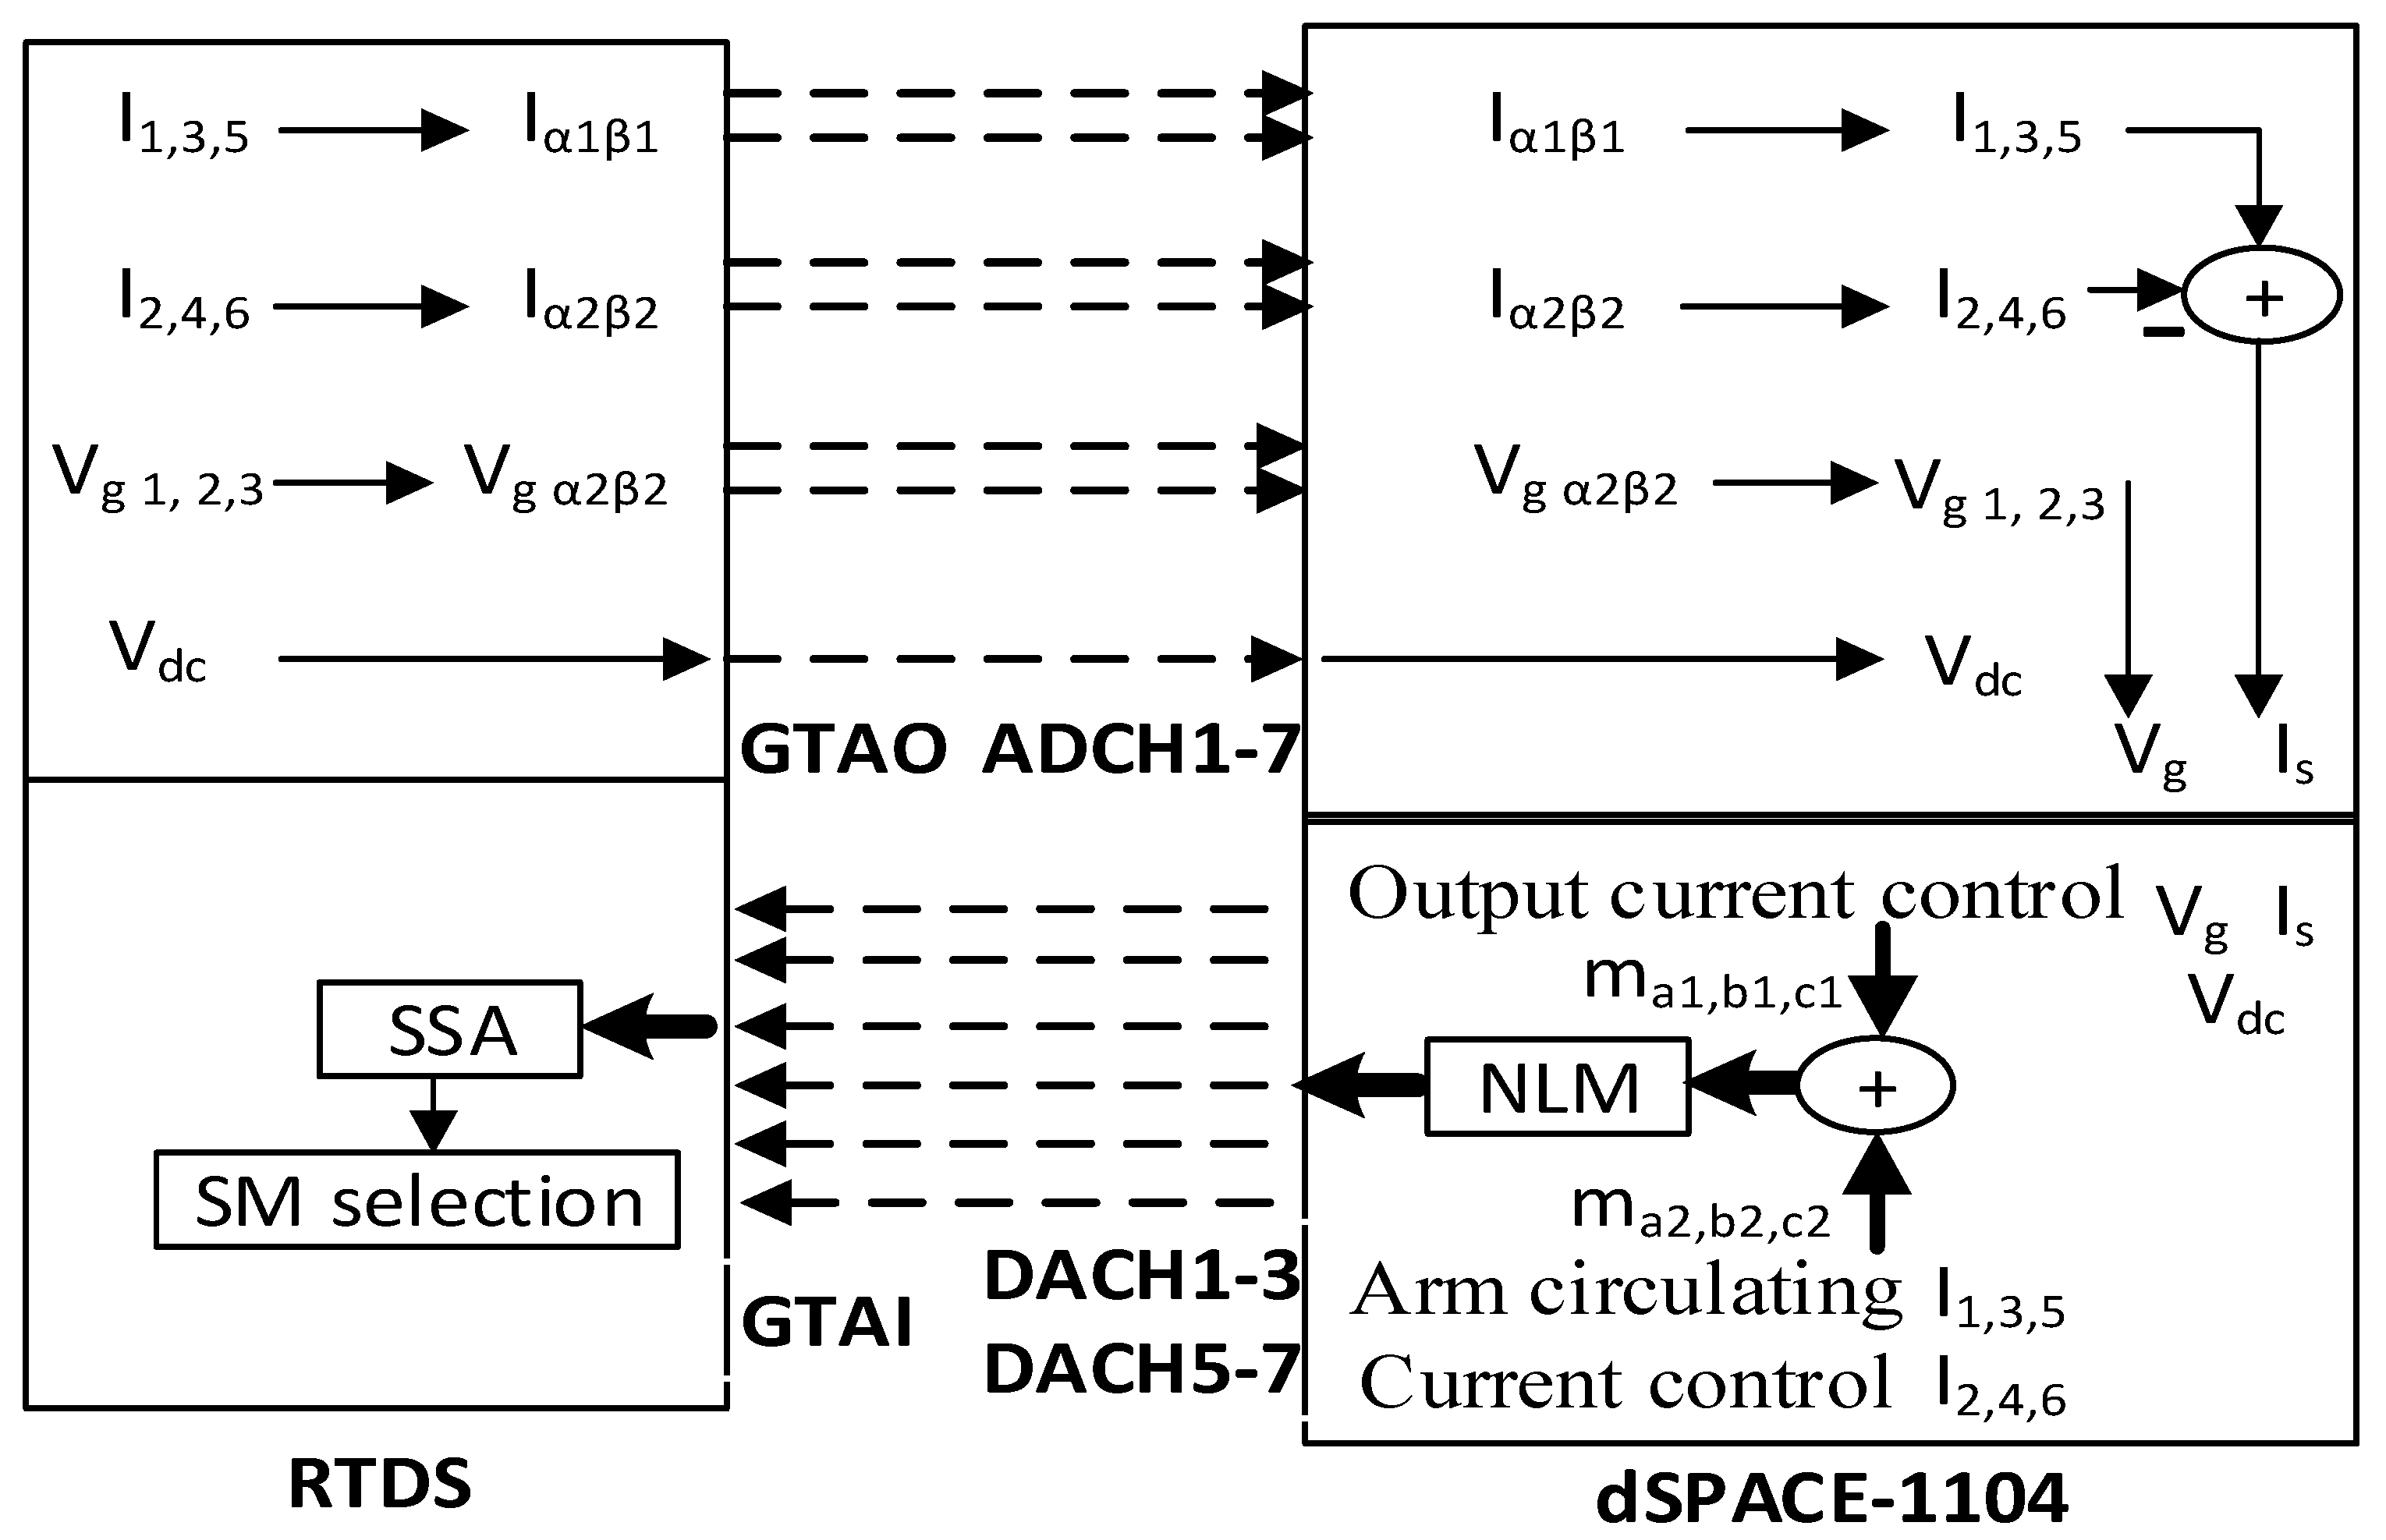
The first two terms of the left-hand side of Equations (31) and (32) process through the PI controller. The output of the PI controller adds to the decoupling term and produces the required adjustment in terms of V ccd and V ccq , which finally produces modulating signal. Modulating signal from inner current control and circulating current control goes through the nearest level modulation (NLM) to generate the number of submodules. Since the submodule (SM) capacitor voltage drifts from each other within the upper or lower arm, a submodule-sorting algorithm (SSA) is employed to place the higher voltage submodules if the current leaves or lower voltage submodules if the current enters. Figure 14 shows the outer current, arm circulating current, and submodule balancing control of MMC. Any severe fault in the PCC of AC grids (PCC1) dramatically reduces the MMC1 capacity for transferring energy to the AC grids, which raises the HVDC link voltage. Dynamic braking resistor (DBR) is designed to dissipate the excess energy during the low voltage faults at PCC1. During the single-line-to-ground (SLG), double-line-to-ground (DLG), and three-line-to-ground (3LG) faults at PCC1, DBR is turned on when HVDC link voltage is above 1.2 pu, then turned off when HVDC link voltage is below 1.1 pu.

3. Result and Discussion

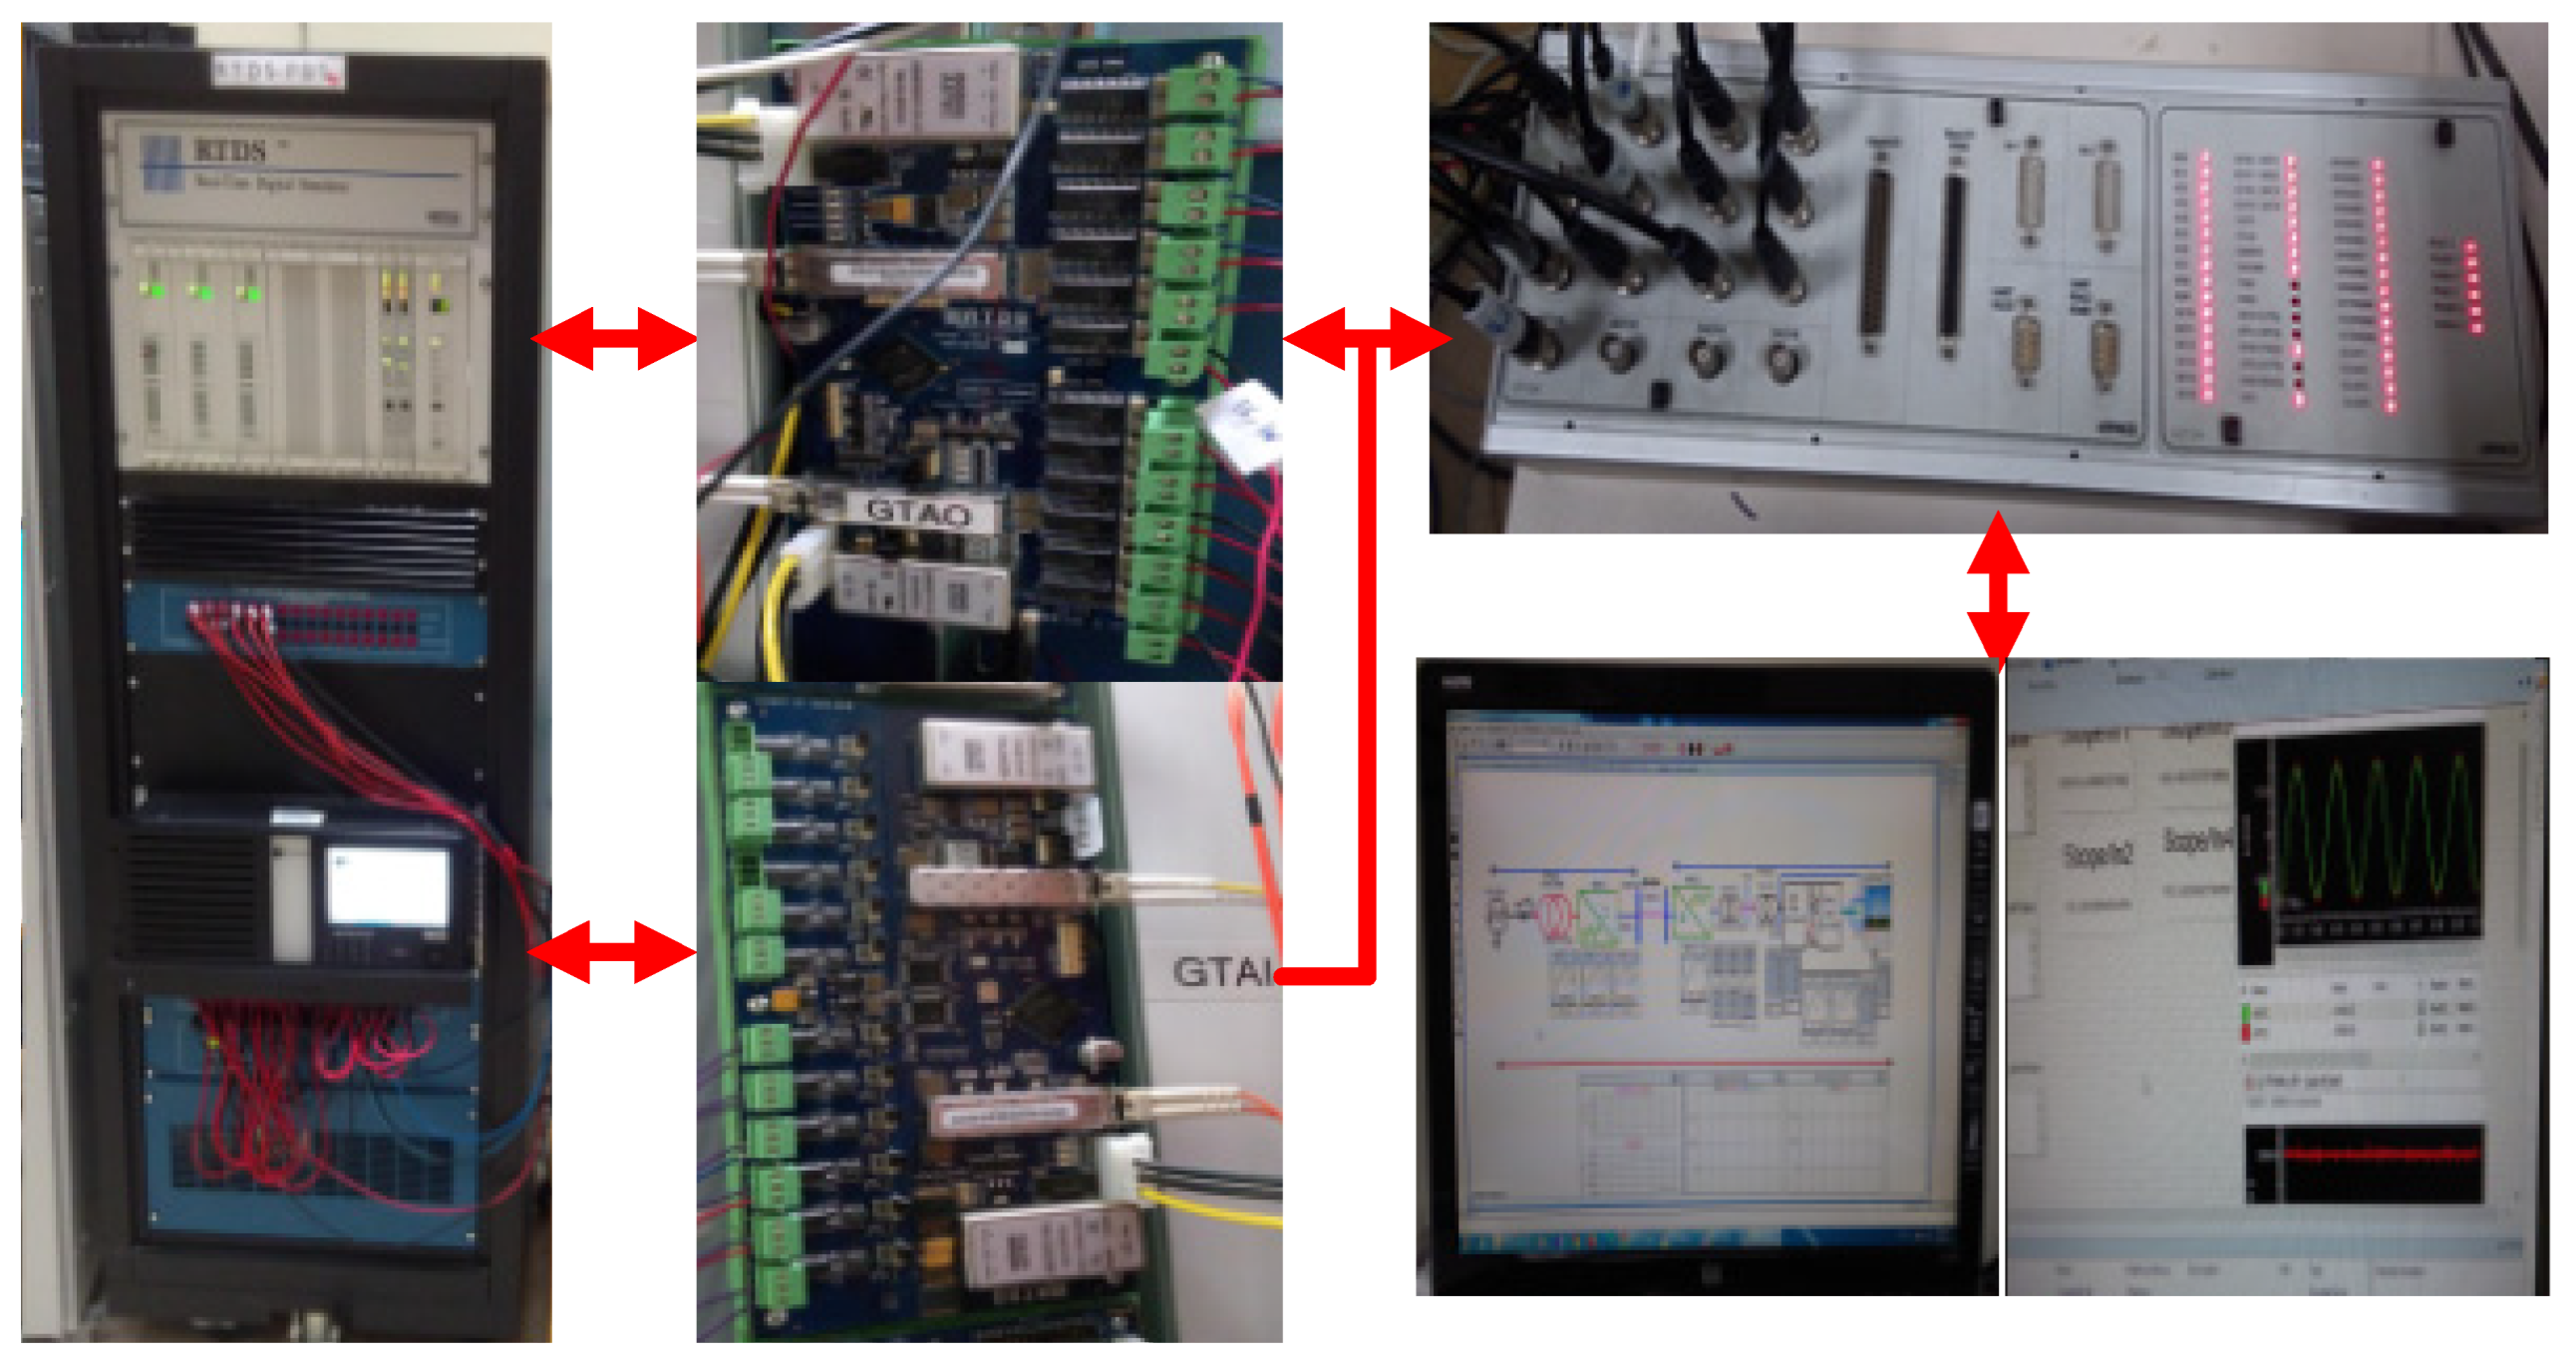
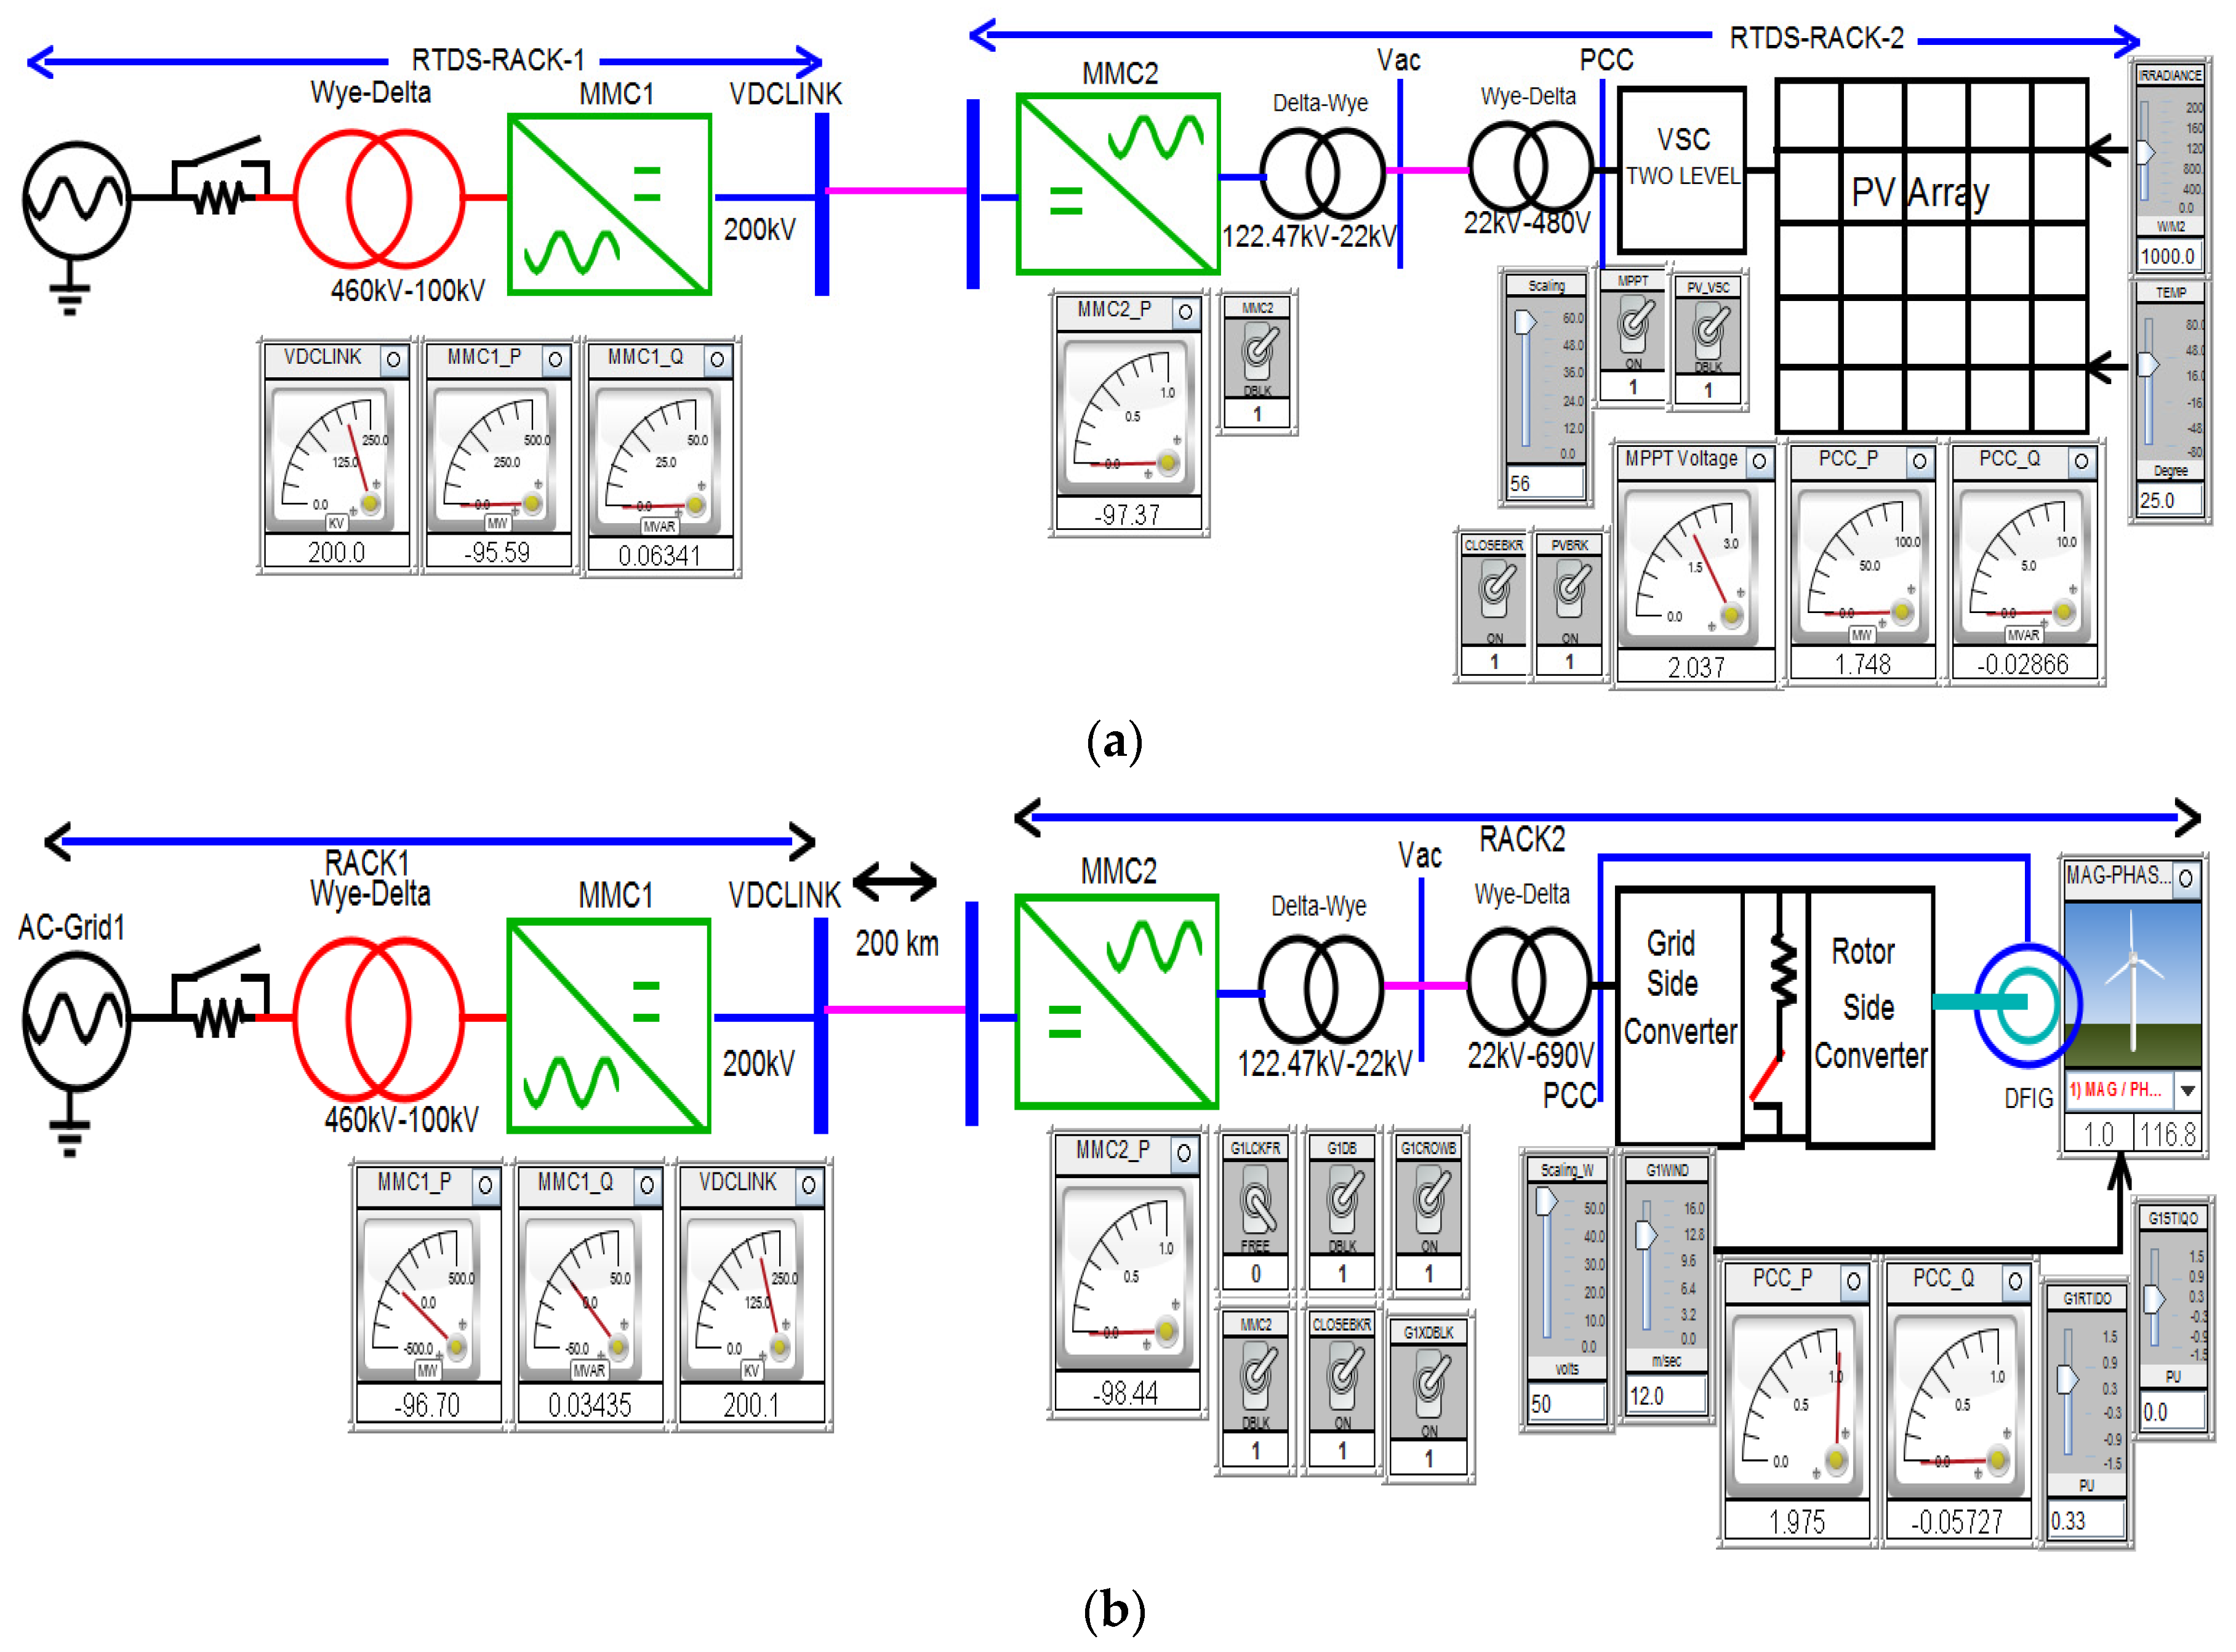
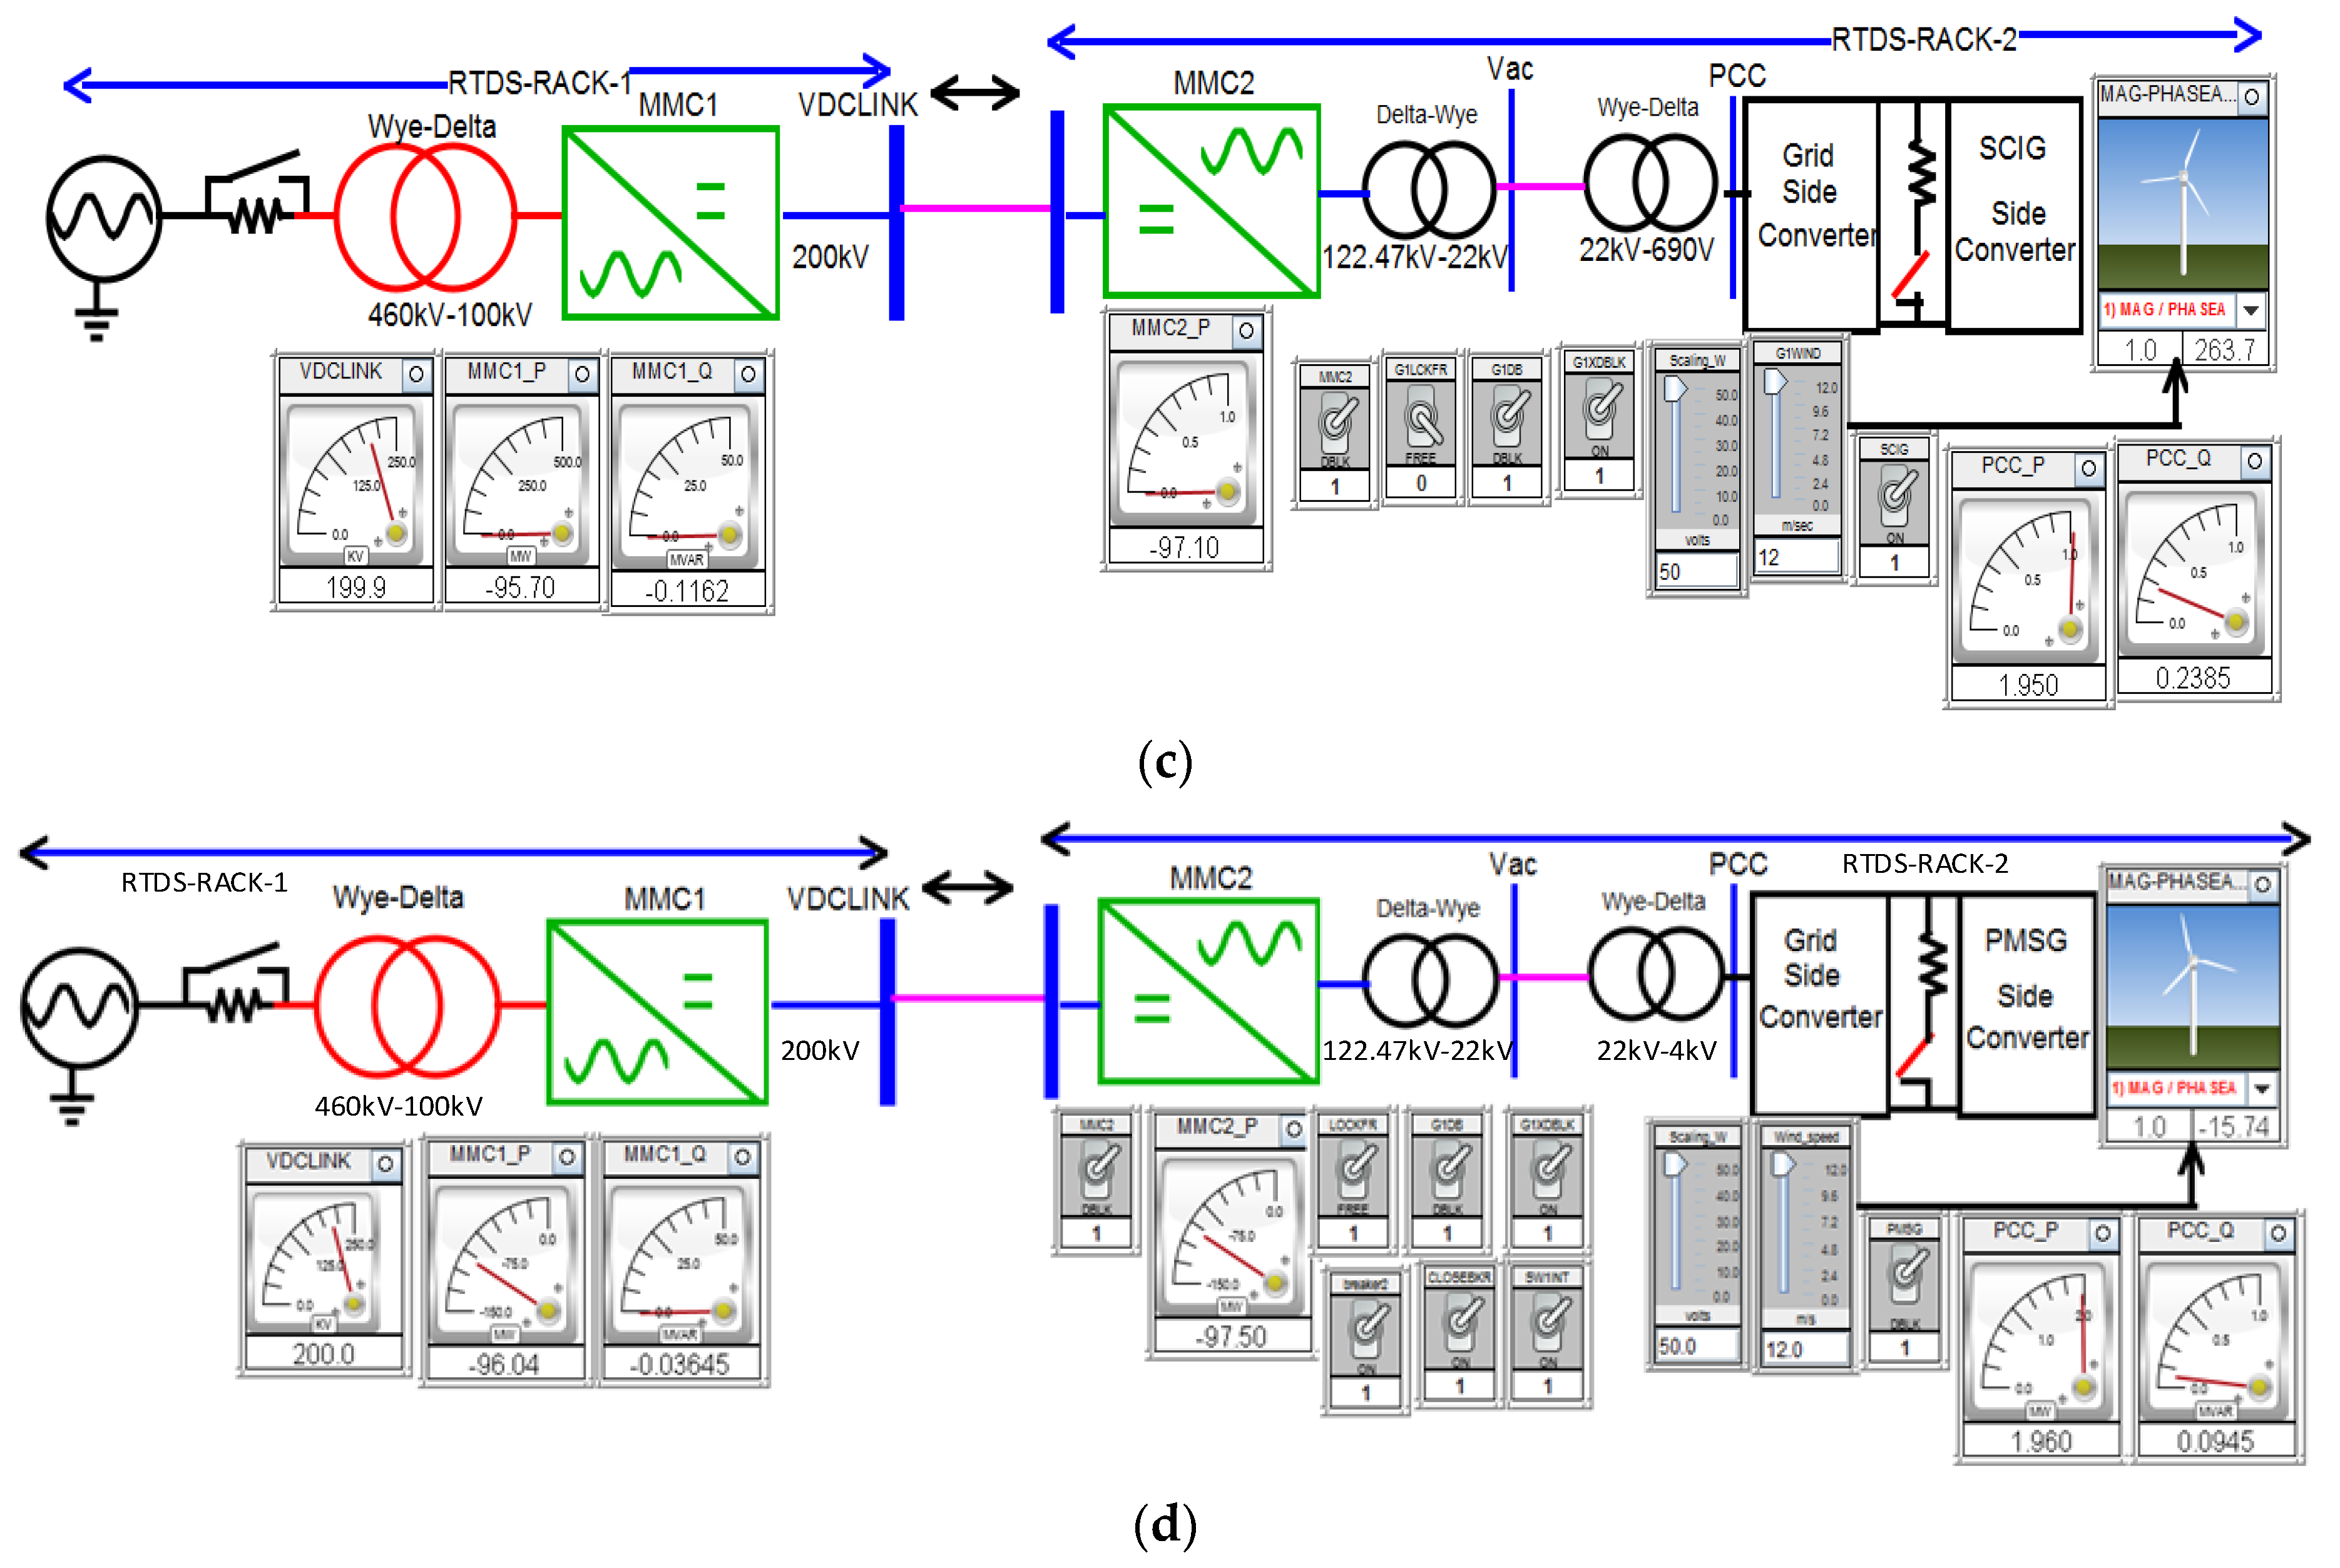
The RTDS is a real-time digital simulation device that works with other controllers and can interface with sensors in real-time. Since the simulator operates in real-time, the power system algorithms are calculated quickly enough to create output circumstances that accurately reflect conditions in a real network. Hence, integrating inverter-based resources can be more reliable by using the RTDS Simulator to verify their control. Unlike non-real-time simulation software, the tested controller on RTDS-dSPACE can be directly used to develop the practical system. Usually, the controller processes the sensor data from the physical design and provides the necessary action. RTDS works as the physical system, whereas dSPACE acts as the controller. For example, the MMC1 controller is implemented on dSPACE 1104, whereas the remaining complete procedure is developed in RTDS multi-rack platform. As can be seen from Figure 15 and Figure 16, the analog output (AO) card of RTDS provides the voltage and current signals to the analog input port of dSPACE. Finally, dSPACE processes the control algorithm and provides the required number of switching information to RTDS for MMC. Figure 17 shows the RSCAD runtime interface of RTDS.
The interface contains an on/off switch, slider, and meter for real-time monitoring and controlling the different variables. As the system is large and includes detailed models, the whole system is implemented on two racks of RTDS and connected through an HVDC line. In addition, PV, DFIG, SCIG, and PMSG-based MMC-HVDC systems have been separately implemented on RTDS-dSPACE due to hardware limitations. For the low voltage faults analysis of the MMC-HVDC system, DFIG-based 200 MW wind energy has been used. However, any other renewable energy could be used. The renewable energy farm is enlarged by multiplying one complete unit dynamics. Therefore, the oscillation among the generators has not been studied. Optimum wind and solar energy have been integrated into the MMC-HVDC system by considering all converter’s detailed models. Table A1, Table A2 and Table A3 provide the required parameters for the entire system. The sample time for circuit simulation is 1 µS in RTDS. The sample time for the control block in RTDS and dSPACE is 50 µS and 100 µS, respectively.

3.1. MMC1-DC Link Voltage and MMC2-AC Link Voltage Control

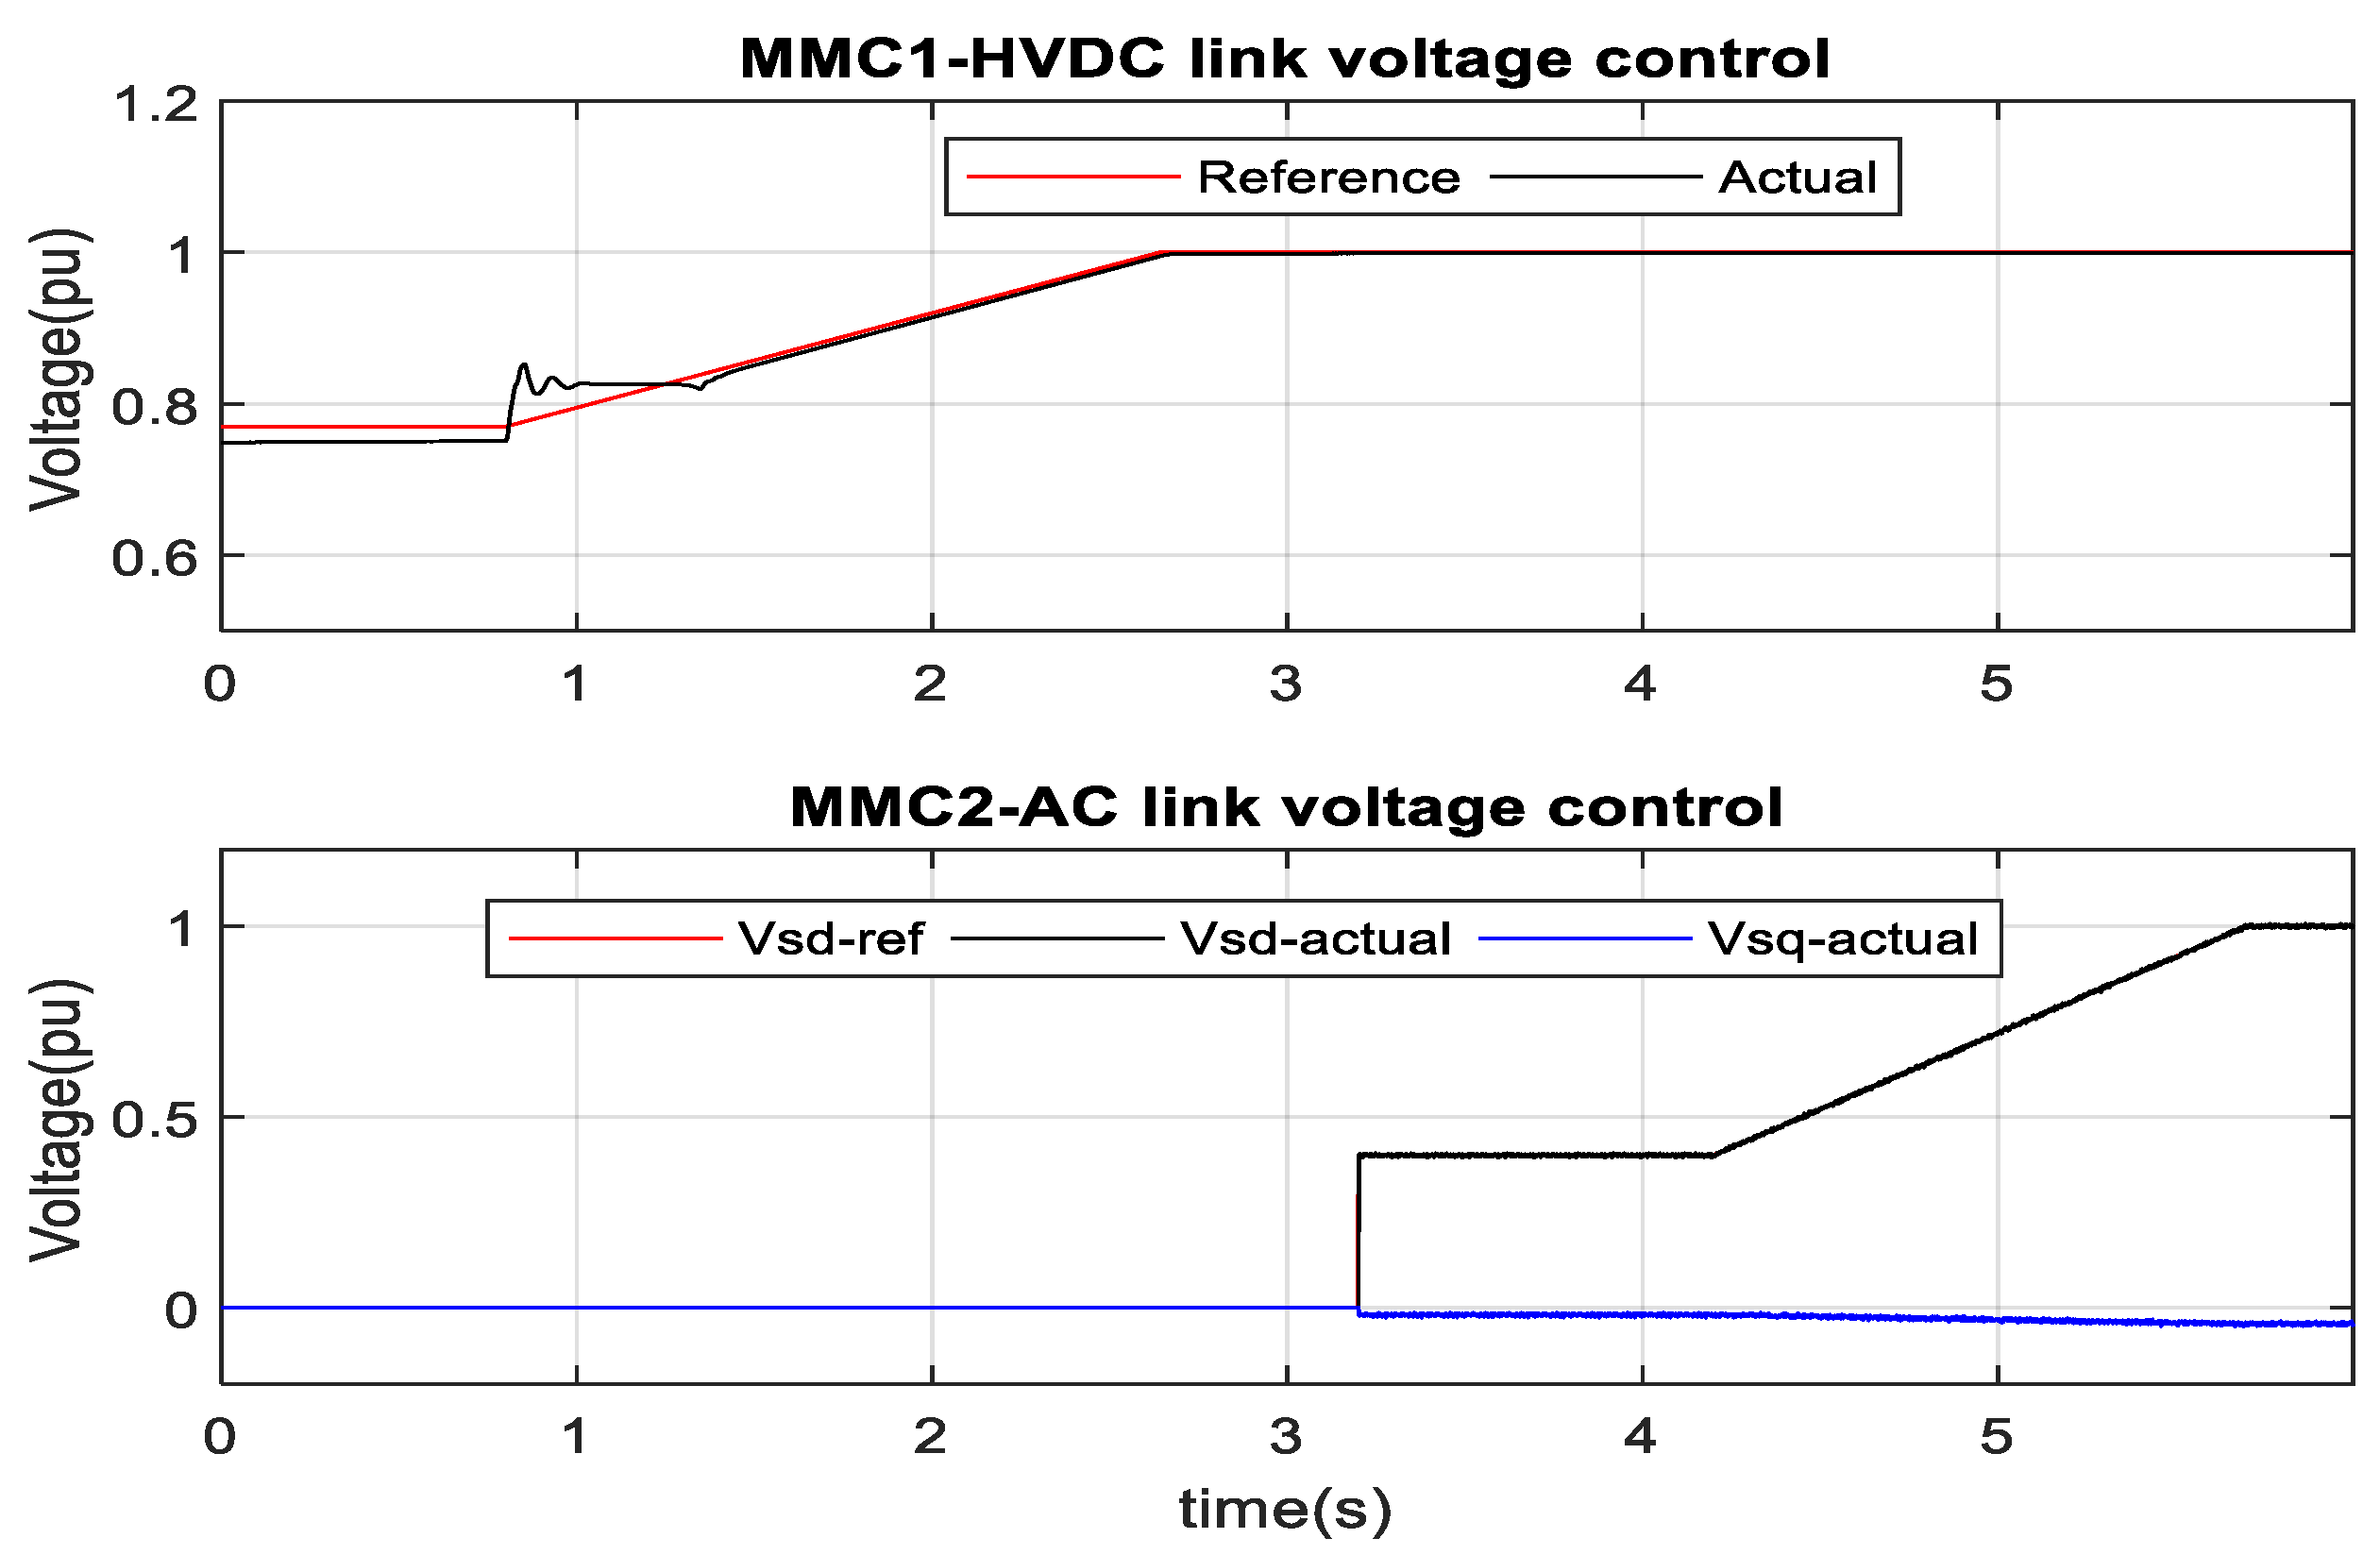
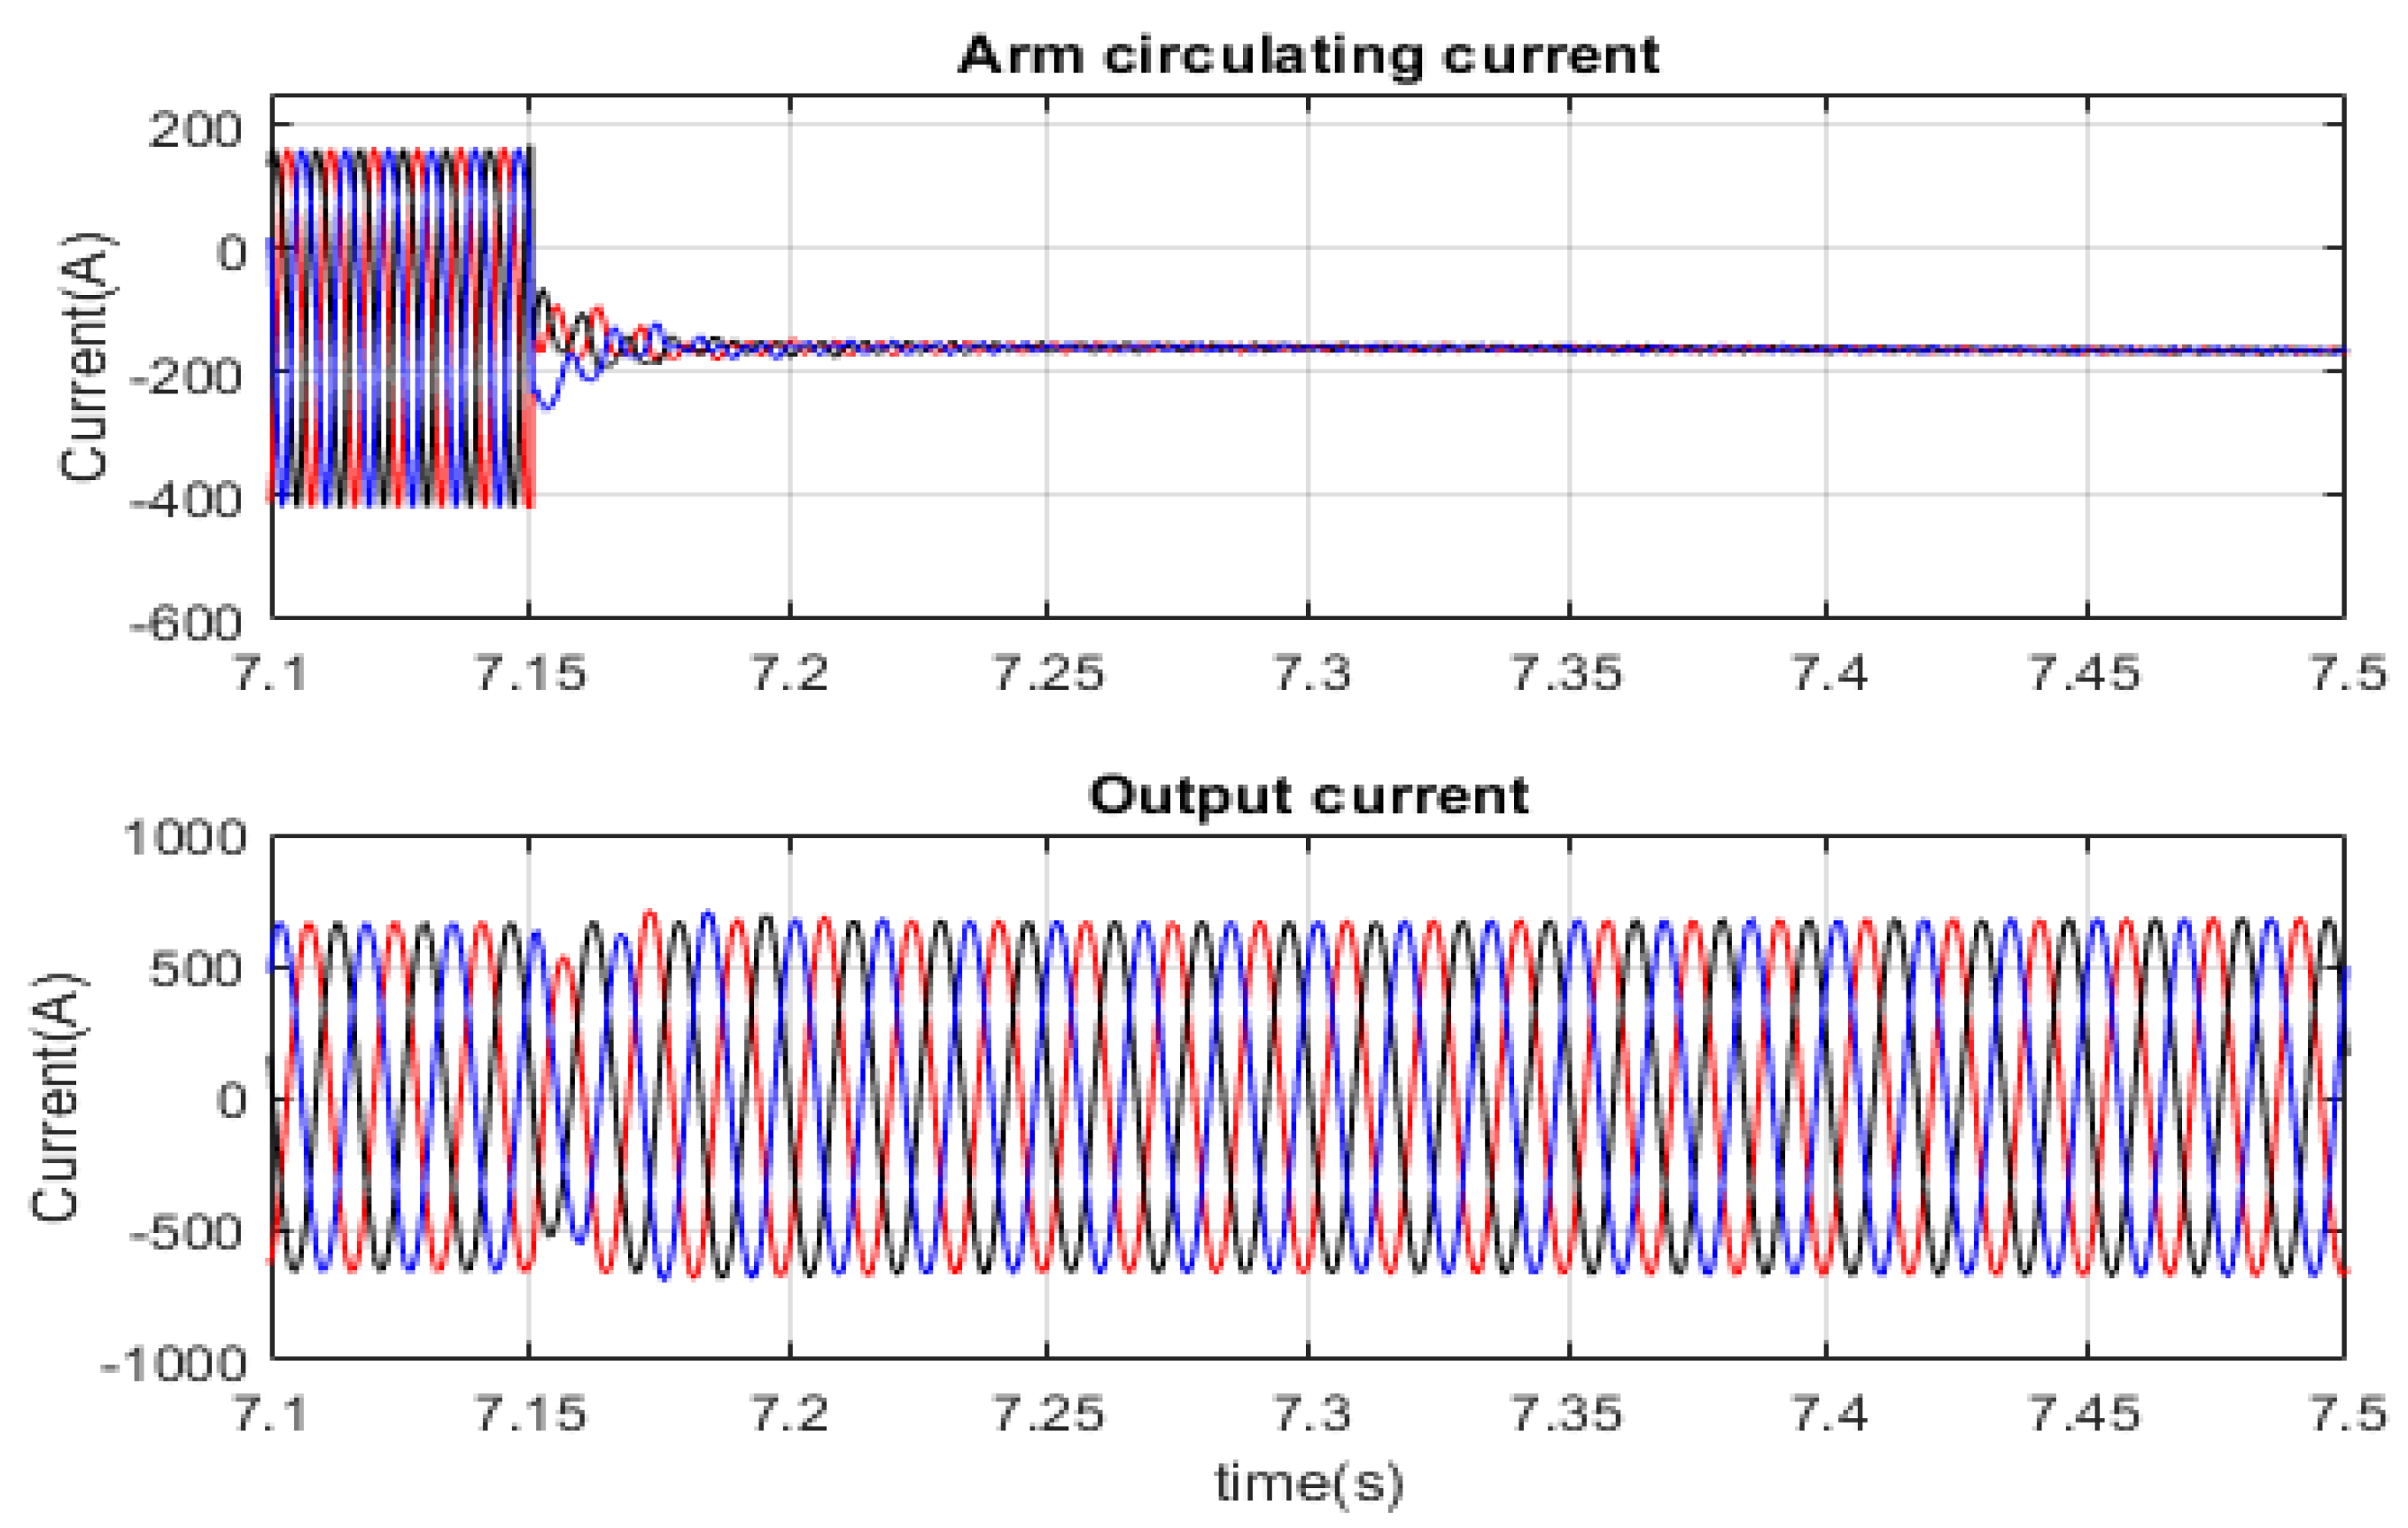
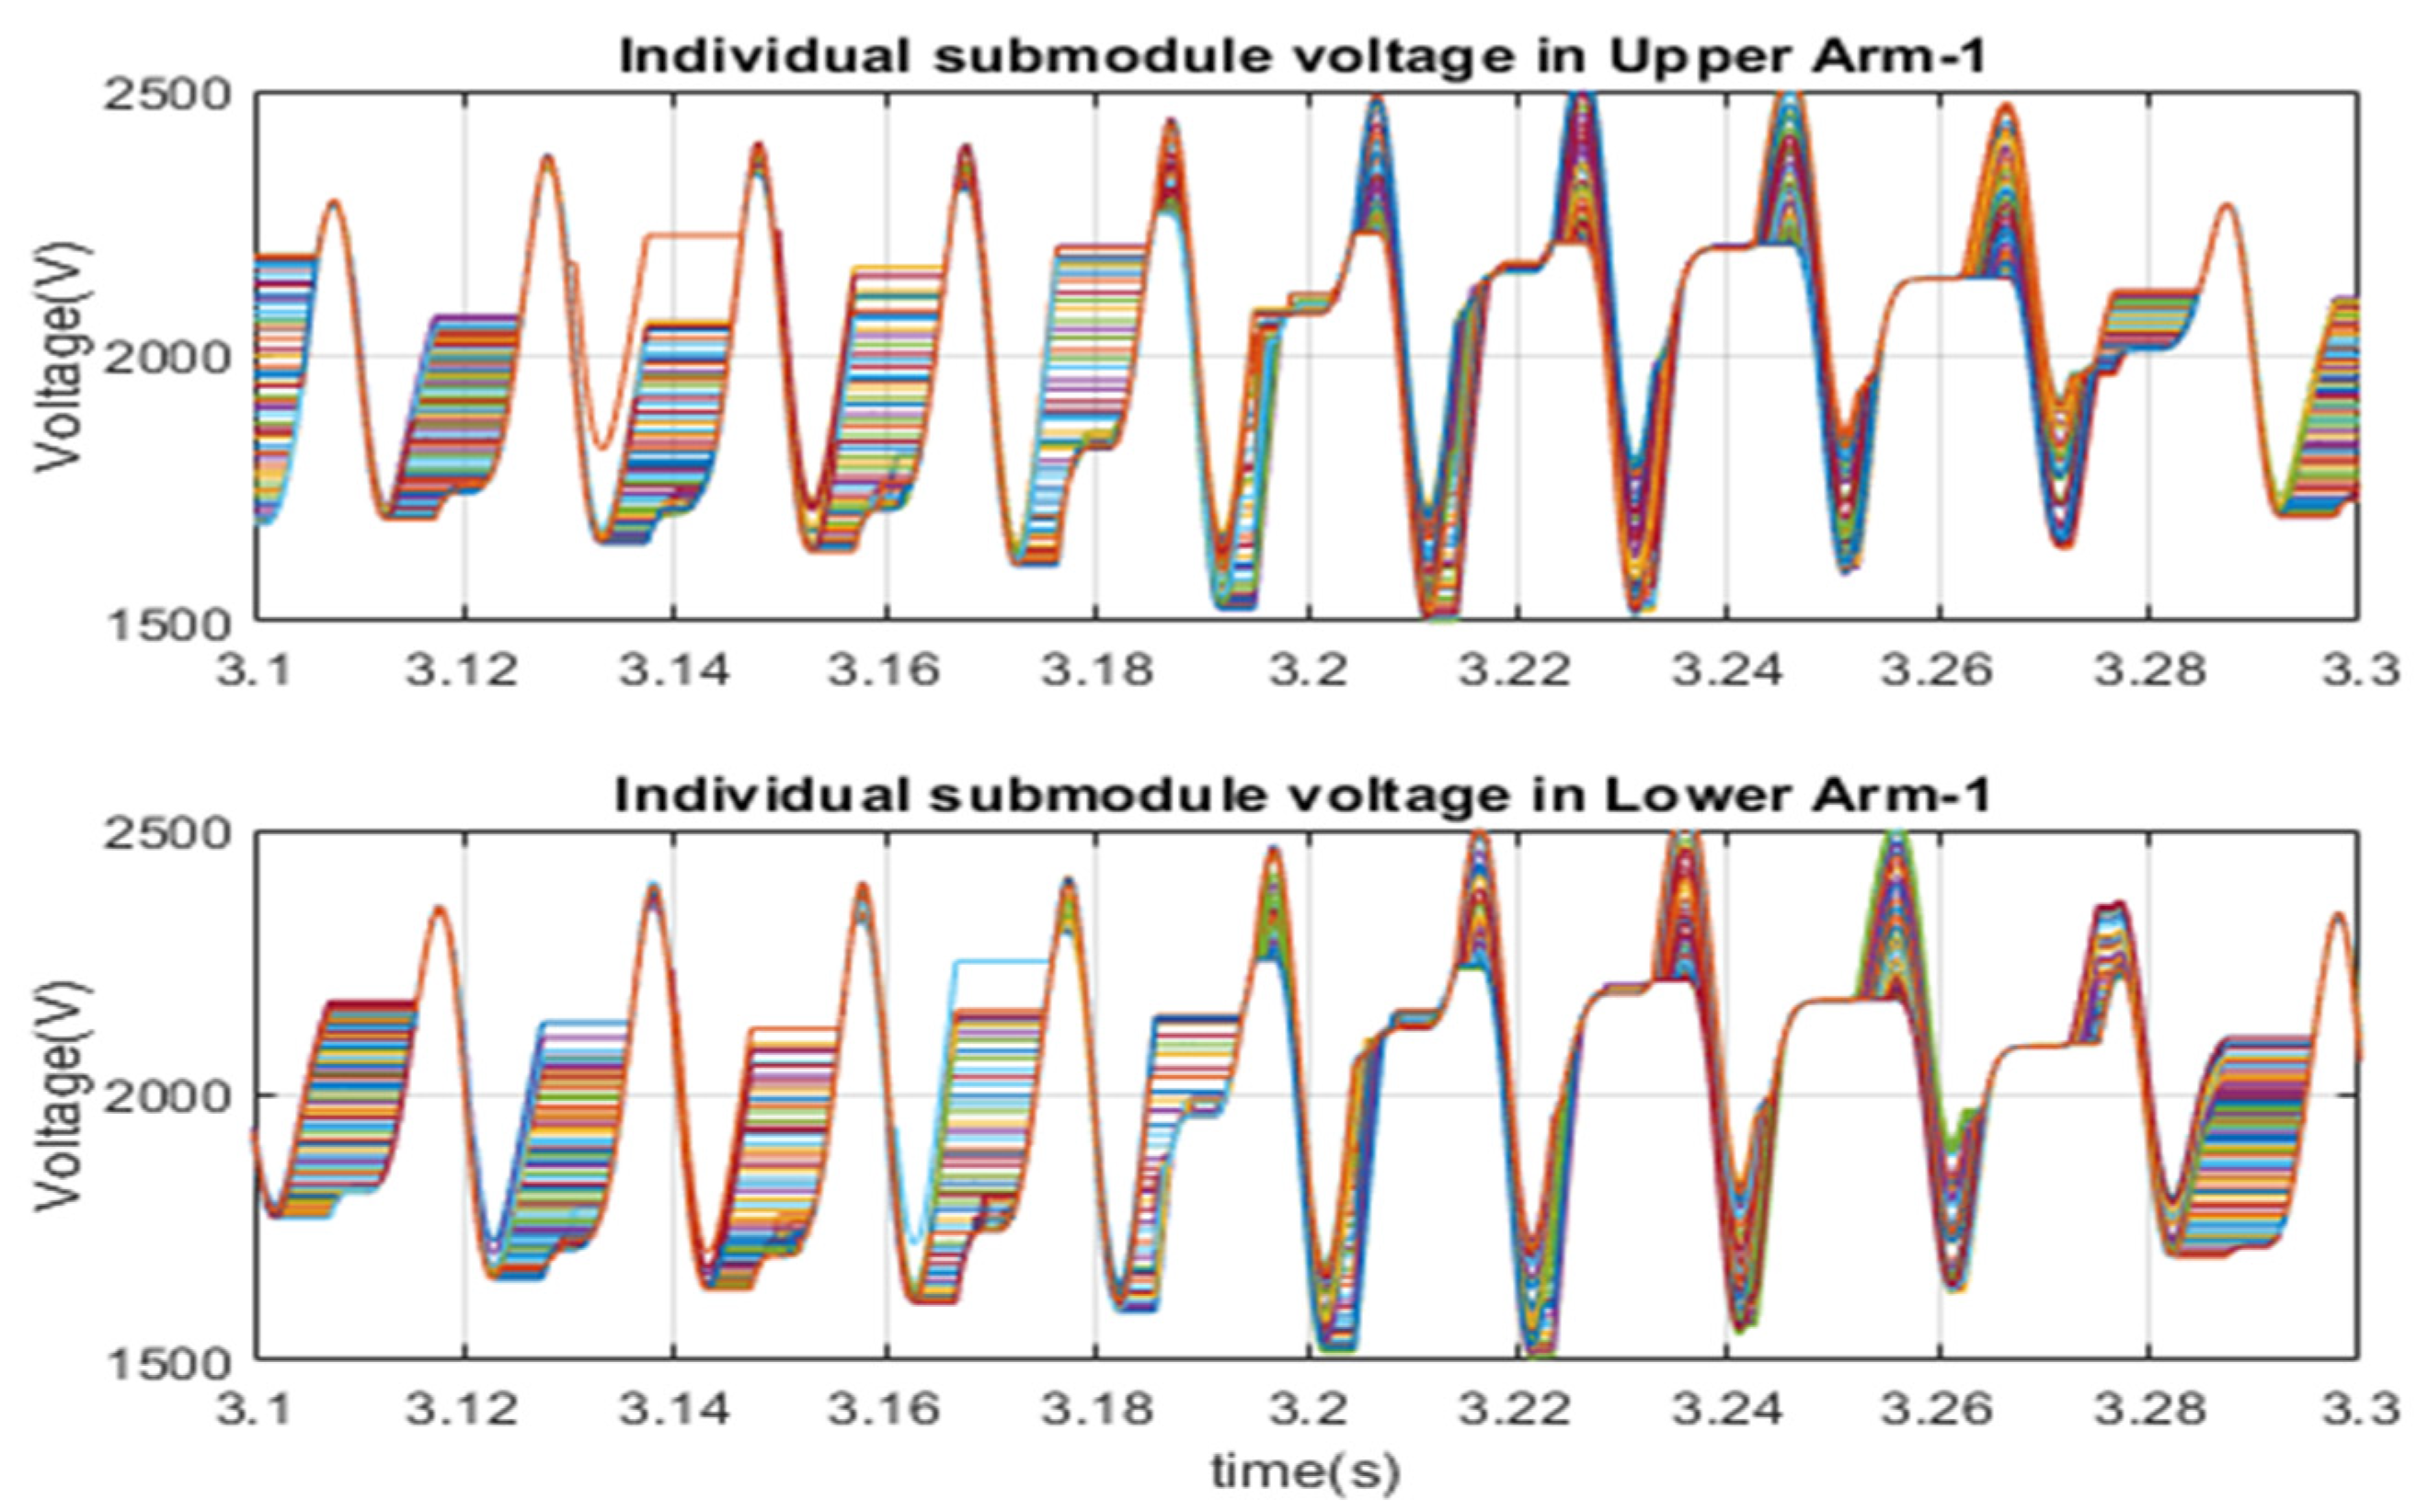
After limiting the inrush current by Rlimit resistor, the MMC1 controller started regulating the HVDC link voltage at 0.72 s, as depicted in Figure 18. It is progressively set to a rated value within 1.9 s. After that, the AC side voltage of MMC2 gradually reaches the rated value. Circulating current flows through the arm submodules and DC link capacitance. Hence, oscillation in the circulating current results ripple in the submodule capacitance-voltage and deviates the upper and lower arm’s sum capacitor voltage from their common mean value. The circulating arm current controller converges the circulating arm current into dc value. Figure 19 illustrates the arm current due to the circulating arm current controller. At 7.15 s, the circulating arm current controller is activated, which converges the circulating arm current into dc value. However, the AC side output current does not change due to circulating current control, as illustrated in Figure 19. Submodule capacitor voltage charges and discharges due to the current direction and selection. Hence, individual submodule voltage differs from each other. Therefore, submodule selection is controlled to minimize the submodule voltage deviation. Figure 20 and Figure 21 show the individual submodule voltage without and with the submodule sorting algorithm (SSA). Without SSA, the submodule voltage ripple varies from 1500 V to 2500 V, respectively, and deviates from their common mean value of 2000 V, as revealed in Figure 20. As can be observed from Figure 21, the submodule sorting algorithm limits the individual submodule voltage ripple within 1800 V to 2150 V, and makes the average voltage 2000 V.

3.2. Optimum PV Integration

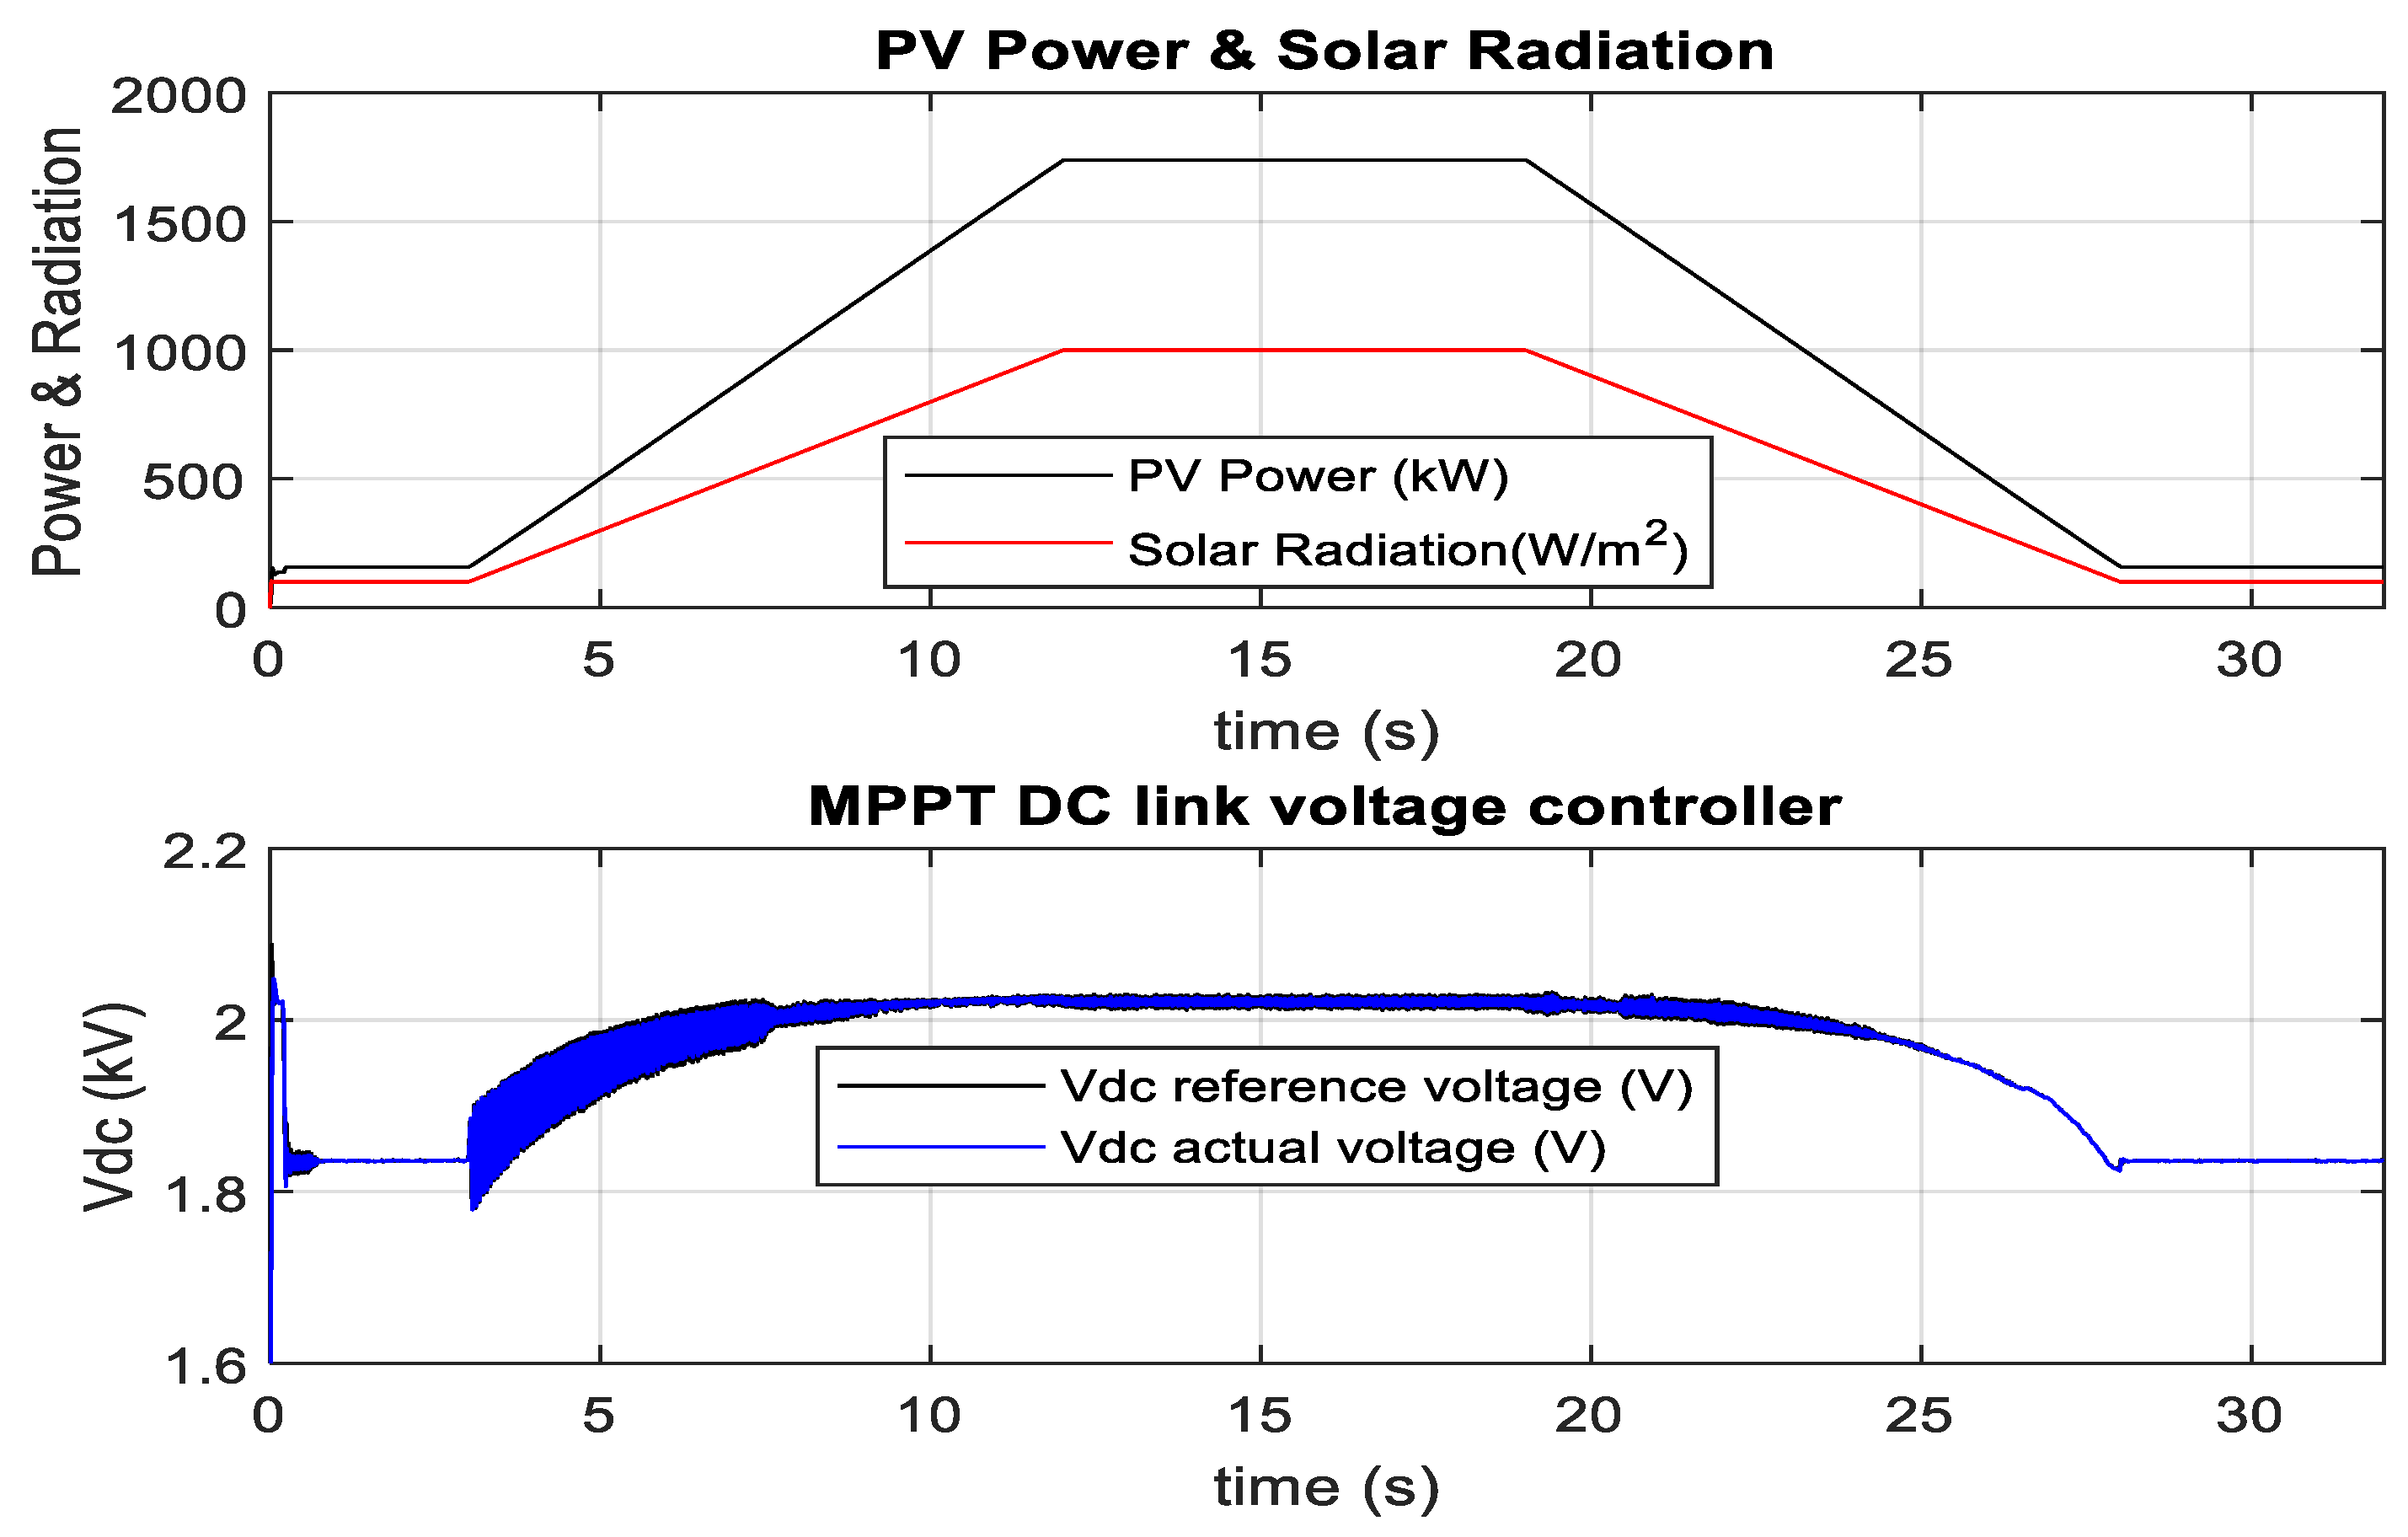
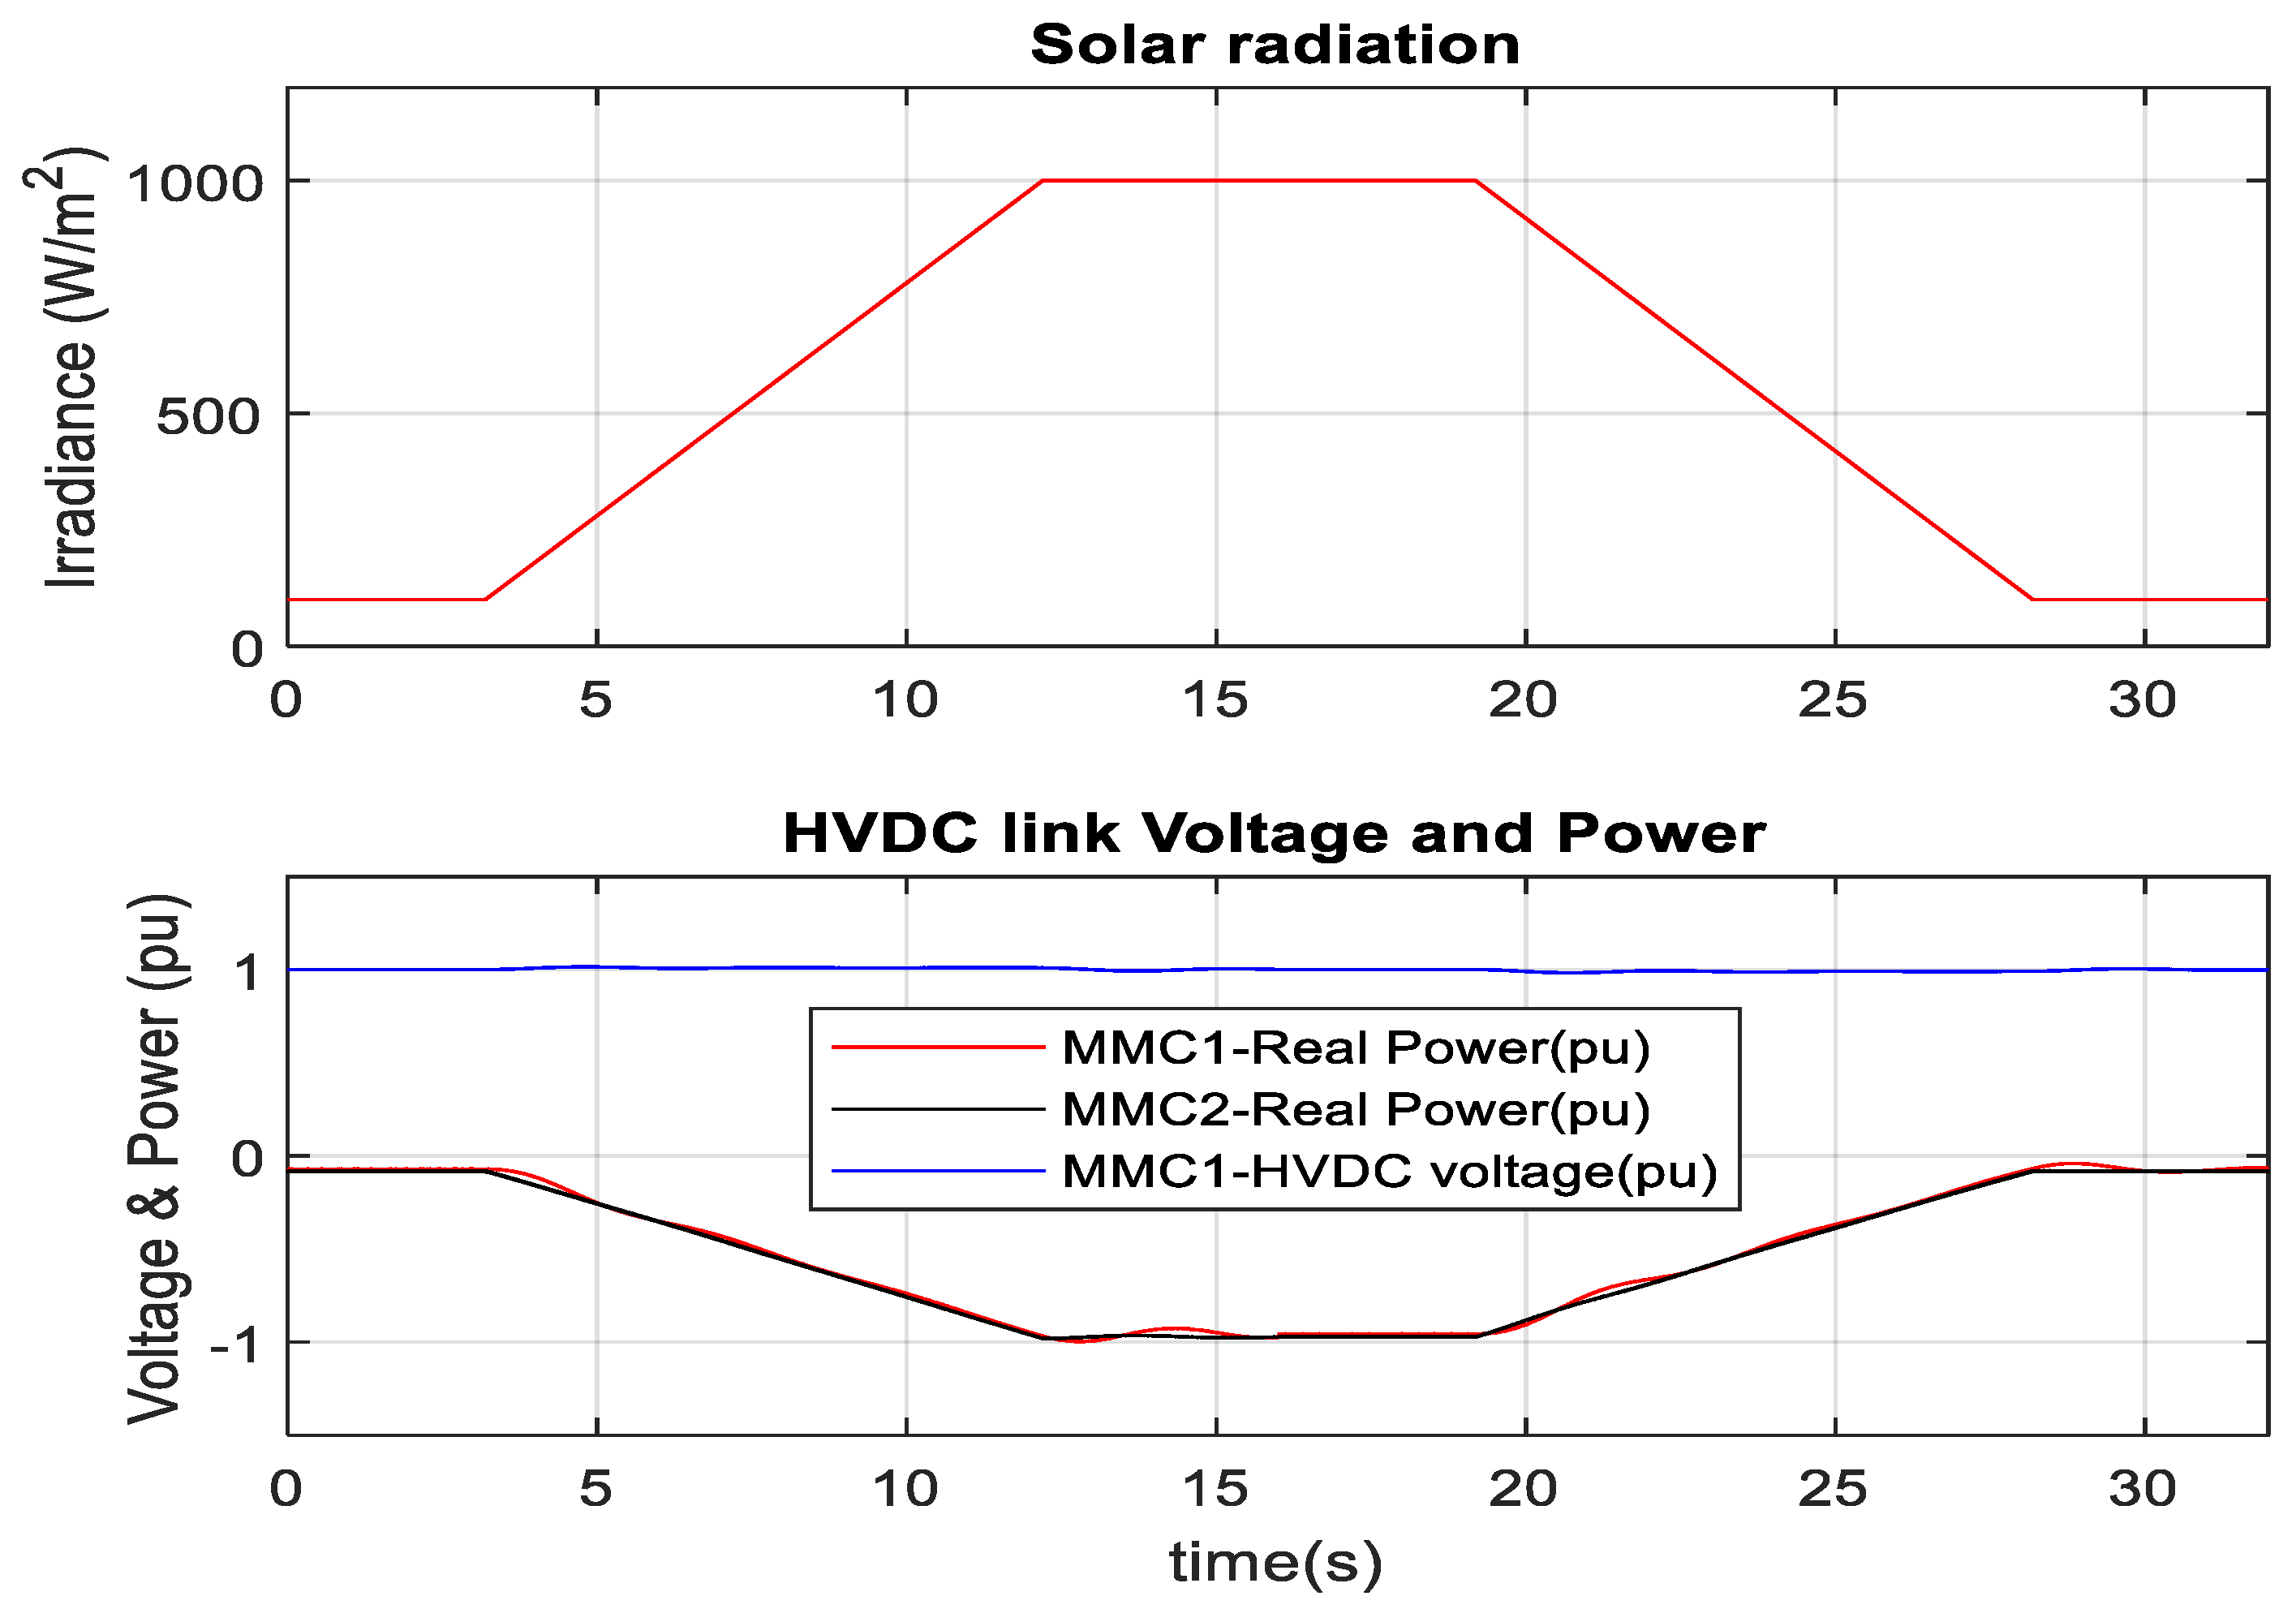
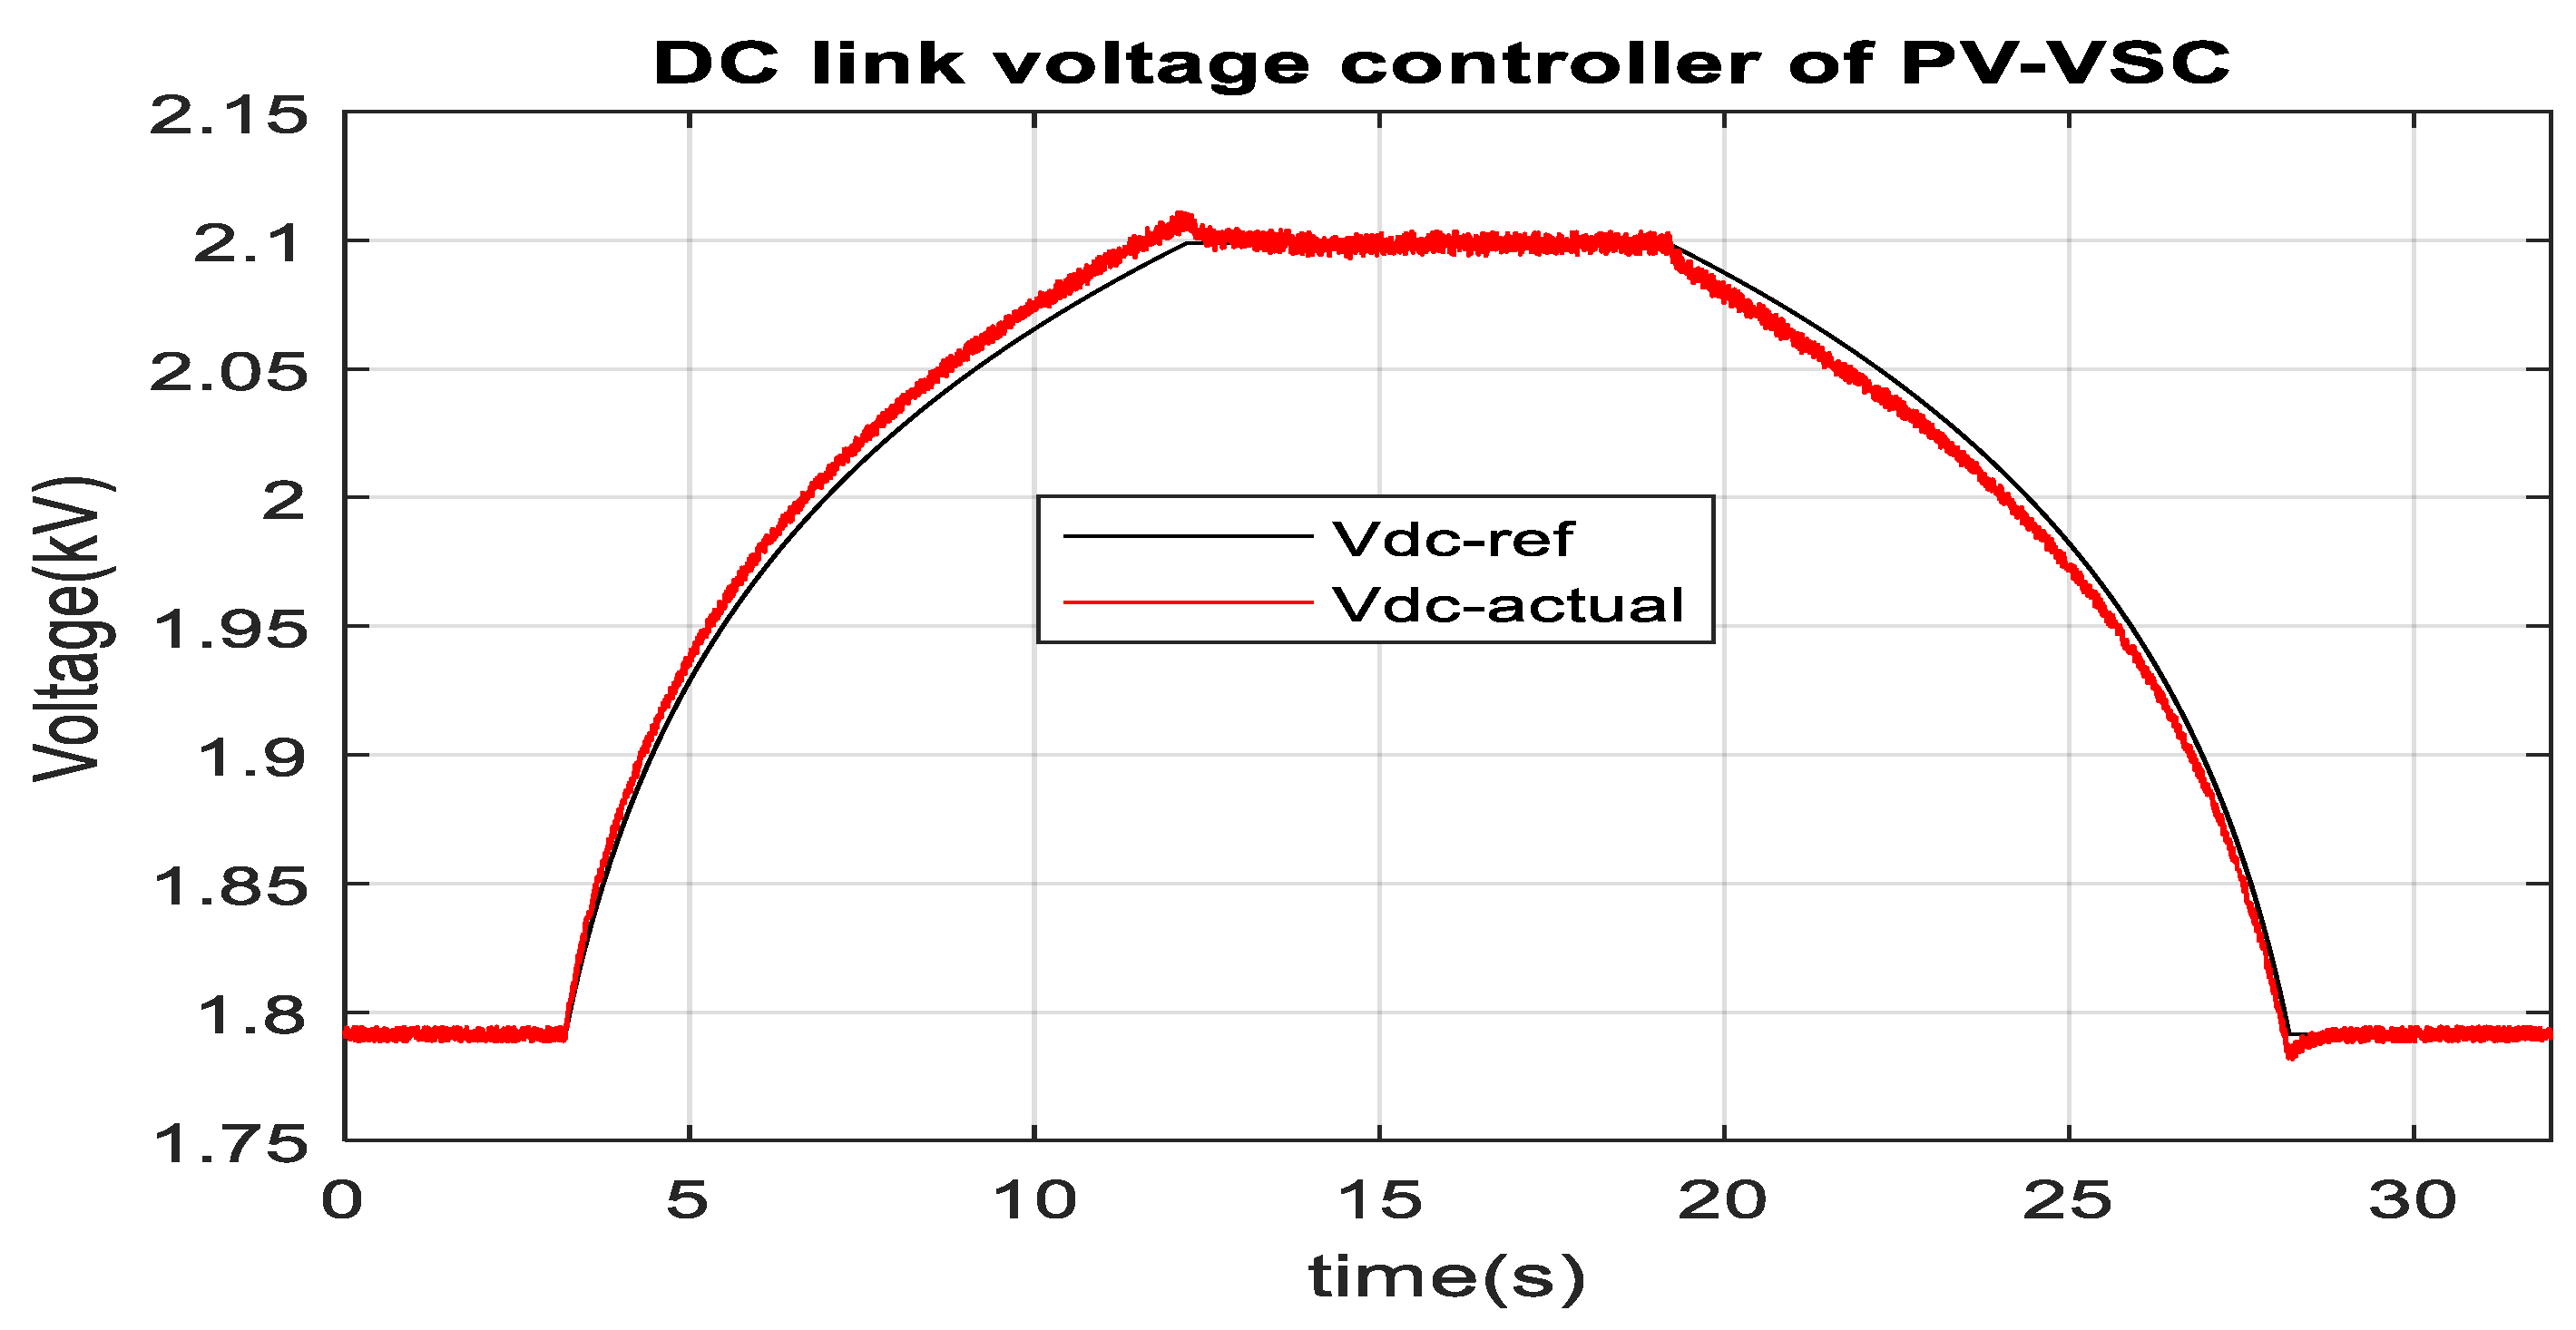
Based on PV panel characteristics as depicted in Figure 2, the operating range of PV reference voltage was selected from 1000 V to 2500 V. Figure 22 illustrates that the solar radiation change occurs from 100 Wm−2 to 1000 Wm−2 within 9 s. It is found from Figure 2 that the optimal PV voltage is 1.8 kV and 2 kV for the solar radiation 100 Wm−2 and 1000 Wm−2, respectively. MPPT tracking algorithm effectively sets the reference DC link voltage around the optimum value to extract the maximum power, as shown in Figure 22. Actual DC link voltage follows the reference DC link voltage without steady-state error. Similarly, the MPPT algorithm tracks the optimum power during the change of solar radiation from 1000 Wm−2 to 100 Wm−2. During a similar solar radiation change, RTDS-dSPACE results also provide a similar response, as depicted in Figure 23 and Figure 24.
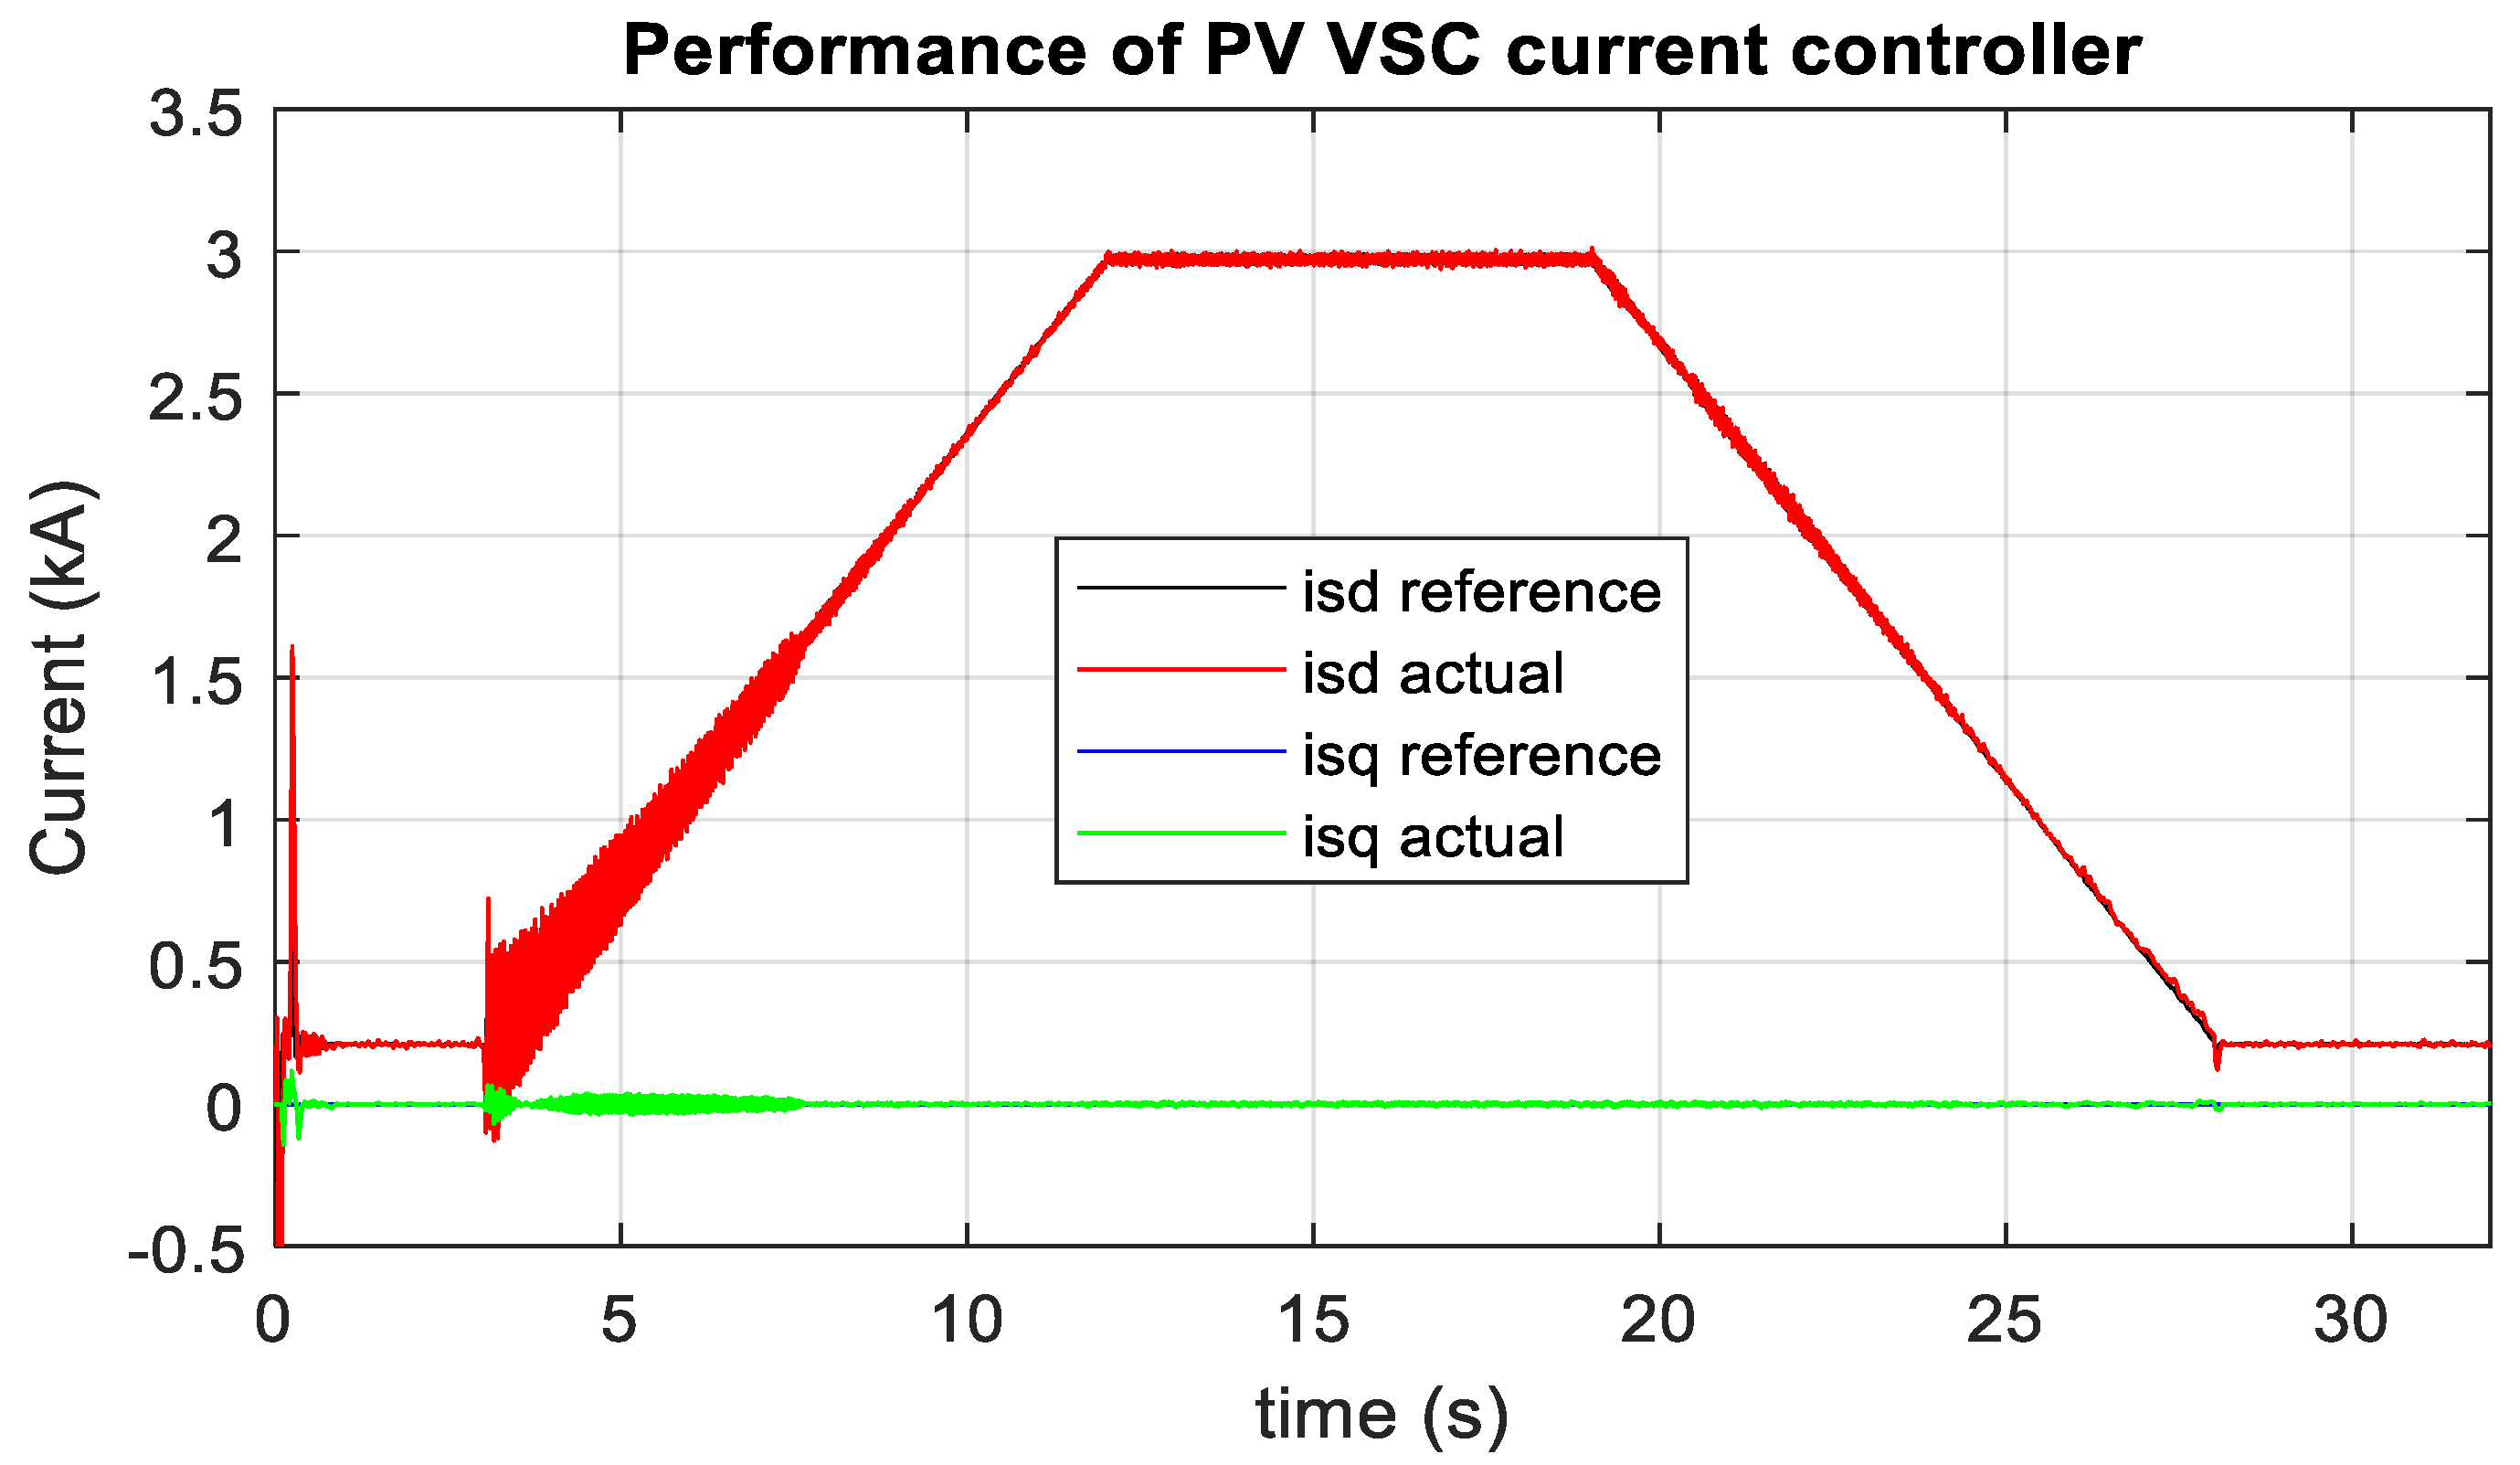
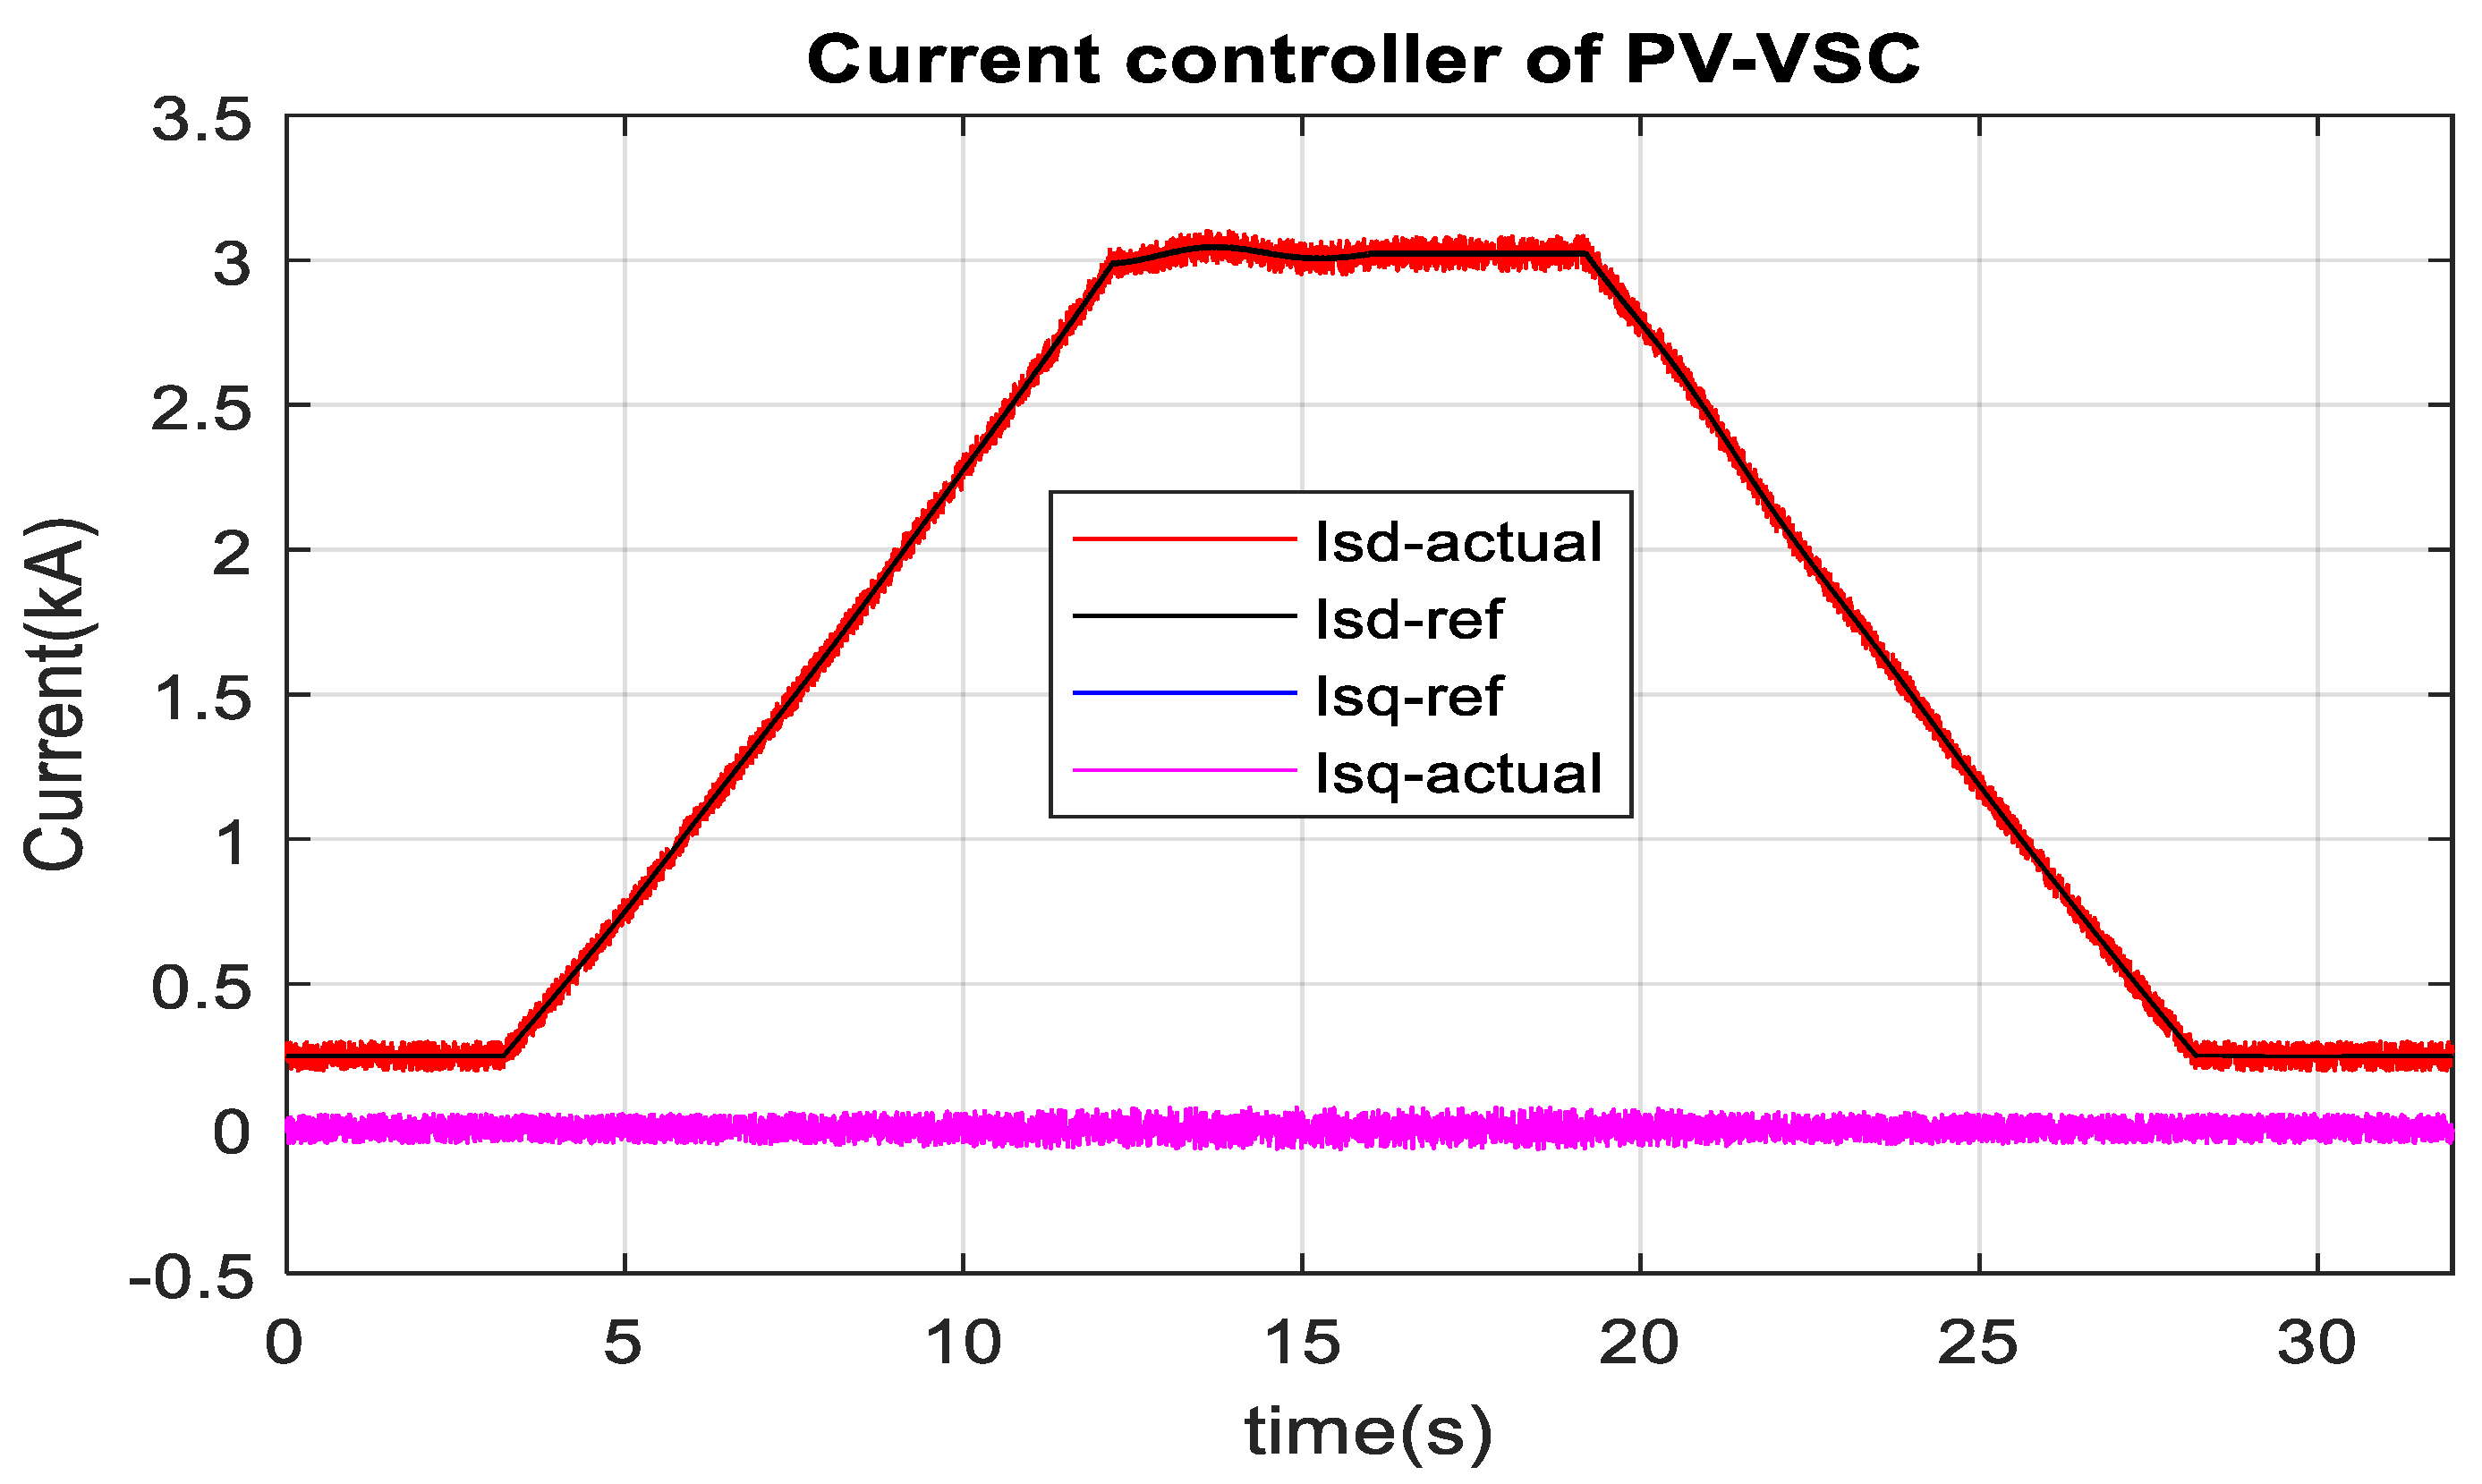
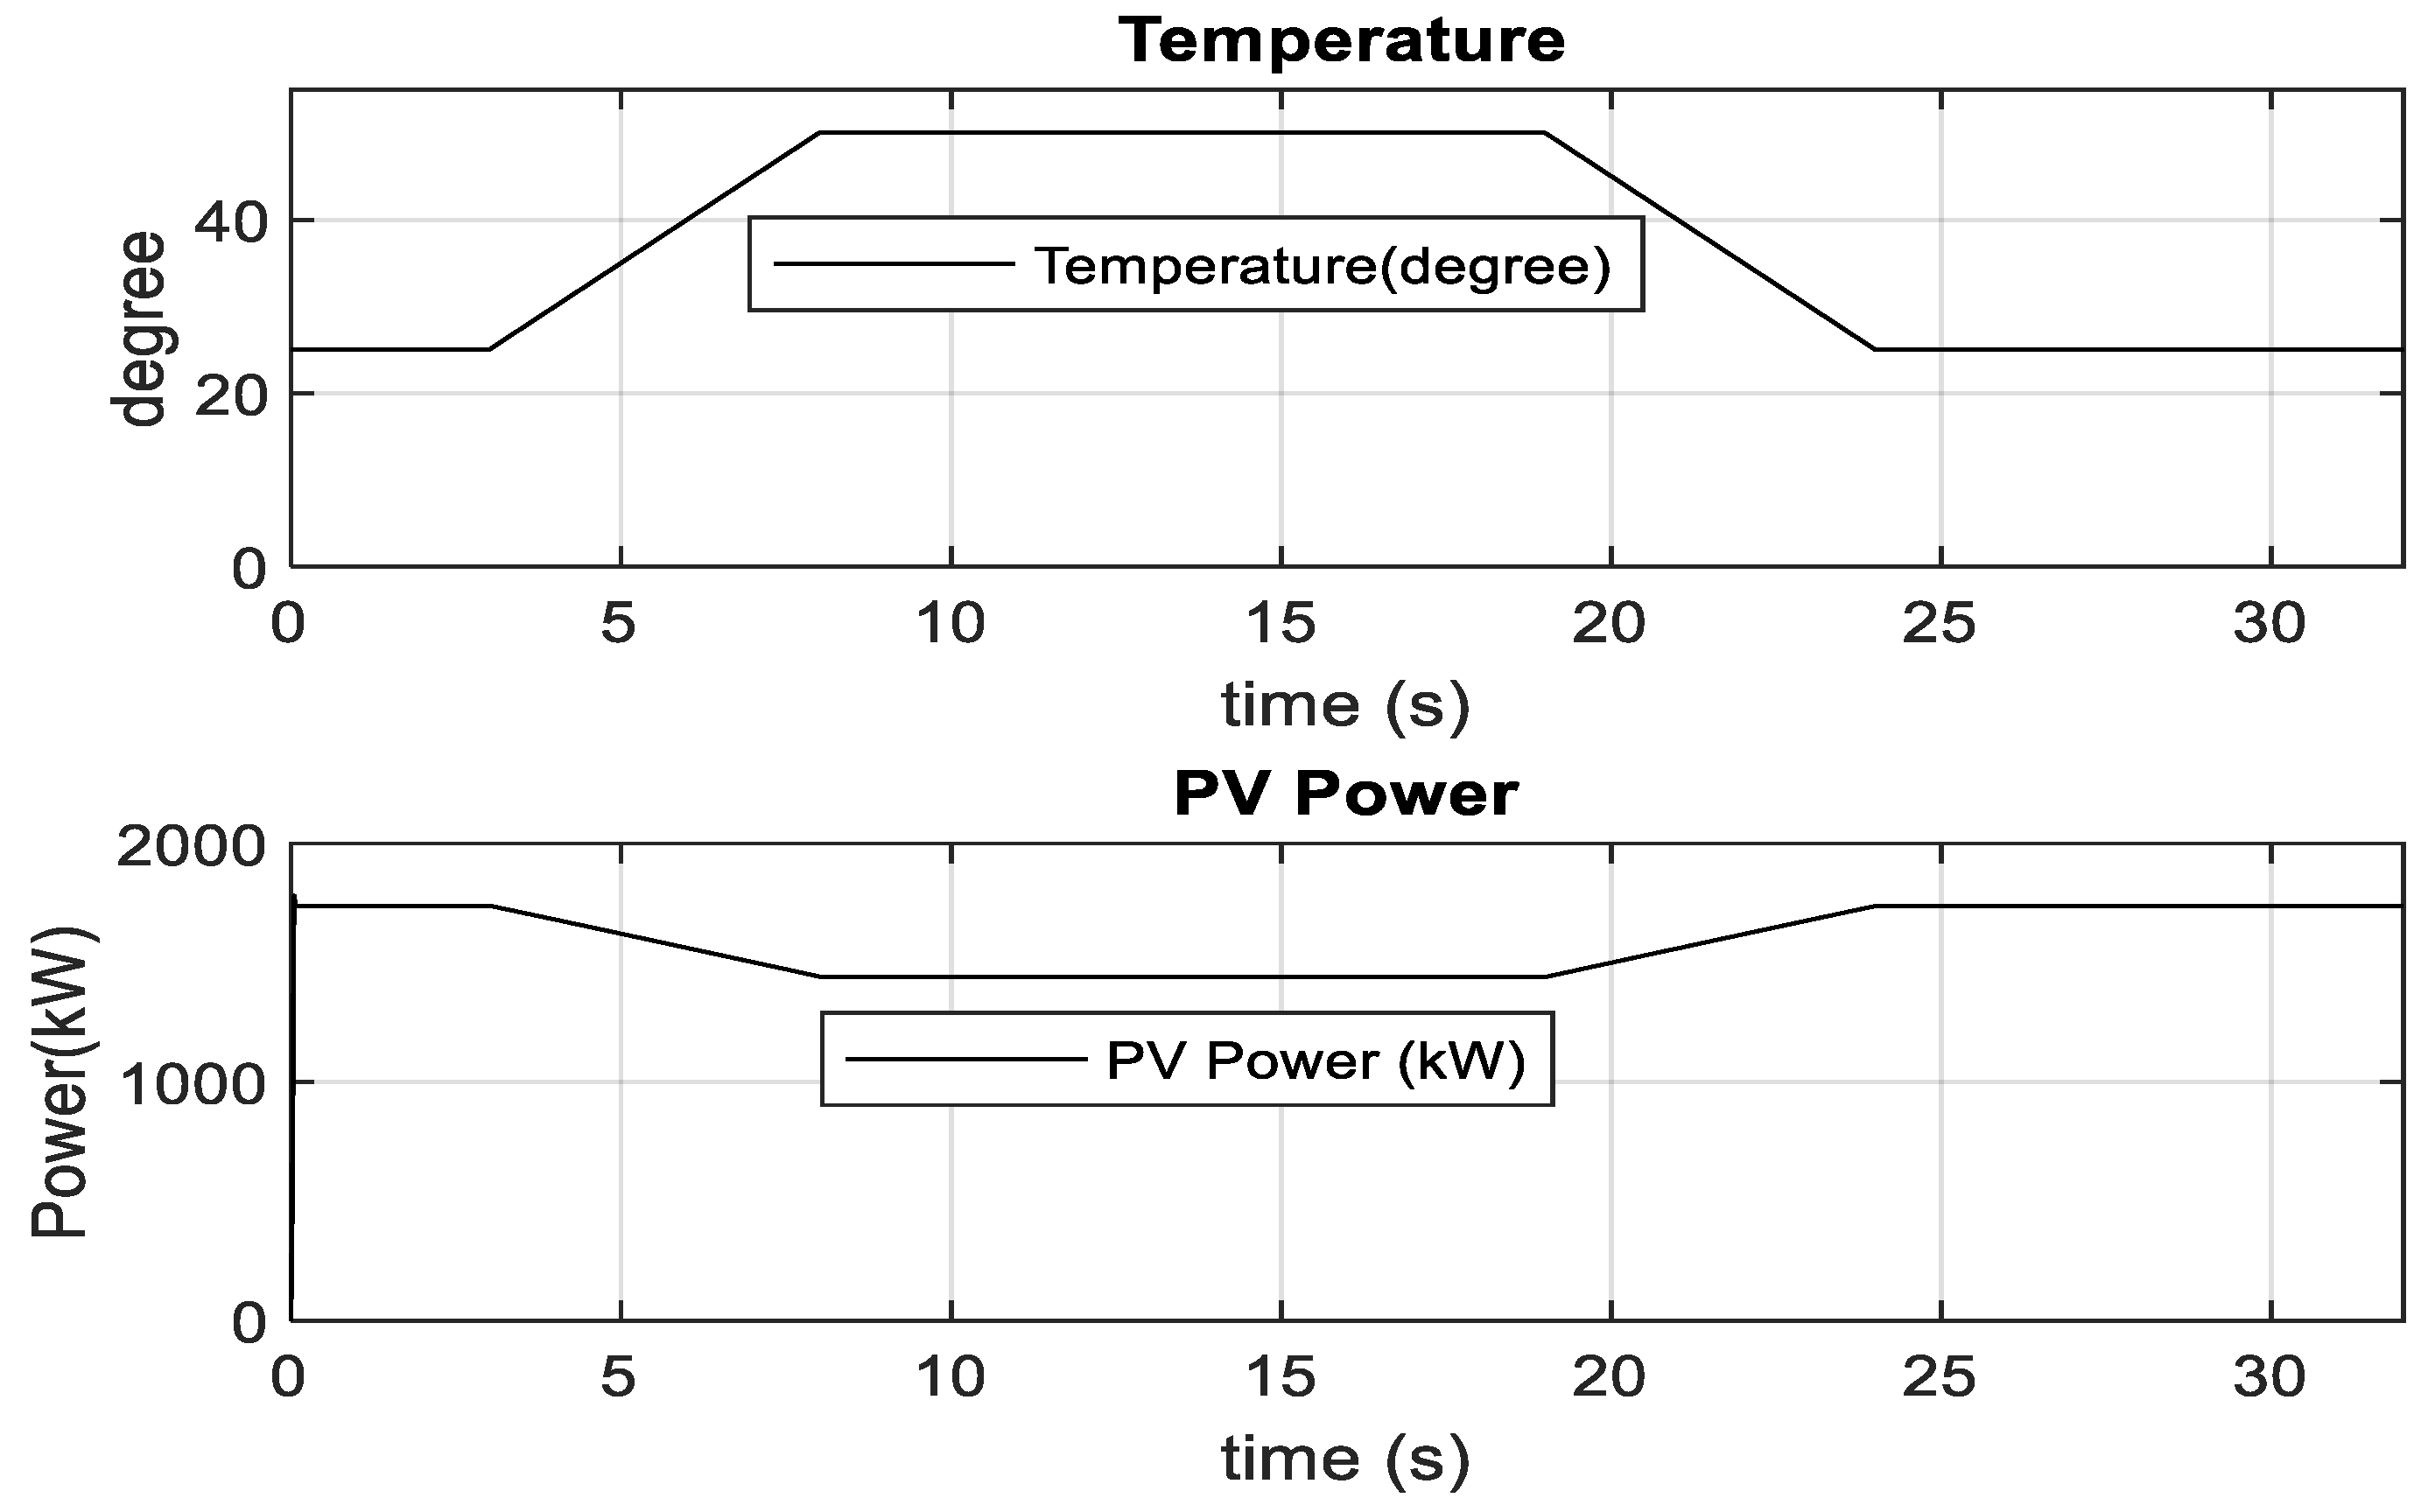
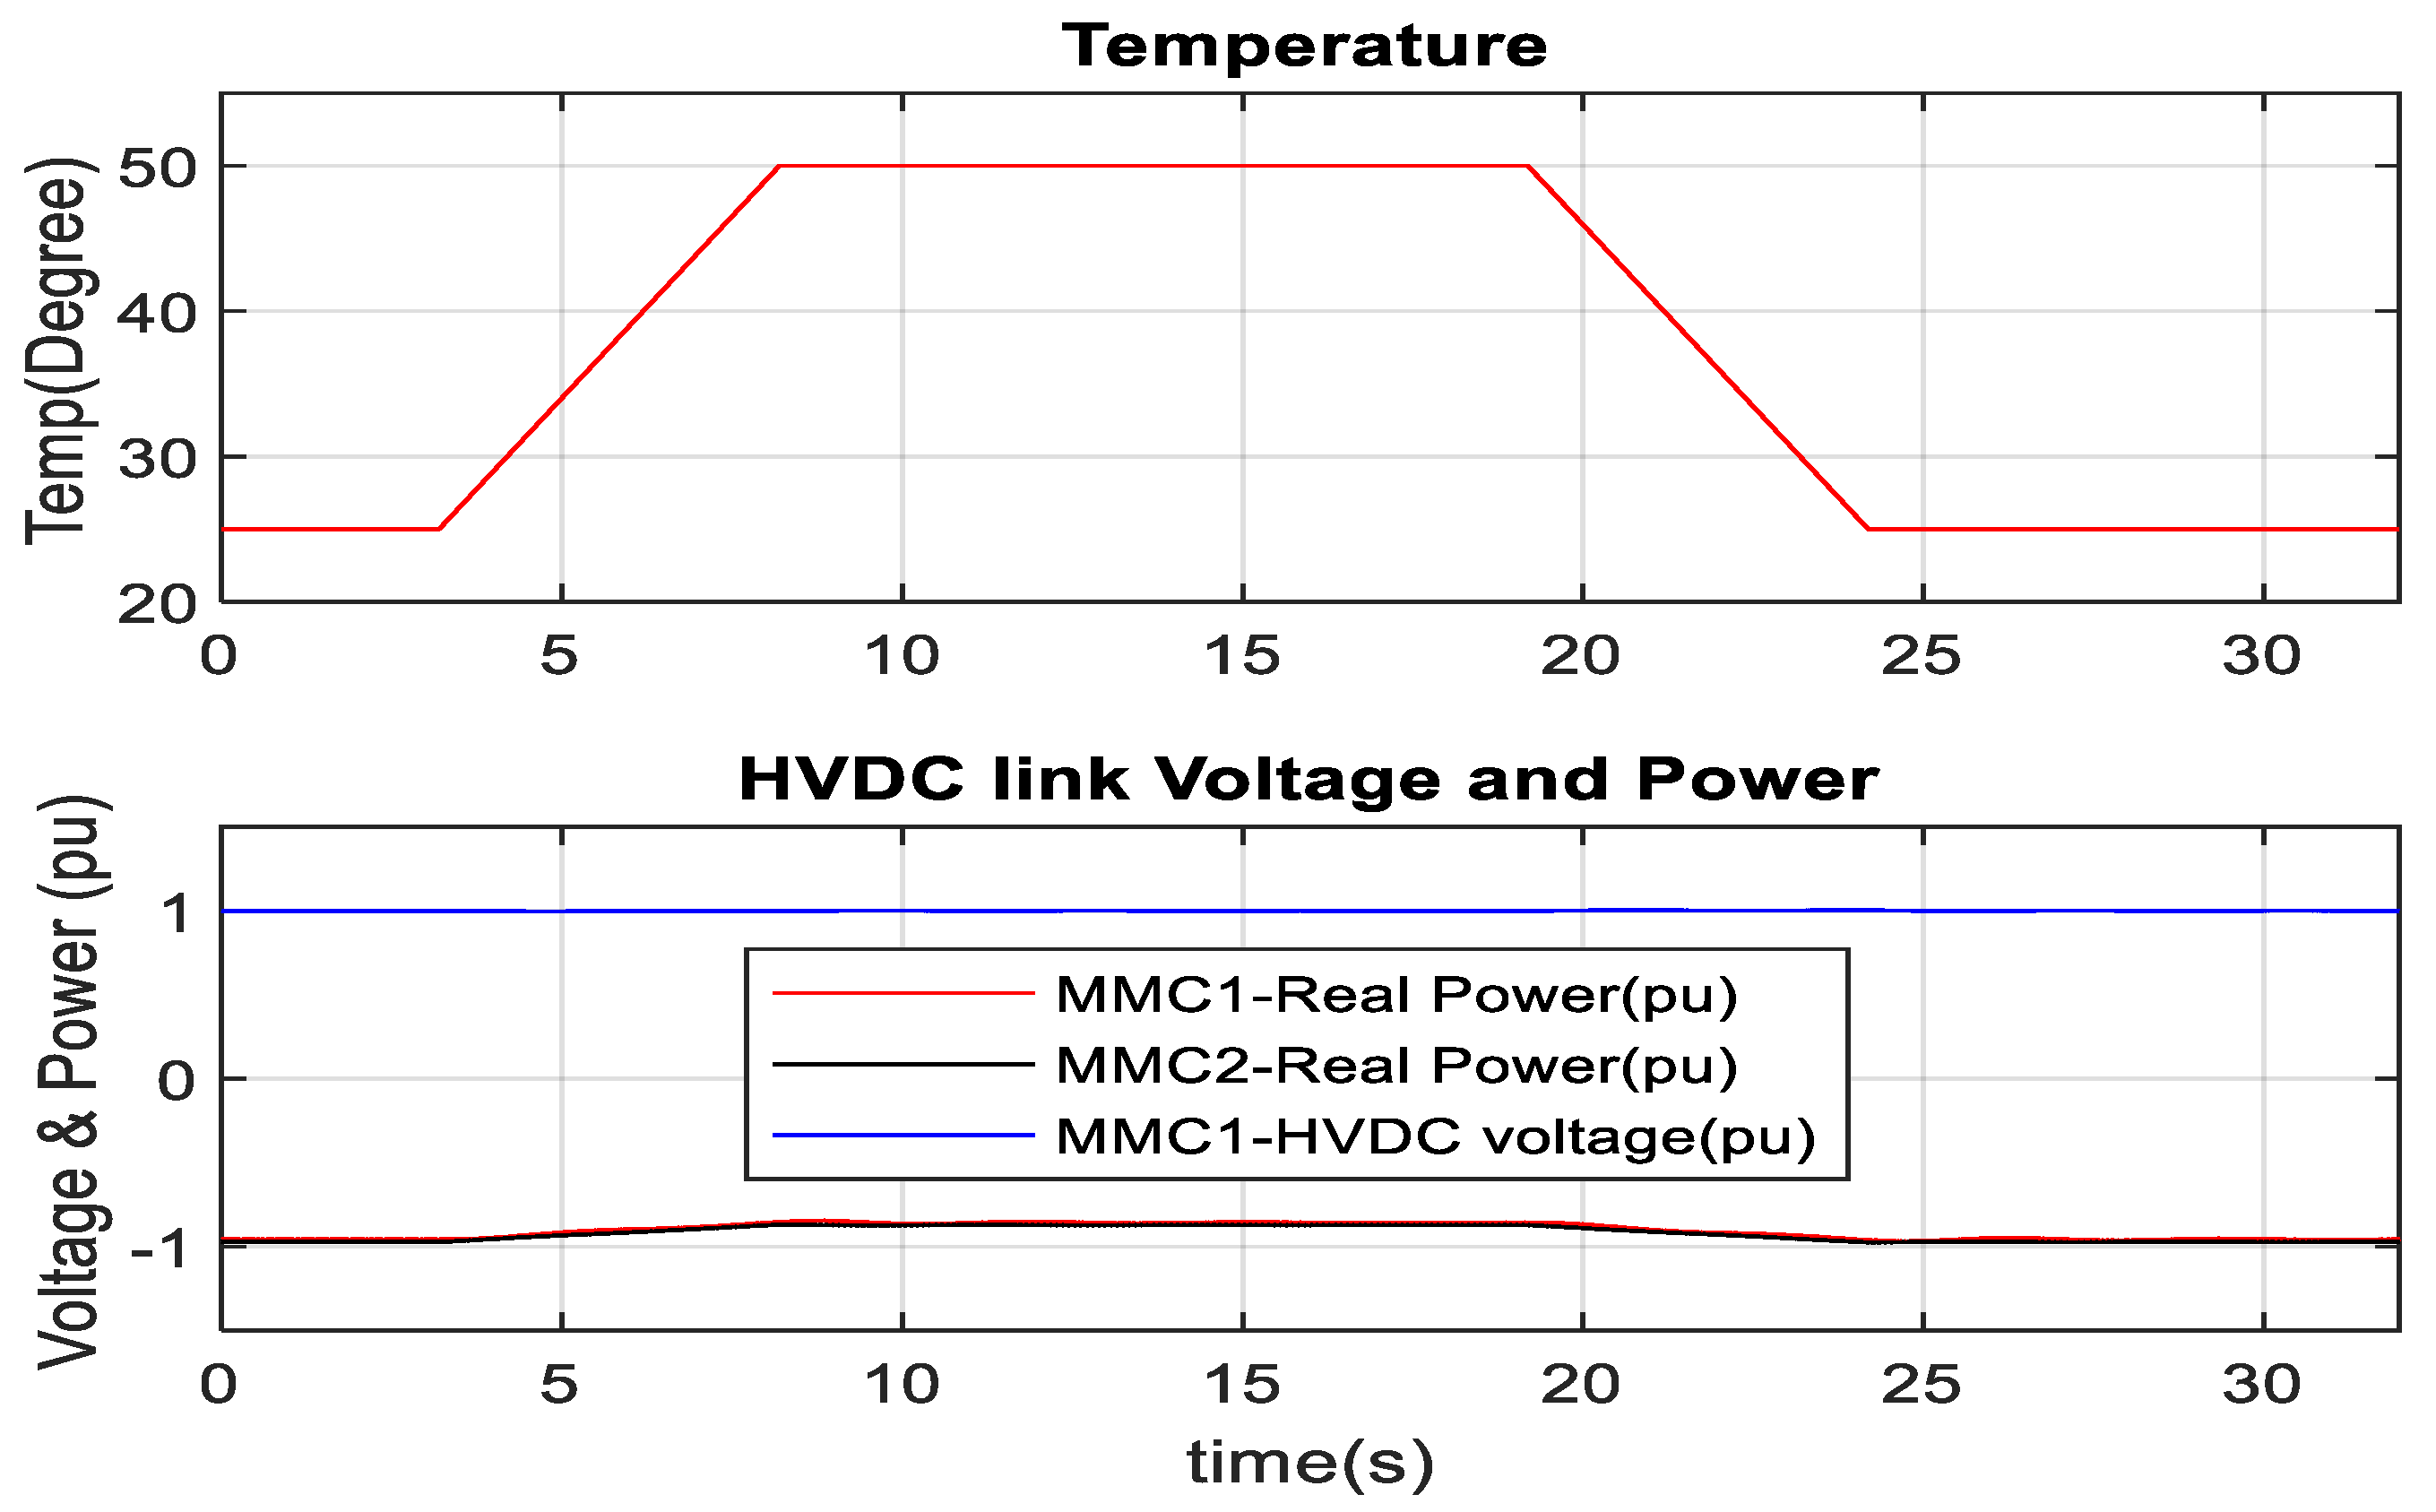
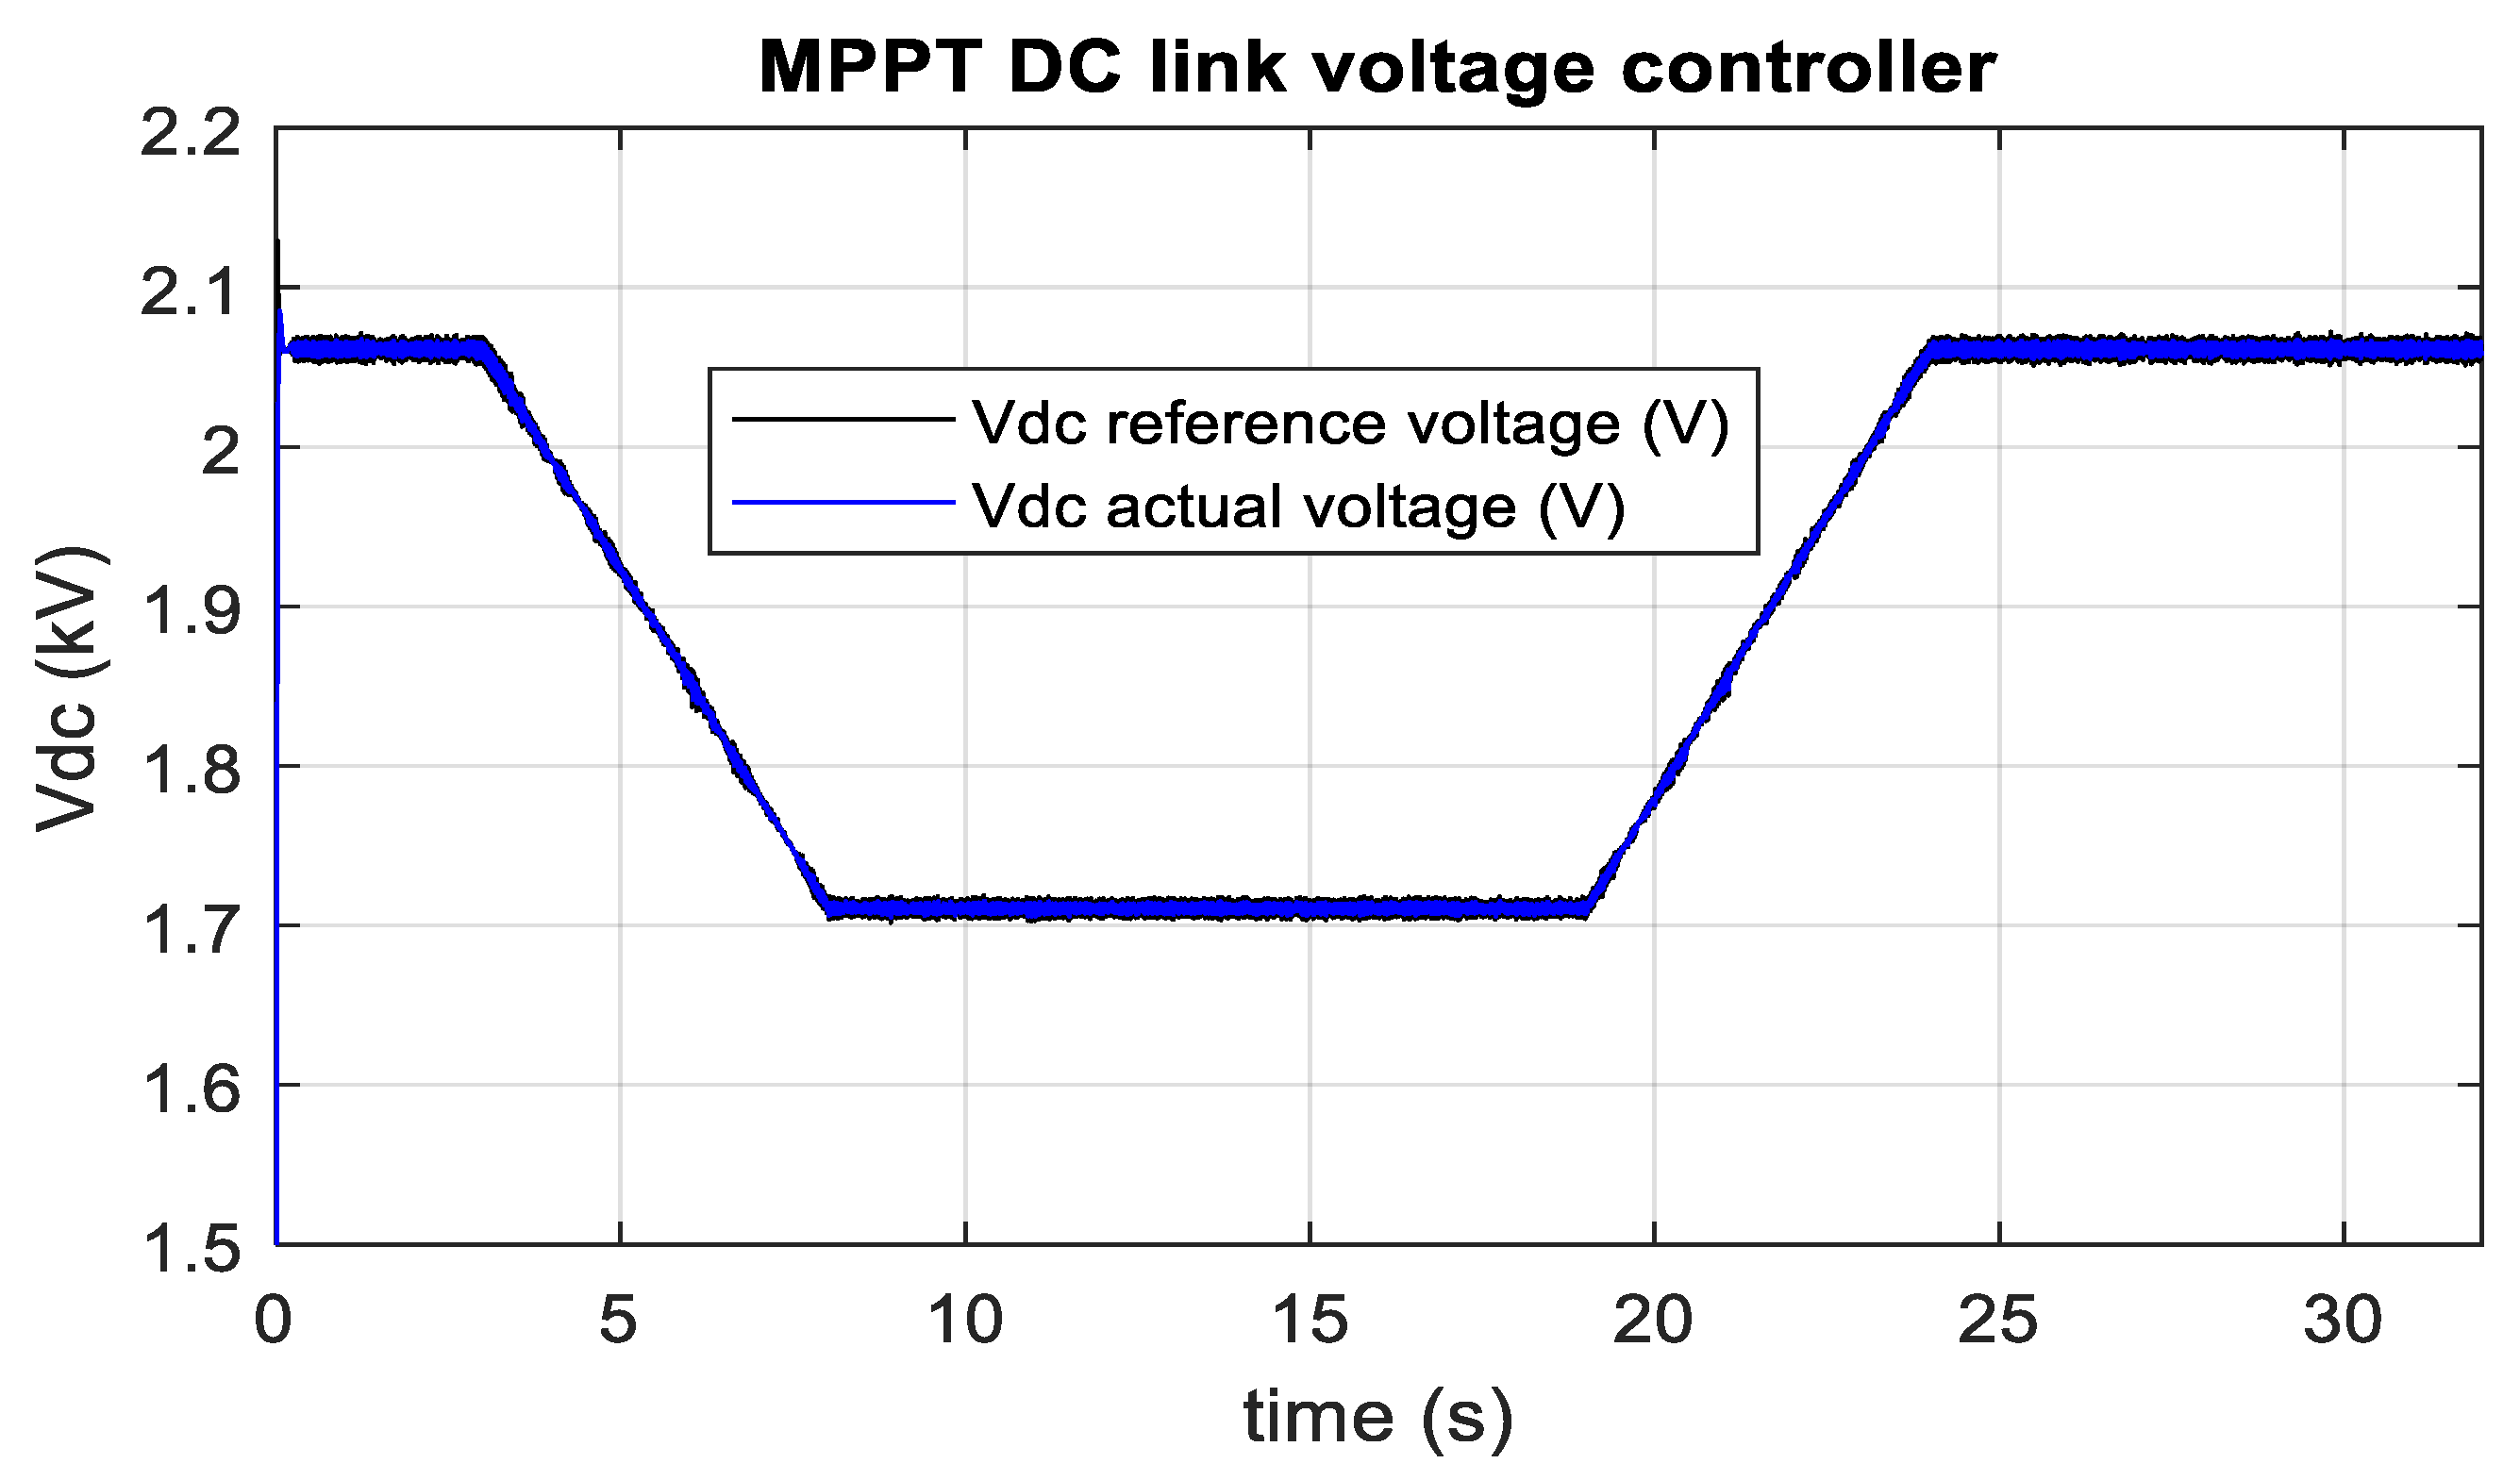
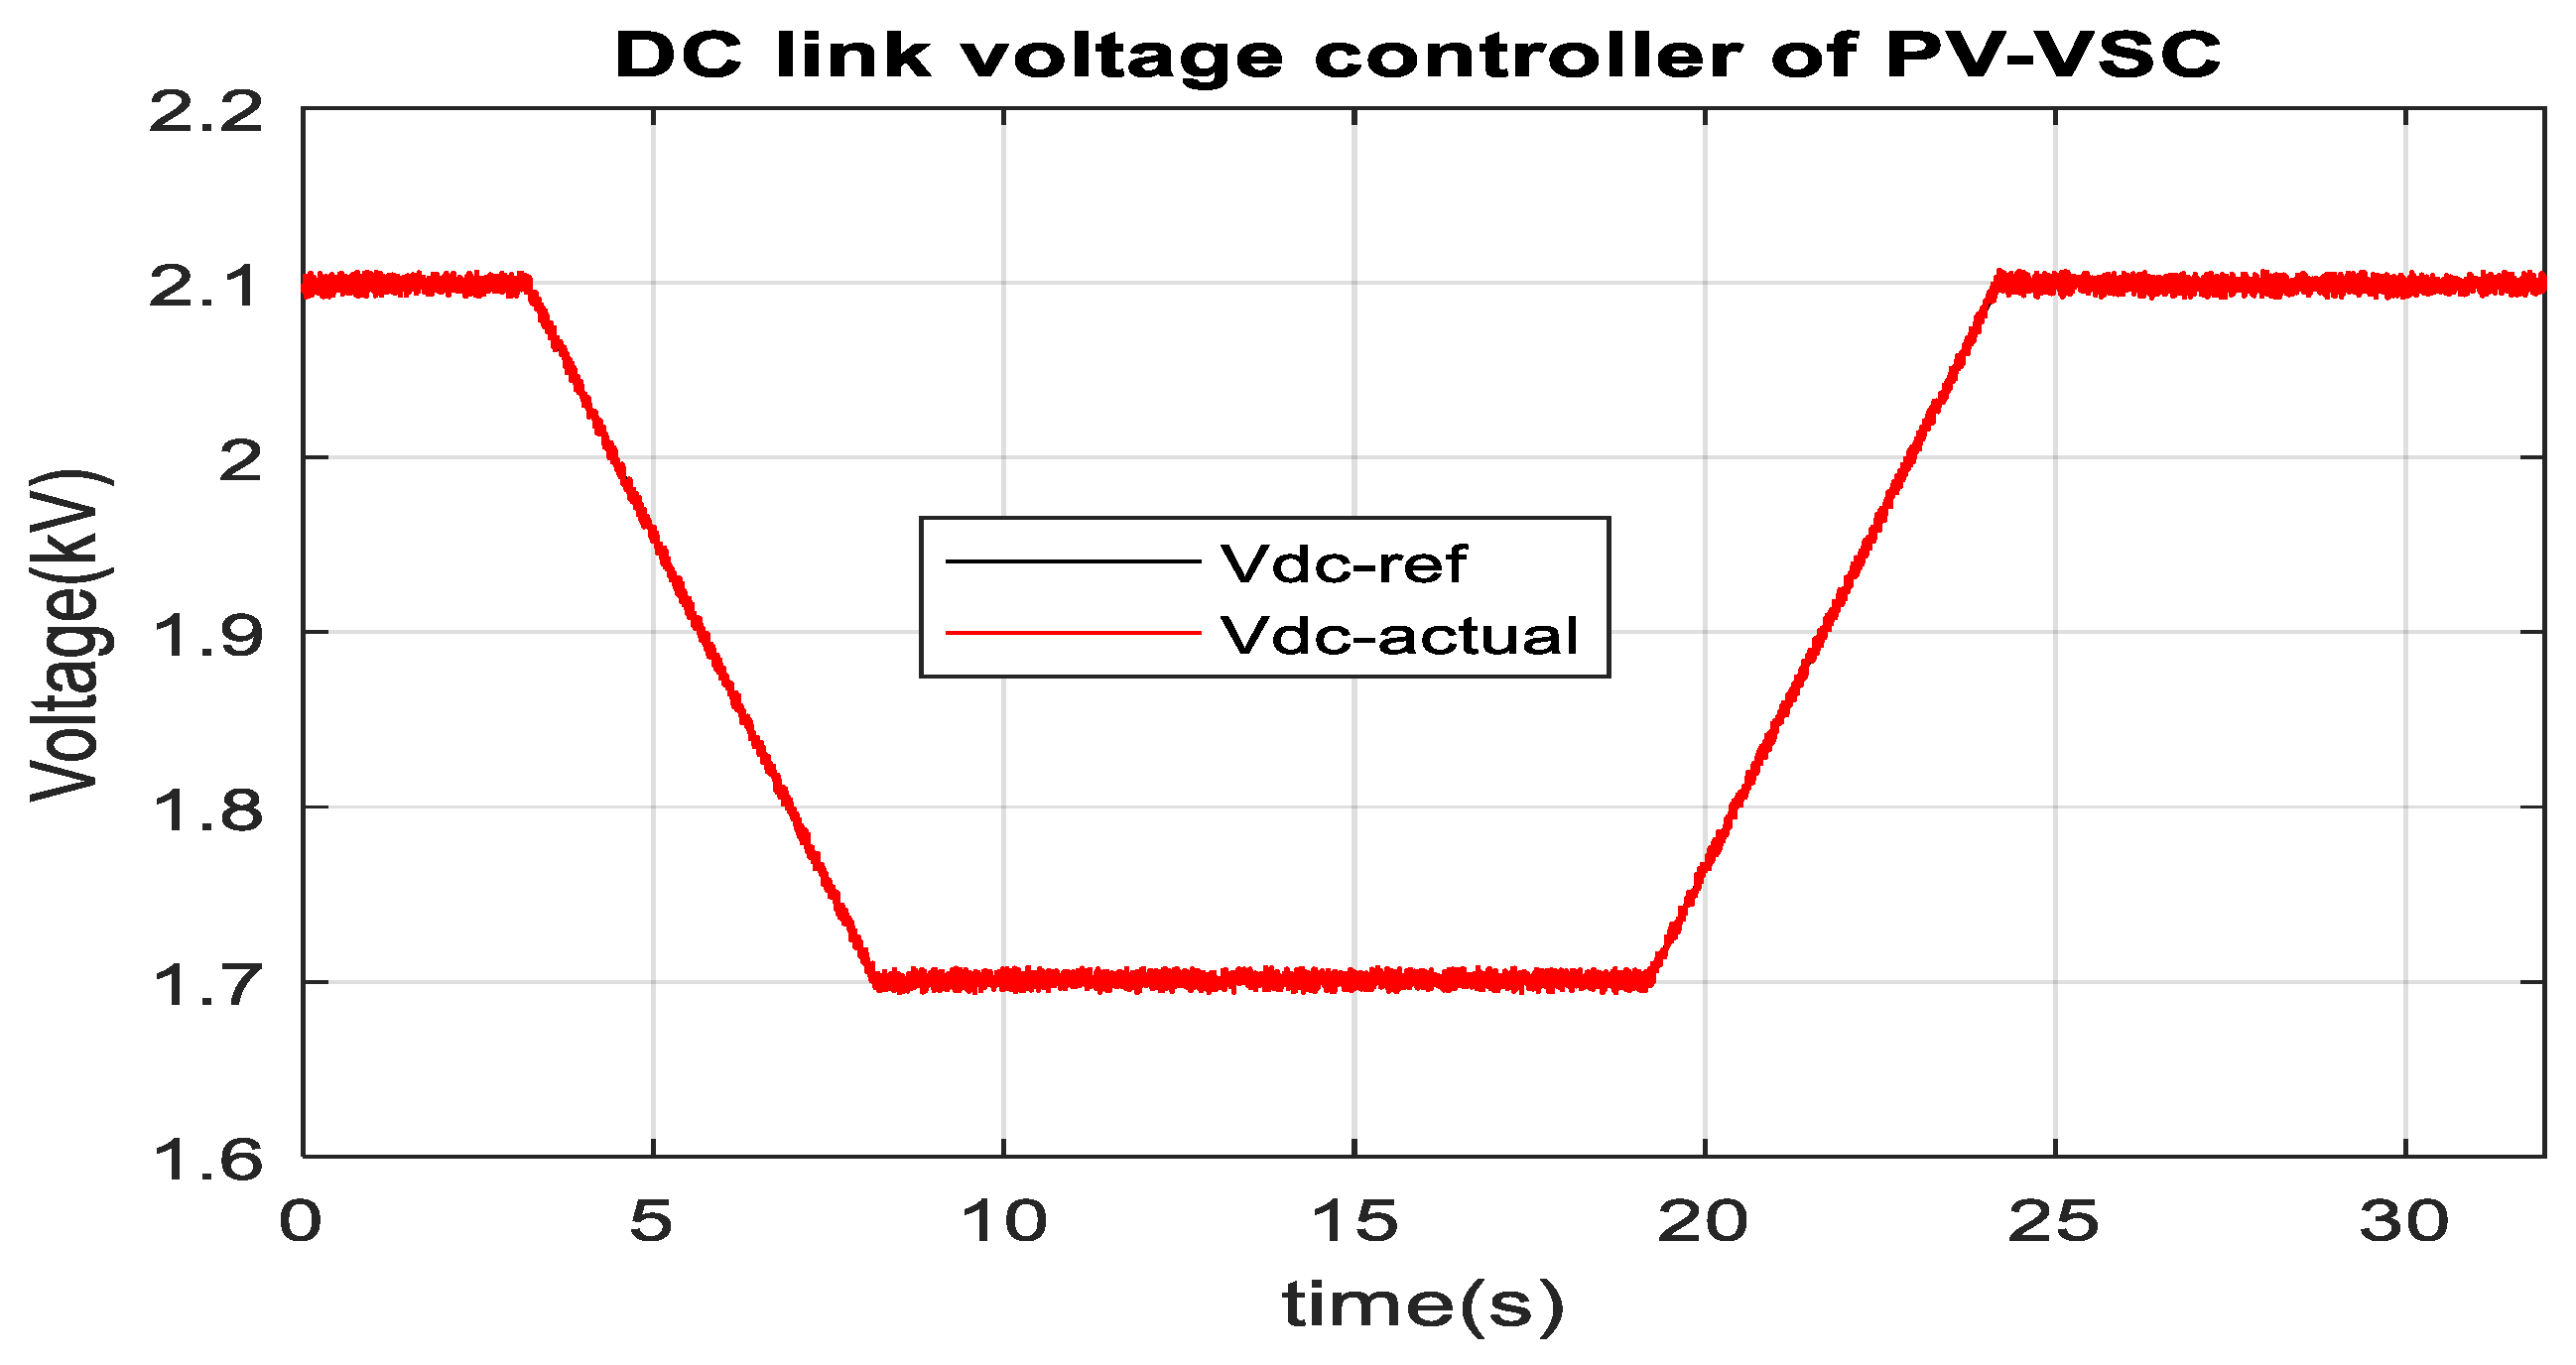
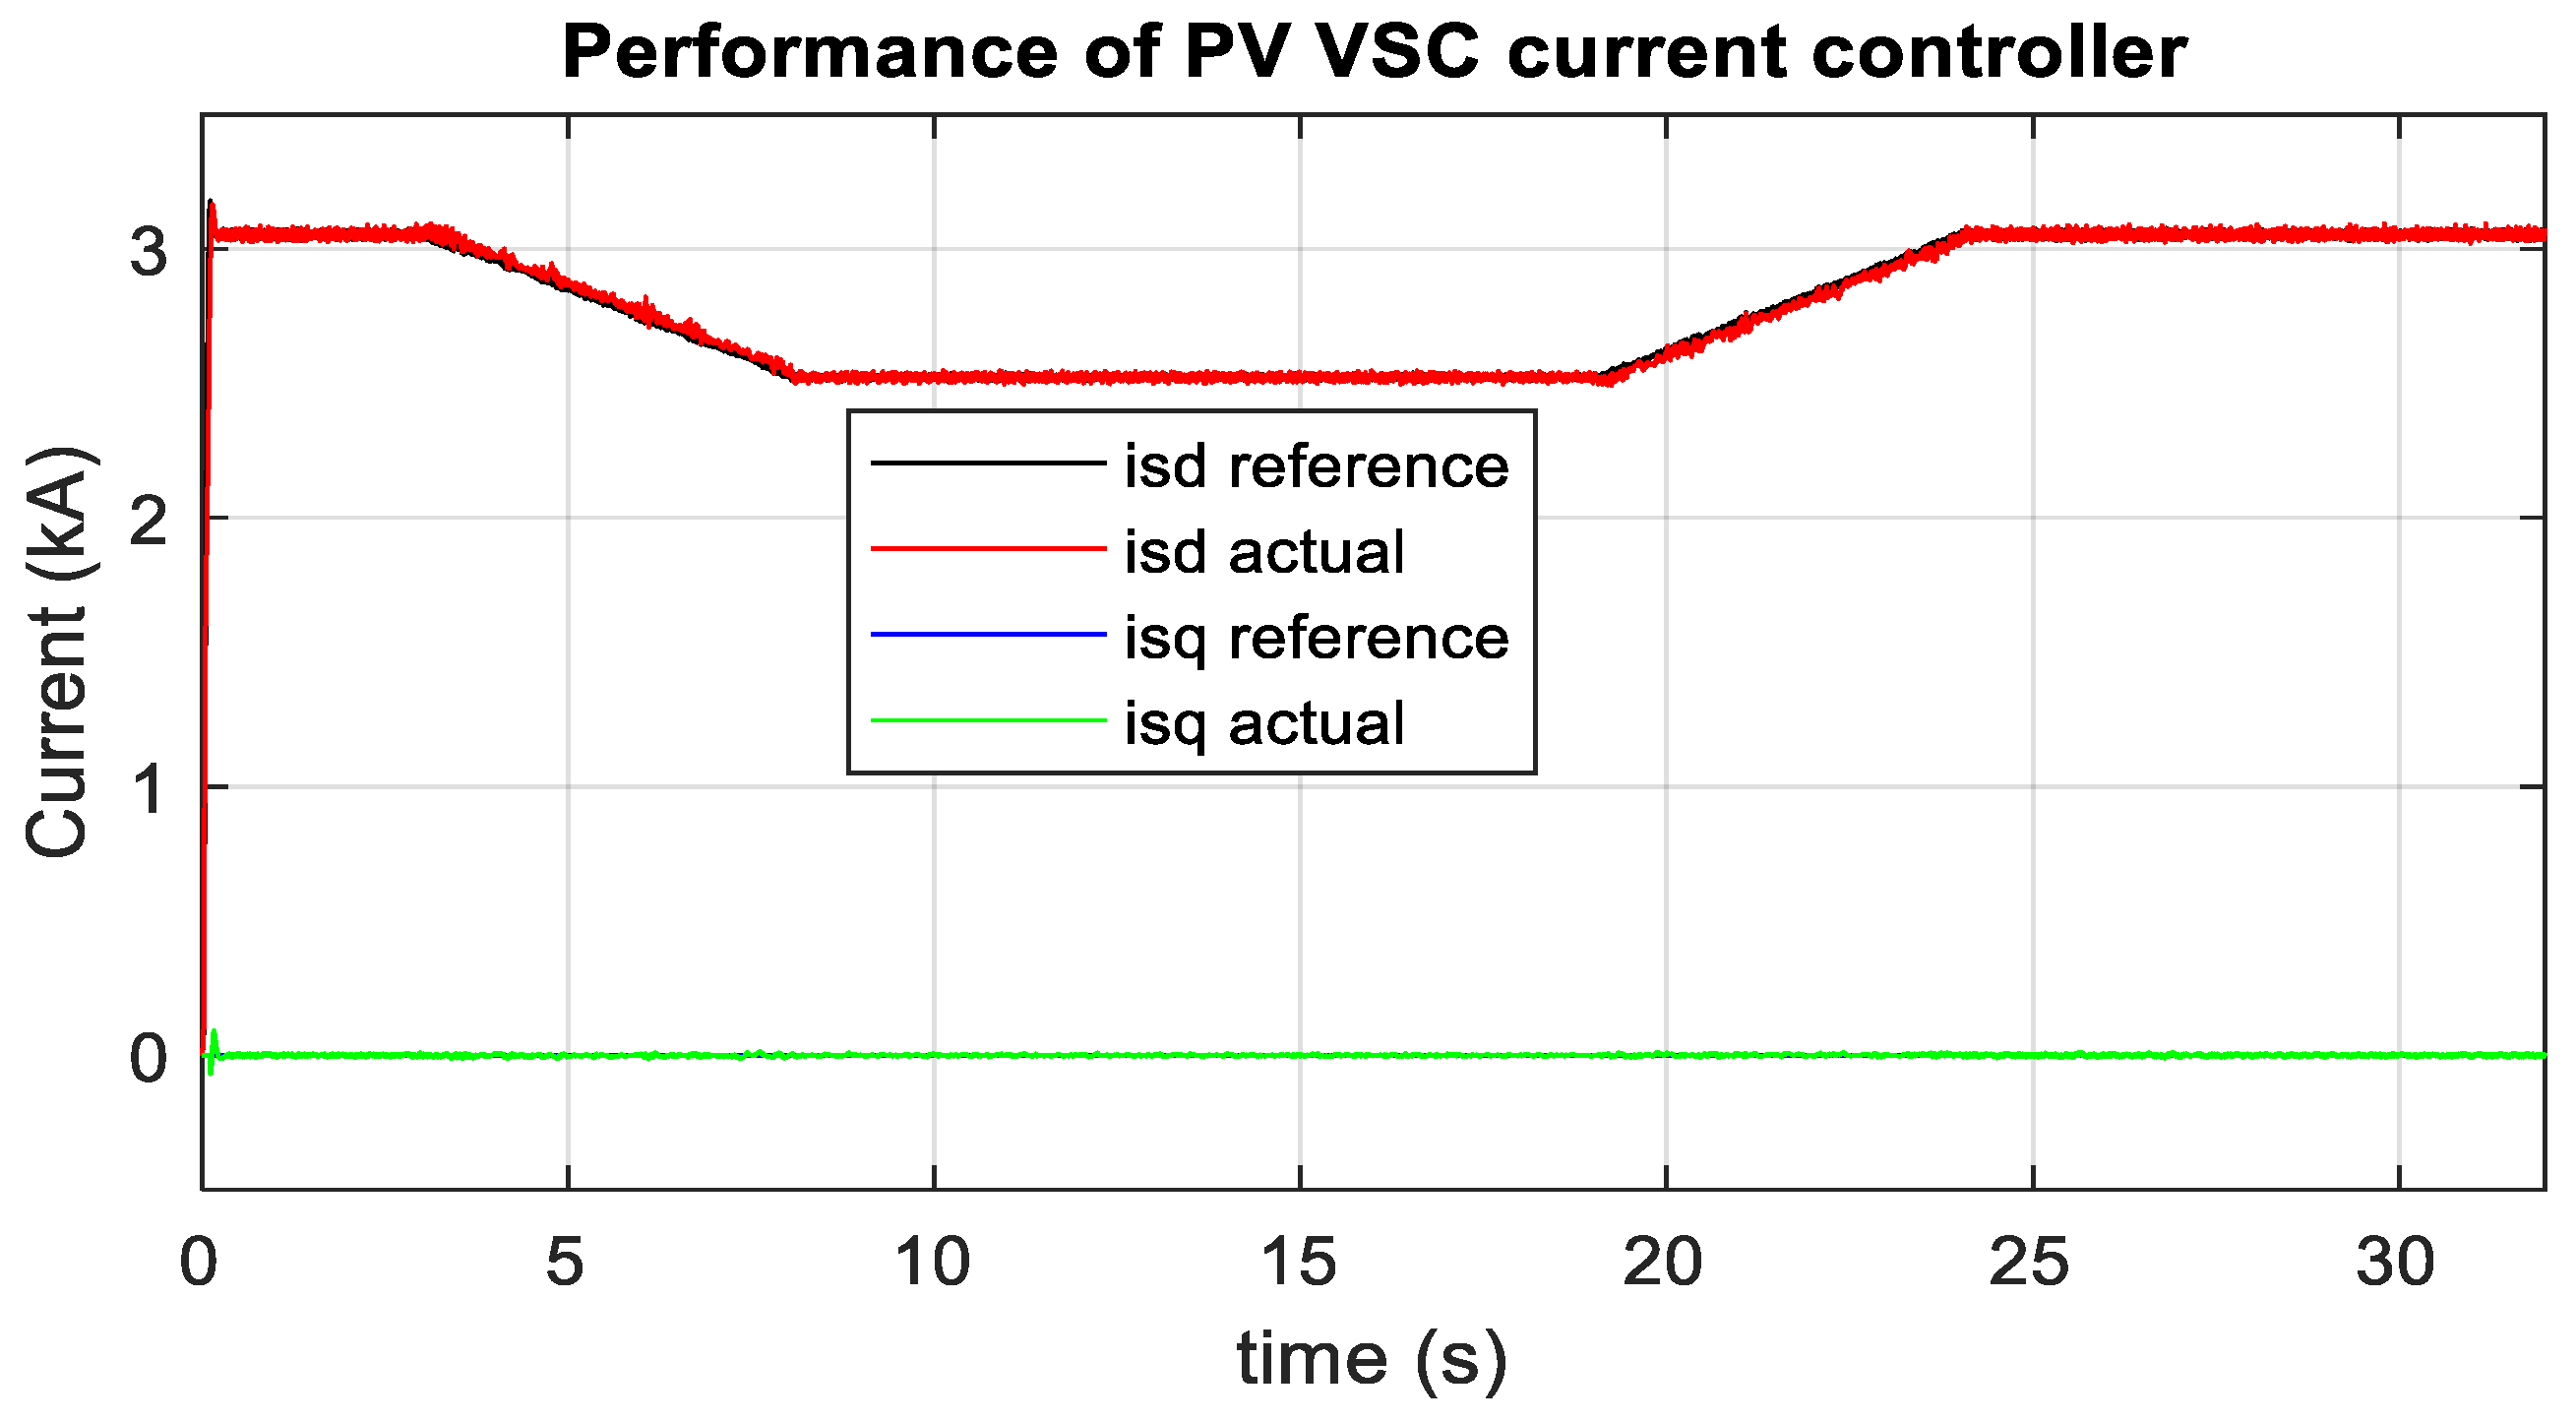
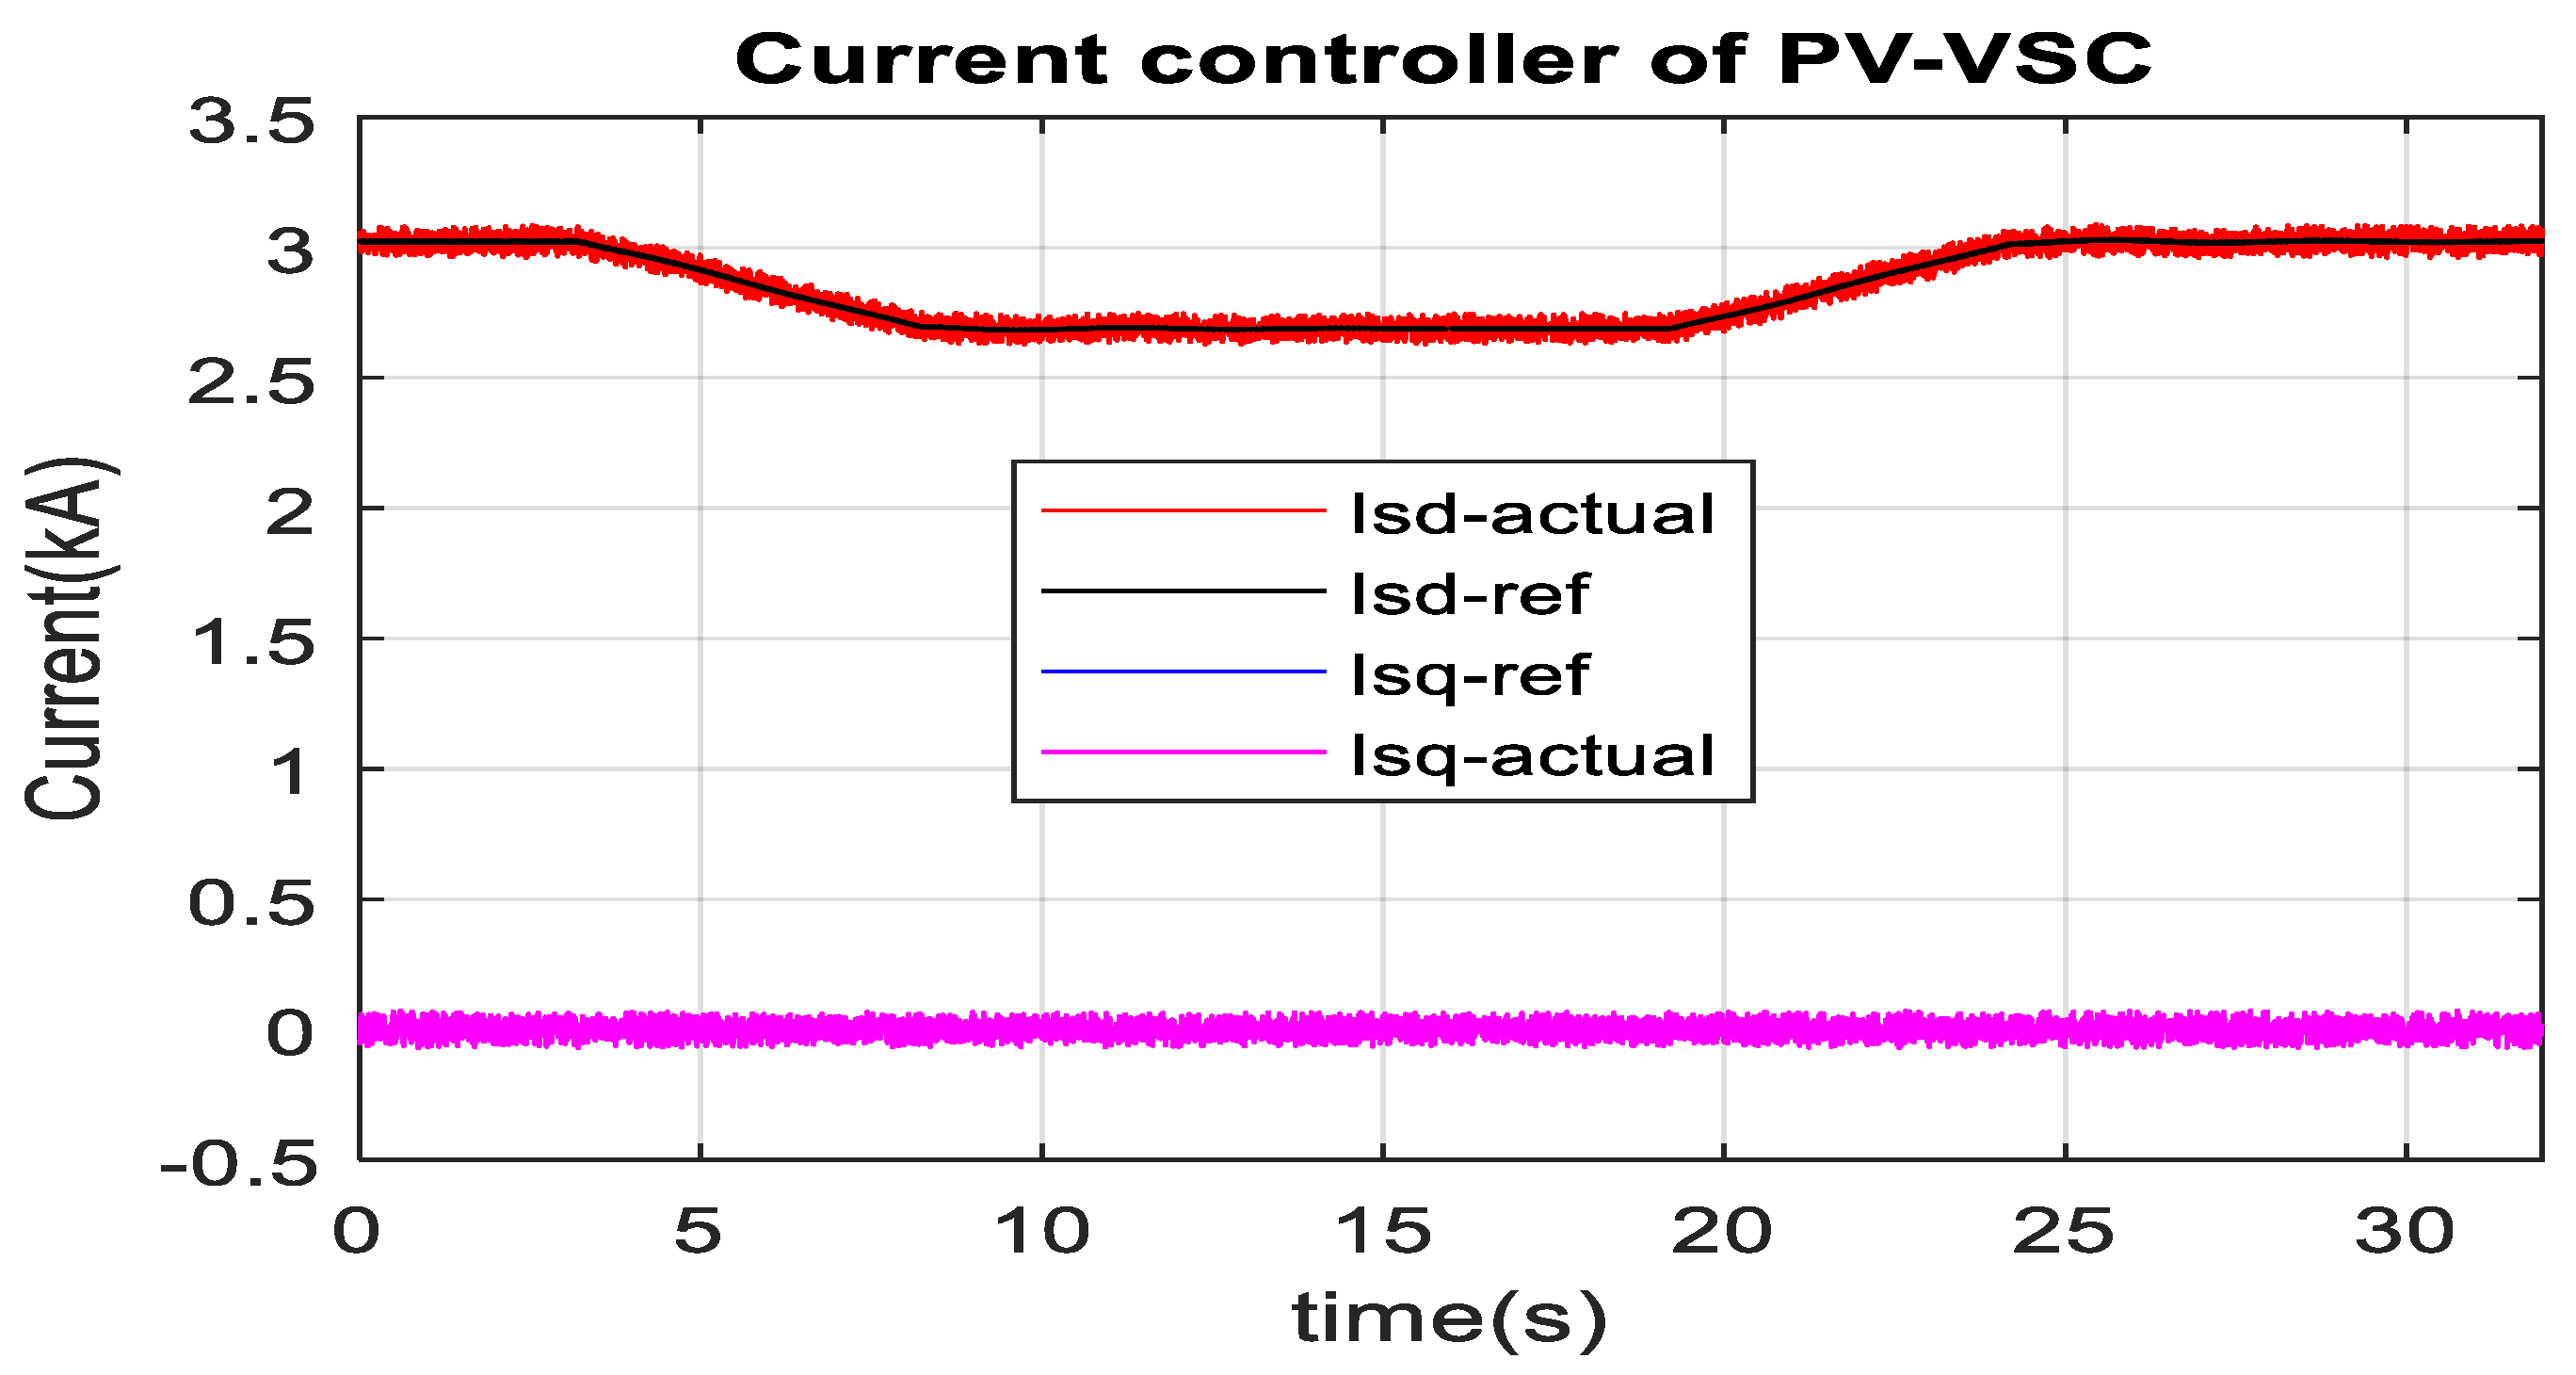
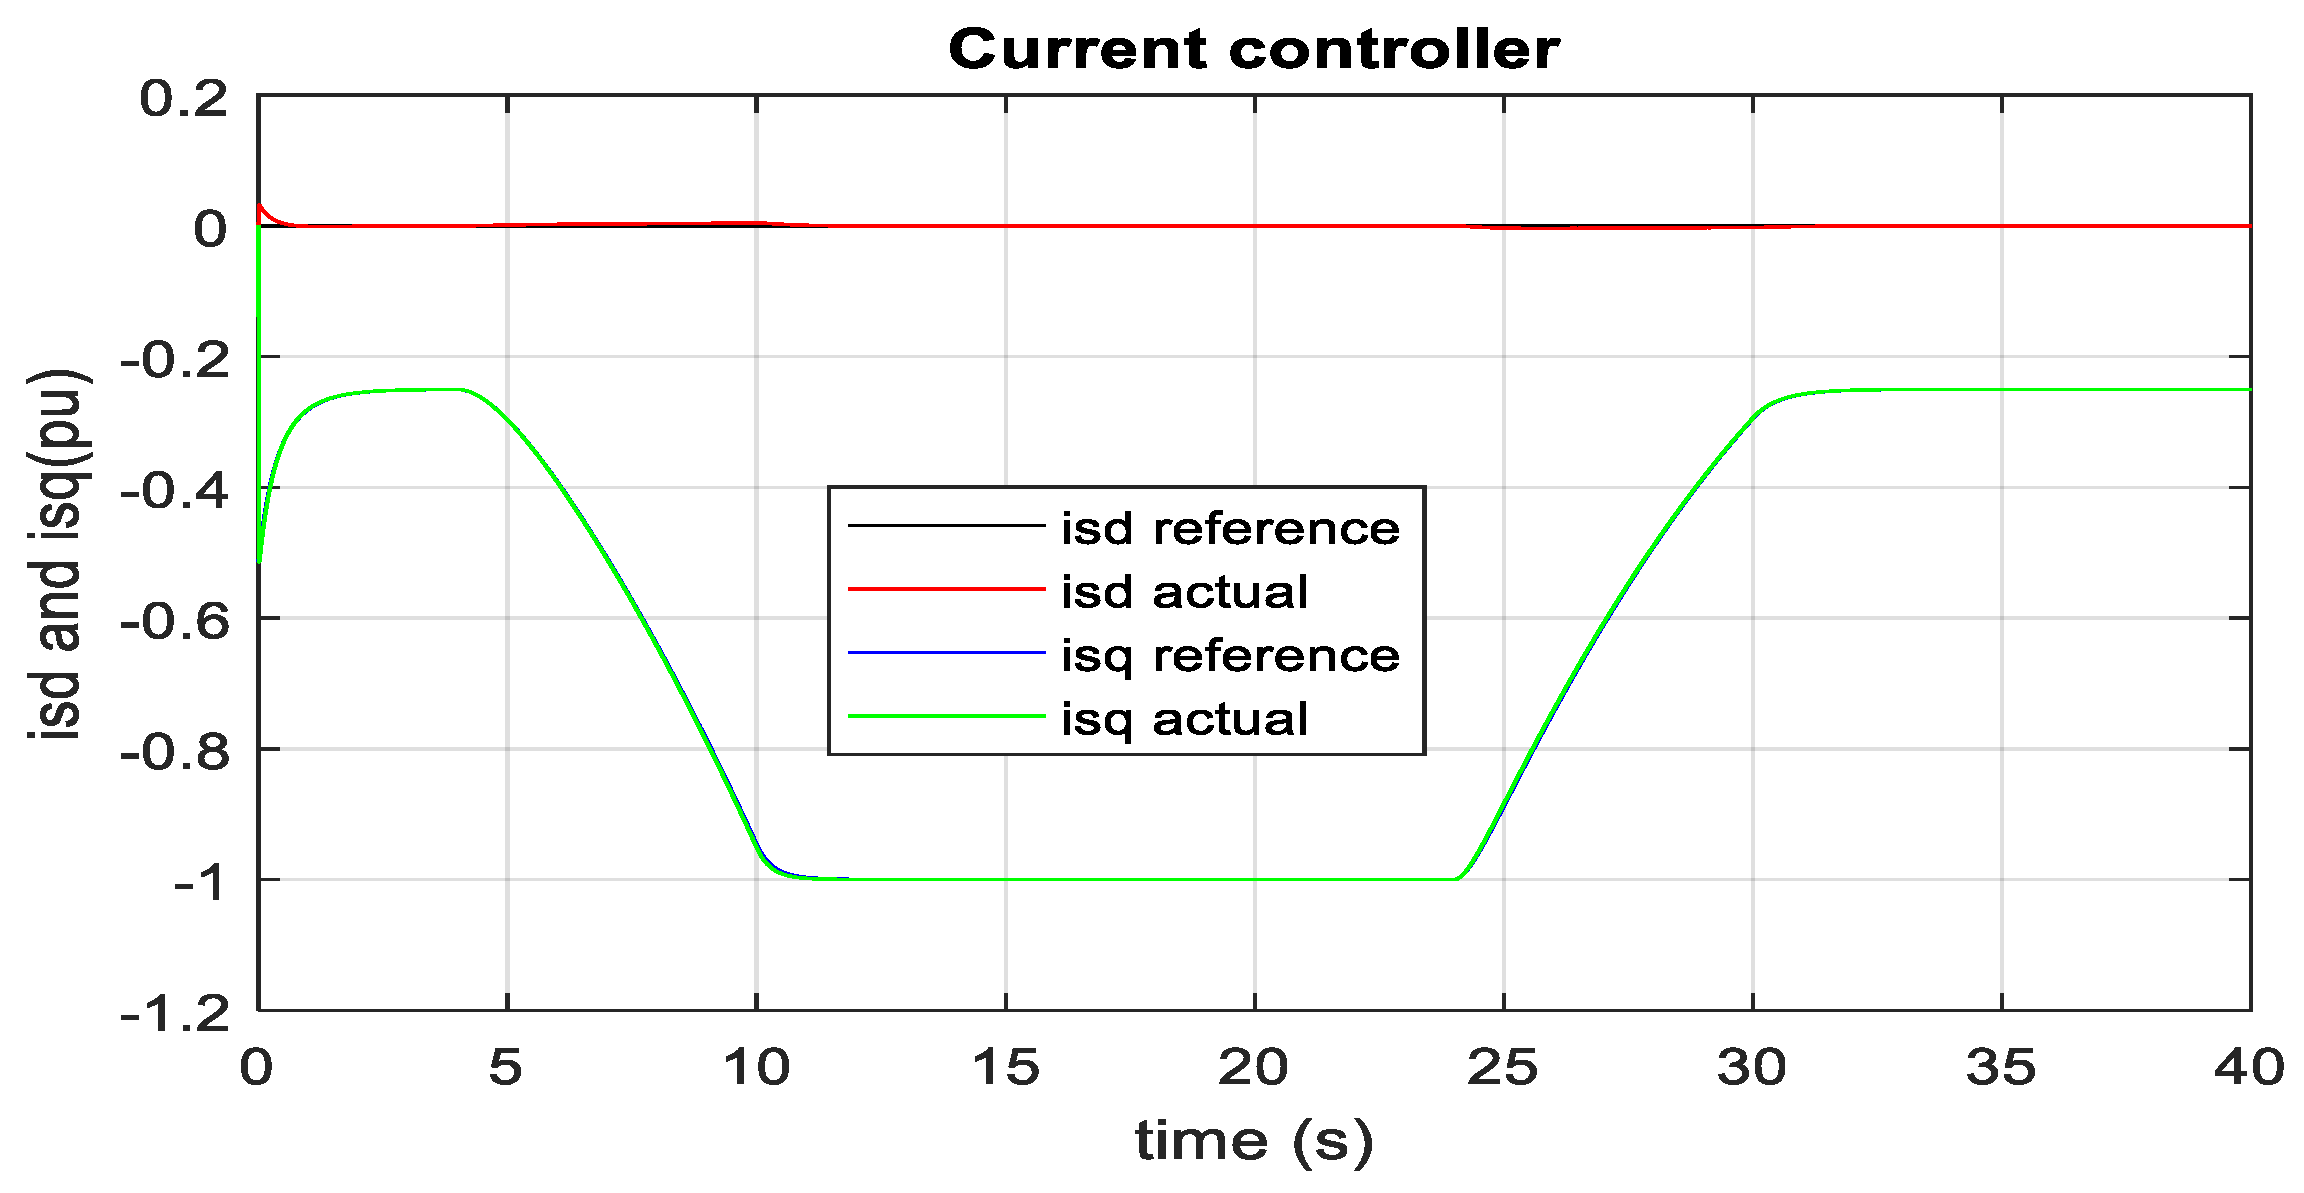
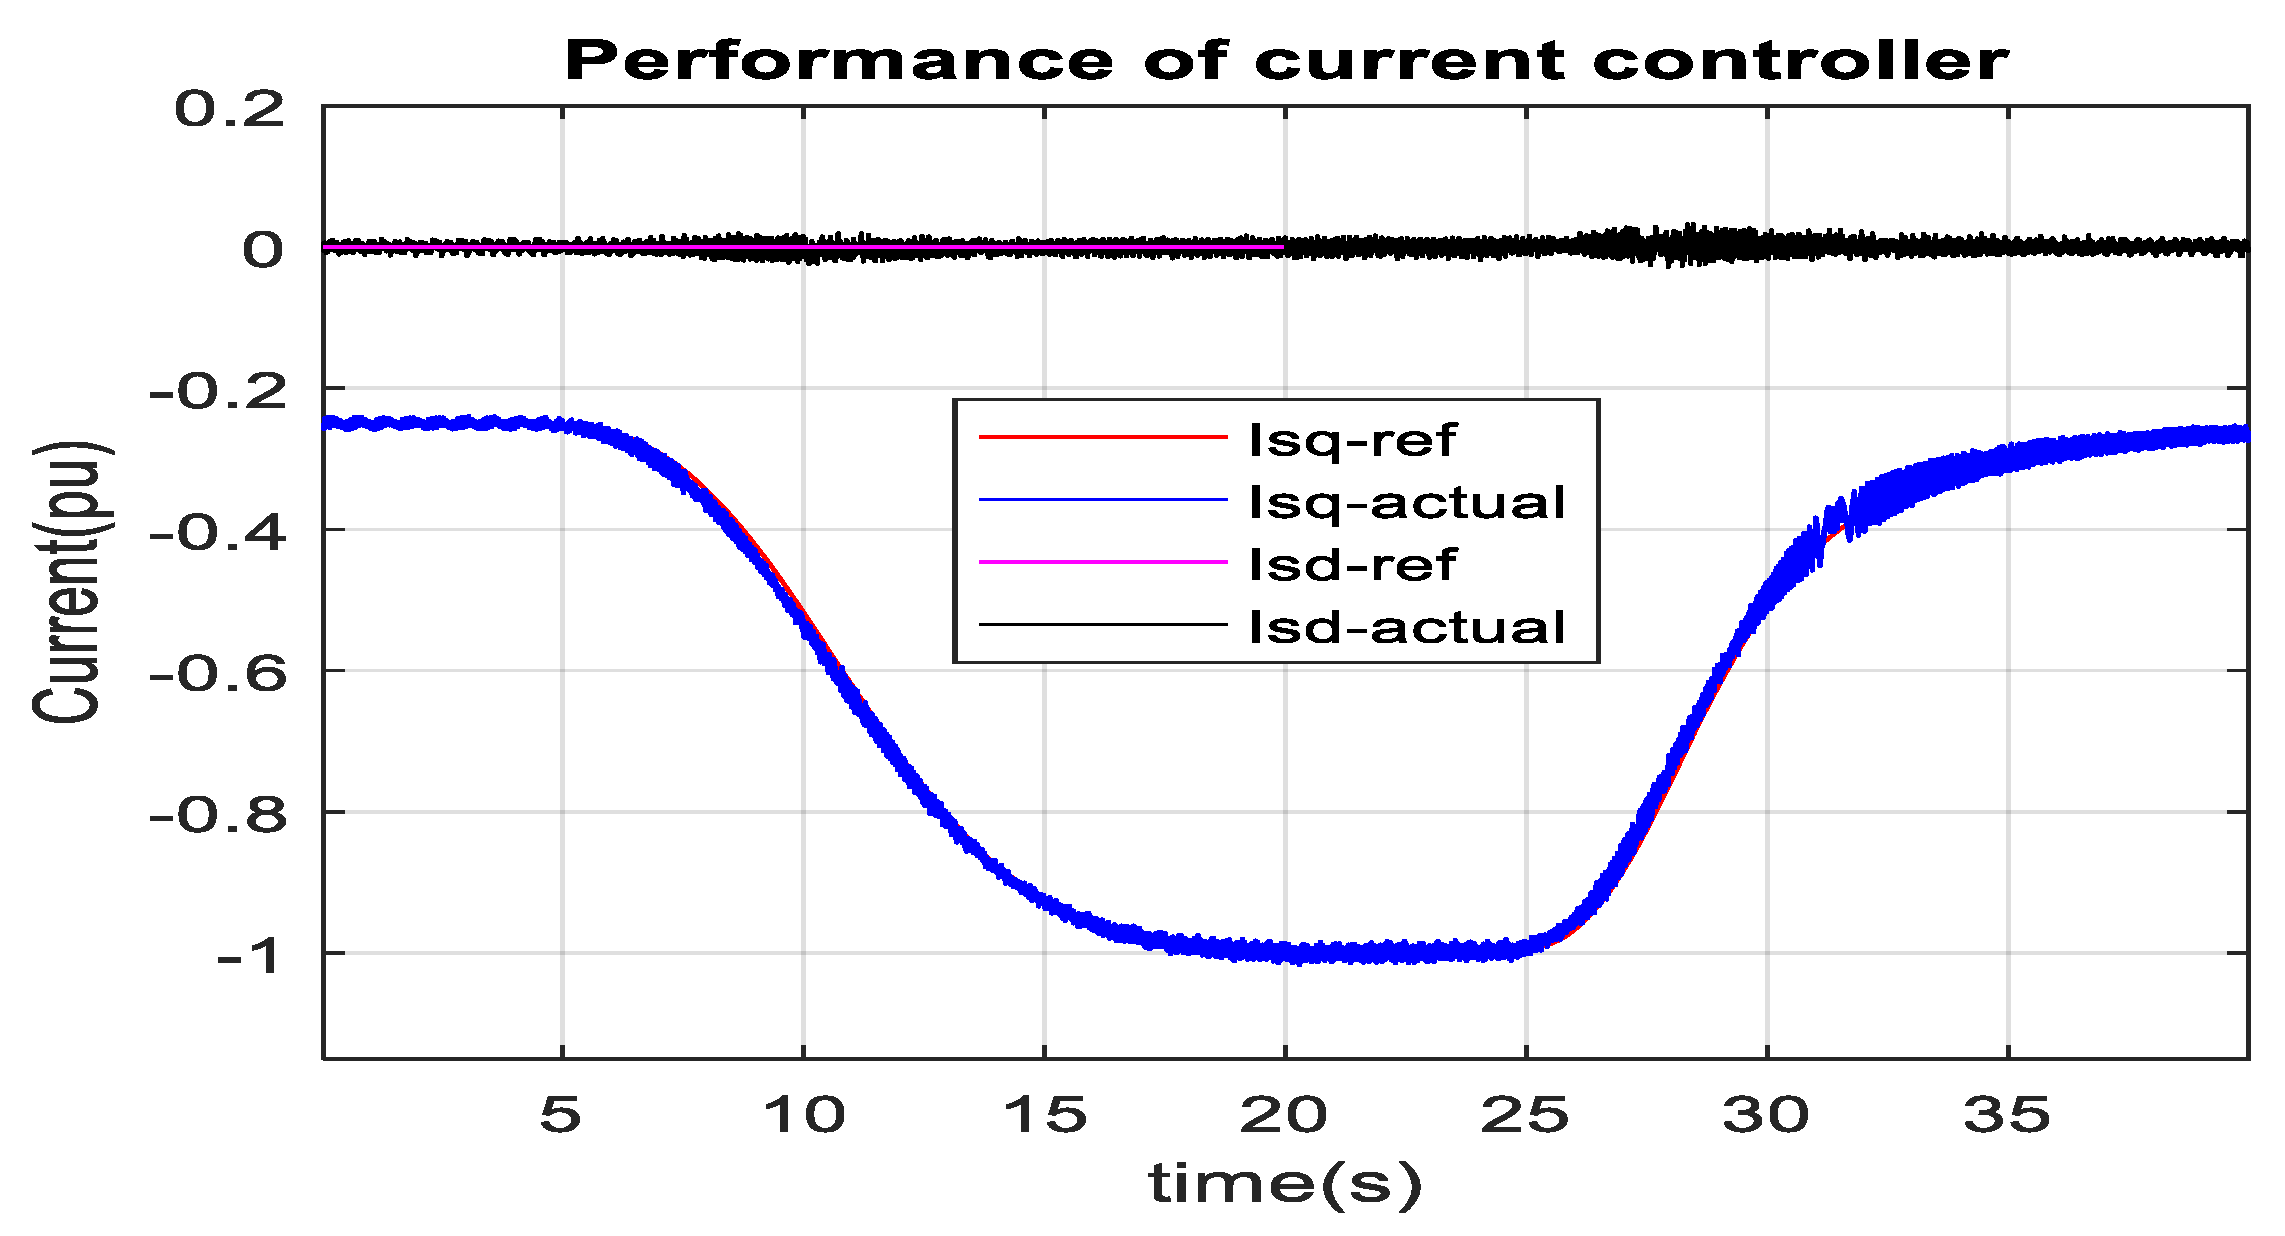
Fifty-six units of PV array inject around 0.09 pu (0.09 × 100 MW = 9 MW 56 × 0.158 MW) real power to 1 pu (1 × 100 MW = 100 MW 56 × 1.74 MW) real power into MMC2. MMC1 receives slightly less power than MMC2 due to loss in the HVDC transmission line. Figure 25 and Figure 26 show the current controller performance during the solar radiation change in MATLAB/SIMULINK and RTDS-dSPACE, respectively. During constant irradiance (1000 Wm−2), it is also found from the PV panel’s characteristics curve, as shown in Figure 2, the peak PV energy for one PV unit is 1.74 MW at 25 °C, and 1.43 MW at 50 °C. During temperature change from 25 °C to 50 °C, the PV array produces around 1.74 MW to 1.43 MW power, as depicted in Figure 27. Similarly, the power is raised from 1.43 MW to 1.74 MW over the temperature variation from 50 °C to 25 °C. RTDS-dSPACE results also provide a similar response as depicted in Figure 28. As seen from Figure 2, the optimal dc-link voltage for PV is 2 kV and 1.7 kV at temperatures 25 °C and 50 °C, respectively. Figure 29 confirms that the MPPT algorithm provides the optimum reference DC link voltage. The actual DC link voltage tracks the reference DC link voltage without any steady-state error. Similar performance is also found in RTDS-dSPACE as shown in Figure 30. The power from the fifty-six units PV array reduces from 1 pu (100 MW) to around 0.8 pu (80 MW) to the MMC2 terminal. Similarly, power injection increases from 0.8 pu (80 MW) to 1 pu (100 MW) during a temperature change from 50 °C to 25 °C. This also validates the optimal PV energy tracking during temperature variation. As shown in Figure 30, the RTDS-dSPACE result also confirms that the MPPT algorithm sets reference voltage around 2 kV and 1.7 kV at temperatures 25 °C and 50 °C, respectively. In addition, the actual DC link voltage tracks the reference DC link voltage. The actual dq current of PV-VSC, as illustrated in Figure 31 and Figure 32 in MATLAB/SIMULINK and RTDS-dSPACE, follows the reference dq current. During variable power injection, no overshoot is observed in the HVDC link voltage.

3.3. DFIG-Based Optimum Wind Energy Integration

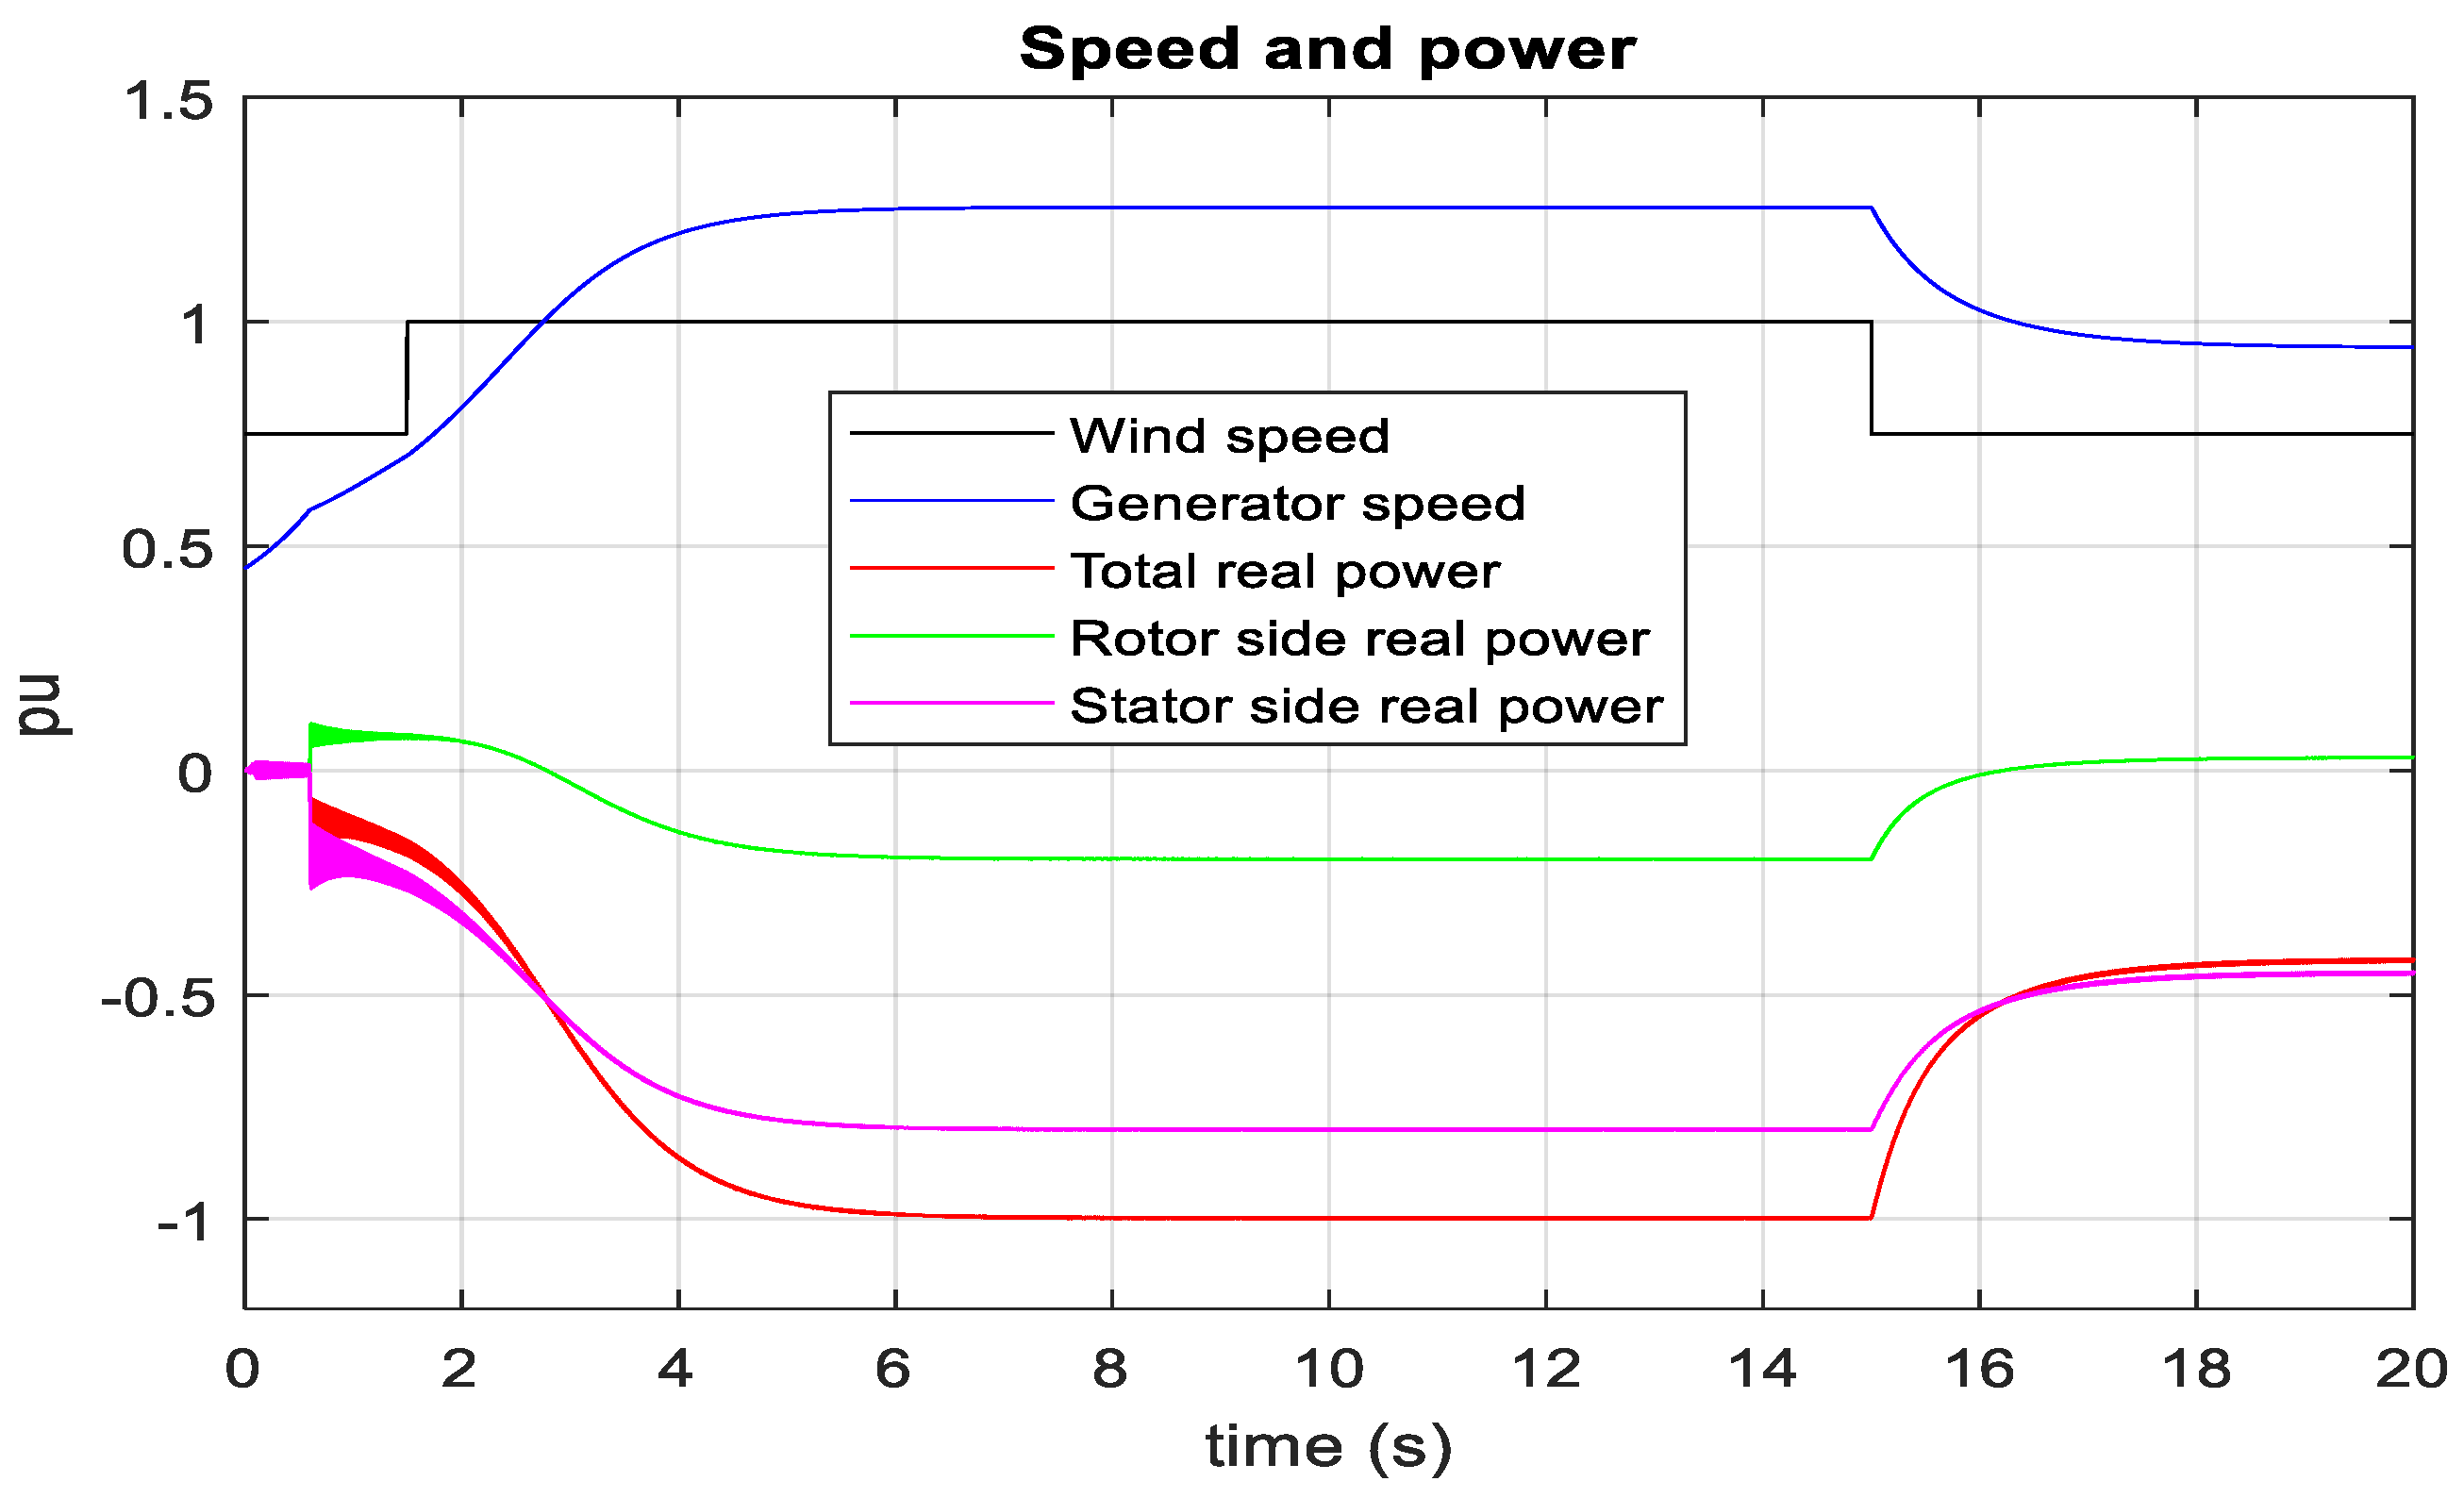
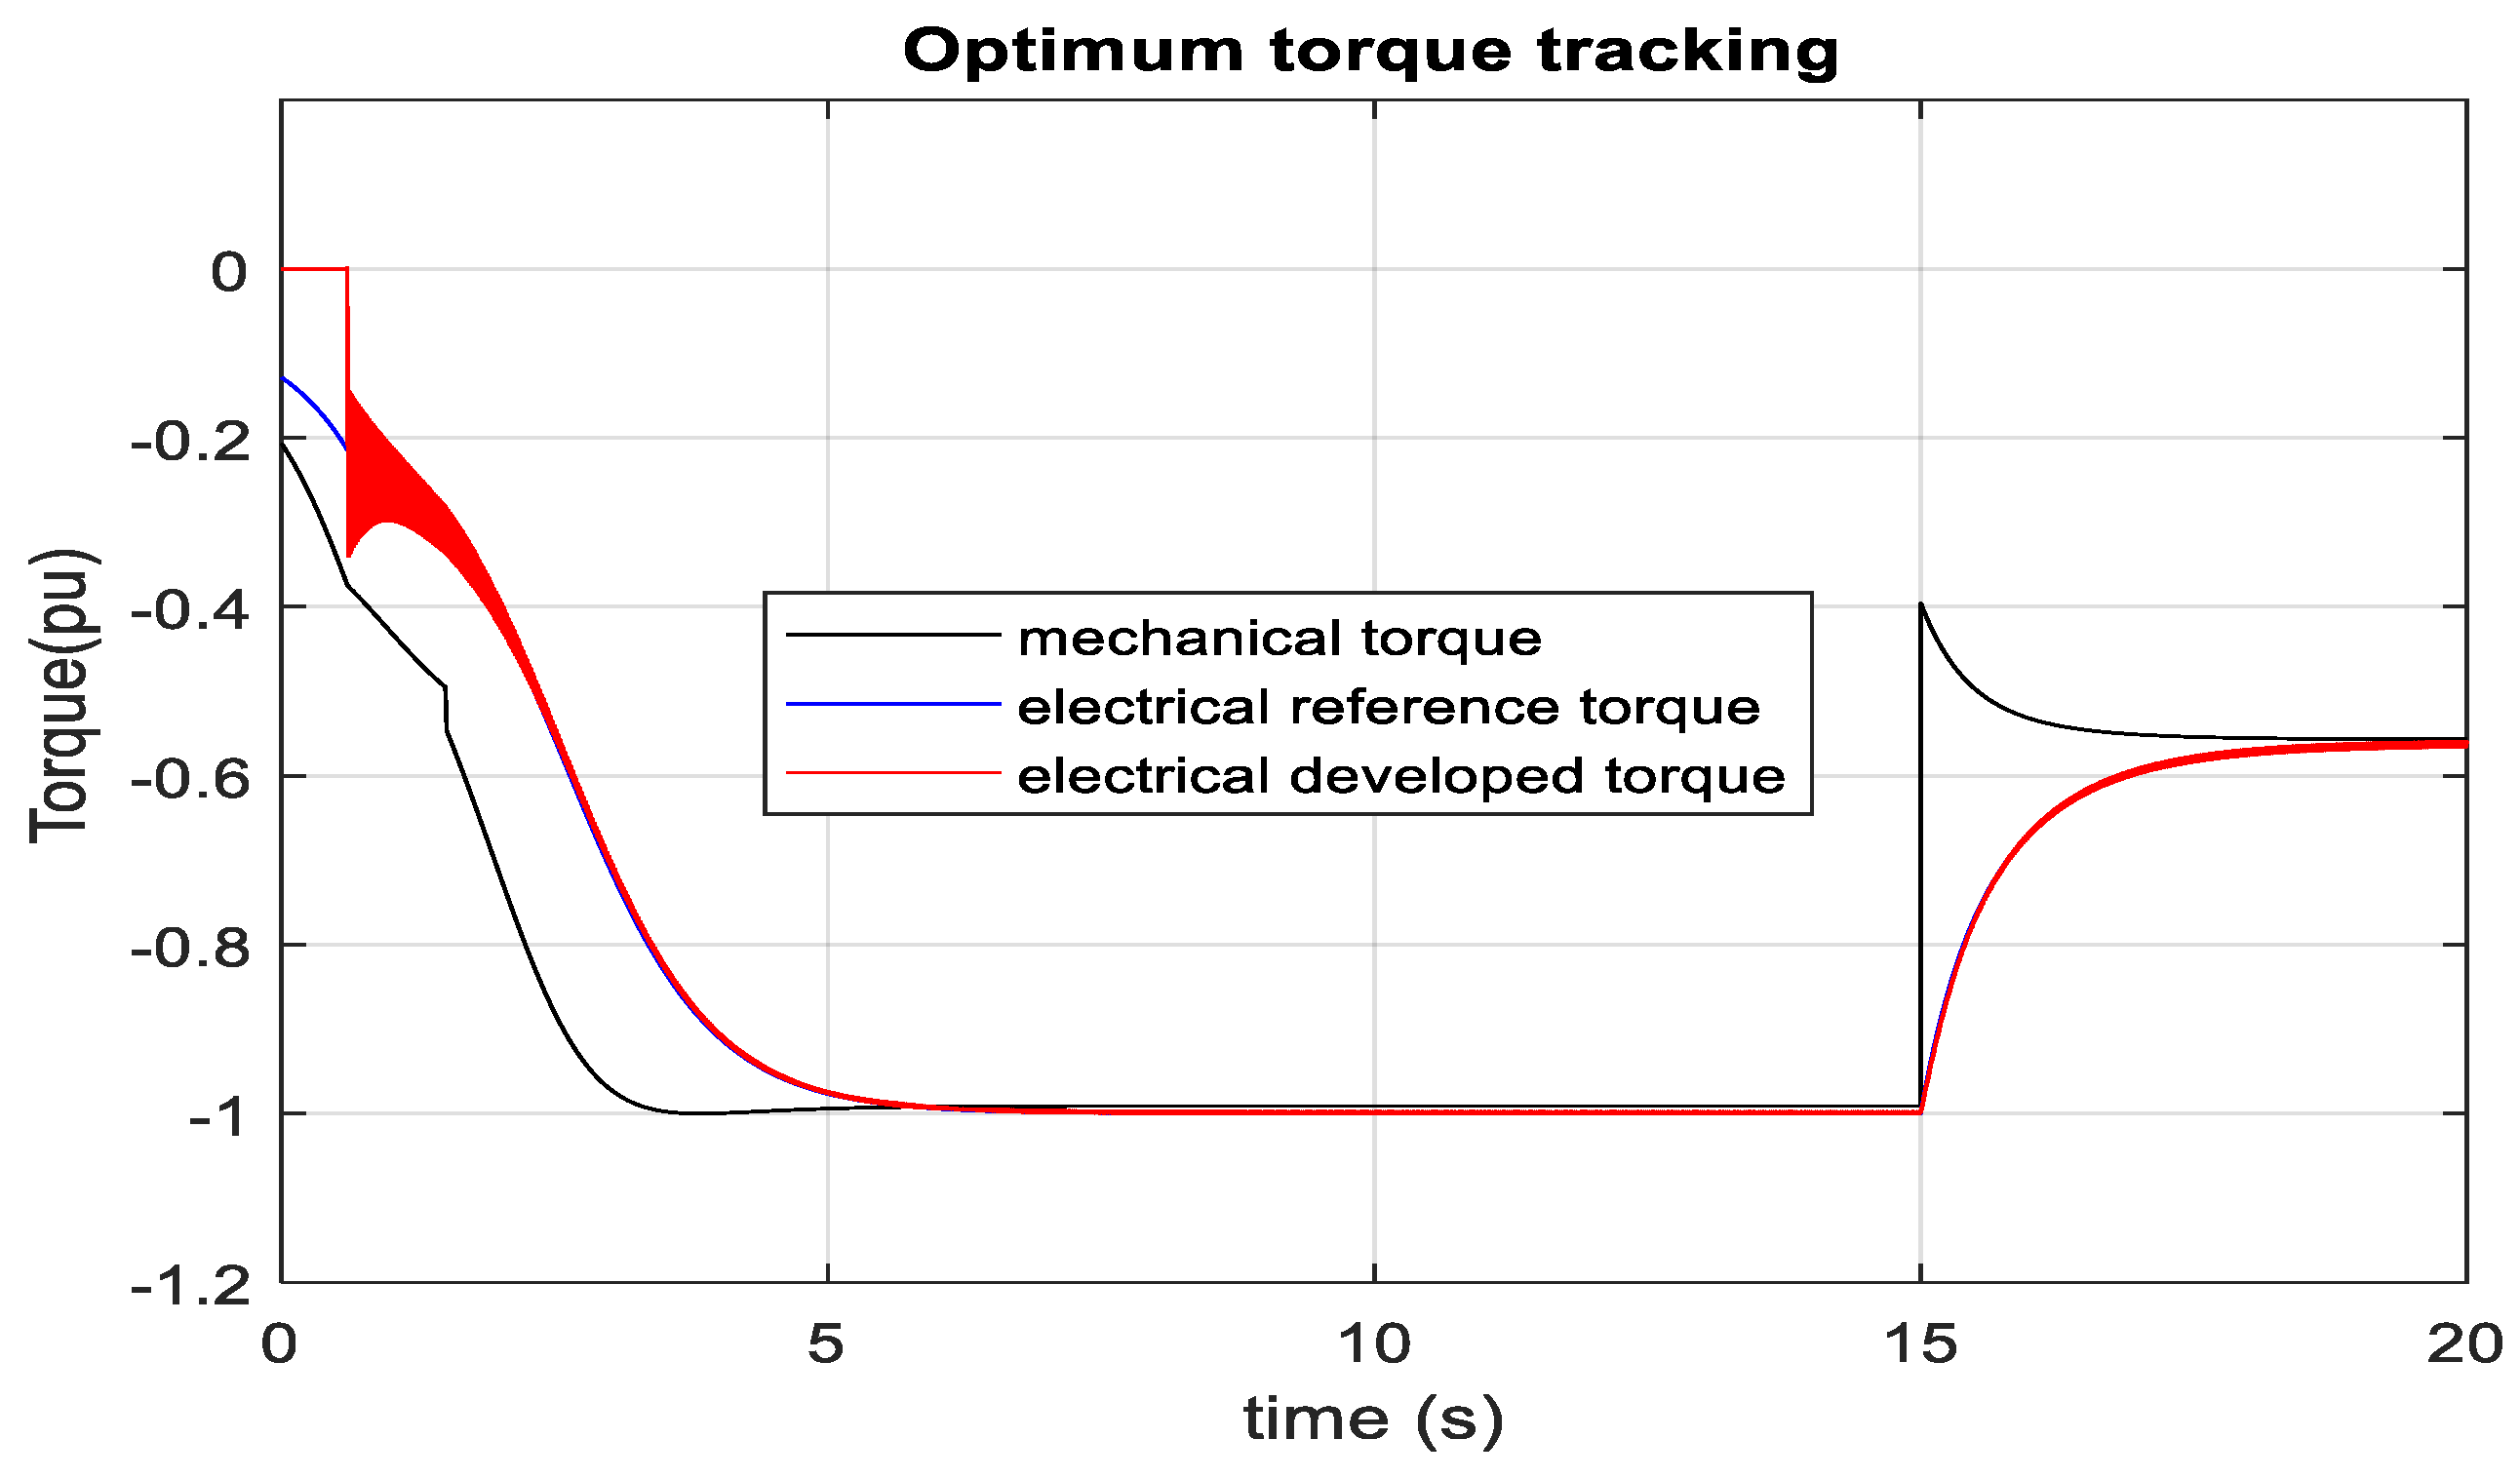
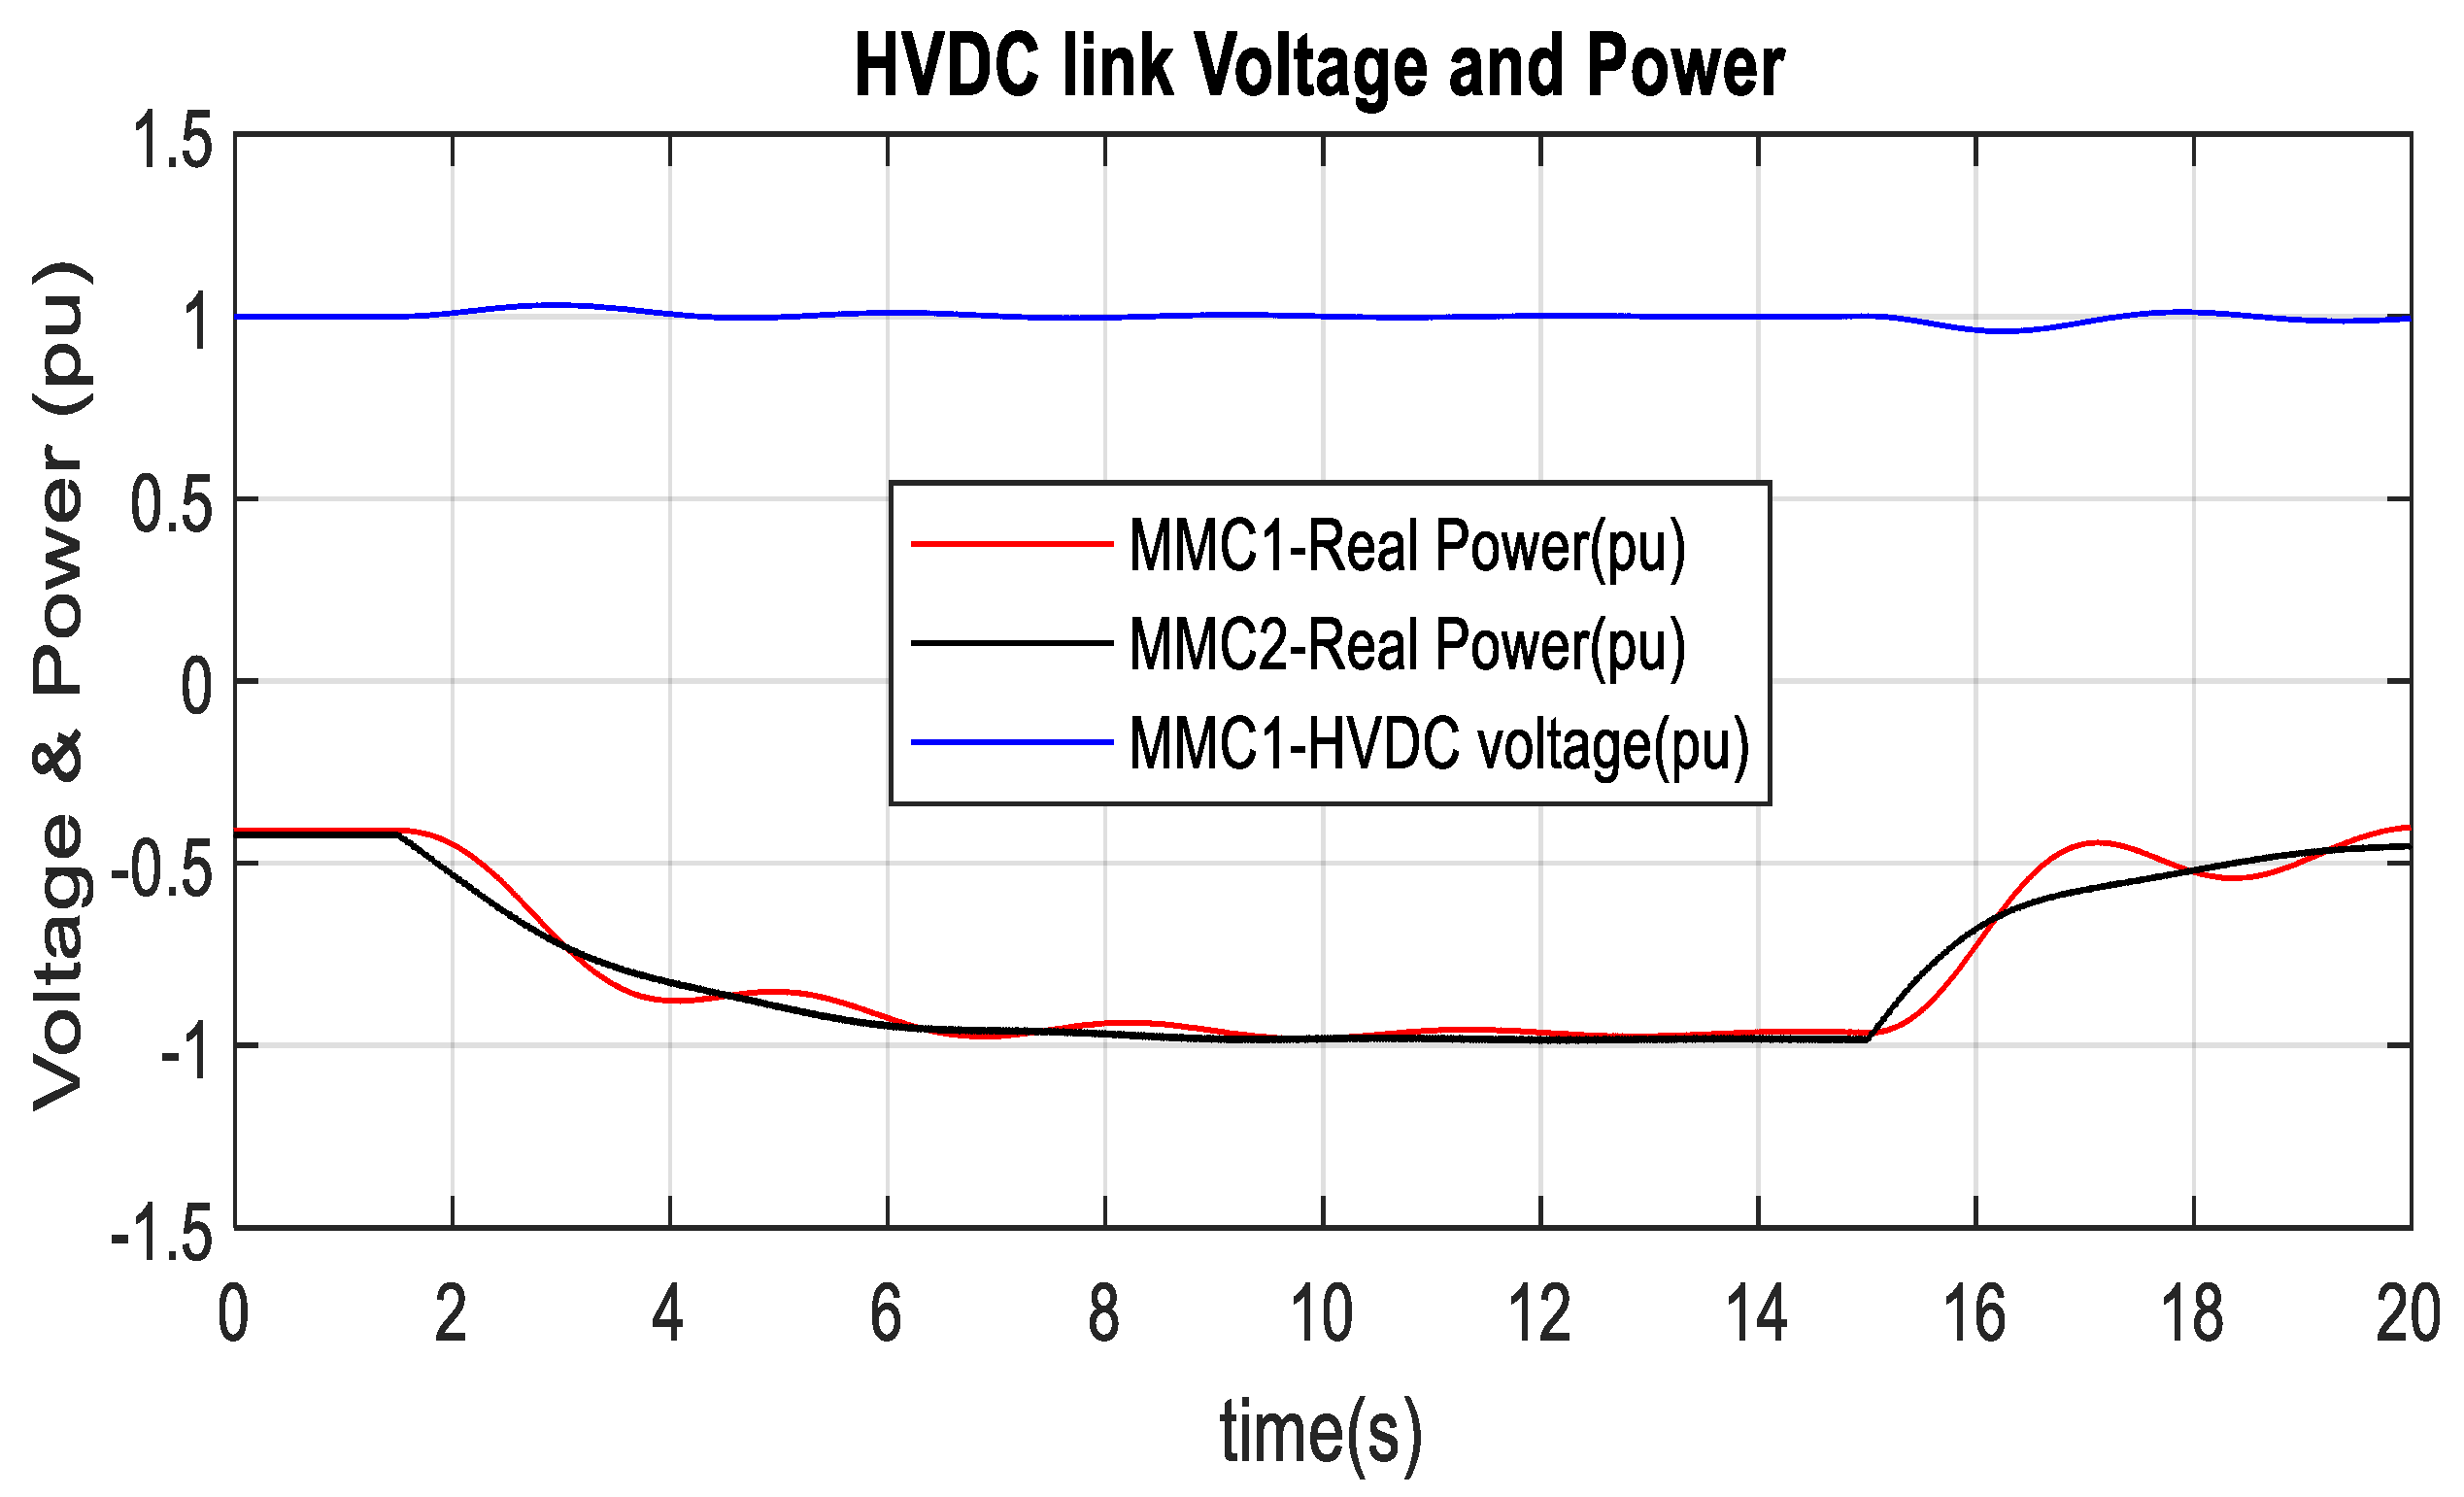
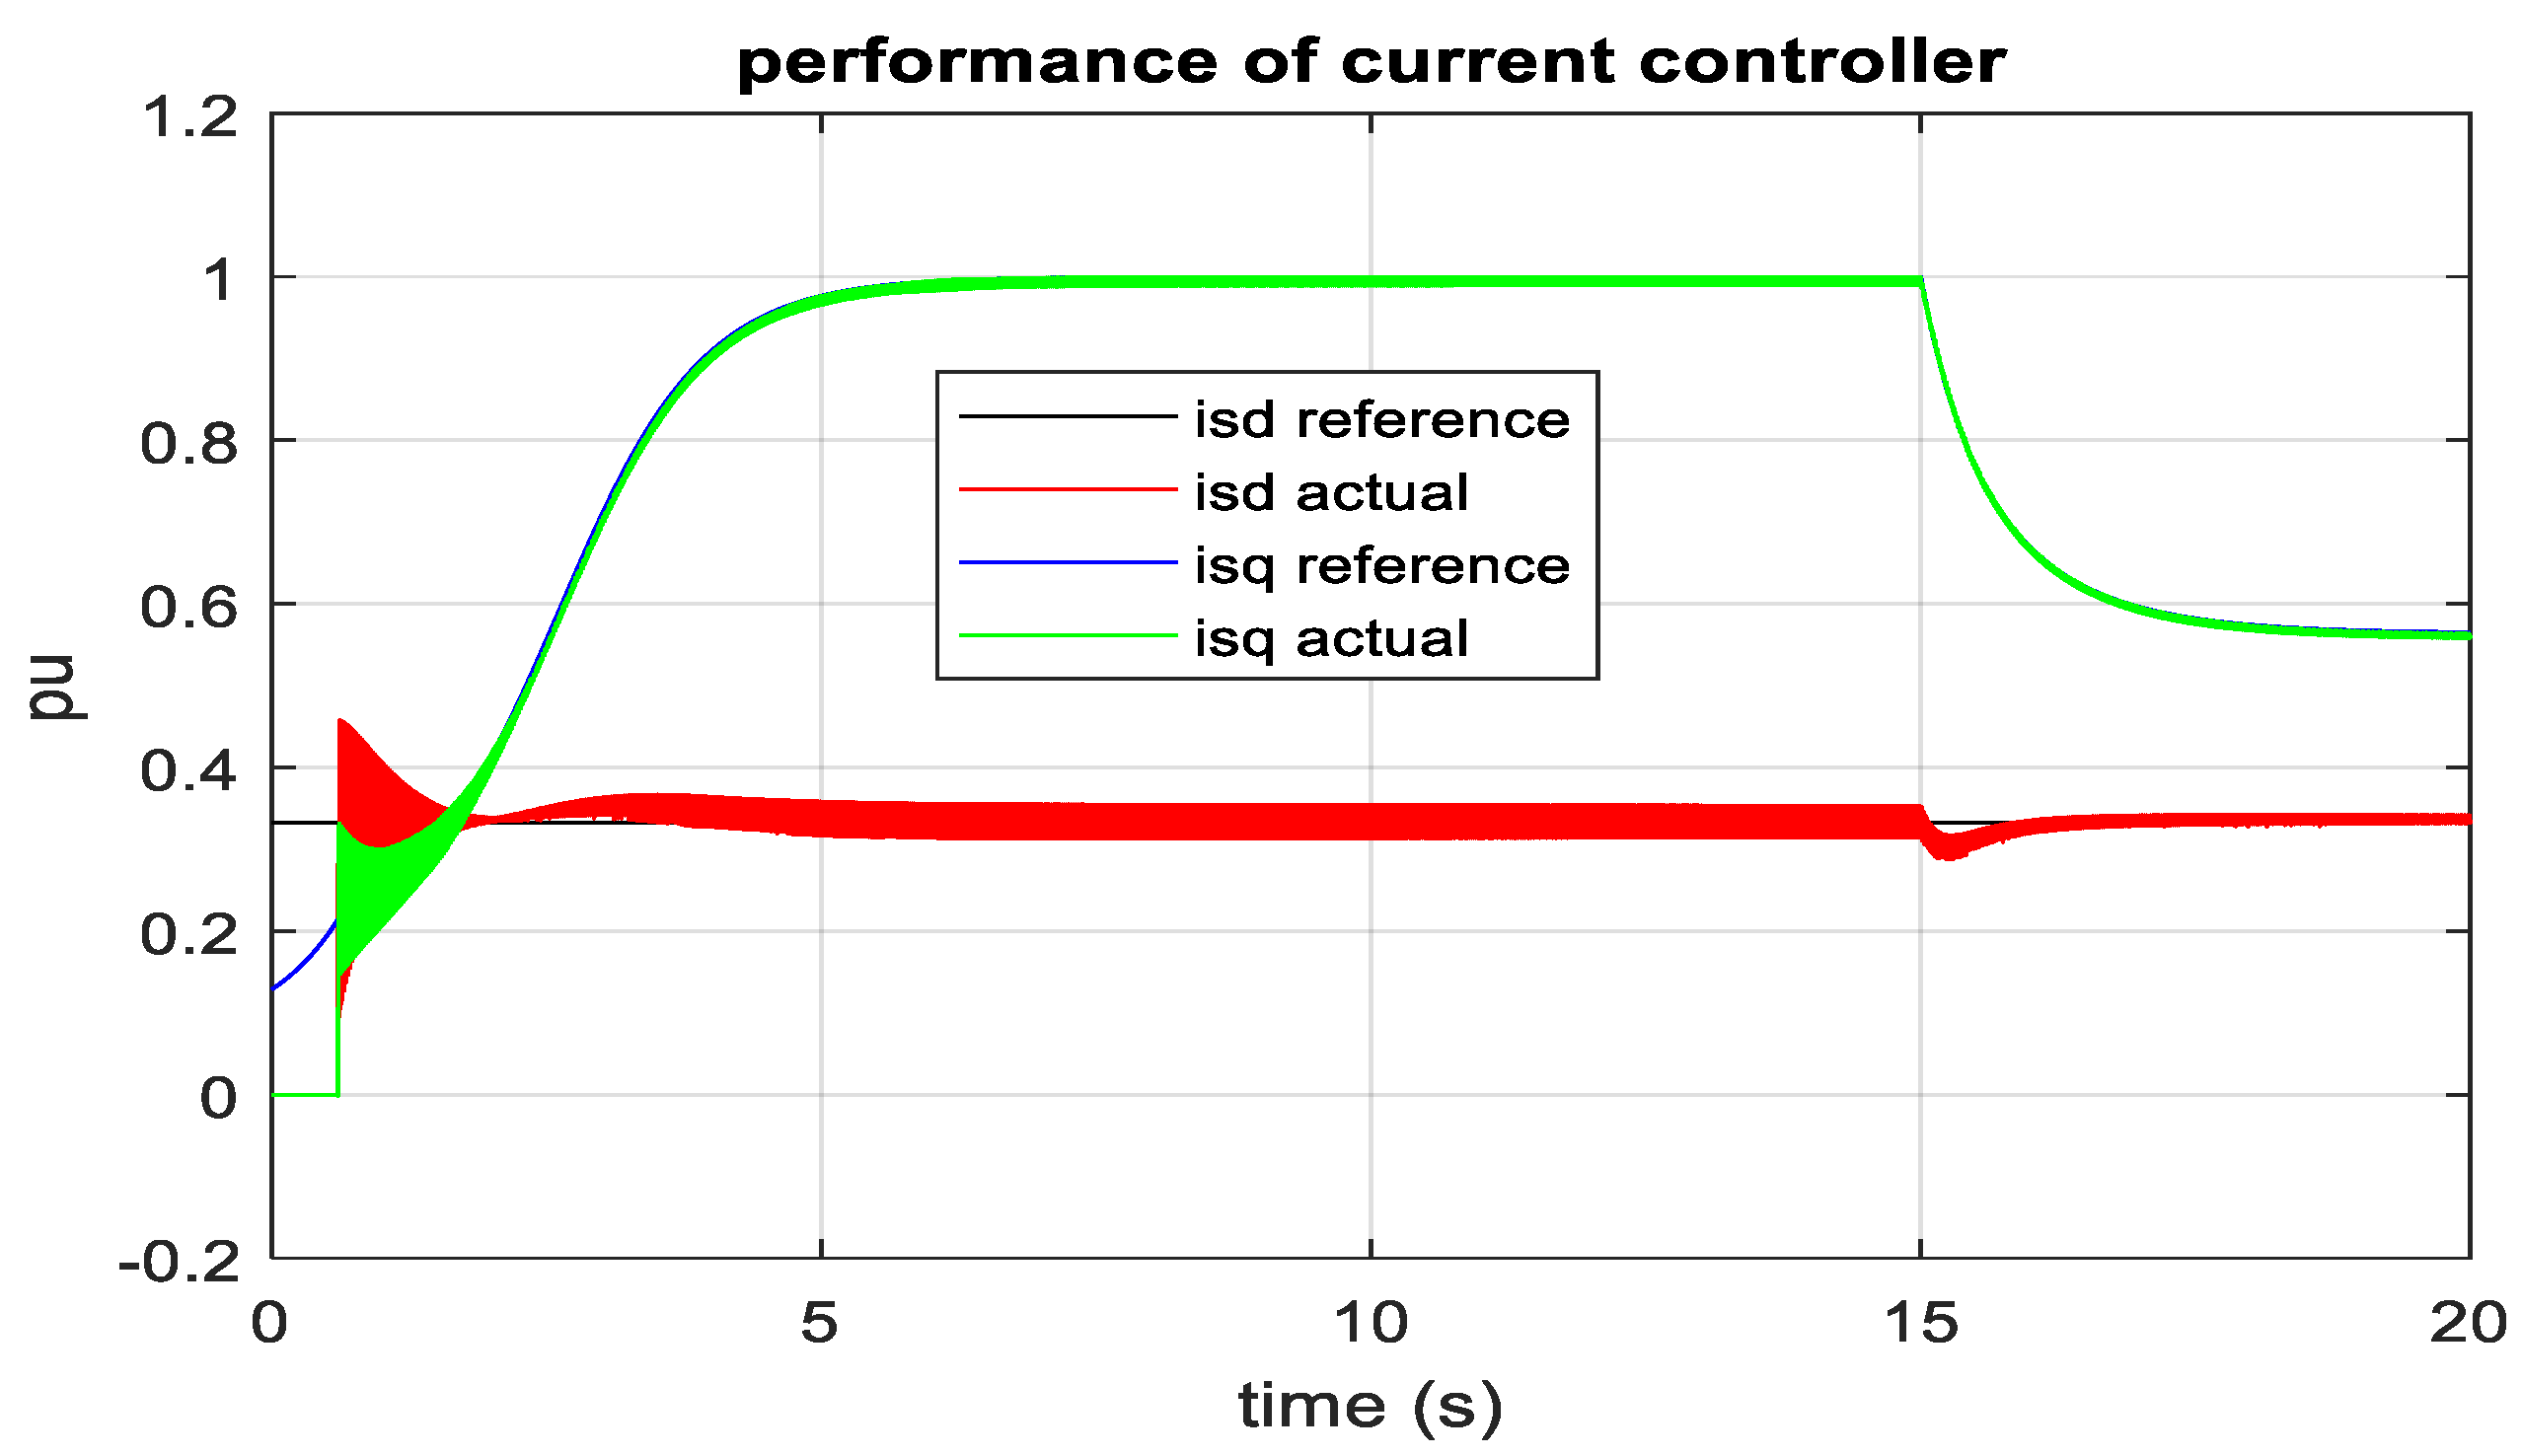
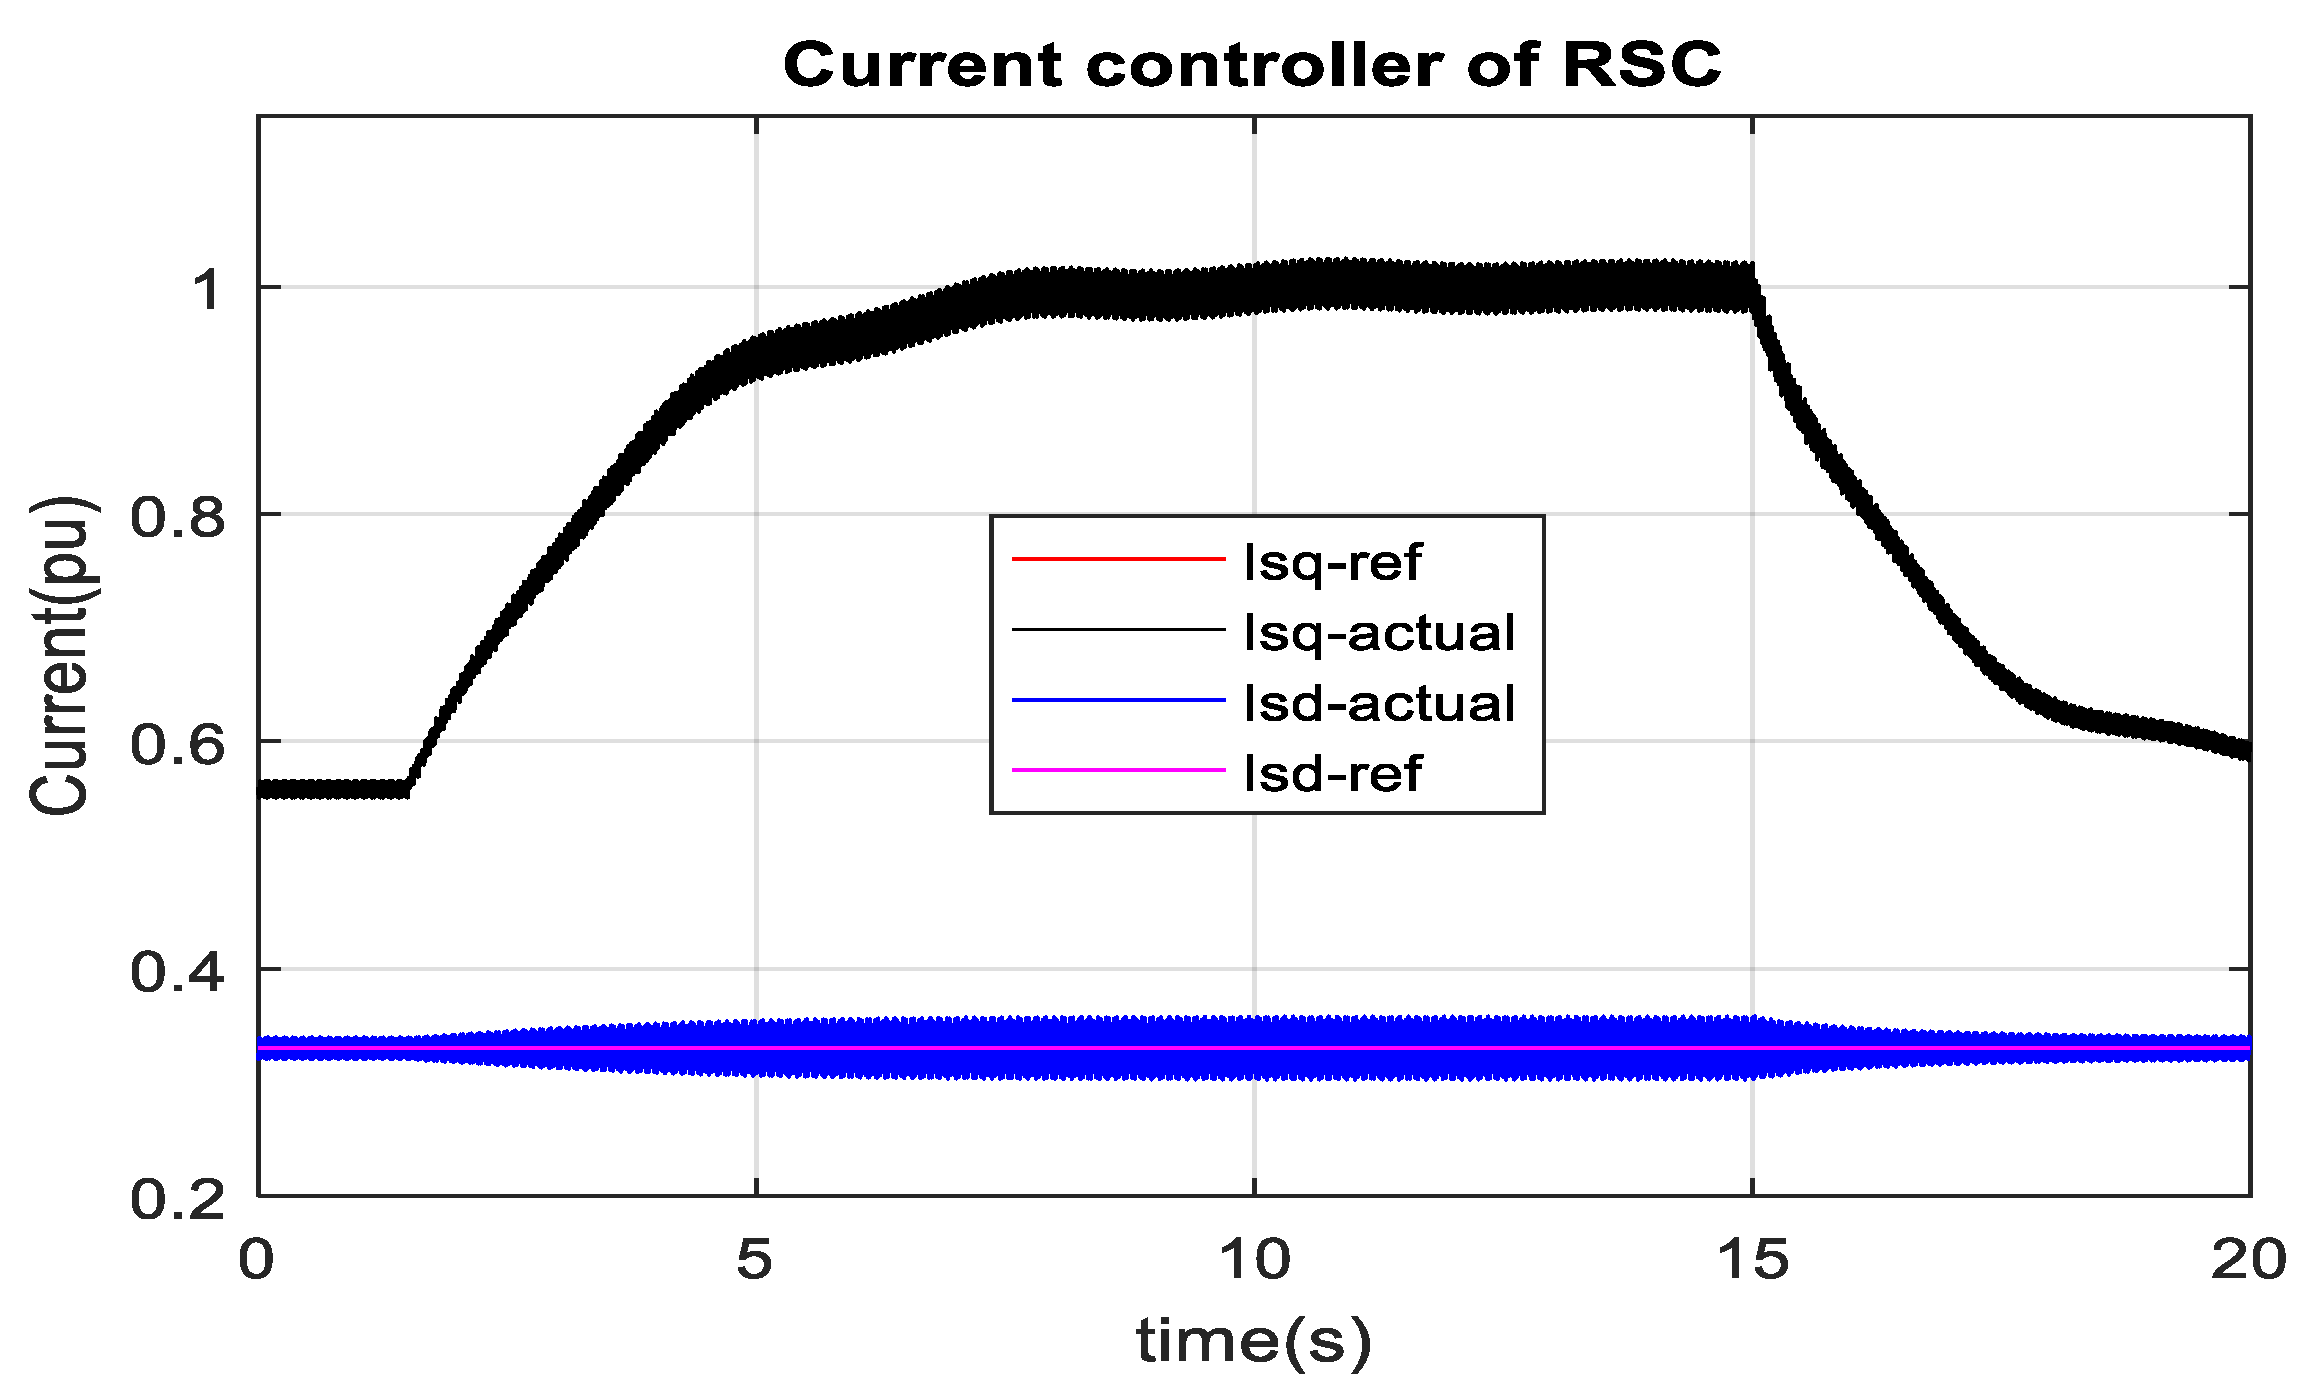
It is found from the characteristics of turbine mechanical power versus the generator rotor speed of DFIG, as depicted in Figure 5, that the optimum wind power for one unit is around 0.8 MW (0.4 pu) at 9 ms−1 wind speed and 2 MW (1 pu) at 12 ms−1 wind speed. Wind speed is changed from 9 ms−1 to 12 ms−1 at 1.8 s, respectively, as depicted in Figure 33. Generator speed is gradually changed to 1.2 pu during such wind speed change. Total real power injection to the PCC terminal by the rotor side and the stator side of DFIG is reached 1 pu. The RSC injects real power into the PCC terminal if the generator speed surpasses 1 pu. However, the RSC receives real power from the PCC terminal if the generator speed is below 1 pu. In all cases of generator speed, the stator terminal delivers power to the PCC terminal. Similarly, the total DFIG real power is gradually reduced from 1 pu to 0.4 pu, and the generator speed slowly decreases from 1.2 pu to 0.9 pu during the wind speed change from 12 ms−1 to 9 ms−1. It is observed from Figure 34 that the actual torque tracks the reference torque, which the optimum point has set at different wind speeds. The set point of reference torque is not made abrupt due to the high inertia of the generator rotor and gearbox. It is inferred from Figure 33 and Figure 34 that the generator speed changes as long as there is a difference between the electrical and mechanical torque. In summary, the controller’s performance agrees with the wind turbine’s optimum characteristics, as illustrated in Figure 5. RTDS-dSPACE is used to validate the controller in real time. RTDS rack-1 and dSPACE are used for MMC1, and RTDS rack-2 has used for MMC2 and DFIG-based wind farms. A wind farm of 100 MW is developed by scaling one complete unit of 2 MW DFIG. Individual DFIG controller performance in RTDS-dSPACE, as illustrated in Figure 35, also agrees with the result in MATLAB/SIMULINK. Figure 36 confirms the peak wind energy tracking in RTDS-dSPACE as 50 units of 2 MW wind generator injects around 0.4 pu (40 MW = 50 × 0.8 MW) real power to 1 pu (100 MW = 50 × 2 MW) real power into MMC2 over the wind speed variation from 9 ms−1 to 12 ms−1. It is also observed from Figure 35 that the wind generator speed reaches around 1.2 pu at 12 ms−1 wind speed and 0.9 pu at 9 ms−1 wind speed, which is expected during optimum wind energy tracking. Abrupt power injection into the HVDC link caused by the sudden wind speed change has resulted in a minor overshoot in the HVDC link voltage, as illustrated in Figure 36. However, zero steady-state error is observed in the HVDC link voltage during the fixed wind speed. The actual real and reactive current of the machine side converter follows the reference current, which is depicted in Figure 37 and Figure 38. Real current changes with the reference torque; however, the reactive current remains almost constant at any predefined selection of leading, lagging, and unity power factor operation of DFIG.

3.4. SCIG-Based Optimum Wind Energy Integration

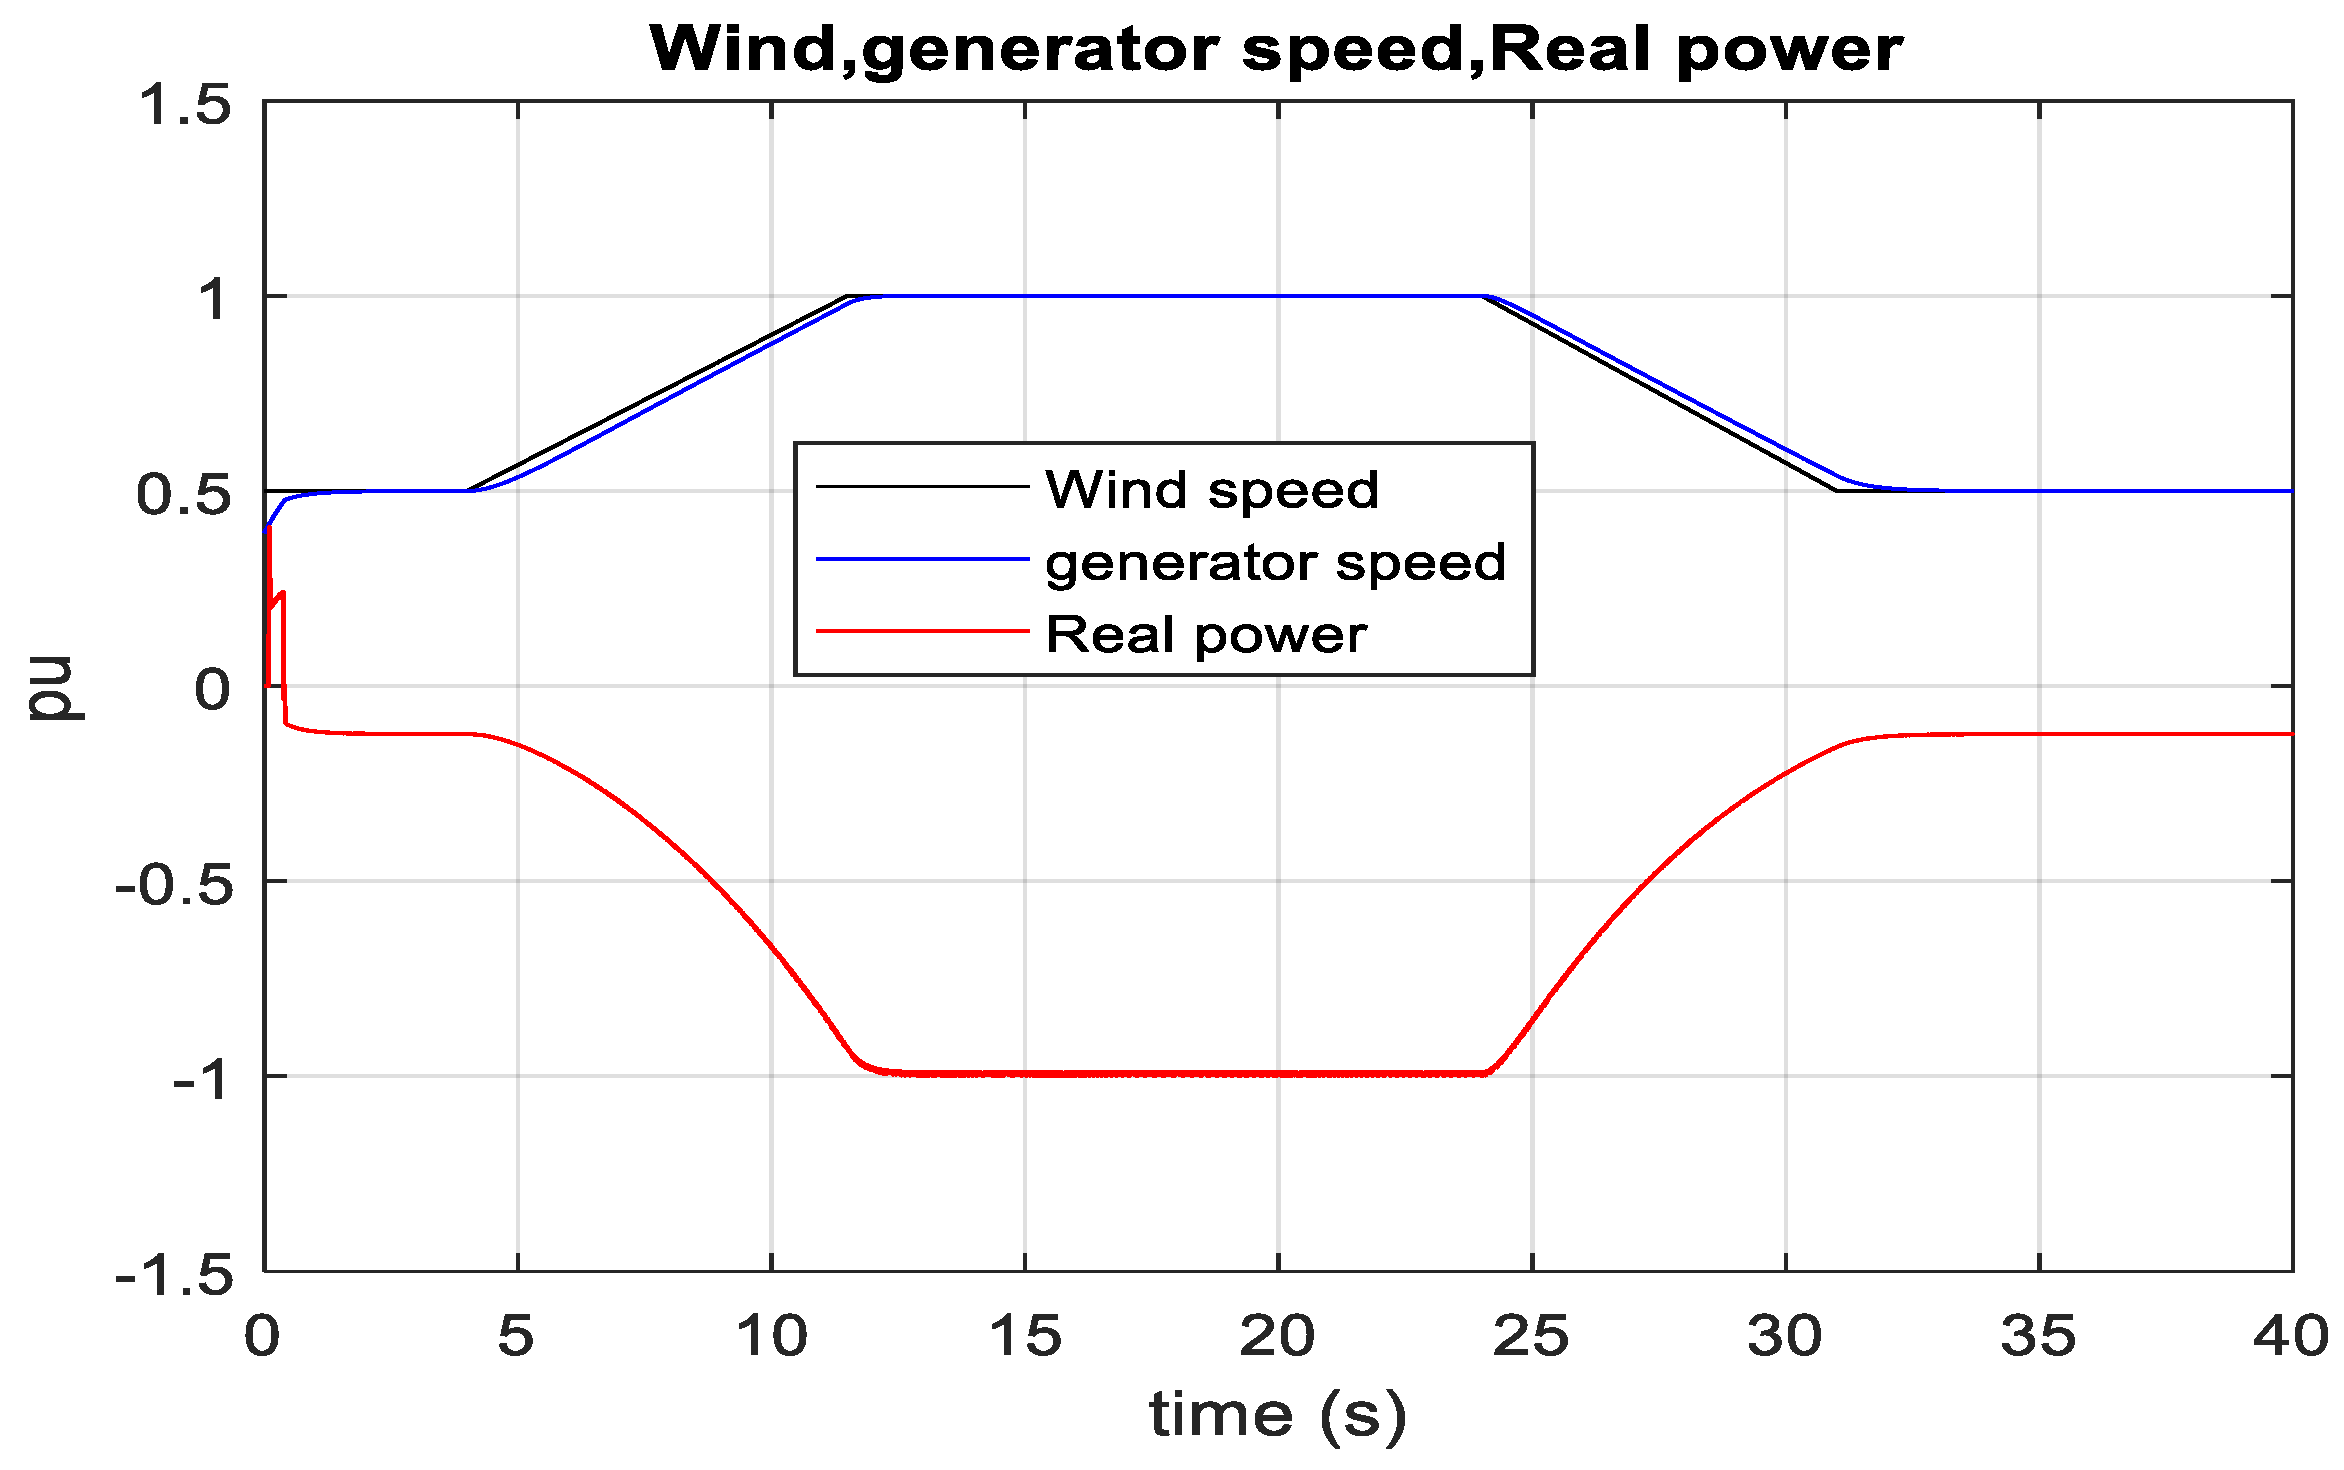
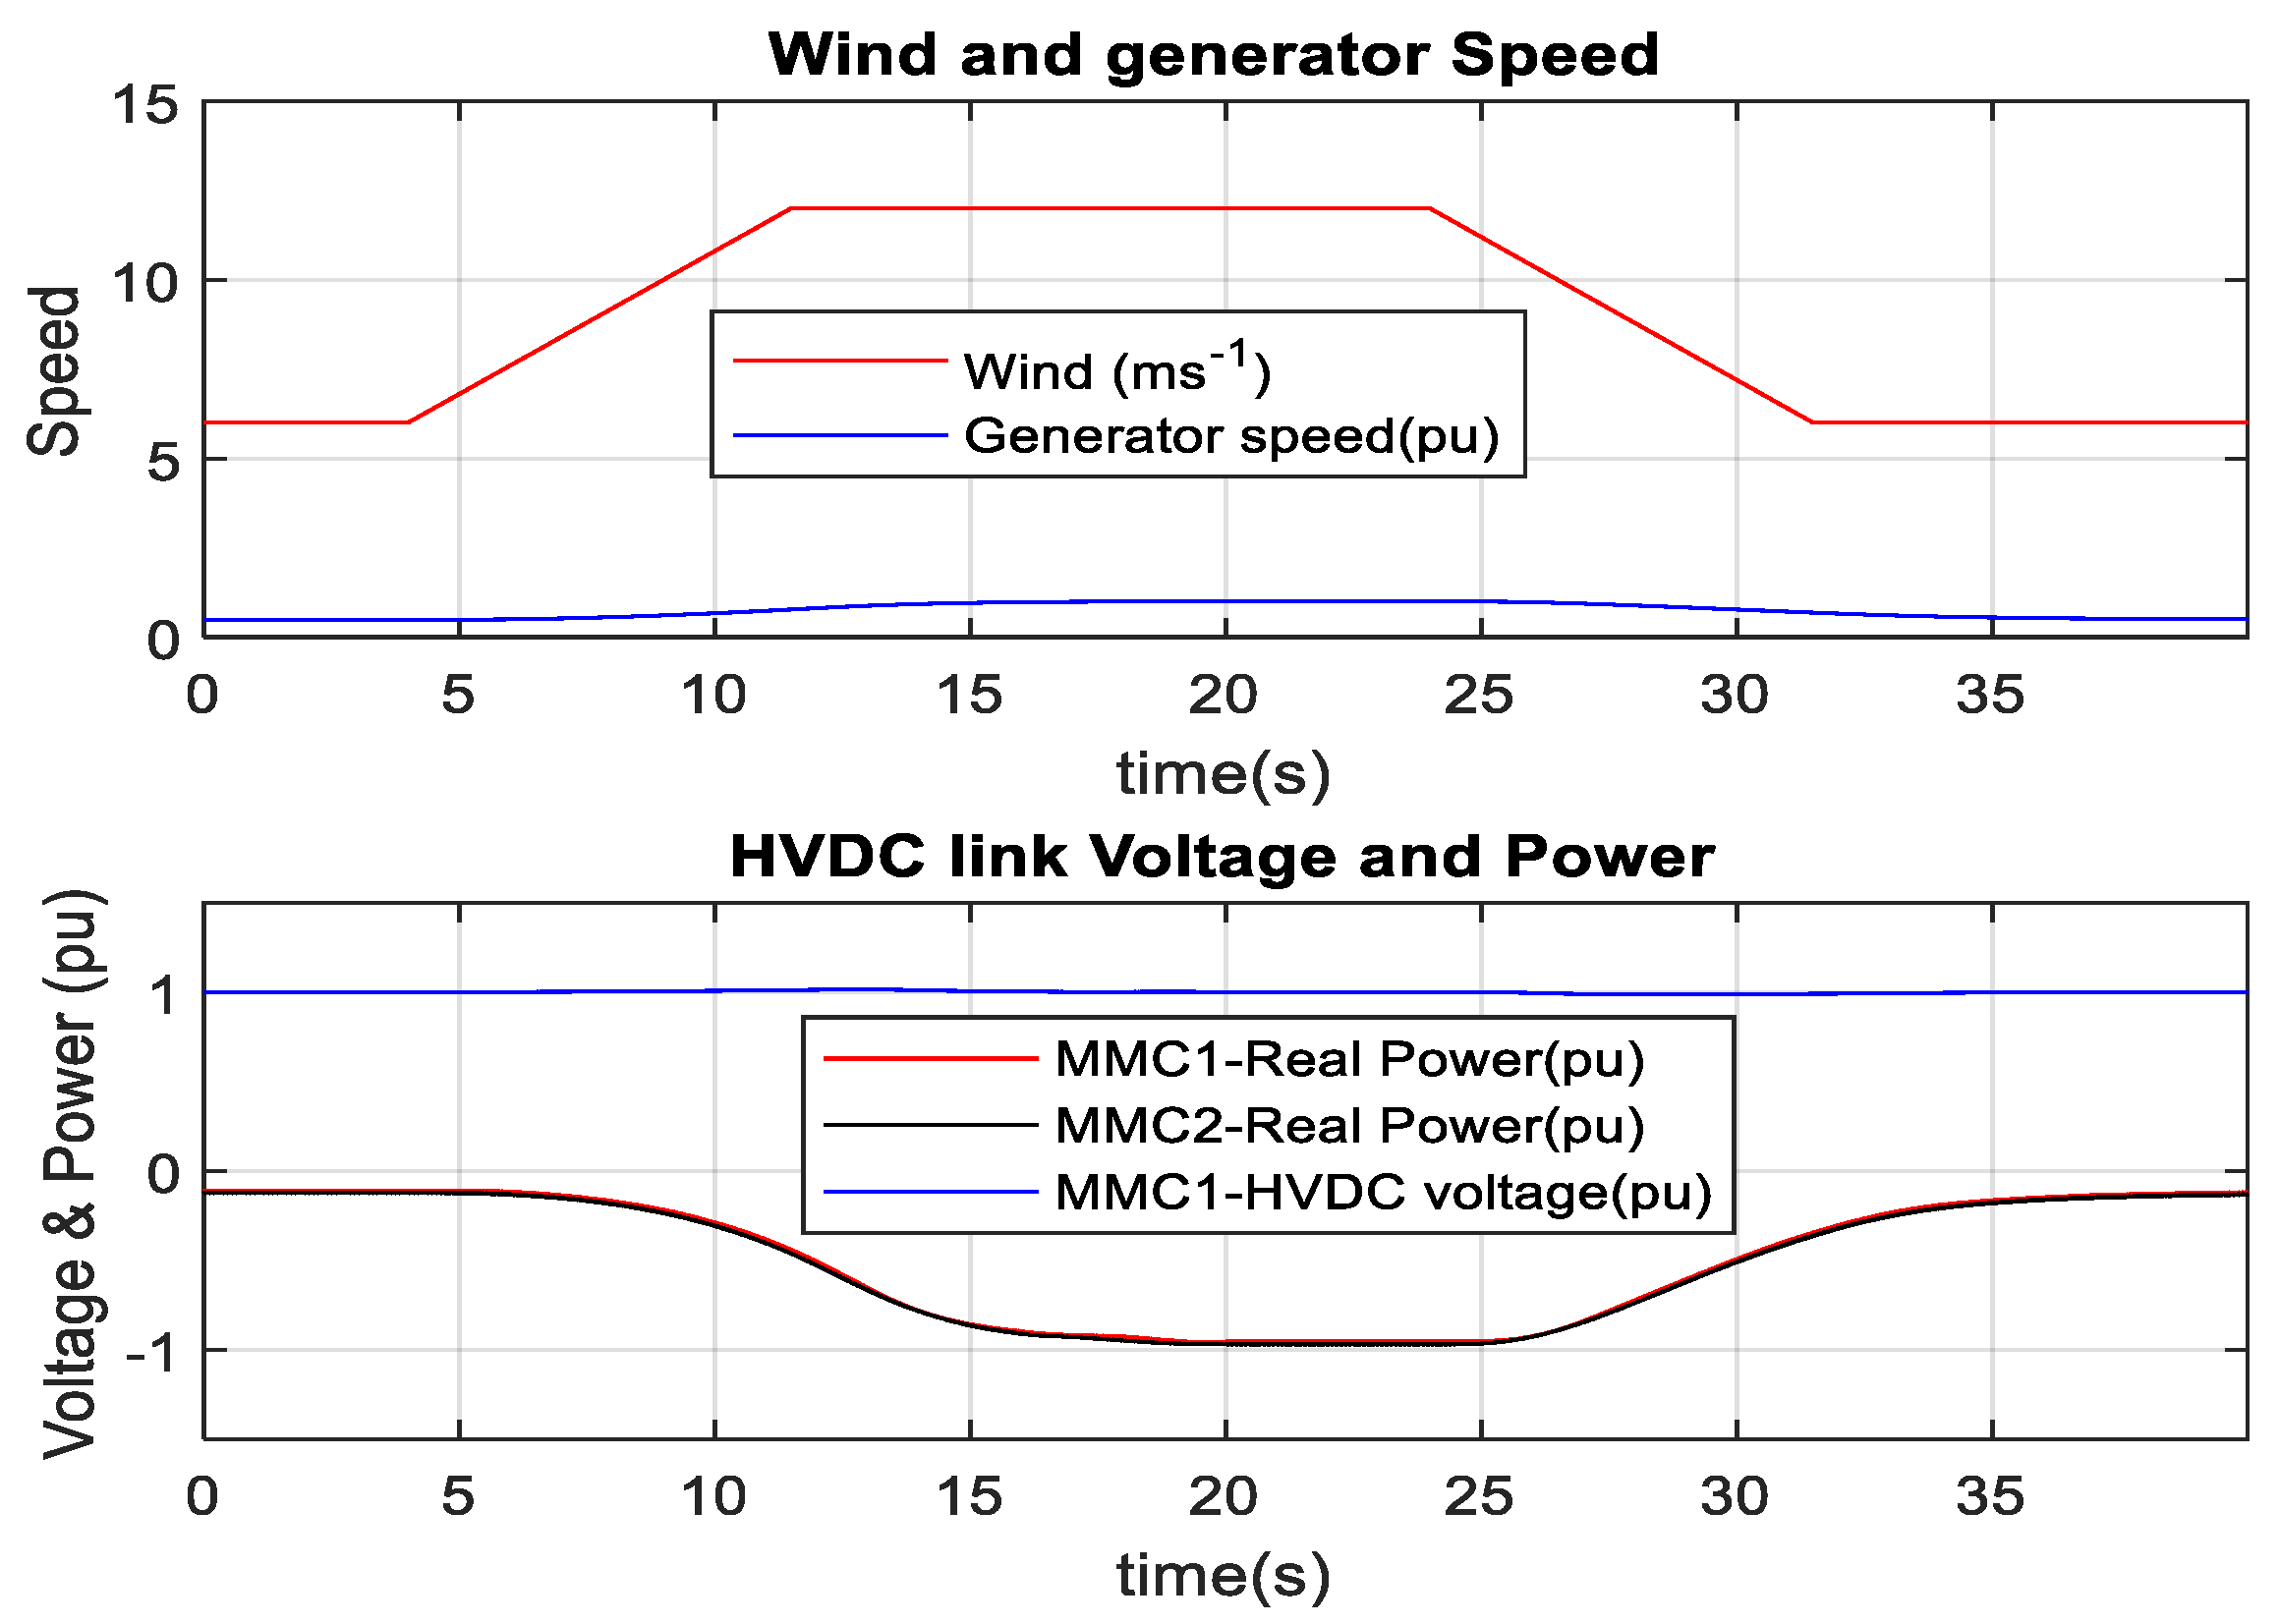
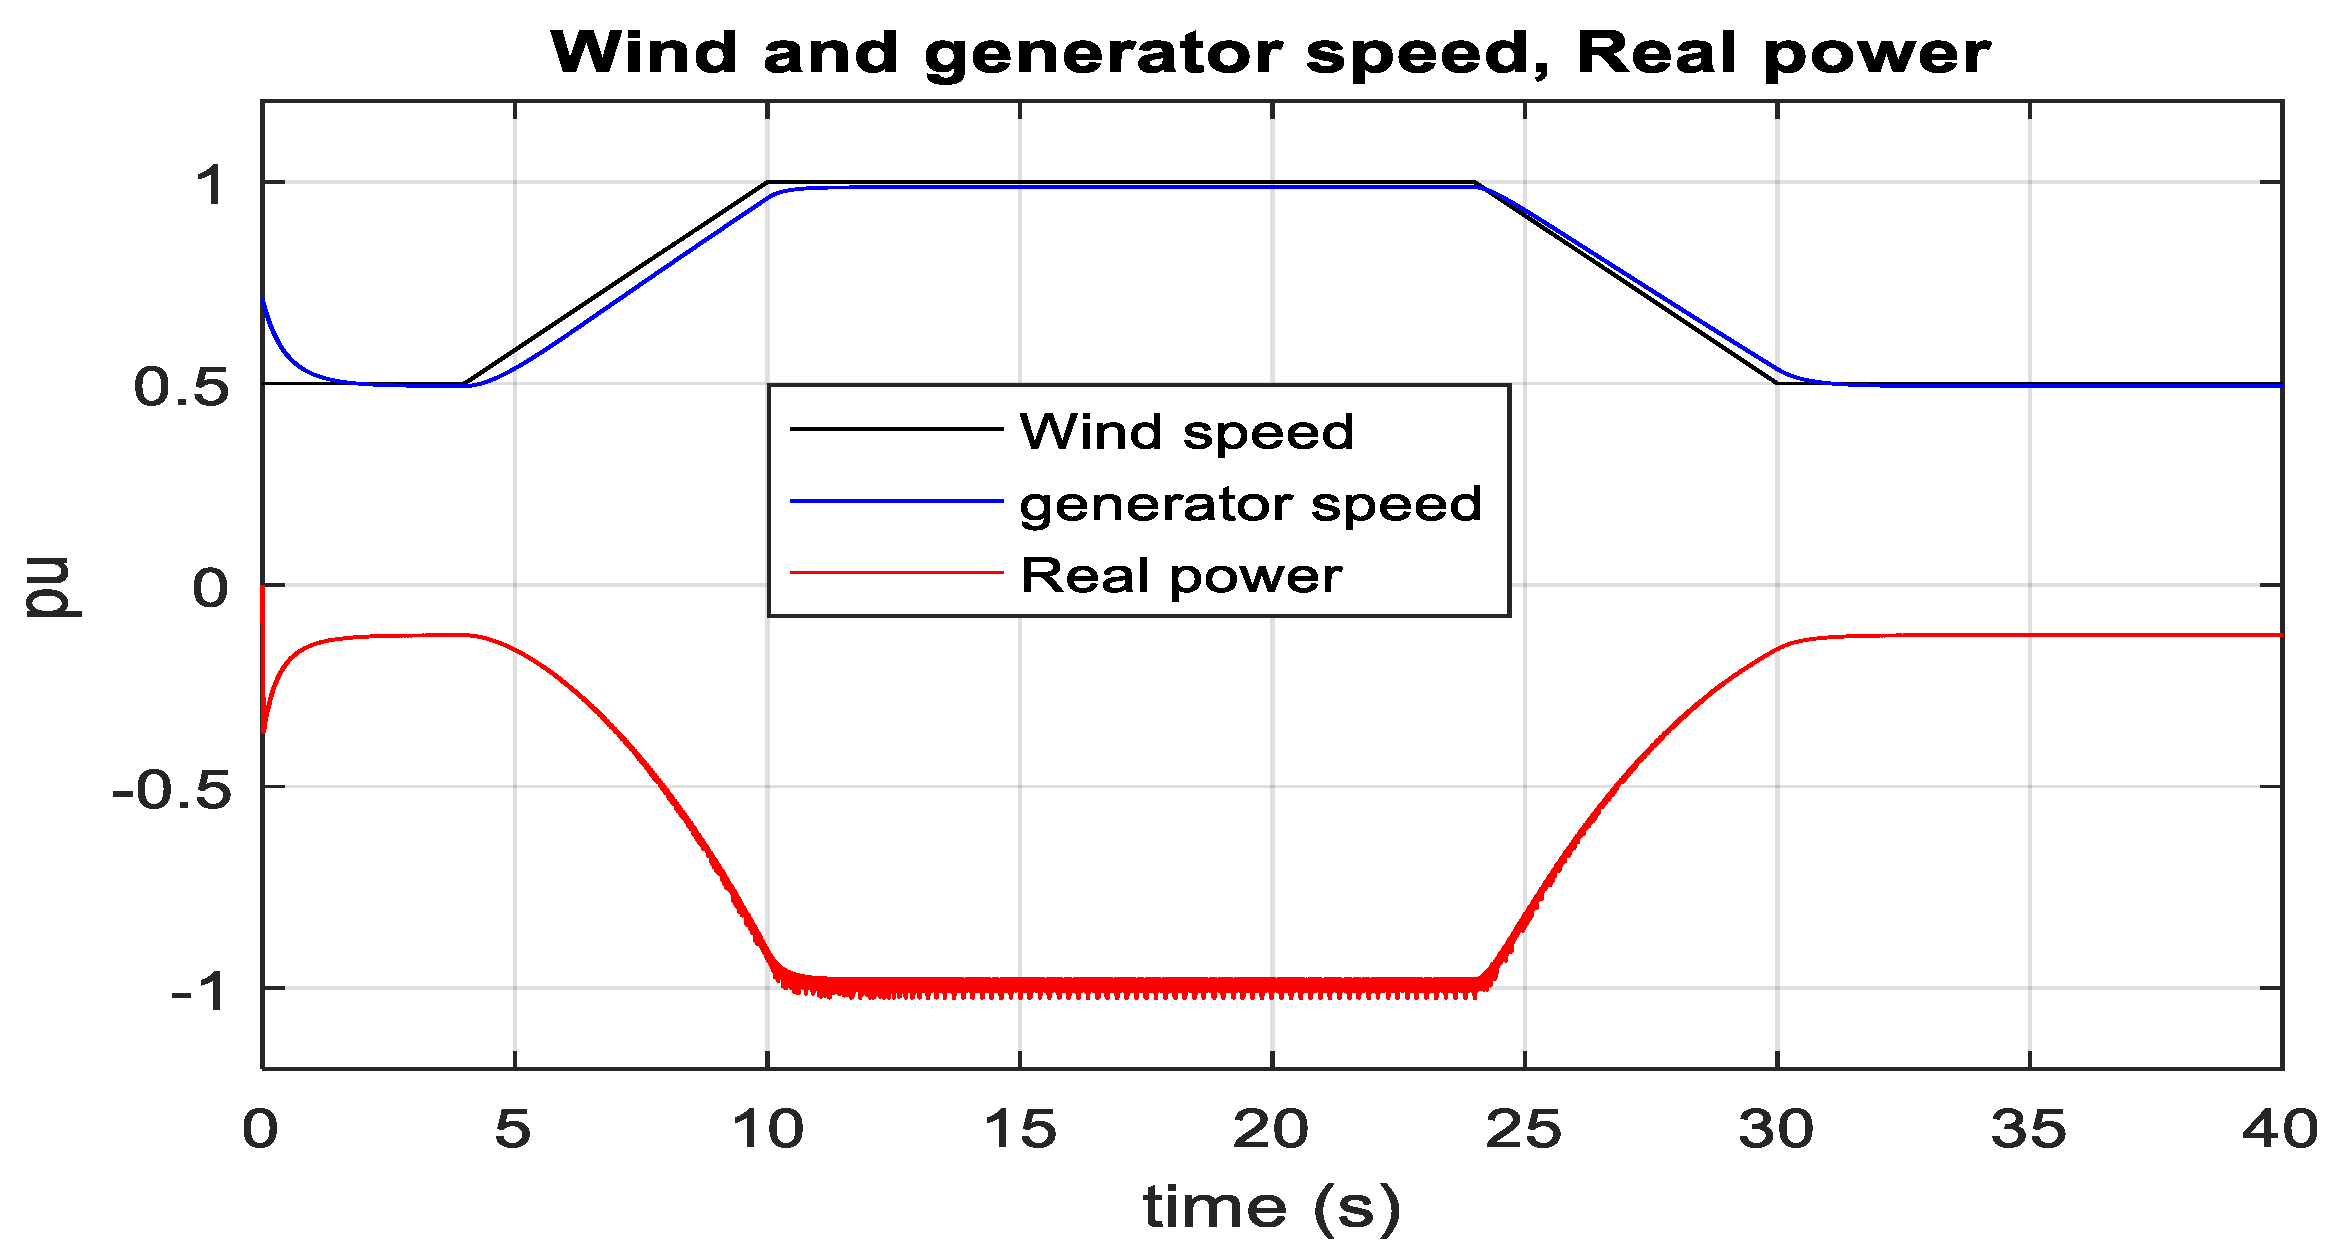
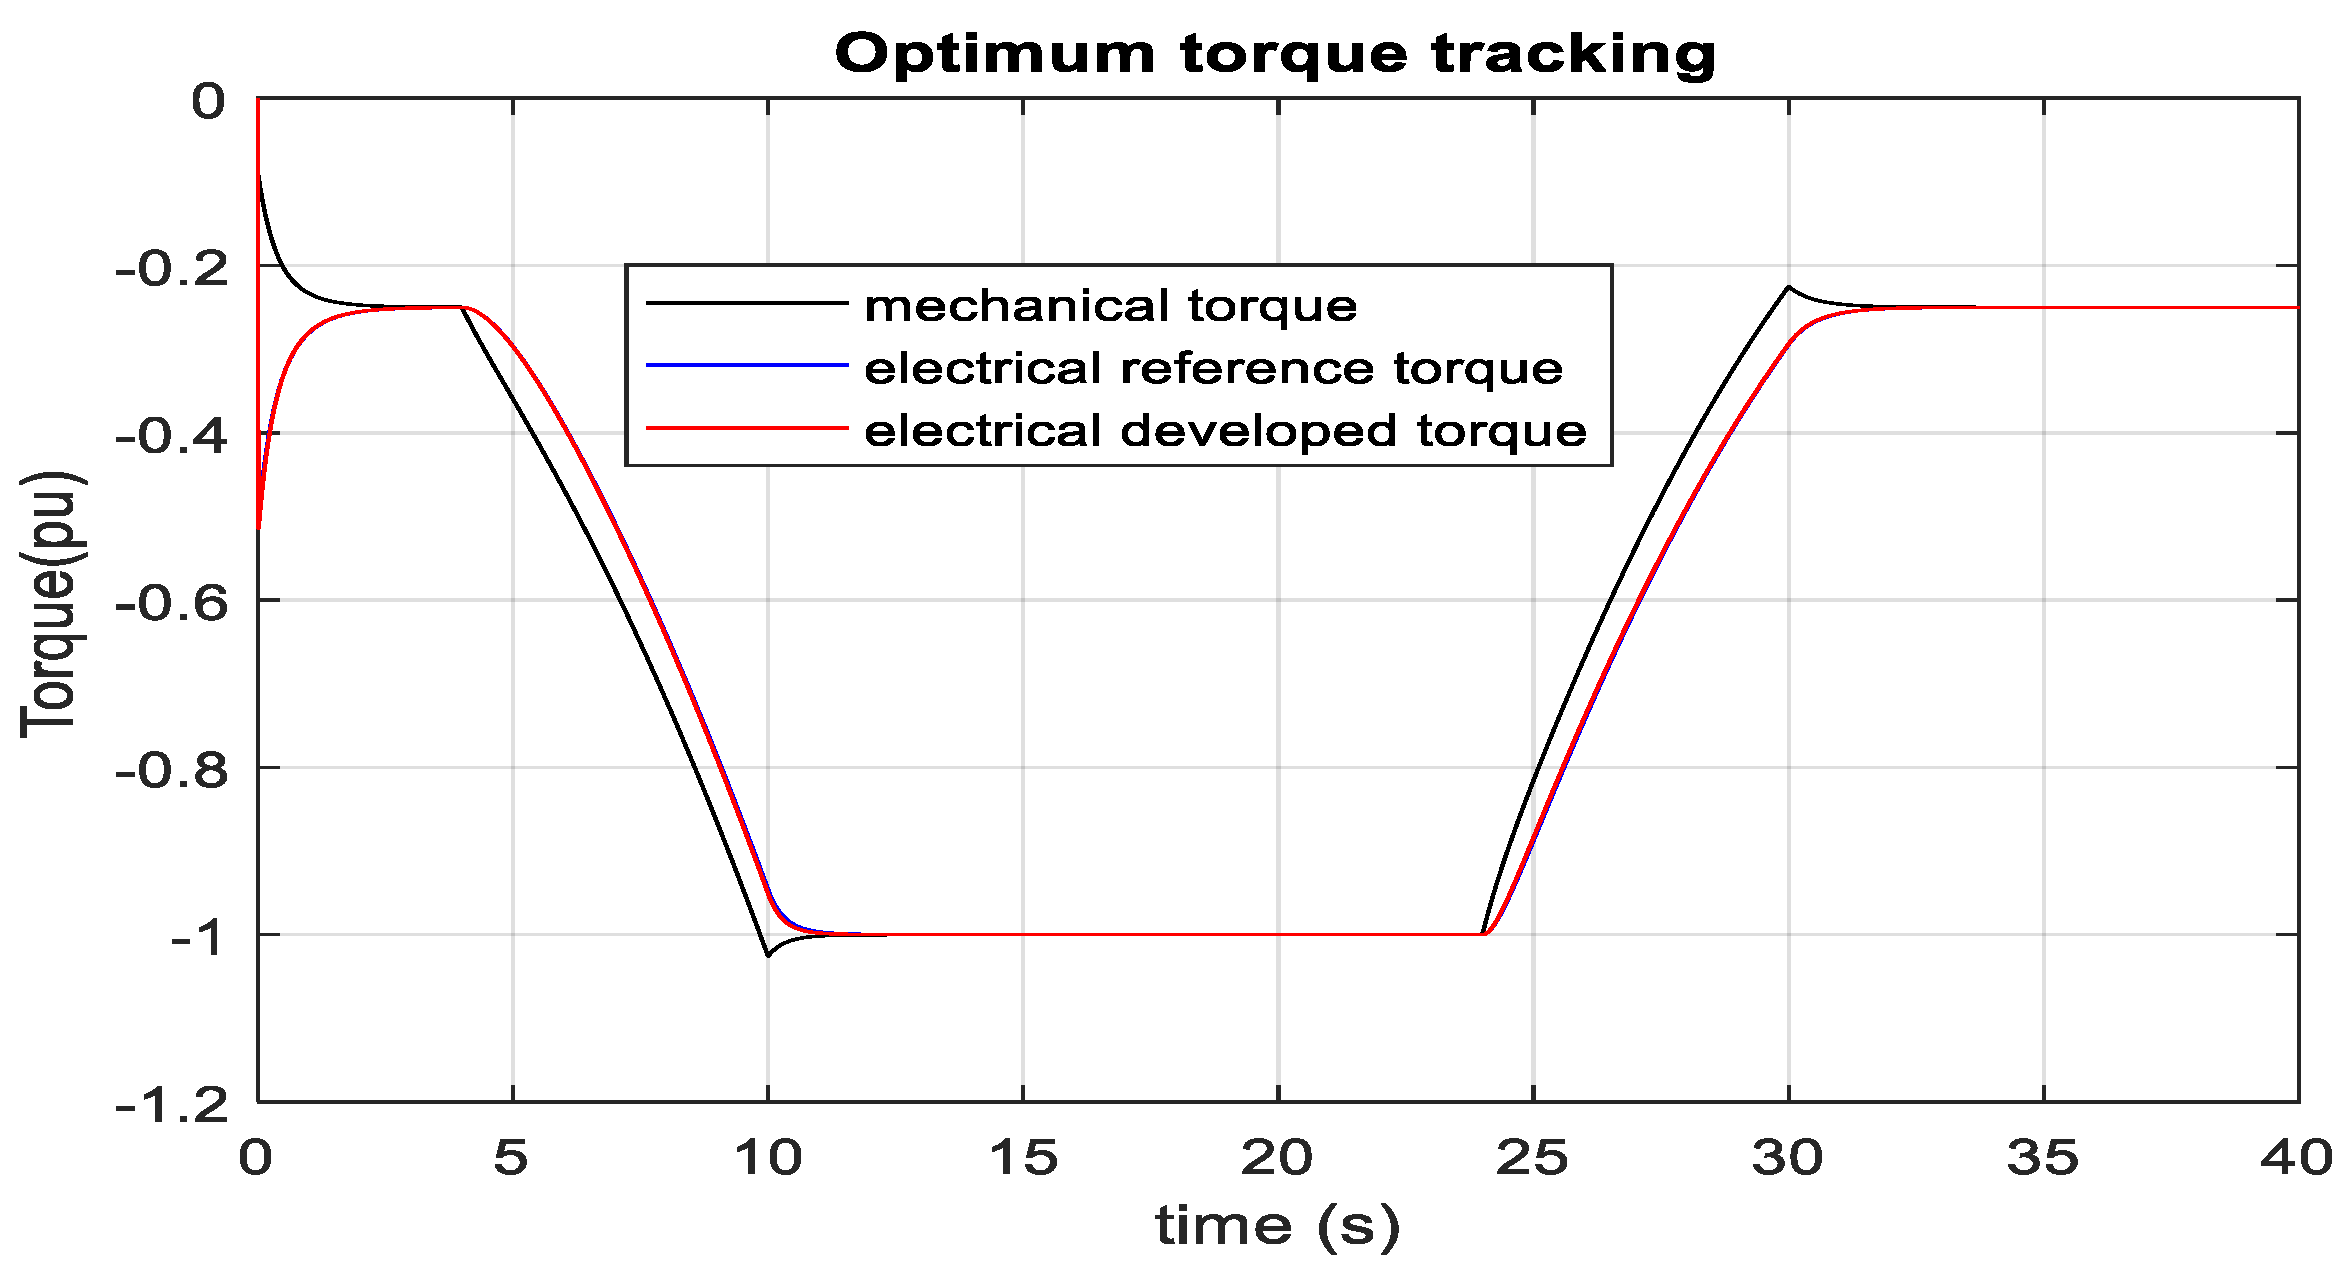
Turbine mechanical power versus SCIG rotor speed characteristics has almost similar wave shape with DFIG as illustrated in Figure 5. However, the maximum mechanical power 1 pu (2 MW) occurs at 1 pu (12 ms−1) wind speed and 1 pu generator rotor speed. Additionally, it is found from the turbine characteristics curve that the optimum mechanical power is 0.1 pu (0.2 MW) at 6 ms−1 wind speed and 0.5 pu generator rotor speed. Figure 39 shows the variation of extracted wind power due to wind speed change in MATLAB/SIMULINK. It delivers around 1 pu (2 MW) real power to the PCC terminal at 1 pu (12 ms−1) wind speed. During this time, the generator speed reaches 1 pu, which validates peak wind energy tracking. It extracts the optimum power by changing its reference electrical torque at the optimum value, as shown in Figure 40. However, setting the reference torque is gradually made because of the generator rotor inertia and gearbox. The actual torque tracks the reference electrical torque. The turbine mechanical torque changes with the generator speed, which finally meets with the reference electrical torque. As the electrical and mechanical torque get closer to each other, the shift in generator speed becomes narrower and is eventually zero. RTDS-dSPACE is used to validate the controller in real time. Rack-1 and dSPACE are used for MMC1, and Rack-2 is used for MMC2 and SCIG-based wind farms. 100 MW wind farm is developed by scaling one complete unit of 2 MW SCIG with its optimal controller. Fifty units of SCIG have injected wind energy into the MMC2 terminal during wind speed variation from 6 ms−1 to 12 ms−1.
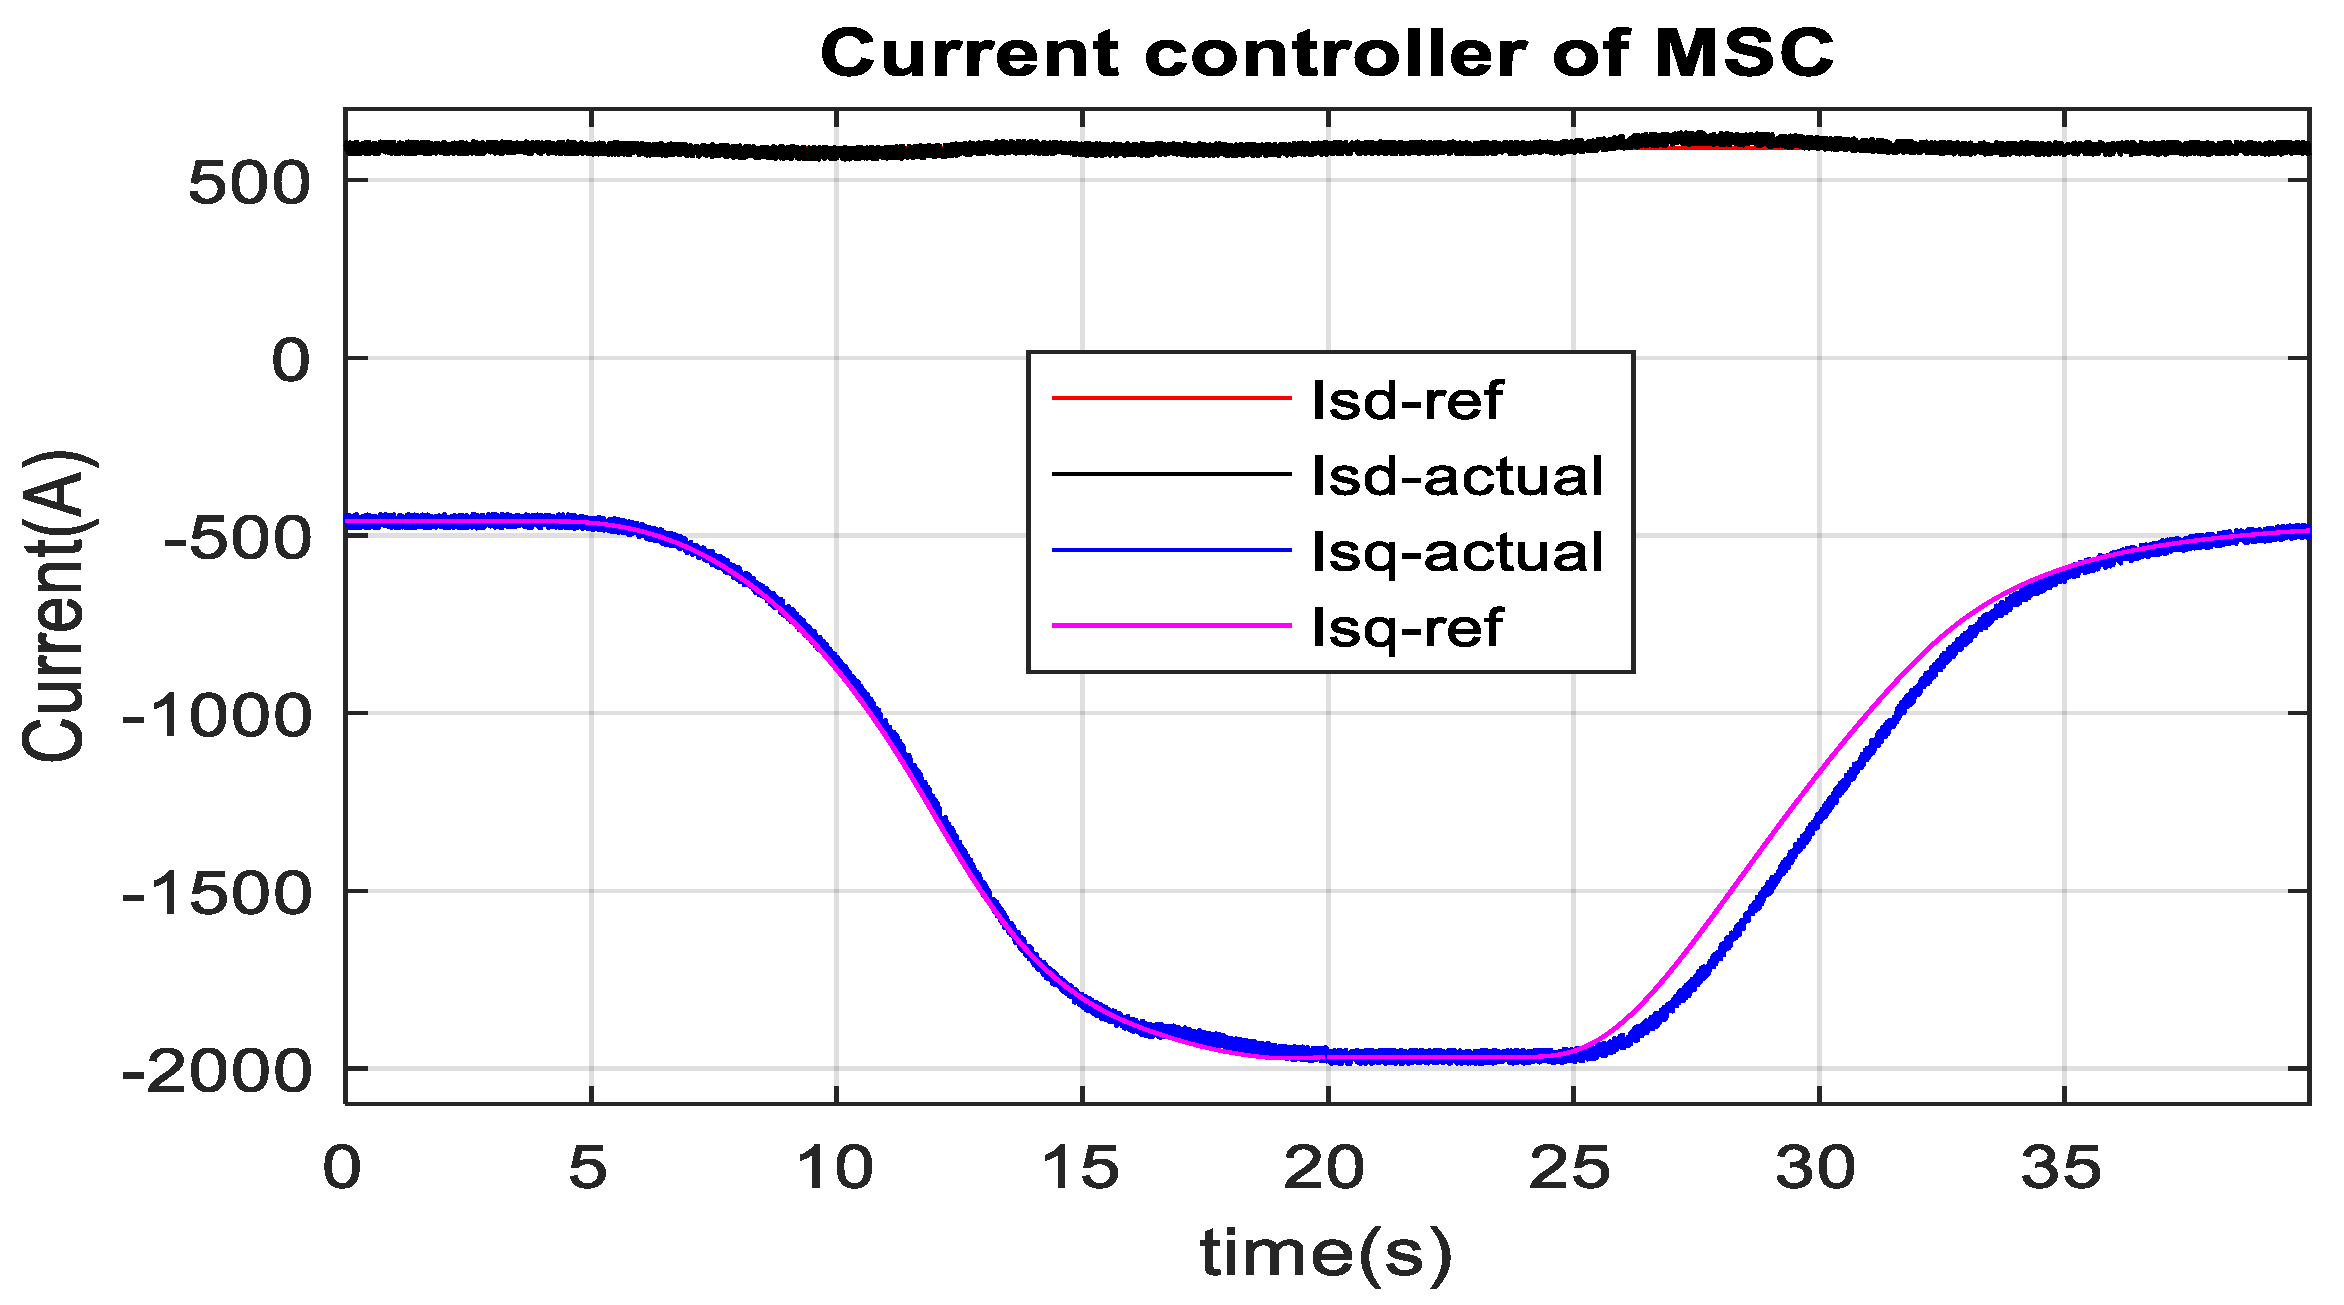
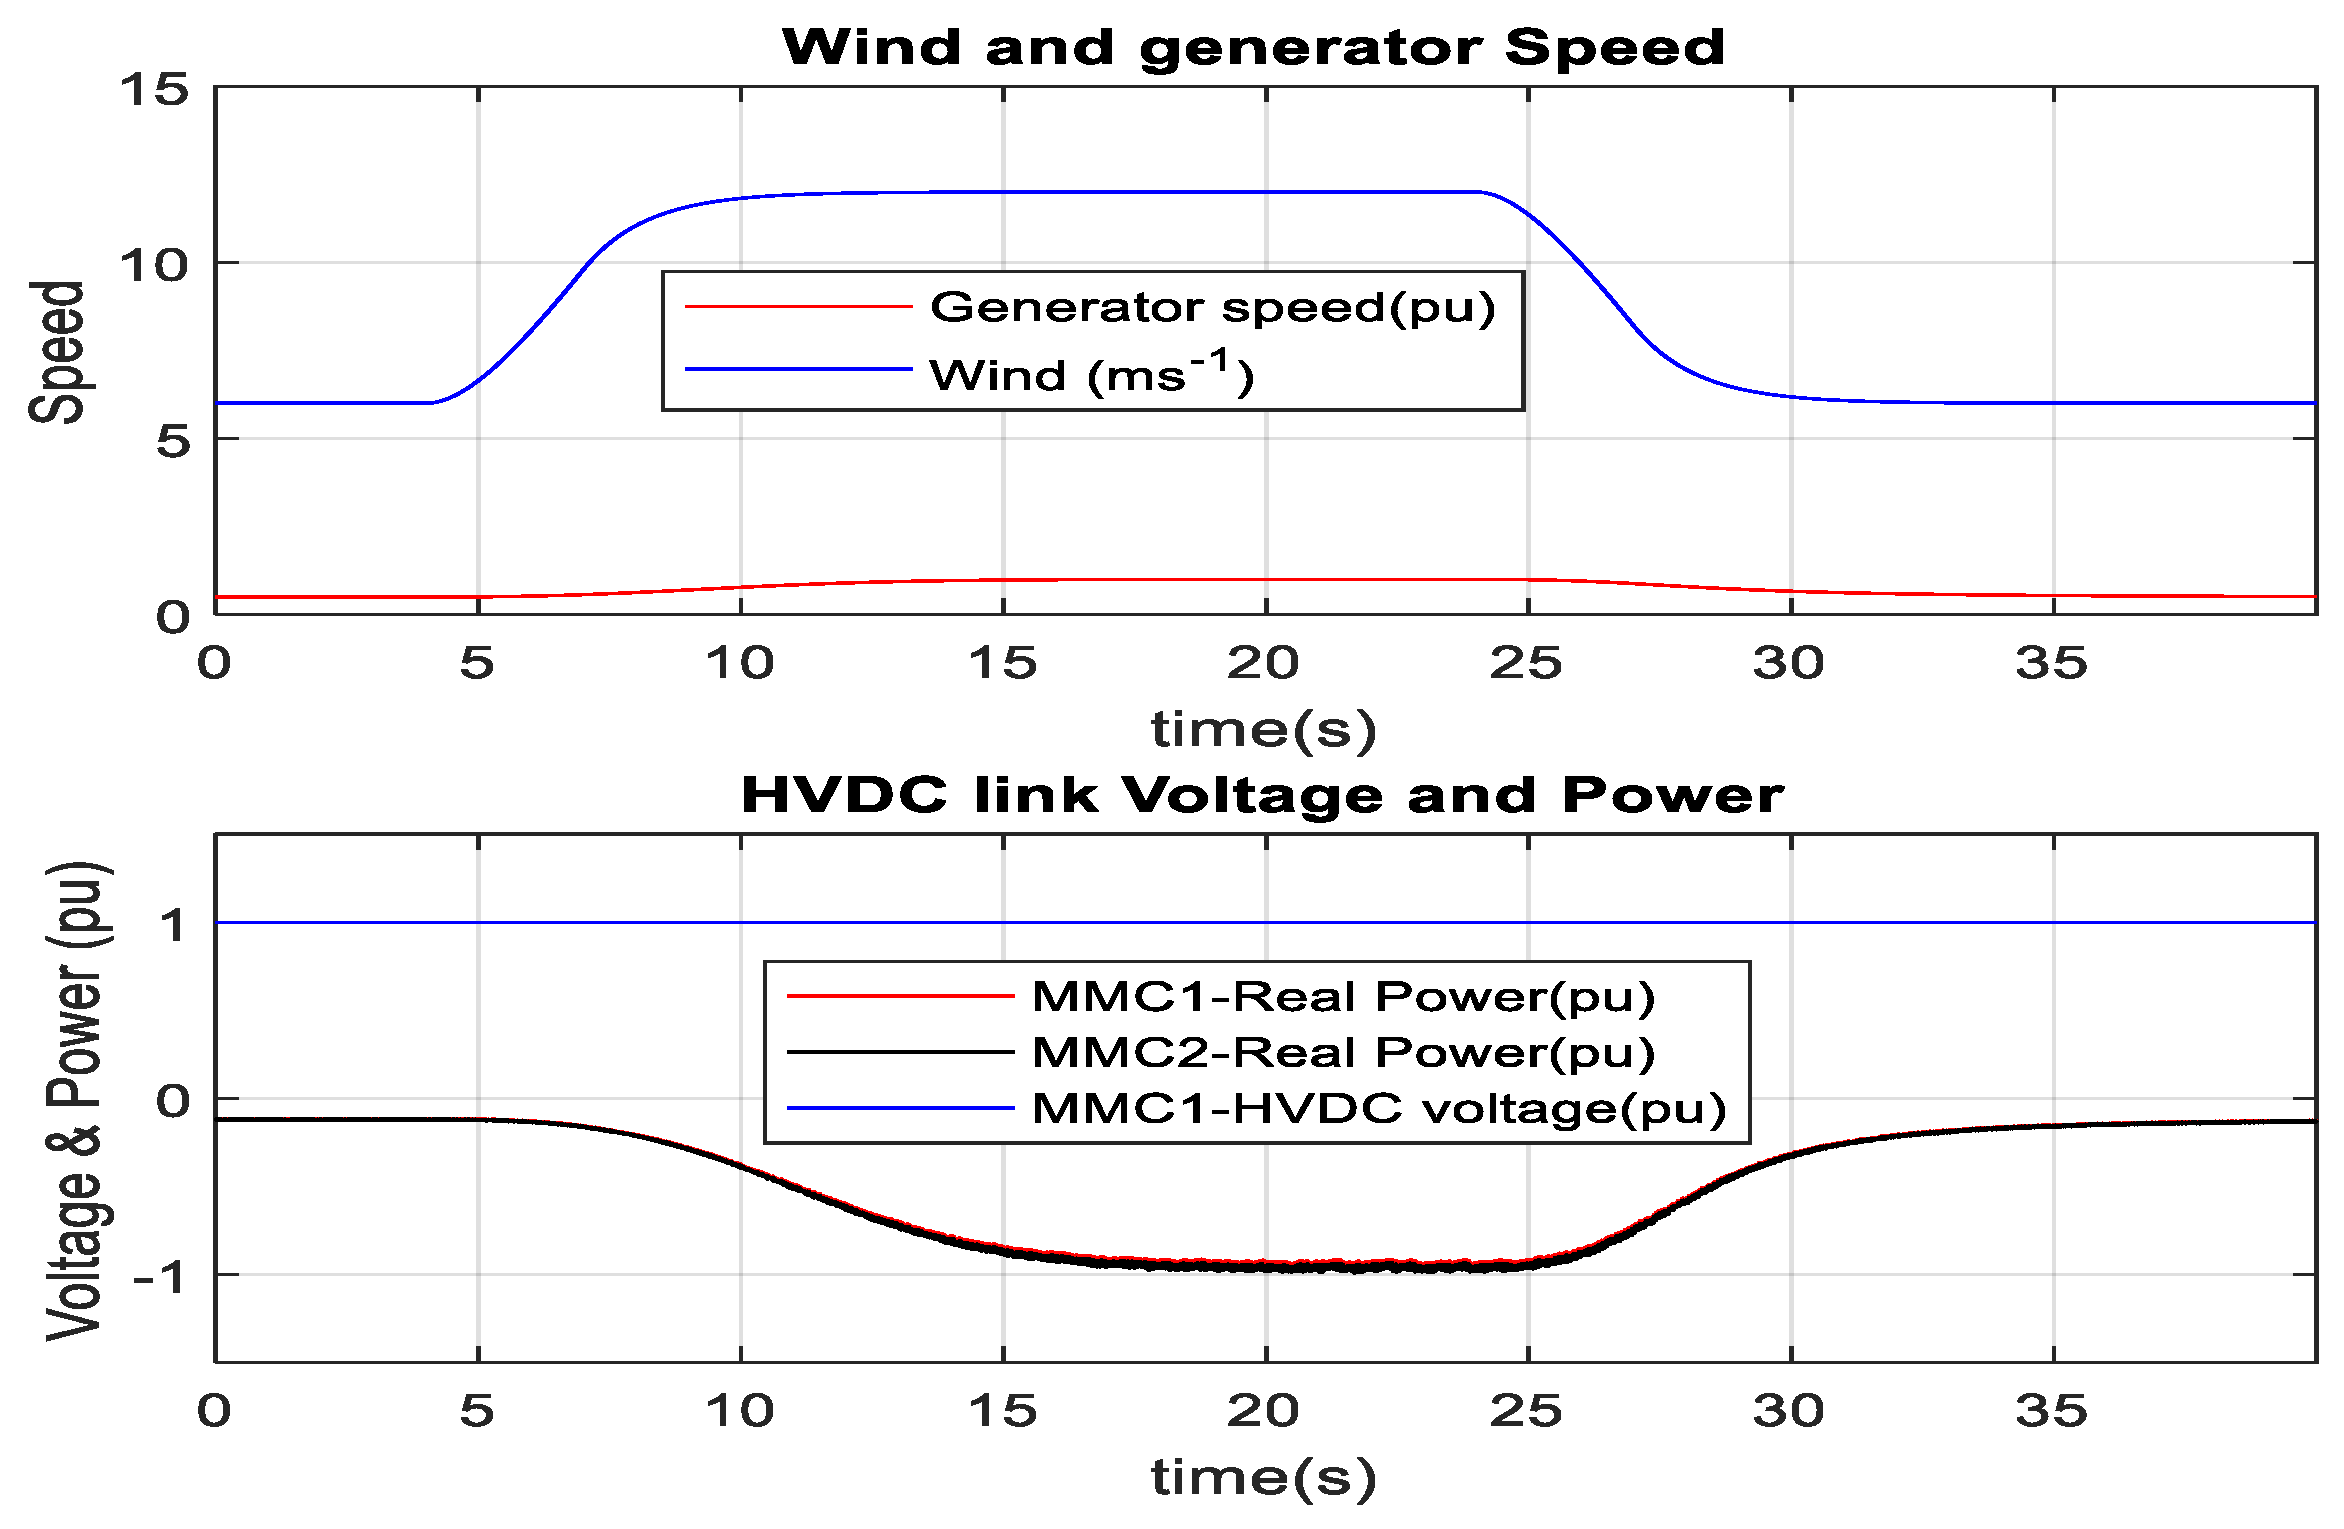
The result in RTDS-dSPACE, as depicted in Figure 41, confirms the controller efficacy of optimal wind energy tracking. The wind farm produces around 0.1 pu (10 MW = 50 × 0.2 MW) real power at 6 ms−1 wind speed, and 1 pu (100 MW = 50 × 2 MW) real power at 12 ms−1 wind speed, which agrees with the expected optimum wind energy result. It is also found 1 pu generator speed at 12 ms−1 wind speed. During this transient period, the HVDC link voltage has not been changed. The power received by the MMC1 terminal is somewhat less than that received by the MMC2 terminal because of a slight loss in the HVDC line. The actual dq current of MSC tracks the reference dq current as presented in Figure 42 and Figure 43. Reactive current remains almost constant, whereas torque controlling current changes with the machine reference electrical torque. MSC provides the required reactive power set by the equation without an external capacitor bank connected in parallel with the SCIG (18).

3.5. PMSG-Based Optimum Wind Energy Integration

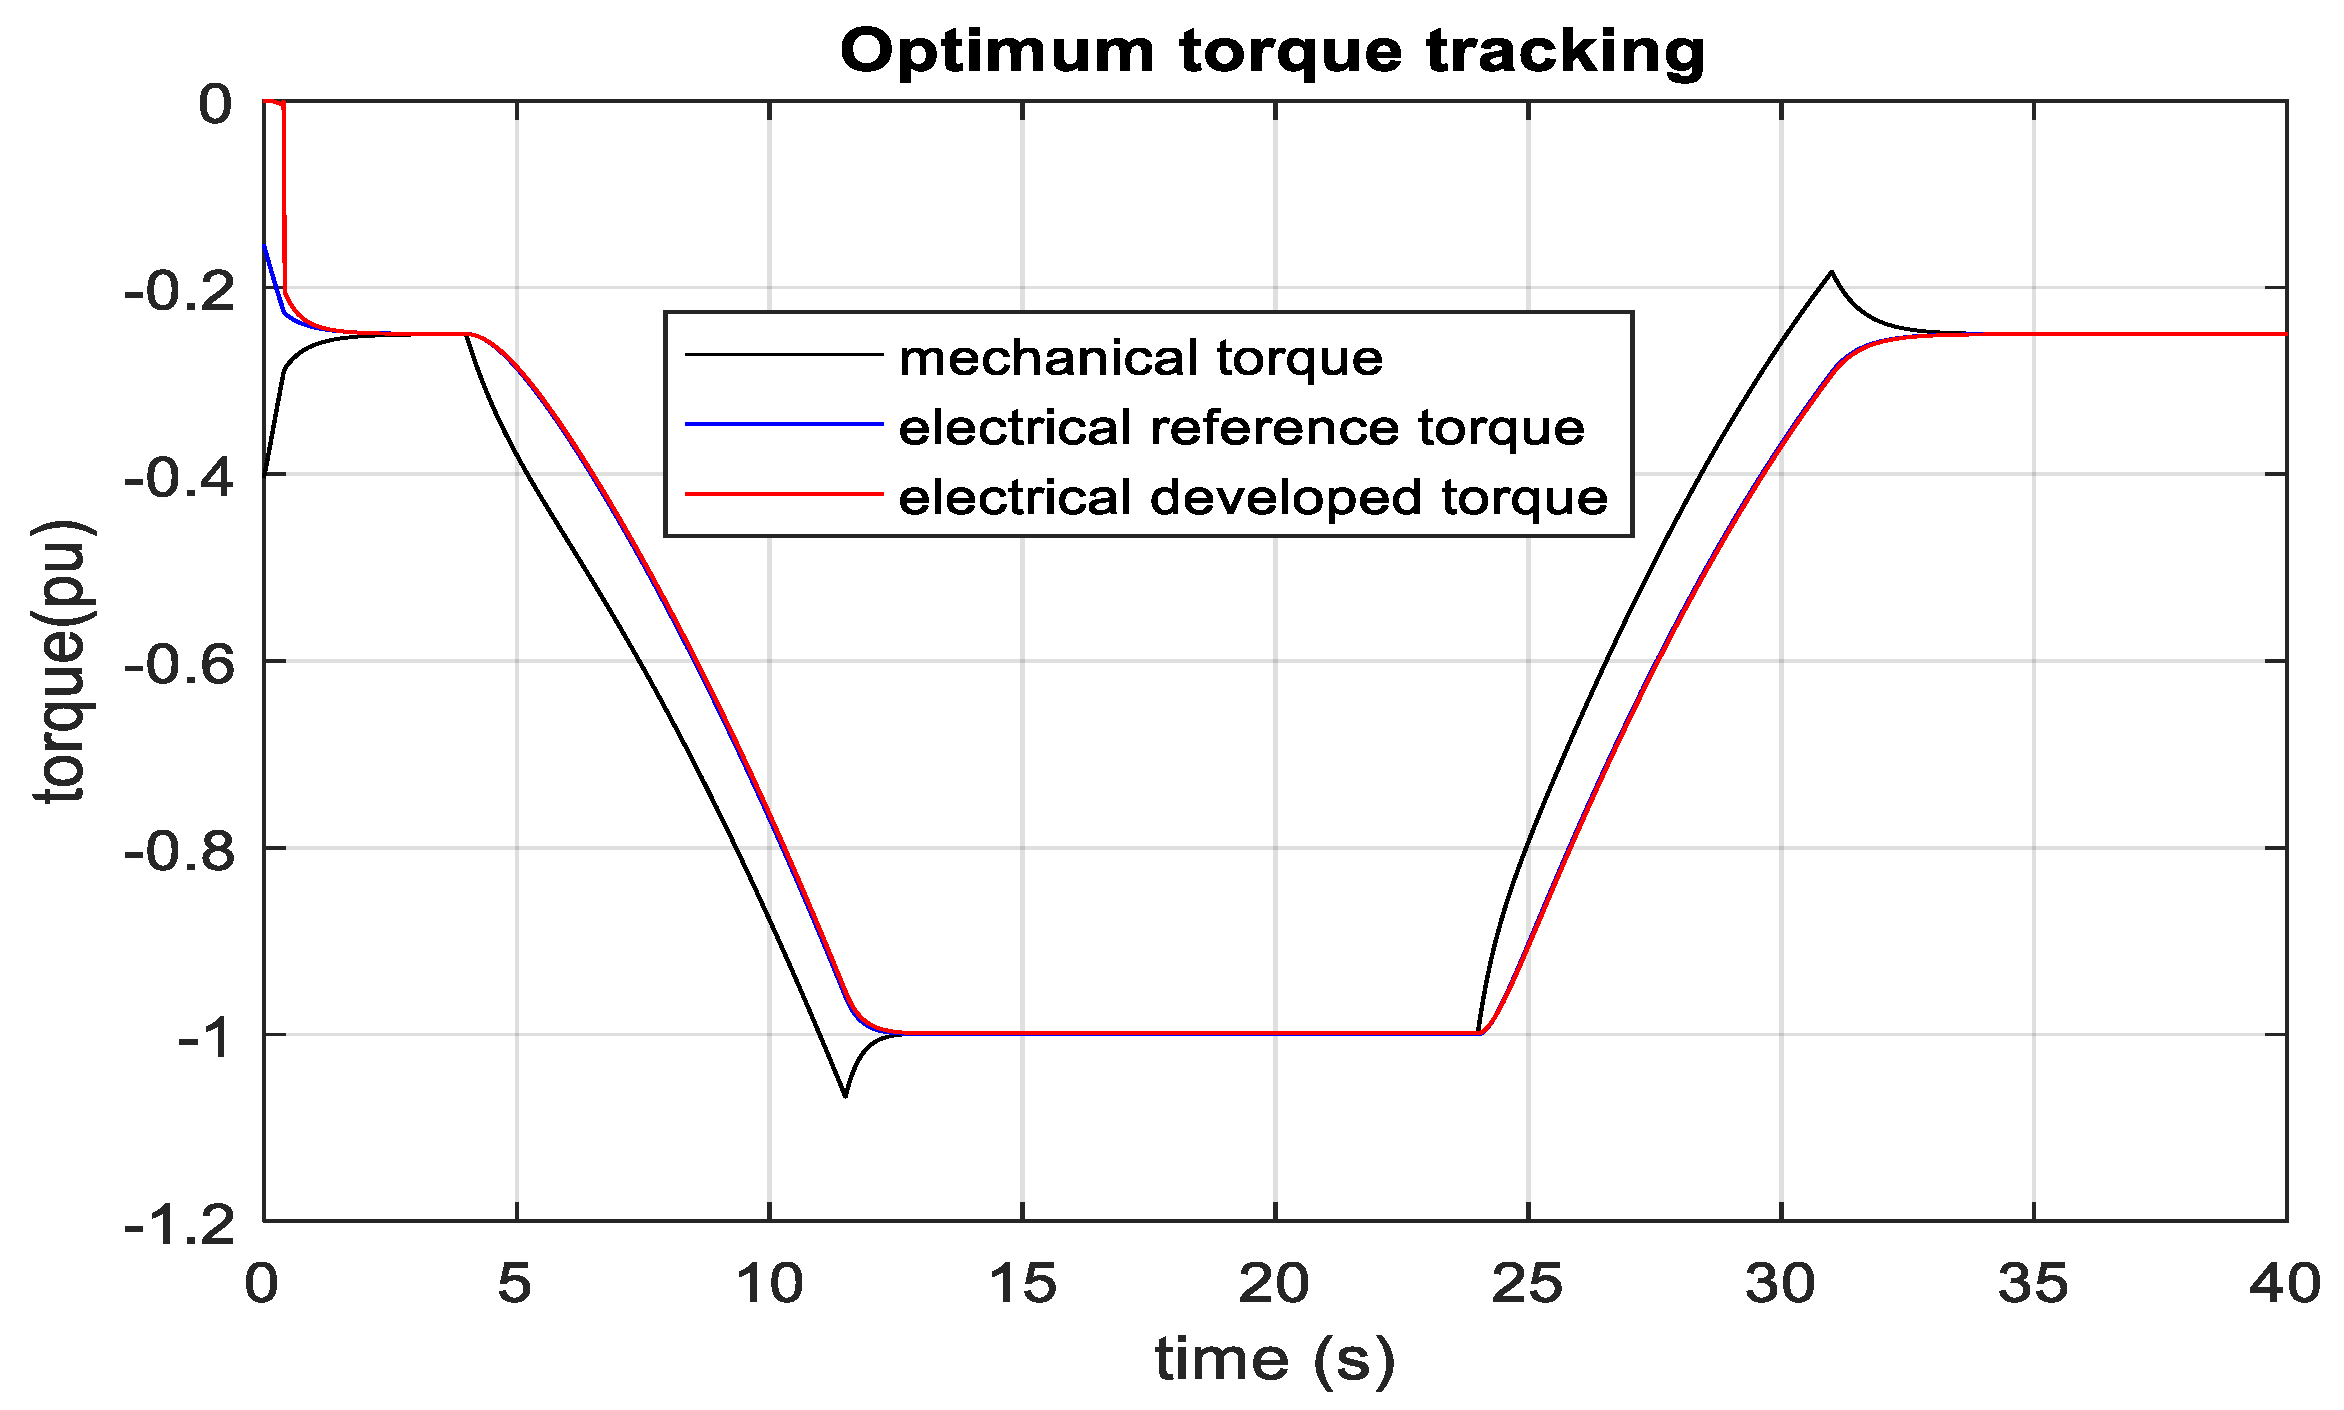
The turbine mechanical power vs. speed characteristics for PMSG is the same as SCIG. Figure 44 and Figure 45 show the performance of the machine-side converter controller for optimal wind energy tracking in MATLAB/SIMULINK. Wind speed varies from 6 ms−1 (0.5 pu) to 12 ms−1 (1 pu). Generator speed is changed from 0.5 pu to 1 pu to capture optimum wind energy during such wind speed change. PMSG delivers around 0.1 pu real power at 6 ms−1 wind speed to 1 pu real power at 12 ms−1 wind speed. This validates the converter’s capability to capture the optimum wind energy. As seen in Figure 45, the electrical and mechanical torque is equal in the steady state, which makes the generator speed constant in the steady state. Due to generator inertia and gearbox, the generator speed does not change abruptly with the wind speed. Therefore, the electrical reference torque is progressively set to an optimal value with the generator rotor speed.
The actual torque follows the reference electrical torque. RTDS rack-1 and dSPACE are used for MMC1, and RTDS-rack-2 is used for MMC2 and PMSG-based wind farms. 100 MW wind farm is developed by multiplying one complete unit of 2 MW PMSG with its optimal controller. As the turbine mechanical power versus generator speed characteristics of PMSG is the same as SCIG, one unit of PMSG is expected to deliver 0.1 pu (0.2 MW) optimum real power at 6 ms−1 wind speed and 1 pu (2 MW) optimum power at 12 ms−1 wind speed. It is found from the RTDS-dSPACE result, as illustrated in Figure 46, that the PMSG-based wind farm injects around 0.1 pu (10 MW = 50 × 0.2 MW) real power to 1 pu (100 MW = 50 × 2 MW) real power during the wind speed deviation from 6 ms−1 to 12 ms−1 into the HVDC link. The generator speed is reached to optimum (1 pu) at 12 ms−1 wind speed. Similarly, wind power injection optimally changes during the wind speed from 12 ms−1 to 6 ms−1 into the HVDC link. Therefore, the PMSG controller has successfully tracked the peak point of wind energy in real-time during the wind speed change. HVDC link voltage does not result in an overshoot during the power change. As stated earlier, PMSG does not require reactive current; the actual reactive current is controlled to almost zero and follows the set value, as described in Figure 47 and Figure 48. However, torque controlling real current changes with a reference electrical torque. It is observed from Figure 47 and Figure 48 that the actual real current follows the real reference current.

3.6. FRT Improvement of the MMC-HVDC System during Low Voltage Faults

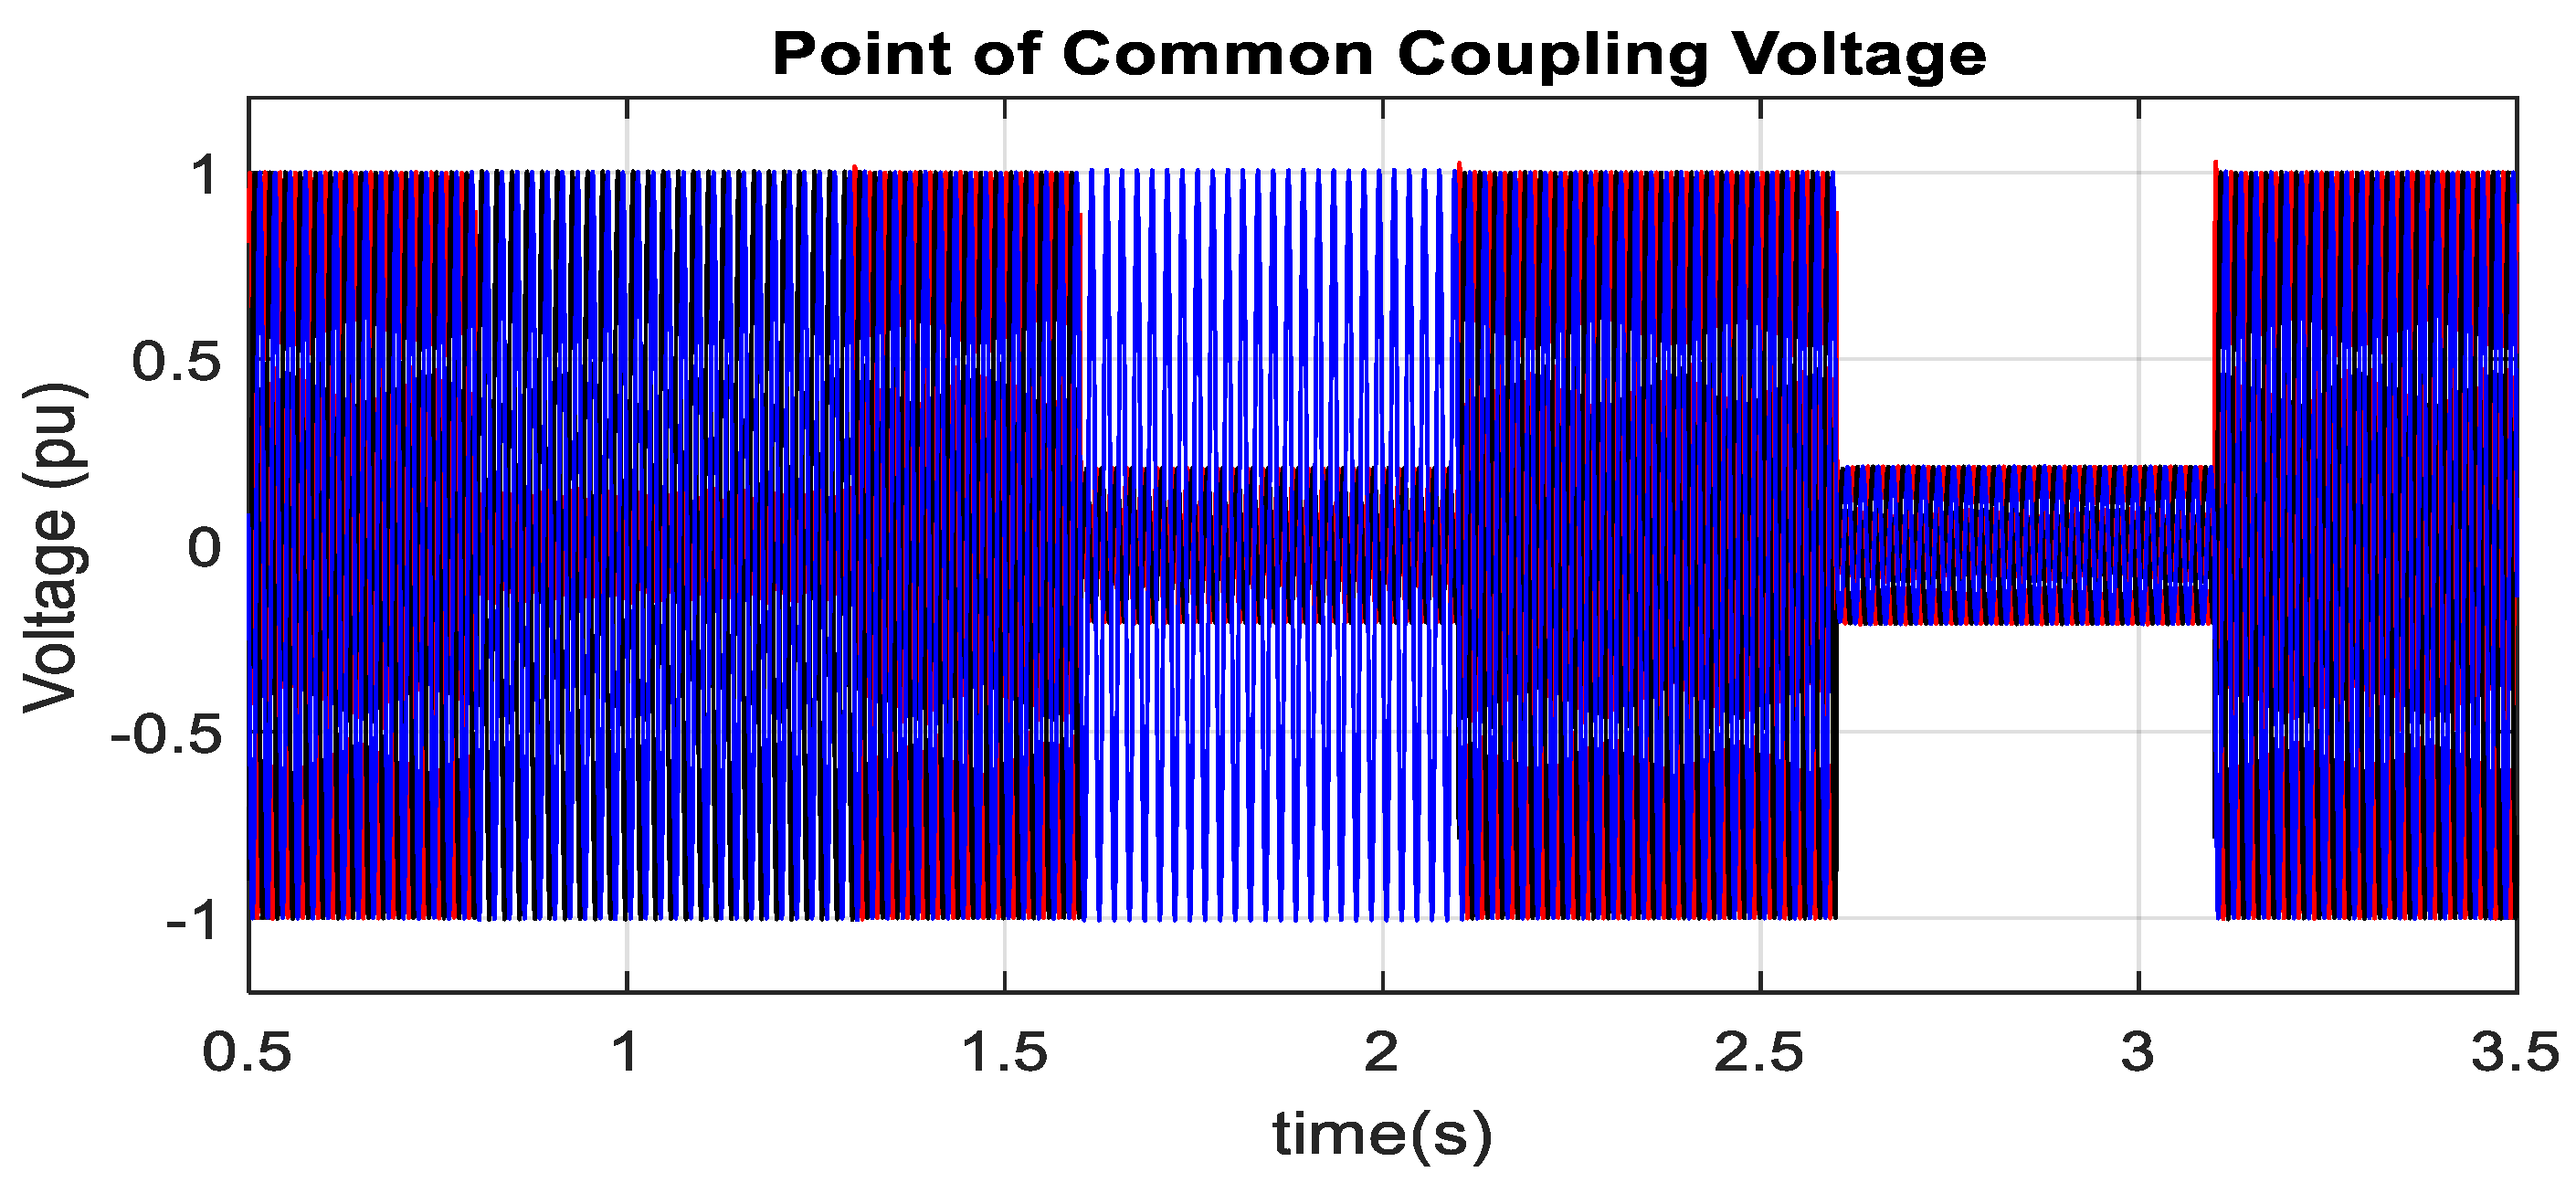
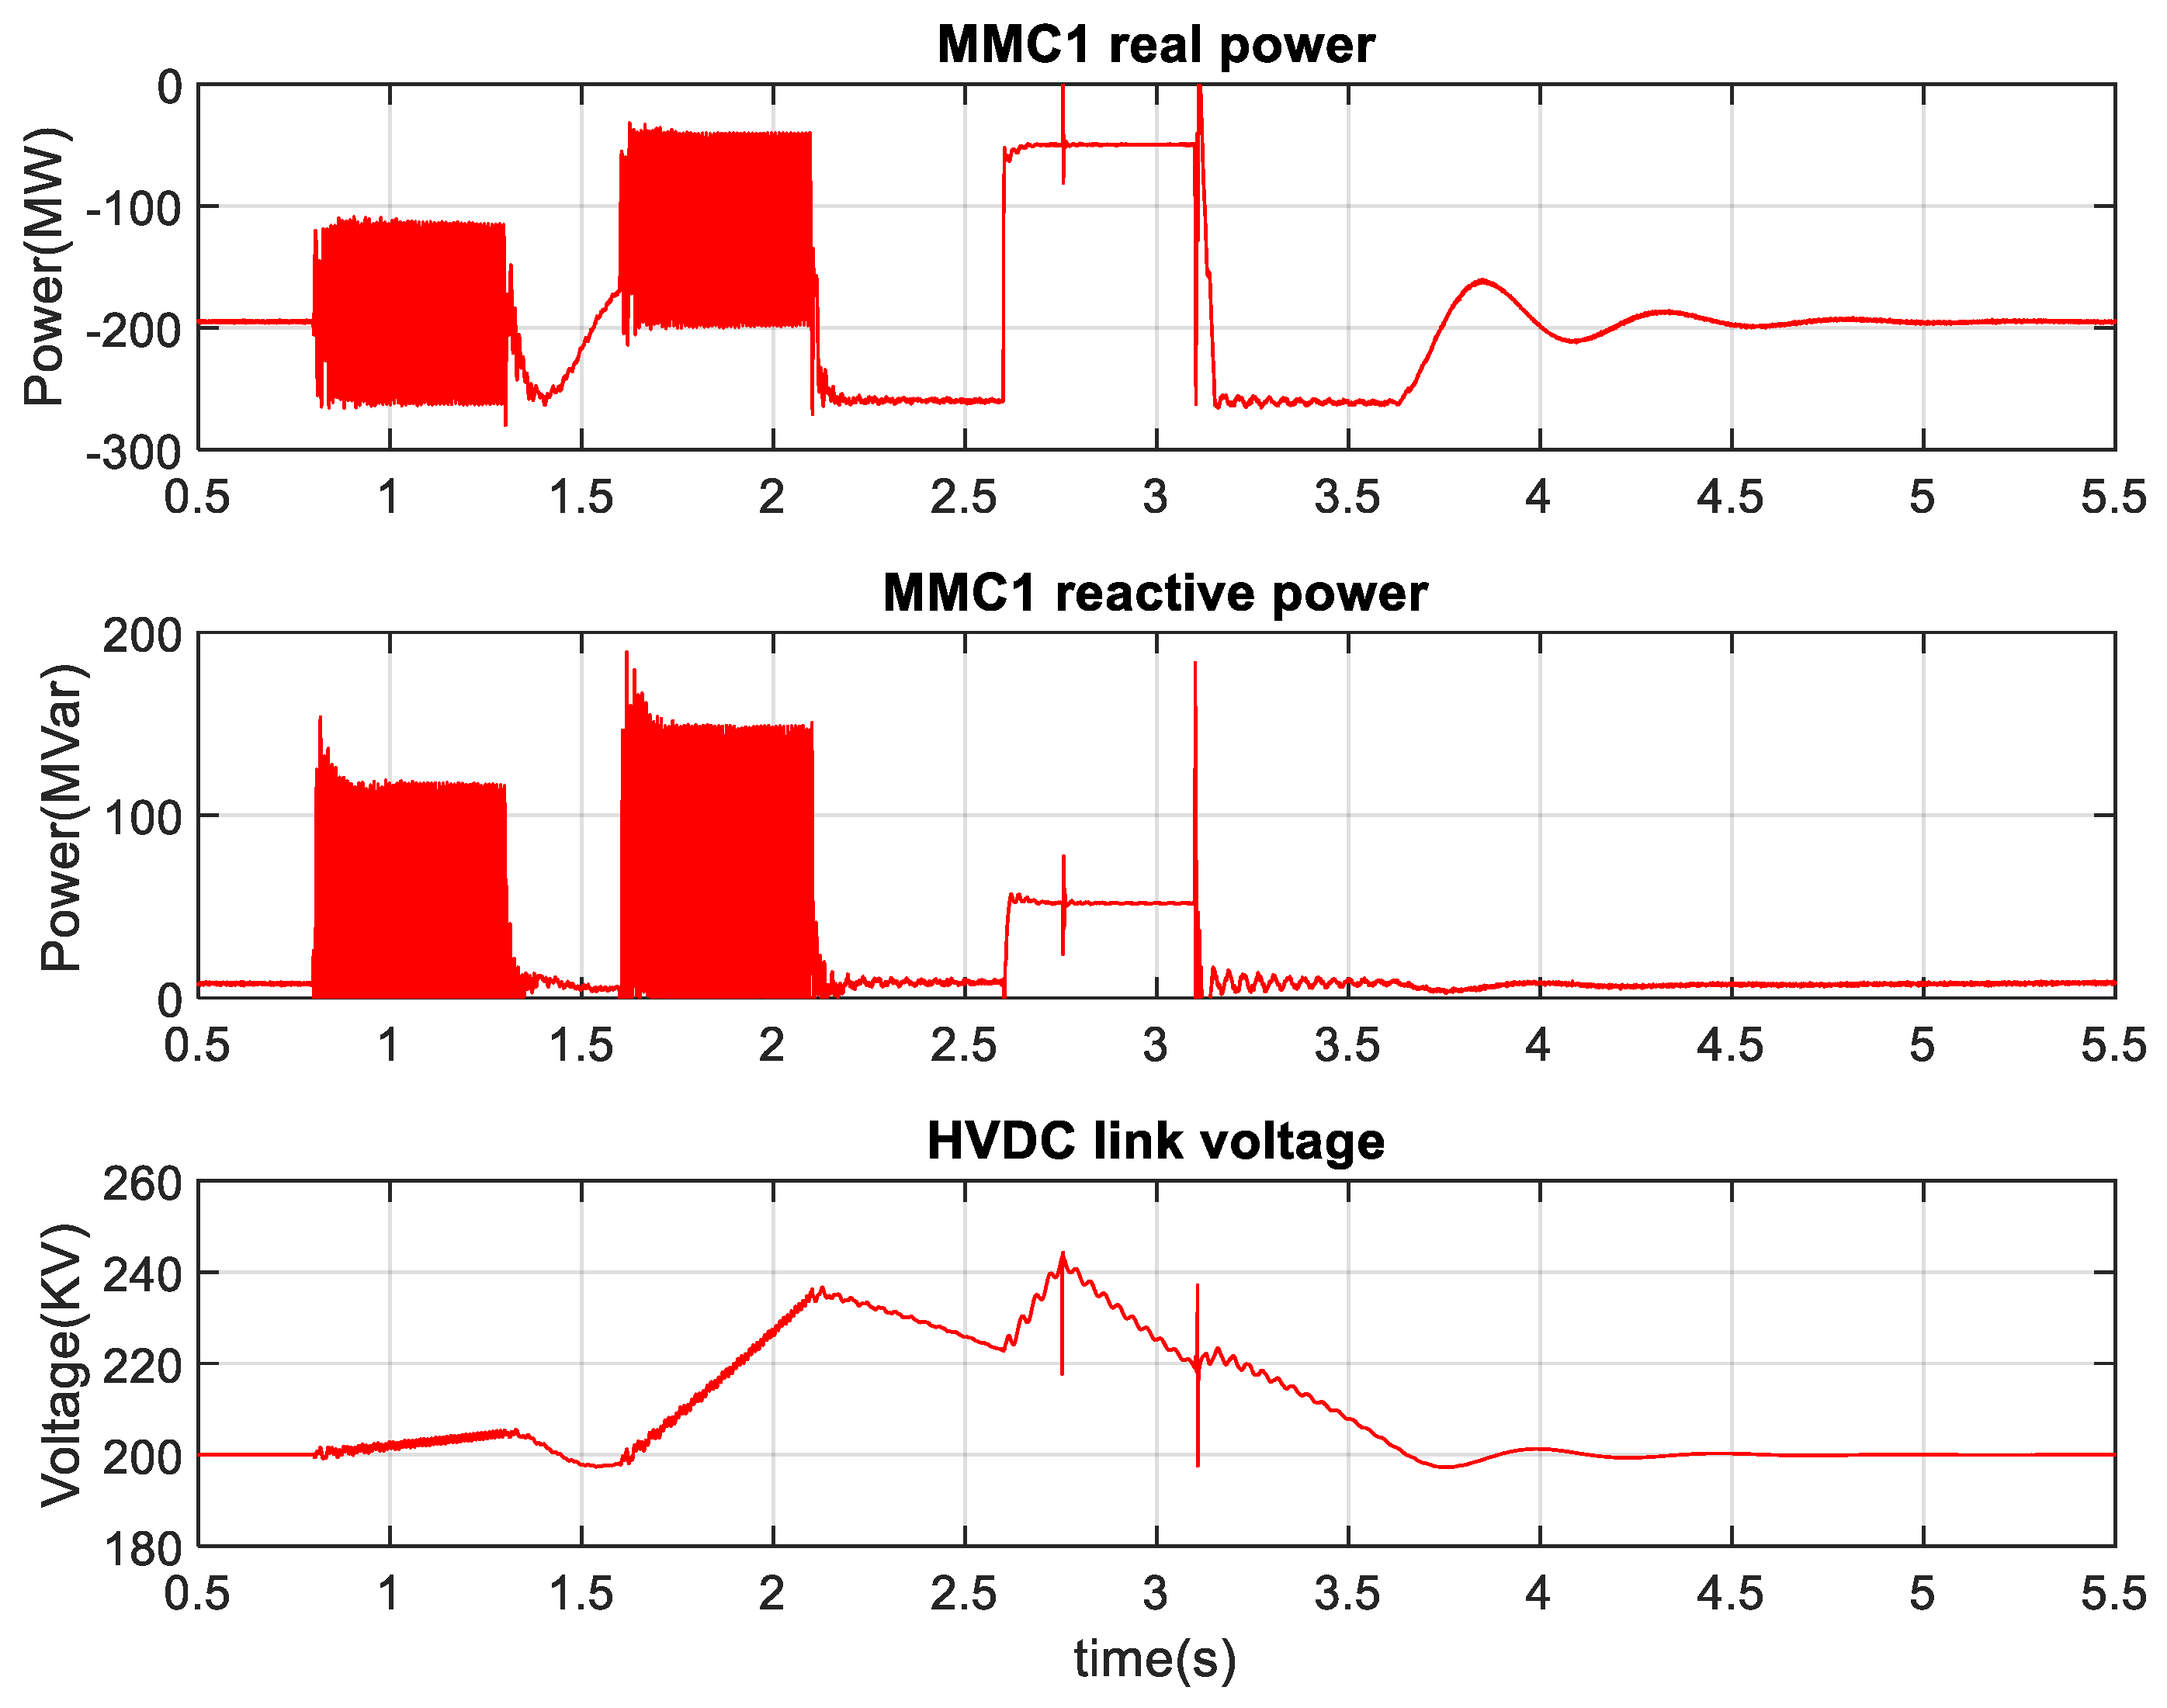
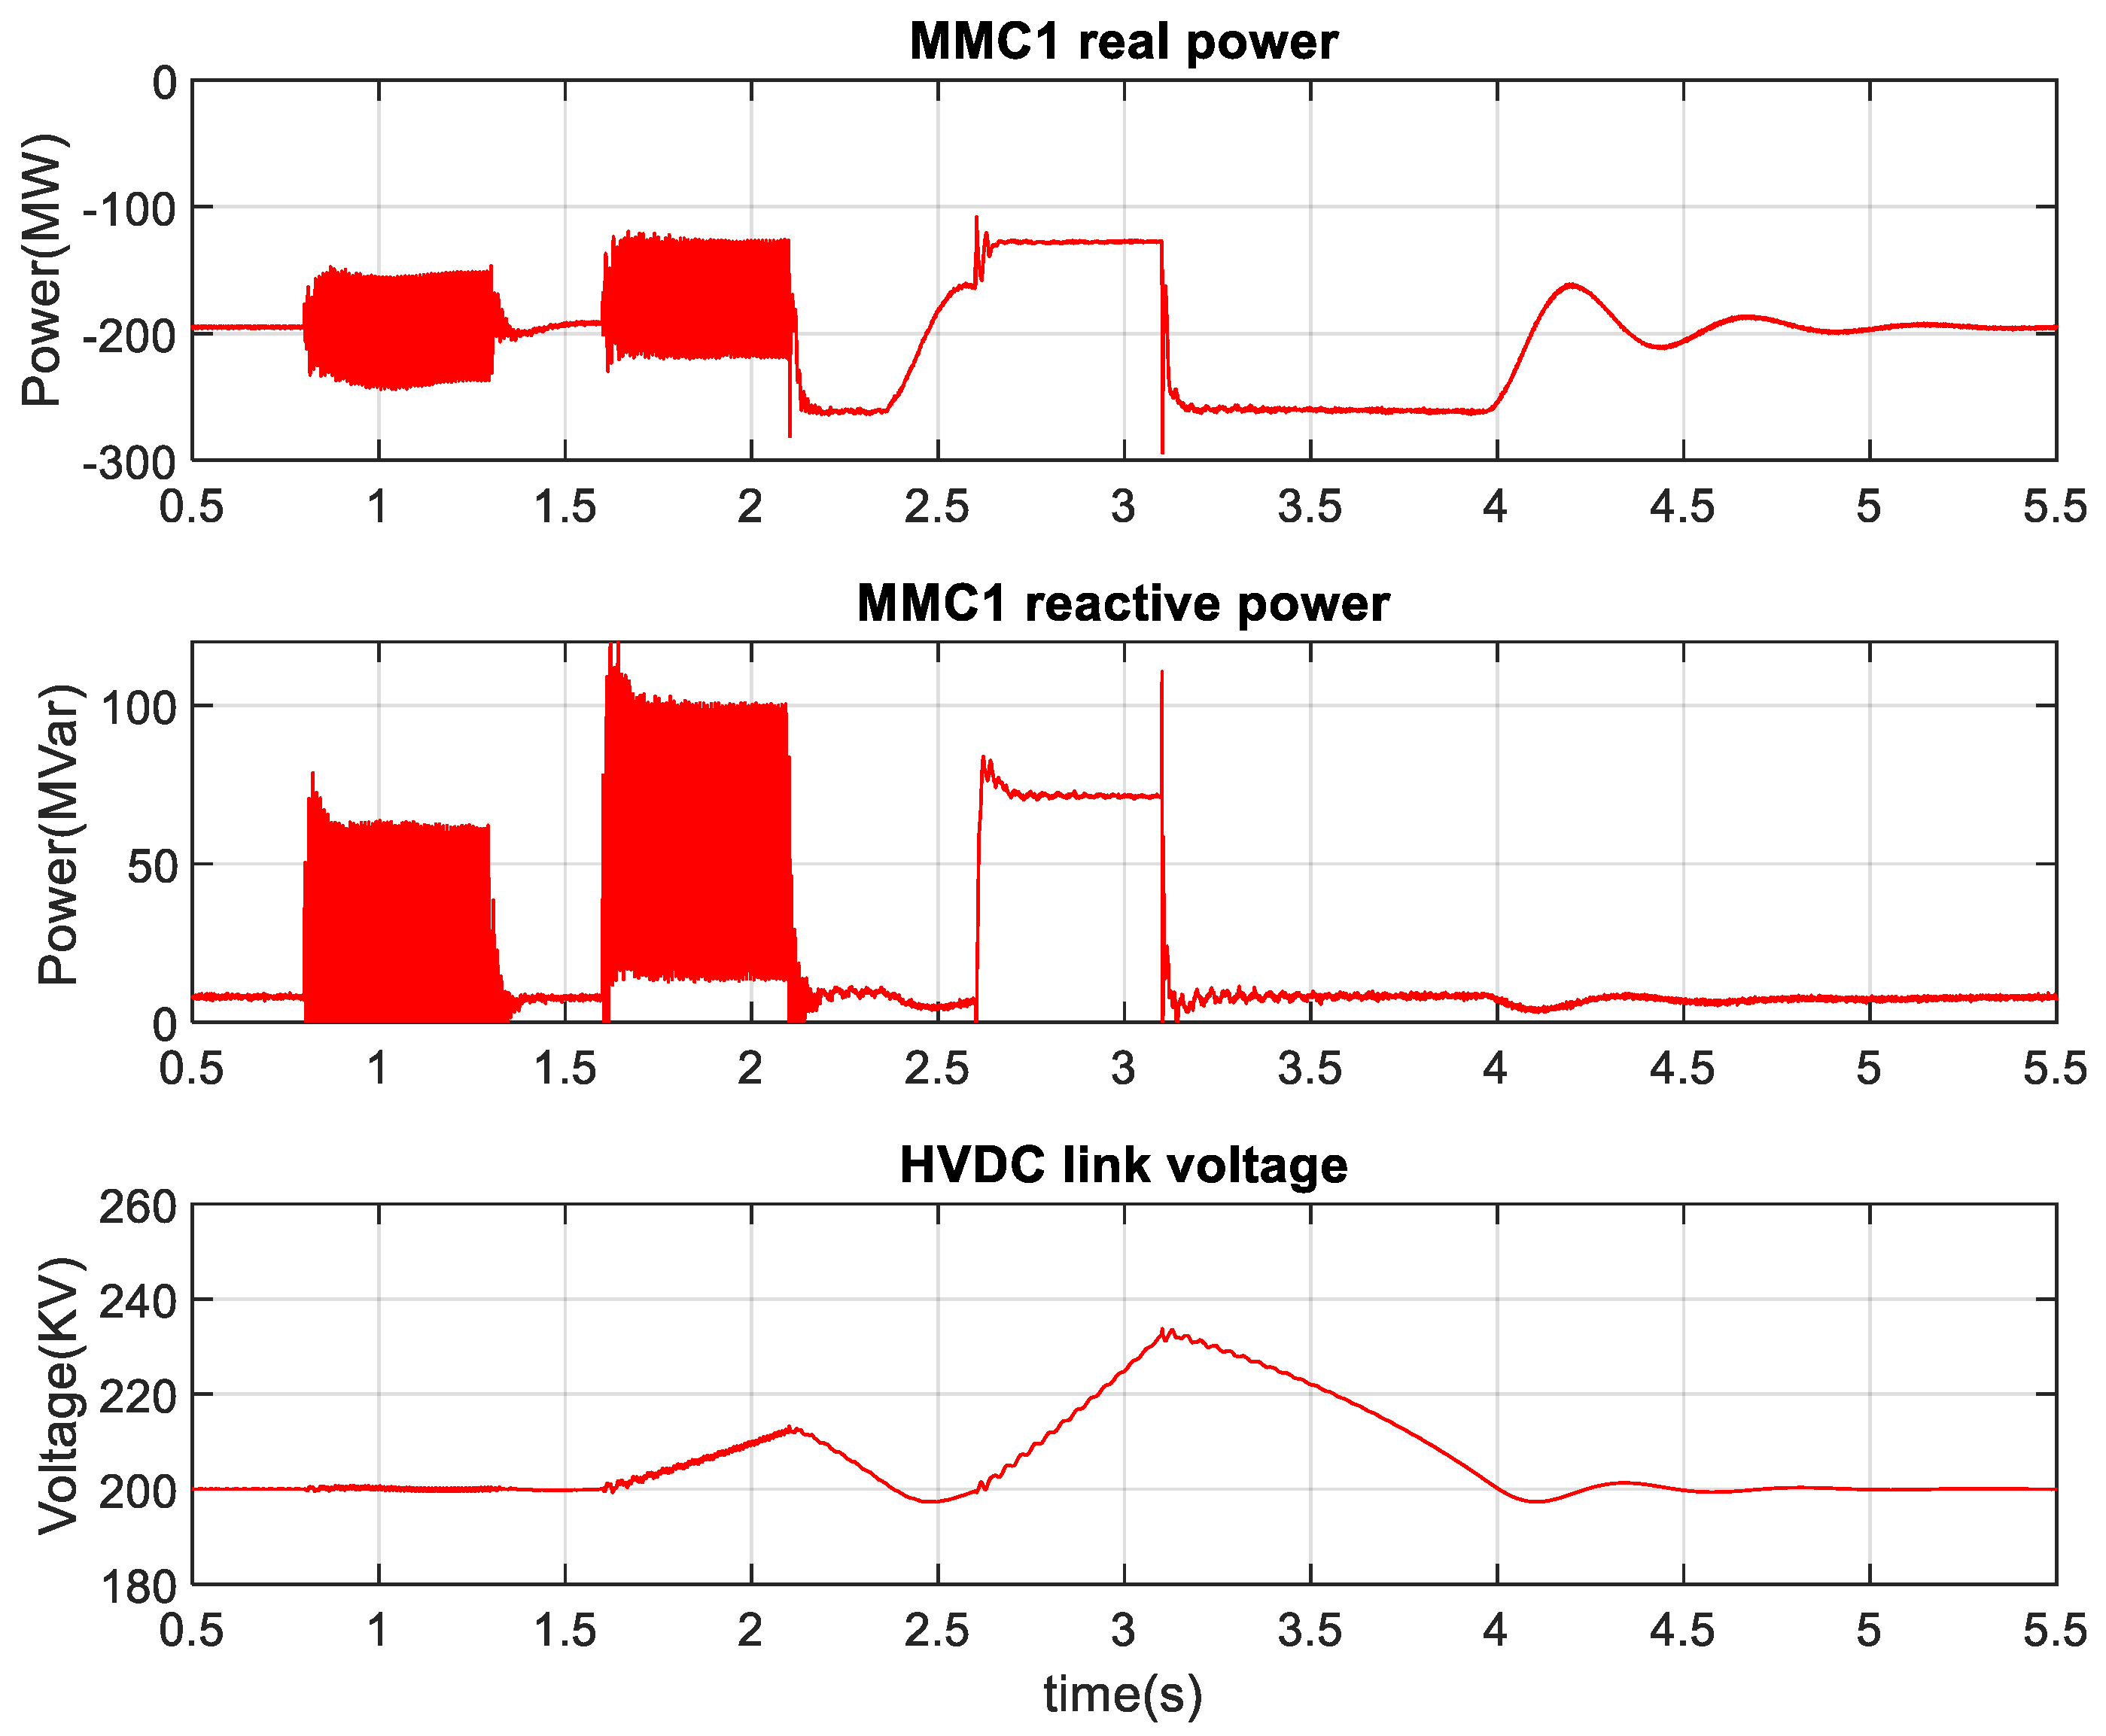
The power system is the most complex network and is prone to symmetrical and unsymmetrical low voltage faults at the PCC of AC grids, which requires real and reactive power support from the generating source. The voltage at PCC of the AC grid is reduced below the threshold is called a low voltage fault. However, the low voltage fault severity can vary and can go down to 0%. The power system operator sets the grid code requirement for integrating large-scale renewable energy into the network. The grid codes (GC) in countries with high wind-power penetration rates (e.g., Germany, Denmark, the UK, Spain, and Ireland) require HVDC stations to remain connected for a limited time during low voltage faults [43]. Real power delivery becomes almost zero during the low voltage fault, increasing the HVDC link voltage. Typically, a dynamic braking resistor (DBR) is connected with the converter in parallel and dissipates surplus energy to regulate the HVDC link voltage during the severe AC side low voltage faults. The value for DBR is selected in such a way to dissipate maximum power during the severe AC side low voltage faults. In addition, injecting reactive power is required to support the PCC voltage. While injecting 200 MW renewable energy to the PCC1, SLG, DLG, and 3LG faults are applied at PCC1 at 0.8 s, 1.6 s, and 2.6 s, respectively, as shown in Figure 49. During these faults, the PCC1 voltage drops 80%. Figure 50 illustrates the real power and reactive power injection of MMC1 into PCC1 and HVDC link voltage. As can be seen, the power is reduced from 200 MW to around 180 MW, 125 MW, and 50 MW during SLG, DLG, and 3LG low voltage faults, respectively. Consequently, excess energy raises the HVDC link voltage, which triggers the DBR to maintain the HVDC link voltage below 1.2 pu.
During these faults, an average 55 MVAR, 75 MVAR, and 50 MVAR reactive power have been injected. Due to low voltage, the injected reactive power during the 3LG fault is smaller than the DLG fault. Similar performances have been observed during a 50% voltage drop at PCC1, as illustrated in Figure 51 and Figure 52. During DLG and 3LG faults, real power injection by the MMC1 is reduced to 162.5 MW and 125 MW, respectively. However, the average real power remains almost the same during the SLG fault. During these faults, an average 25 MVAR, 50 MVAR, and 75 MVAR reactive power have been injected during SLG, DLG, and 3 LG low voltage faults, respectively. It is worth mentioning that the variation of renewable energy due to wind speed and solar radiation change from its nominal operating point (200 MW) does not contribute to voltage rise in the HVDC link. Therefore, the parallelly connected dynamic braking resistor protection system with the HVDC link remains inactive.

4. Conclusions

This research has developed an MMC detailed model-based HVDC transmission network for optimum PV and wind energy integration. Standalone high voltage AC has been designed to employ PI and feedforward controller. Field-oriented control has been used for optimal wind energy tracking, and a modified incremental conductance method has been employed for peak solar energy tracking. The complete dynamics of renewable energy grid integration have been considered. Type III and type IV wind generators were considered for wind energy integration. The controller performance has been thoroughly analyzed in MATLAB/SIMULINK, whereas real-time performance has been tested in RTDS-dSPACE. The results from both platforms have found agreement with each other. The results confirmed the optimum renewable energy tracking during wind speed, temperature, and irradiance change. The results also confirmed the fault ride-through capability during the symmetrical and unsymmetrical low voltage disturbance at the PCC of AC grids. The developed system can be used for the DC side fault analysis. In addition, a battery can be added to the system for smoothing the power fluctuations due to solar radiation, temperature, and wind speed variation. Similarly, large renewable energy-integrated MMC-HVDC systems can be investigated for the frequency regulation of AC grids.

Author Contributions

Conceptualization, M.I.H.; Methodology, M.A.A.; Software, M.I.H.; Validation, M.I.H.; Formal analysis, M.I.H., M.S. and M.A.A.; Investigation, M.I.H.; Resources, F.A.A.-S. and M.A.A.; Writing—original draft, M.I.H.; Writing—review & editing, M.S. and M.A.A.; Supervision, M.A.A.; Project administration, F.A.A.-S.; Funding acquisition, F.A.A.-S. All authors have read and agreed to the published version of the manuscript.

Funding

This research received no external funding.

Acknowledgments

The authors acknowledge the support provided by Interdisciplinary Research Center in Renewable Energy and Power Systems (IRC-REPS), King Fahd University of Petroleum and Minerals, through the funded research project #INRE 2102. The authors also acknowledge the support of KACARE Energy Research and Innovation Center (ERIC), KFUPM, Saudi Arabia.

Conflicts of Interest

The authors declare no conflict of interest.

Appendix A

Table A1. Photovoltaic module, Wind turbine, DFIG wind generator, and converter data.
Photovoltaic Module DataWind Turbine Parameters
QuantityValueQuantityValue
Cells per module36Nominal wind speed12 m/s
Short circuit current3.35 ANominal generator speed, DFIG/SCIG1.2 pu/1 pu
Open circuit voltage21.7 VNominal turbine power2 MW
Current at MPP3.05 ADFIG and controller parameters
Voltage at MPP17.4 VQuantityValue
Temperature coefficient of Isc0.065%/degreeStator voltage (L-L)690 V
Temperature coefficient of Voc−0.56%/degreeNominal frequency, f50 Hz
Photovoltaic array dataNominal power2.2 MVA
Series connected modules per string115Stator resistance, RS1 mΩ
Parallel strings285Rotor resistance, Rr1.3 mΩ
Grid side VSC parameters for PV/DFIG/SCIG/PMSGTotal stator inductance, LS2.55 mH
QuantityValueTotal rotor inductance, Lr2.56 mH
Nominal DC link Voltage2 kV/1.5 kV/1.5 kV/6987 VMagnetizing inductance, Lm2.44 mH
Rated power2.2 MVAPI1244 + 1400/s pu
Resistance, R0.004 puFilter inductance, LF4.3 µH
Inductance, L0.15 puFilter capacitance, CF1.47 mF
PI4(1 + 100/s) puFilter resistance, RF0.054 Ω
PI3(0.64 + 5/s) puM1, M256, 50 units
Table A2. SCIG and PMSG wind generator, and converter data.
Squirrel Cage Induction Generator and Controller
Parameters
Permanent Magnet Synchronous Generator and
Controller Parameters
QuantityValueQuantityValue
Stator voltage (L-L)690 VStator voltage (L-L)4 kV
Nominal frequency50 HzNominal power2 MW
Nominal power2 MWNumber of pole pairs, P8
Stator resistance, RS1 mΩStator resistance2.21 mΩ
Rotor resistance, Rr1.3 mΩd and q axis inductance Ld and Lq9.816 mH
Total stator inductance, LS2.55 mHFlux linkage established by magnets, λm7.0304 Vs
Total rotor inductance, Lr2.56 mHPI1(4 + 1/s) pu
Magnetizing inductance, Lm2.44 mHM3, M450 units
PI11180 + 112.5/s pu
PI1311 + 1400/s pu
Table A3. MMC Controller parameters.
ParametersValueParametersValue
Rated power250 MWKP45
Rated HVDC link voltage200 kVω1314.159 rad/s
Rated AC voltage(L-L)100 kVKI4500
Rated frequency50 HzC16 mF
Resistance, R0.002 puCd100 µF
Inductance, L0.2 puSM/arm200
ModulationNearest levelK+0.0625
PI4(4 + 100/s) puk1.4142
PI70.6 + 6/s puK-0.05
PI100.8 + 100/s puDC line resistance1.39 mΩ/km
AC grids short circuit ratio10DC line inductance0.159 mH/km
DC line capacitance0.231 µF/km
DBR, R200 Ω

References

  1. International Renewable Energy Agency IRENA. Renewable Power Generation Costs in 2019; IRENA: Abu Dhabi, United Arab Emirates, 2020. [Google Scholar]
  2. Shafiullah, M.; Ahmed, S.D.; Al-Sulaiman, F.A. Grid Integration Challenges and Solution Strategies for Solar PV Systems: A Review. IEEE Access 2022, 10, 52233–52257. [Google Scholar] [CrossRef]
  3. Roser, M. Why Did Renewables Become so Cheap so Fast? Available online: https://ourworldindata.org/cheap-renewables-growth (accessed on 7 April 2022).
  4. Wind Energy. Available online: https://www.irena.org/wind (accessed on 28 January 2021).
  5. Ahmed, S.D.; Al-Ismail, F.S.M.; Shafiullah, M.; Al-Sulaiman, F.A.; El-Amin, I.M. Grid Integration Challenges of Wind Energy: A Review. IEEE Access 2020, 8, 10857–10878. [Google Scholar] [CrossRef]
  6. Shafiullah, G.M.; Masola, T.; Samu, R.; Elavarasan, R.M.; Begum, S.; Subramaniam, U.; Romlie, M.F.; Chowdhury, M.; Arif, M.T. Prospects of Hybrid Renewable Energy-Based Power System: A Case Study, Post Analysis of Chipendeke Micro-Hydro, Zimbabwe. IEEE Access 2021, 9, 73433–73452. [Google Scholar] [CrossRef]
  7. Wang, Y.; Wen, W.; Wang, C.; Liu, H.; Zhan, X.; Xiao, X. Adaptive Voltage Droop Method of Multiterminal VSC-HVDC Systems for DC Voltage Deviation and Power Sharing. IEEE Trans. Power Deliv. 2019, 34, 169–176. [Google Scholar] [CrossRef]
  8. Manmohan, A.; Prasad, A.; Dharavath, R.; Karthikeyan, S.P.; Raglend, I.J. Up and Down Conversion of Photons with Modified Perturb and Observe MPPT Technique for Efficient Solar Energy Generation. Energy Procedia 2017, 117, 786–793. [Google Scholar] [CrossRef]
  9. Balato, M.; Costanzo, L.; Lo Schiavo, A.; Vitelli, M. Optimization of Both Perturb & Observe and Open Circuit Voltage MPPT Techniques for Resonant Piezoelectric Vibration Harvesters Feeding Bridge Rectifiers. Sens. Actuators A Phys. 2018, 278, 85–97. [Google Scholar] [CrossRef]
  10. Abdel-Salam, M.; El-Mohandes, M.-T.; Goda, M. An Improved Perturb-and-Observe Based MPPT Method for PV Systems under Varying Irradiation Levels. Sol. Energy 2018, 171, 547–561. [Google Scholar] [CrossRef]
  11. Ishaque, K.; Salam, Z.; Lauss, G. The Performance of Perturb and Observe and Incremental Conductance Maximum Power Point Tracking Method under Dynamic Weather Conditions. Appl. Energy 2014, 119, 228–236. [Google Scholar] [CrossRef]
  12. Putri, R.I.; Wibowo, S.; Rifa’i, M. Maximum Power Point Tracking for Photovoltaic Using Incremental Conductance Method. Energy Procedia 2015, 68, 22–30. [Google Scholar] [CrossRef] [Green Version]
  13. Sitbon, M.; Lineykin, S.; Schacham, S.; Suntio, T.; Kuperman, A. Online Dynamic Conductance Estimation Based Maximum Power Point Tracking of Photovoltaic Generators. Energy Convers. Manag. 2018, 166, 687–696. [Google Scholar] [CrossRef]
  14. Hossain, M.I.; Shafiullah, M.; Abido, M. VSC Controllers for Multiterminal HVDC Transmission System: A Comparative Study. Arab. J. Sci. Eng. 2020, 45, 6411–6422. [Google Scholar] [CrossRef]
  15. Haleem, N.M.; Rajapakse, A.D.; Gole, A.M.; Fernando, I.T. Investigation of Fault Ride-Through Capability of Hybrid VSC-LCC Multi-Terminal HVDC Transmission Systems. IEEE Trans. Power Deliv. 2019, 34, 241–250. [Google Scholar] [CrossRef]
  16. Alassi, A.; Bañales, S.; Ellabban, O.; Adam, G.; MacIver, C. HVDC Transmission: Technology Review, Market Trends and Future Outlook. Renew. Sustain. Energy Rev. 2019, 112, 530–554. [Google Scholar] [CrossRef]
  17. Li, Z.; Zhan, R.; Li, Y.; He, Y.; Hou, J.; Zhao, X.; Zhang, X.-P. Recent Developments in HVDC Transmission Systems to Support Renewable Energy Integration. Glob. Energy Interconnect. 2018, 1, 595–607. [Google Scholar] [CrossRef]
  18. Hossain, M.I.; Abido, M.A. Positive-Negative Sequence Current Controller for LVRT Improvement of Wind Farms Integrated MMC-HVDC Network. IEEE Access 2020, 8, 193314–193339. [Google Scholar] [CrossRef]
  19. Li, R.; Xu, L.; Holliday, D.; Page, F.; Finney, S.J.; Williams, B.W. Continuous Operation of Radial Multiterminal HVDC Systems Under DC Fault. IEEE Trans. Power Deliv. 2016, 31, 351–361. [Google Scholar] [CrossRef] [Green Version]
  20. Saad, H.; Mahseredjian, J.; Dennetière, S.; Nguefeu, S. Interactions Studies of HVDC–MMC Link Embedded in an AC Grid. Electr. Power Syst. Res. 2016, 138, 202–209. [Google Scholar] [CrossRef]
  21. Stamatiou, G.; Bongiorno, M. Power-Dependent Droop-Based Control Strategy for Multi-Terminal HVDC Transmission Grids. IET Gener. Transm. Distrib. 2016, 11, 383–391. [Google Scholar] [CrossRef]
  22. Beerten, J.; Cole, S.; Belmans, R. Modeling of Multi-Terminal VSC HVDC Systems With Distributed DC Voltage Control. IEEE Trans. Power Syst. 2014, 29, 34–42. [Google Scholar] [CrossRef] [Green Version]
  23. Wang, Y.; Zhao, C.; Guo, C.; Rehman, A.U. Impacts on Operational Characteristics of AC/DC System with Different Grid Integration Modes of Offshore Wind Farm via MMC-Based HVDC Transmission. J. Eng. 2019, 2019, 1900–1905. [Google Scholar] [CrossRef]
  24. Wang, Y.; Zhao, C.; Guo, C.; Rehman, A.U. Dynamic Modeling and Small Signal Stability Analysis of PMSG-Based Wind Farm with MMC-HVDC System. CSEE J. Power Energy Syst. 2019, 6, 226–235. [Google Scholar] [CrossRef]
  25. Li, X.; Guo, L.; Hong, C.; Zhang, Y.; Li, Y.W.; Wang, C. Hierarchical Control of Multiterminal DC Grids for Large-Scale Renewable Energy Integration. IEEE Trans. Sustain. Energy 2018, 9, 1448–1457. [Google Scholar] [CrossRef]
  26. Wang, Y.; Zhao, C.; Guo, C. Small Signal Stability and Oscillation Suppression Method for Islanded Double Fed Induction Generator-Based Wind Farm Integrated by Modular Multilevel Converter Based HVDC System. Diangong Jishu Xuebao/Trans. China Electrotech. Soc. 2019, 34, 2116–2129. [Google Scholar] [CrossRef]
  27. Lyu, J.; Cai, X.; Molinas, M. Optimal Design of Controller Parameters for Improving the Stability of MMC-HVDC for Wind Farm Integration. IEEE J. Emerg. Sel. Top. Power Electron. 2018, 6, 40–53. [Google Scholar] [CrossRef] [Green Version]
  28. Raza, M.; Peñalba, M.A.; Gomis-Bellmunt, O. Short Circuit Analysis of an Offshore AC Network Having Multiple Grid Forming VSC-HVDC Links. Int. J. Electr. Power Energy Syst. 2018, 102, 364–380. [Google Scholar] [CrossRef]
  29. Cui, S.; Lee, H.-J.; Jung, J.-J.; Lee, Y.; Sul, S.-K. A Comprehensive AC-Side Single-Line-to-Ground Fault Ride Through Strategy of an MMC-Based HVDC System. IEEE J. Emerg. Sel. Top. Power Electron. 2018, 6, 1021–1031. [Google Scholar] [CrossRef]
  30. Beza, M.; Bongiorno, M. Identification of Resonance Interactions in Offshore-Wind Farms Connected to the Main Grid by MMC-Based HVDC System. Int. J. Electr. Power Energy Syst. 2019, 111, 101–113. [Google Scholar] [CrossRef]
  31. Jing, Y.; Li, R.; Xu, L.; Wang, Y. Enhanced AC Voltage and Frequency Control on Offshore MMC Station for Wind Farm. J. Eng. 2017, 2017, 1264–1268. [Google Scholar] [CrossRef]
  32. Alam, M.S.; Abido, M.A.Y. Fault Ride-through Capability Enhancement of Voltage Source Converter-High Voltage Direct Current Systems with Bridge Type Fault Current Limiters. Energies 2017, 10, 1898. [Google Scholar] [CrossRef] [Green Version]
  33. Alam, M.; Abido, M.; Hussein, A.; El-Amin, I. Fault Ride through Capability Augmentation of a DFIG-Based Wind Integrated VSC-HVDC System with Non-Superconducting Fault Current Limiter. Sustainability 2019, 11, 1232. [Google Scholar] [CrossRef]
  34. Xu, L.; Andersen, B.R. Grid Connection of Large Offshore Wind Farms Using HVDC. Wind Energy 2006, 9, 371–382. [Google Scholar] [CrossRef]
  35. Nanou, S.; Papathanassiou, S. Evaluation of a Communication-Based Fault Ride-through Scheme for Offshore Wind Farms Connected through High-Voltage DC Links Based on Voltage Source Converter. IET Renew. Power Gener. 2015, 9, 882–891. [Google Scholar] [CrossRef]
  36. Cui, S.; Lee, H.-J.; Jung, J.-J.; Lee, Y.; Sul, S.-K. A Comprehensive AC Side Single Line to Ground Fault Ride through Strategy of a Modular Multilevel Converter for HVDC System. In Proceedings of the 2015 IEEE Energy Conversion Congress and Exposition (ECCE), Montreal, QC, Canada, 20–24 September 2015; pp. 5378–5385. [Google Scholar]
  37. Oguma, K.; Akagi, H. Low-Voltage-Ride-Through (LVRT) Control of an HVDC Transmission System Using Two Modular Multilevel DSCC Converters. IEEE Trans. Power Electron. 2017, 32, 5931–5942. [Google Scholar] [CrossRef]
  38. Olowookere, O.; Skarvelis-Kazakos, S.; Habtay, Y.; Woodhead, S. AC Fault Ride through of Modular Multilevel Converter VSC-HVDC Transmission Systems. In Proceedings of the 2015 50th International Universities Power Engineering Conference (UPEC), Stoke-on-Trent, UK, 1–4 September 2015; pp. 1–6. [Google Scholar]
  39. Feltes, C.; Wrede, H.; Koch, F.W.; Erlich, I. Enhanced Fault Ride-Through Method for Wind Farms Connected to the Grid Through VSC-Based HVDC Transmission. IEEE Trans. Power Syst. 2009, 24, 1537–1546. [Google Scholar] [CrossRef]
  40. Hossain, M.I.; Abido, M.A. Active Power Control of PV-Battery Connected MMC-HVDC System for FRT Support. Appl. Sci. 2020, 10, 7186. [Google Scholar] [CrossRef]
  41. Hossain, M.I.; Abido, M.A. SCIG Based Wind Energy Integrated Multiterminal MMC-HVDC Transmission Network. Sustainability 2020, 12, 3622. [Google Scholar] [CrossRef]
  42. Moawwad, A.; El Moursi, M.S.; Xiao, W. Advanced Fault Ride-Through Management Scheme for VSC-HVDC Connecting Offshore Wind Farms. IEEE Trans. Power Syst. 2016, 31, 4923–4934. [Google Scholar] [CrossRef]
  43. Yazdani, A.; Iravani, R. Voltage-Sourced Converters in Power Systems: Modeling, Control, and Applications; Wiley-IEEE Press: Hoboken, NJ, USA, 2010; ISBN 9780470551578. [Google Scholar]
  44. Sharifabadi, K.; Harnefors, L.; Nee, H.P.; Norrga, S.; Teodorescu, R. Design, Control and Application of Modular Multilevel Converters for HVDC Transmission Systems; Wiley: Hoboken, NJ, USA, 2016; ISBN 9781118851555. [Google Scholar]
  45. Martinez-Rodrigo, F.; Ramirez, D.; Rey-Boue, A.B.; De Pablo, S.; Herrero-De Lucas, L.C. Modular Multilevel Converters: Control and Applications. Energies 2017, 10, 1709. [Google Scholar] [CrossRef]
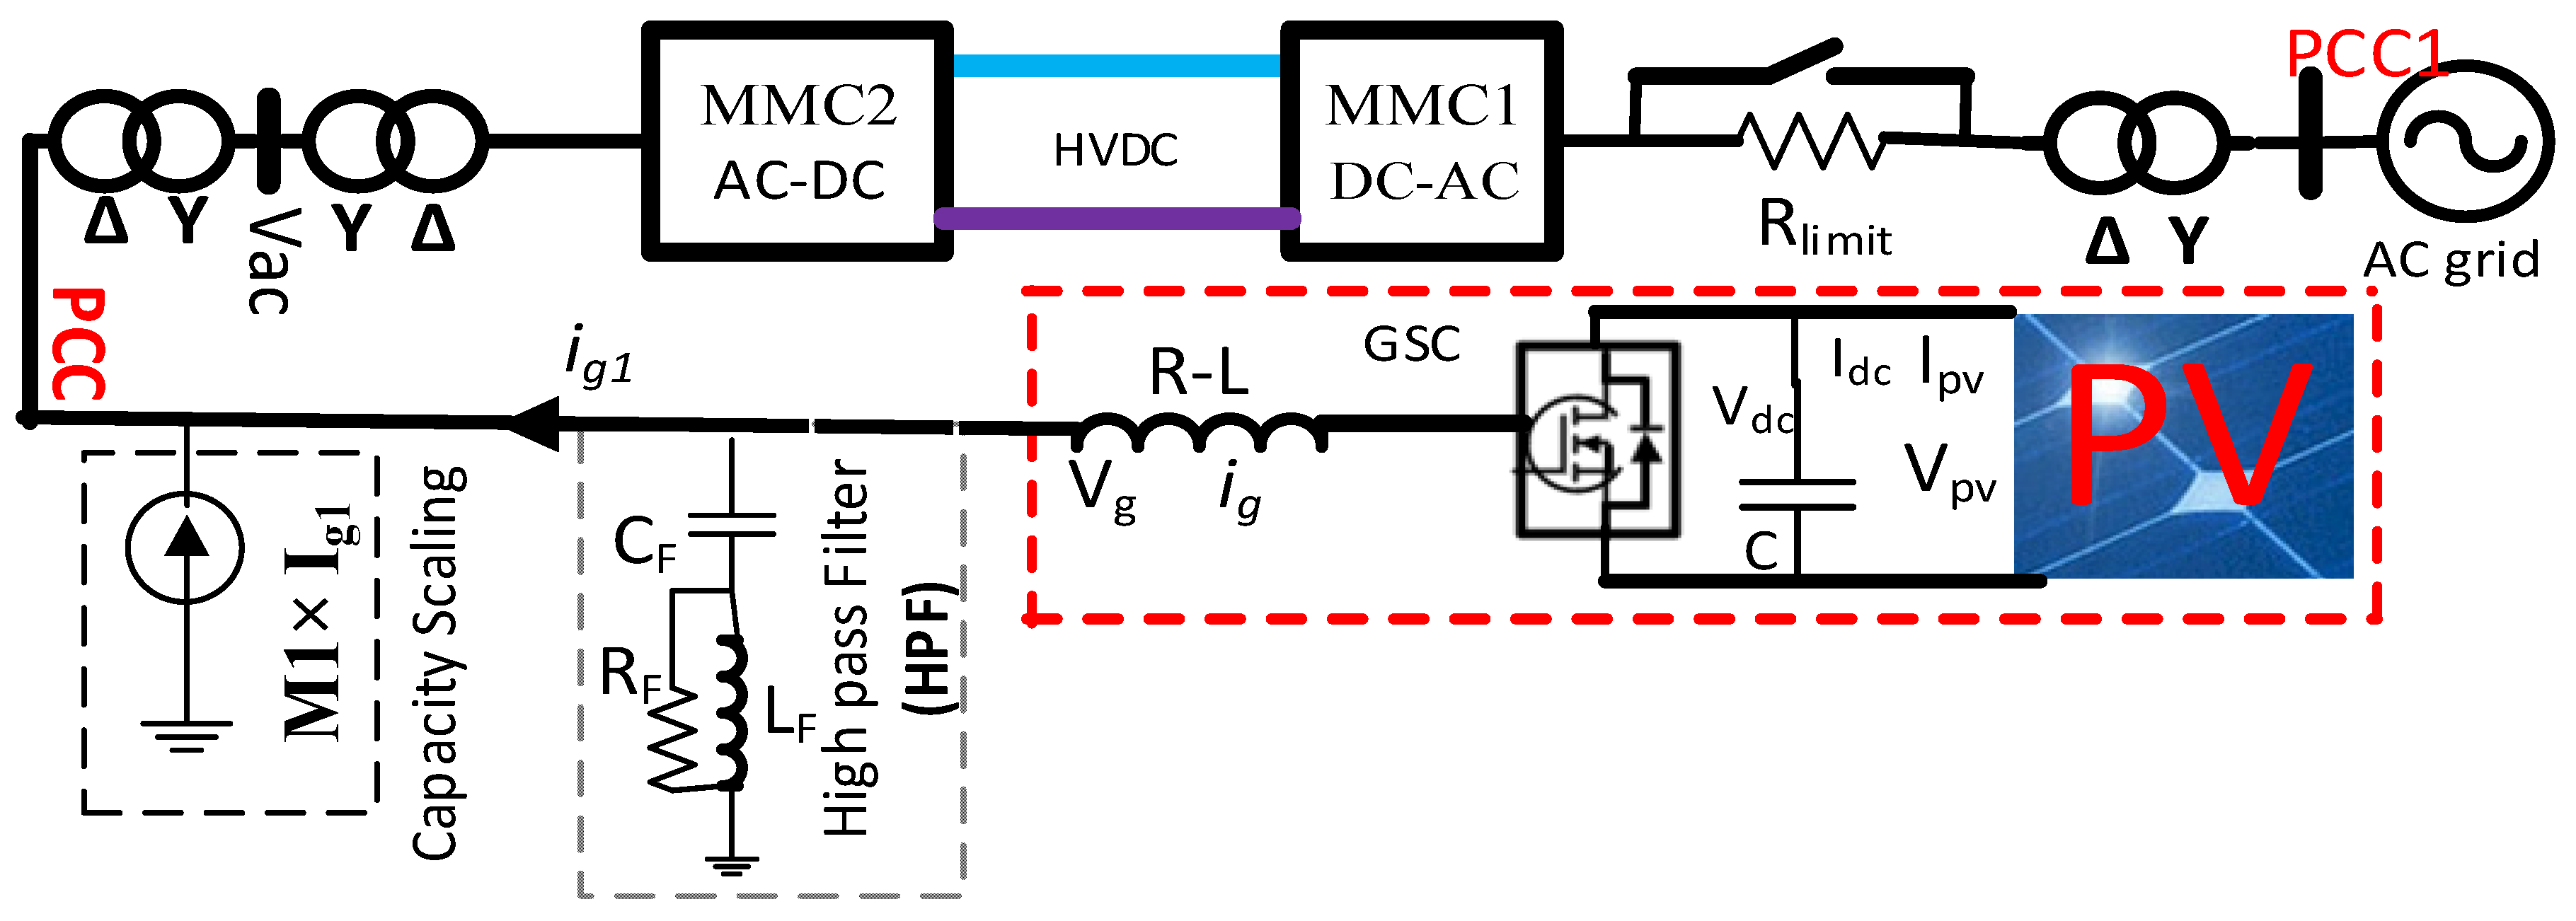
Figure 1. Solar energy included the MMC-HVDC transmission network.
Sustainability 15 00253 g001
Figure 2. Array P-V characteristics under variable temperature and irradiance.
Sustainability 15 00253 g002
Figure 3. PV side converter control.
Sustainability 15 00253 g003
Figure 4. DFIG-based wind energy included an MMC-HVDC transmission network.
Sustainability 15 00253 g004
Figure 5. Wind turbine characteristics of DFIG.
Sustainability 15 00253 g005
Figure 6. DFIG rotor side converter control.
Sustainability 15 00253 g006
Figure 7. SCIG-based wind energy incorporated MMC-HVDC transmission network.
Sustainability 15 00253 g007
Figure 8. SCIG wind generator side converter control.
Sustainability 15 00253 g008
Figure 9. PMSG-based wind energy incorporated MMC-HVDC transmission network.
Sustainability 15 00253 g009
Figure 10. PMSG wind generator side converter control.
Sustainability 15 00253 g010
Figure 11. MMC1 equivalent circuit.
Sustainability 15 00253 g011
Figure 12. MMC2 equivalent circuit.
Sustainability 15 00253 g012
Figure 13. Reference current generation with current limiter.
Sustainability 15 00253 g013
Figure 14. Outer current control and arm circulating current control.
Sustainability 15 00253 g014
Figure 15. dSPACE-RTDS interface.
Sustainability 15 00253 g015
Figure 16. MMC1 controller in dSPACE-1104 interfaced with RTDS.
Sustainability 15 00253 g016
Figure 17. (a) PV-based solar (b) DFIG (c) SCIG (d) PMSG-based wind energy integration runtime interface in RTDS-RSCAD.
Sustainability 15 00253 g017aSustainability 15 00253 g017b
Figure 18. MMC1-HVDC link voltage and MMC2-AC side voltage control.
Sustainability 15 00253 g018
Figure 19. Arm current without and with the circulating arm current controller.
Sustainability 15 00253 g019
Figure 20. Submodule capacitor voltages in arm-1 without SSA.
Sustainability 15 00253 g020
Figure 21. Submodule capacitor voltages in arm-1 with SSA.
Sustainability 15 00253 g021
Figure 22. DC link voltage of PV-VSC in MATLAB/SIMULINK during solar radiation change.
Sustainability 15 00253 g022
Figure 23. Solar radiation and real power change in MMC1 and MMC2 in RTDS-dSPACE.
Sustainability 15 00253 g023
Figure 24. DC link voltage of PV-VSC in RTDS-dSPACE during solar radiation change.
Sustainability 15 00253 g024
Figure 25. PV side VSC current controller in MATLAB/SIMULINK during solar radiation change.
Sustainability 15 00253 g025
Figure 26. PV side VSC current controller in RTDS-dSPACE during solar radiation change.
Sustainability 15 00253 g026
Figure 27. Temperature and PV power in MATLAB/SIMULINK.
Sustainability 15 00253 g027
Figure 28. Temperature and real power change in MMC1 and MMC2 in RTDS-dSPACE.
Sustainability 15 00253 g028
Figure 29. DC link voltage of PV-VSC in MATLAB/SIMULINK during temperature change.
Sustainability 15 00253 g029
Figure 30. DC link voltage of PV-VSC in RTDS-dSPACE during temperature change.
Sustainability 15 00253 g030
Figure 31. Dq current controller of PV-VSC in MATLAB/SIMULINK during temperature change.
Sustainability 15 00253 g031
Figure 32. dq current controller of PV-VSC in RTDS-dSPACE during temperature change.
Sustainability 15 00253 g032
Figure 33. Stator and rotor terminal power flow of DFIG during wind speed variation.
Sustainability 15 00253 g033
Figure 34. Optimal torque tracking of RSC.
Sustainability 15 00253 g034
Figure 35. Stator and rotor terminal power flow of one-unit DFIG during wind speed variation in RTDS-dSPACE.
Sustainability 15 00253 g035
Figure 36. Wind and generator speed and real power change in MMC1 and MMC2 in RTDS-dSPACE.
Sustainability 15 00253 g036
Figure 37. Reference and actual dq axis current of RSC.
Sustainability 15 00253 g037
Figure 38. dq. Dq current controller of RSC in RTDS-dSPACE during wind speed change.
Sustainability 15 00253 g038
Figure 39. Stator terminal power flow of SCIG during wind speed variation in MATLAB/SIMULINK.
Sustainability 15 00253 g039
Figure 40. Peak torque tracking of machine side converter (MSC) of SCIG.
Sustainability 15 00253 g040
Figure 41. Wind and generator speed and real power change in MMC1 and MMC2 in RTDS-dSPACE.
Sustainability 15 00253 g041
Figure 42. Reference and actual dq axis current of MSC.
Sustainability 15 00253 g042
Figure 43. dq current controller of MSC in RTDS-dSPACE during wind speed change.
Sustainability 15 00253 g043
Figure 44. Stator terminal power flow of PMSG during wind speed variation.
Sustainability 15 00253 g044
Figure 45. Torque tracking of MSC of PMSG.
Sustainability 15 00253 g045
Figure 46. Wind and generator speed and real power change in MMC1 and MMC2 in RTDS-dSPACE.
Sustainability 15 00253 g046
Figure 47. Reference and actual dq axis current of MSC.
Sustainability 15 00253 g047
Figure 48. dq. Dq current controller of MSC in RTDS-dSPACE during wind speed change.
Sustainability 15 00253 g048
Figure 49. An 80% voltage drop at PCC1 throughout SLG, DLG, and 3LG faults.
Sustainability 15 00253 g049
Figure 50. MMC1 real and reactive power, HVDC link voltage in the course of SLG, DLG, and 3LG faults.
Sustainability 15 00253 g050
Figure 51. A 50% voltage drop at PCC1 throughout SLG, DLG, and 3LG faults.
Sustainability 15 00253 g051
Figure 52. MMC1 real and reactive power, HVDC link voltage in the course of SLG, DLG, and 3LG faults.
Sustainability 15 00253 g052
Disclaimer/Publisher’s Note: The statements, opinions and data contained in all publications are solely those of the individual author(s) and contributor(s) and not of MDPI and/or the editor(s). MDPI and/or the editor(s) disclaim responsibility for any injury to people or property resulting from any ideas, methods, instructions or products referred to in the content.