China’s Industrial TFPs at the Prefectural Level and the Law of Their Spatial–Temporal Evolution
Abstract
:1. Introduction
2. Model Settings and Methods Description
2.1. The Production Function Model for the Industrial Sectors of China’s Prefectural Cities
2.2. Settings of Spatiotemporal Weight Matrix
2.3. Method of Calculating Industrial TFP of China’s Prefectural Cities: Based on the Improved Solow Residual Method
2.4. Method of Analyzing the Spatial Differences and Spatiotemporal Evolution Law of China’s Industrial TFPs at the Prefectural Level
2.4.1. Dagum’s Gini Coefficient
2.4.2. Kernel Density Estimation
3. Data Processing of Related Variables and Their Description Statistics
4. The Calculation Results of China’s Industrial TFPs at the Prefectural Level and the Analysis of the Law of Their Spatiotemporal Evolutions
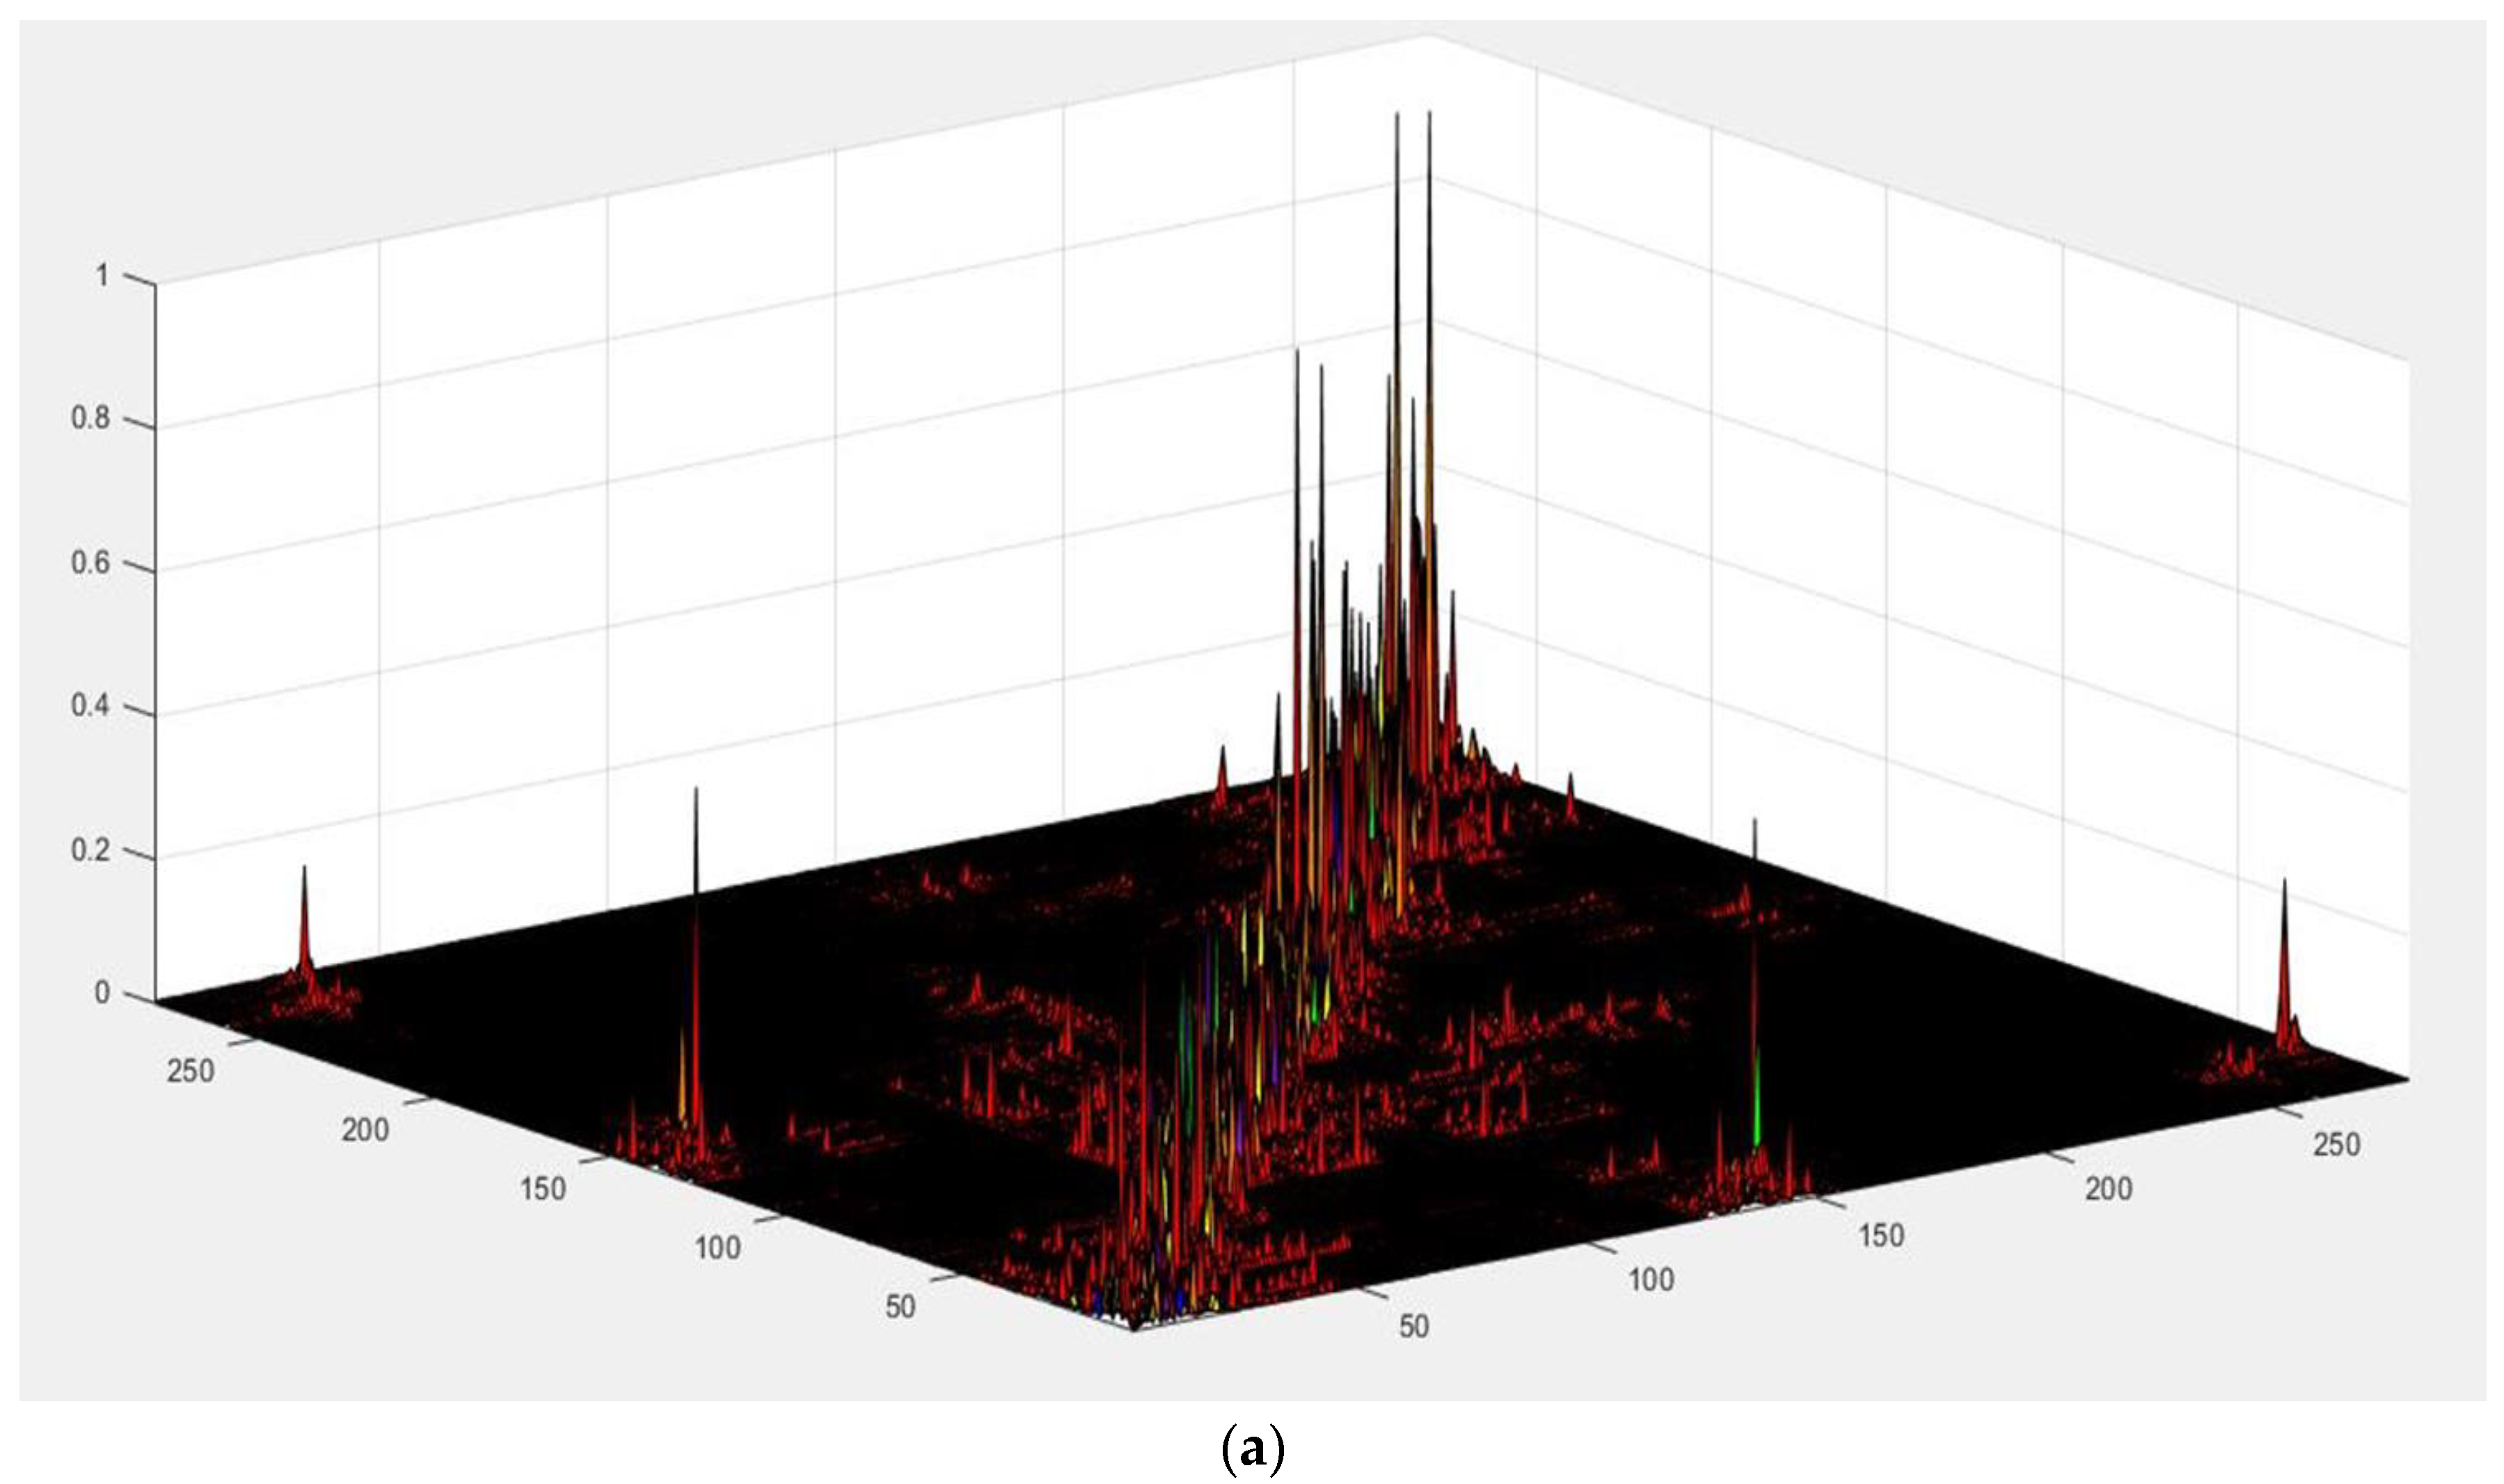
4.1. The Spatial and Temporal Weight Matrices
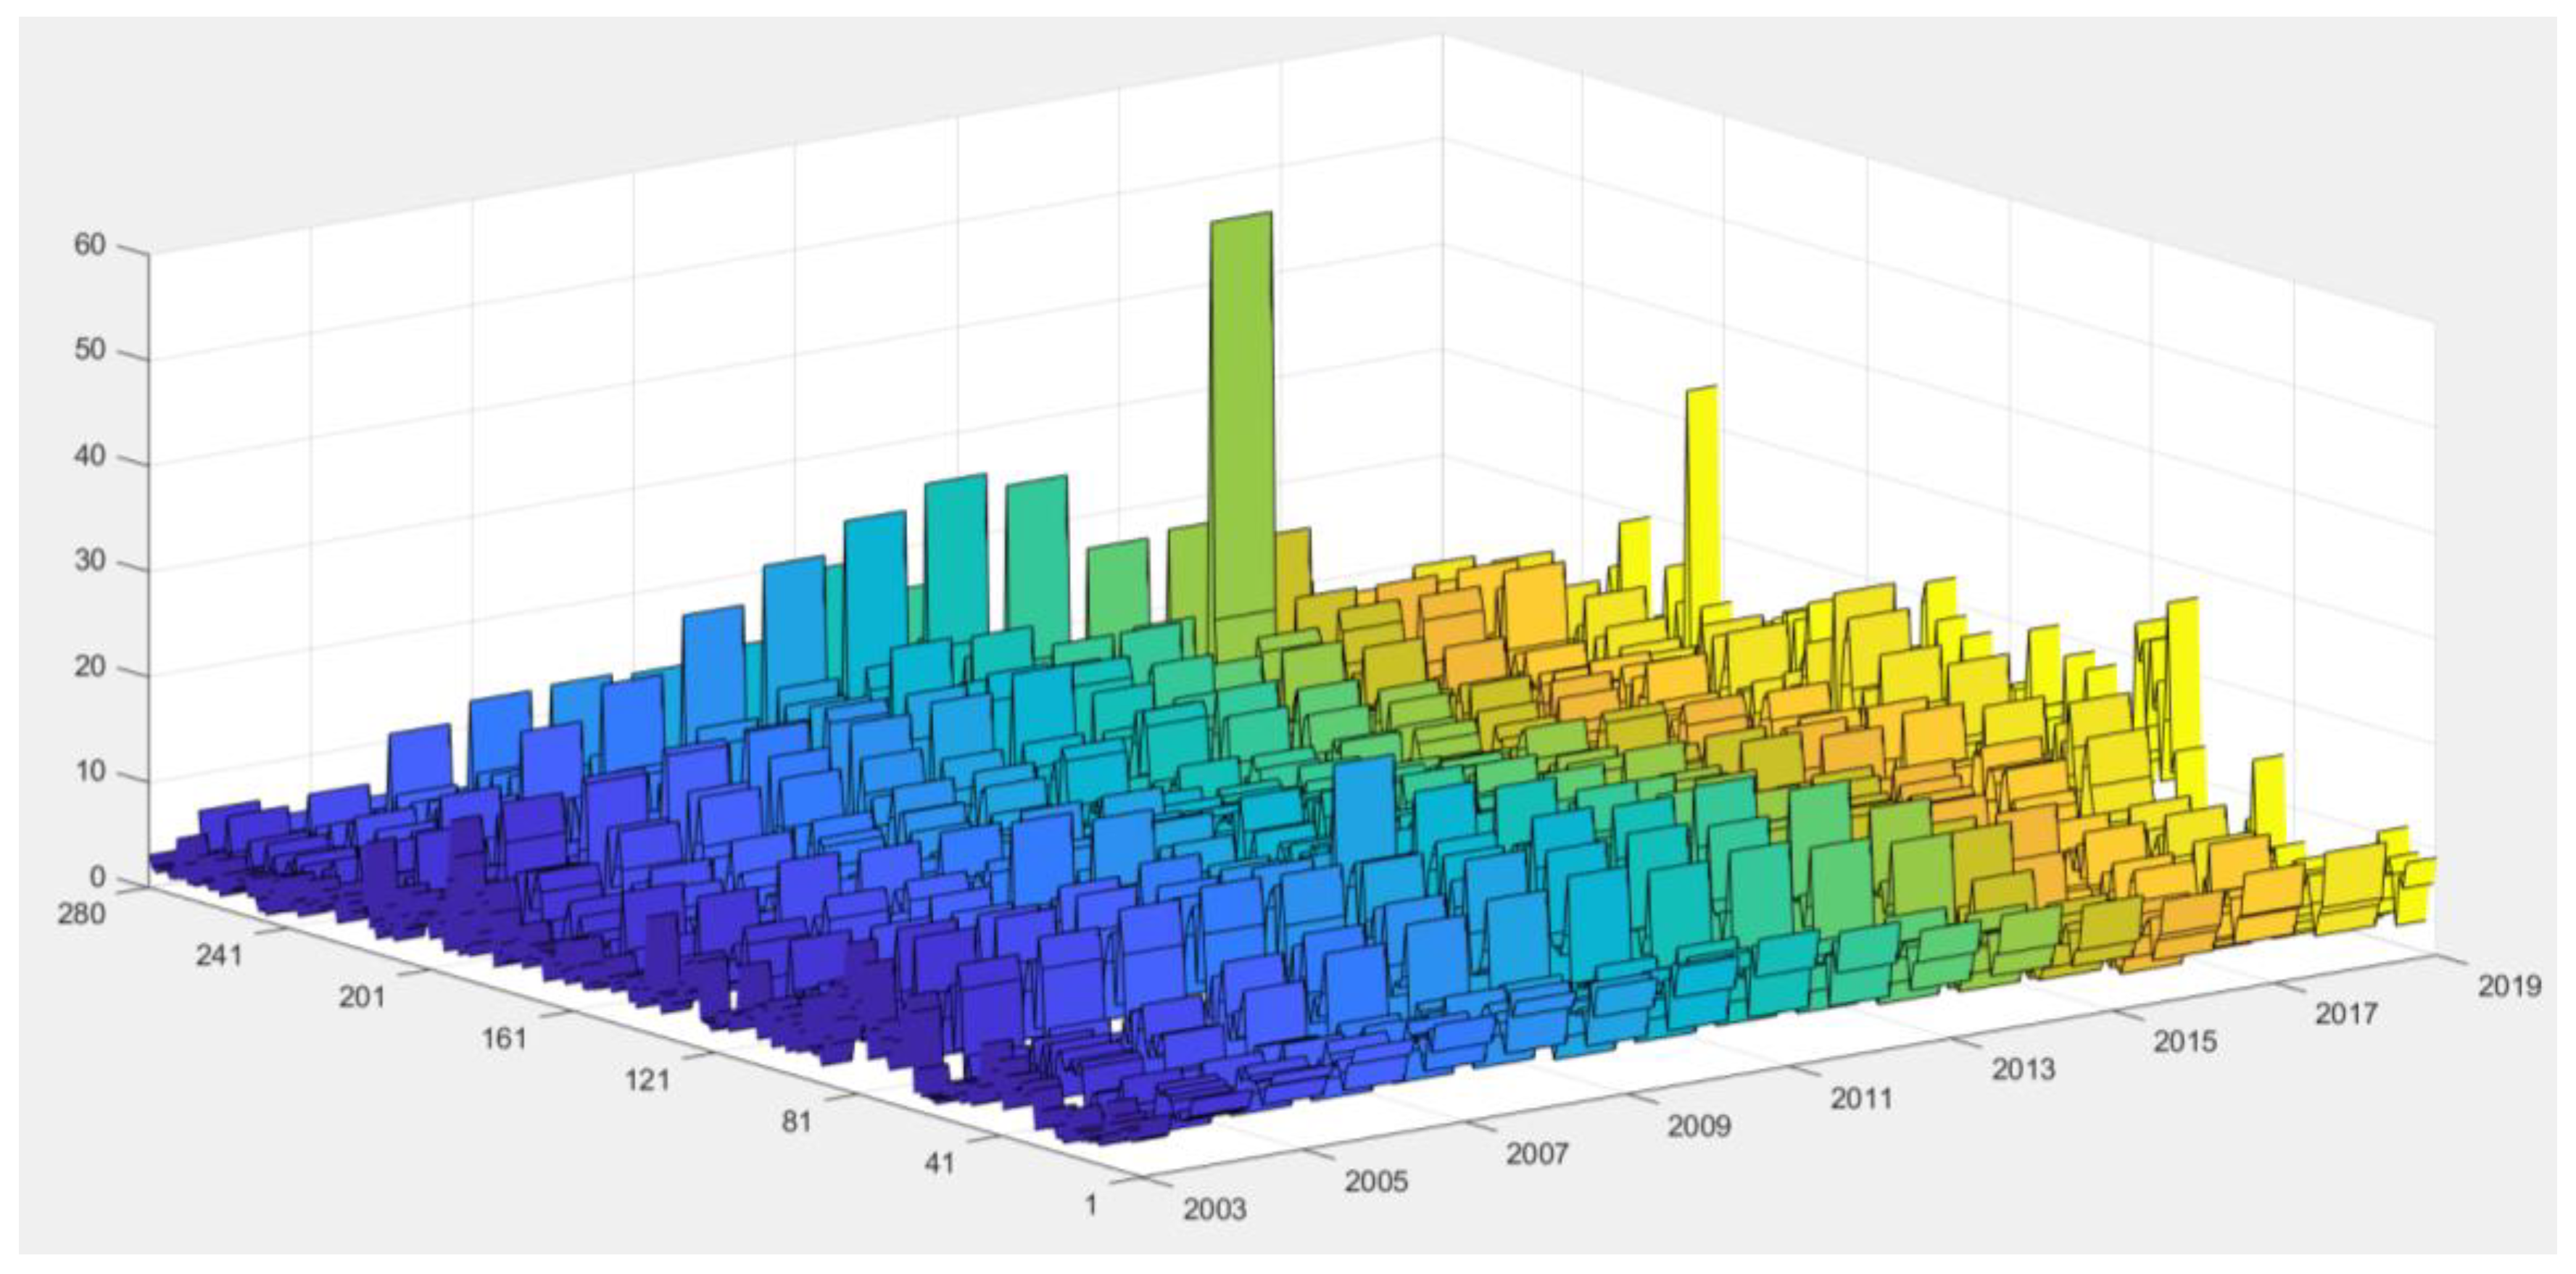
4.2. Selection of the Optimal Estimated Model and Calculation of China’s Industrial TFPs at the Prefectural Level
4.3. The Spatiotemporal Evolution Law of China’s Industrial TFPs at the Prefectural Level
- (1)
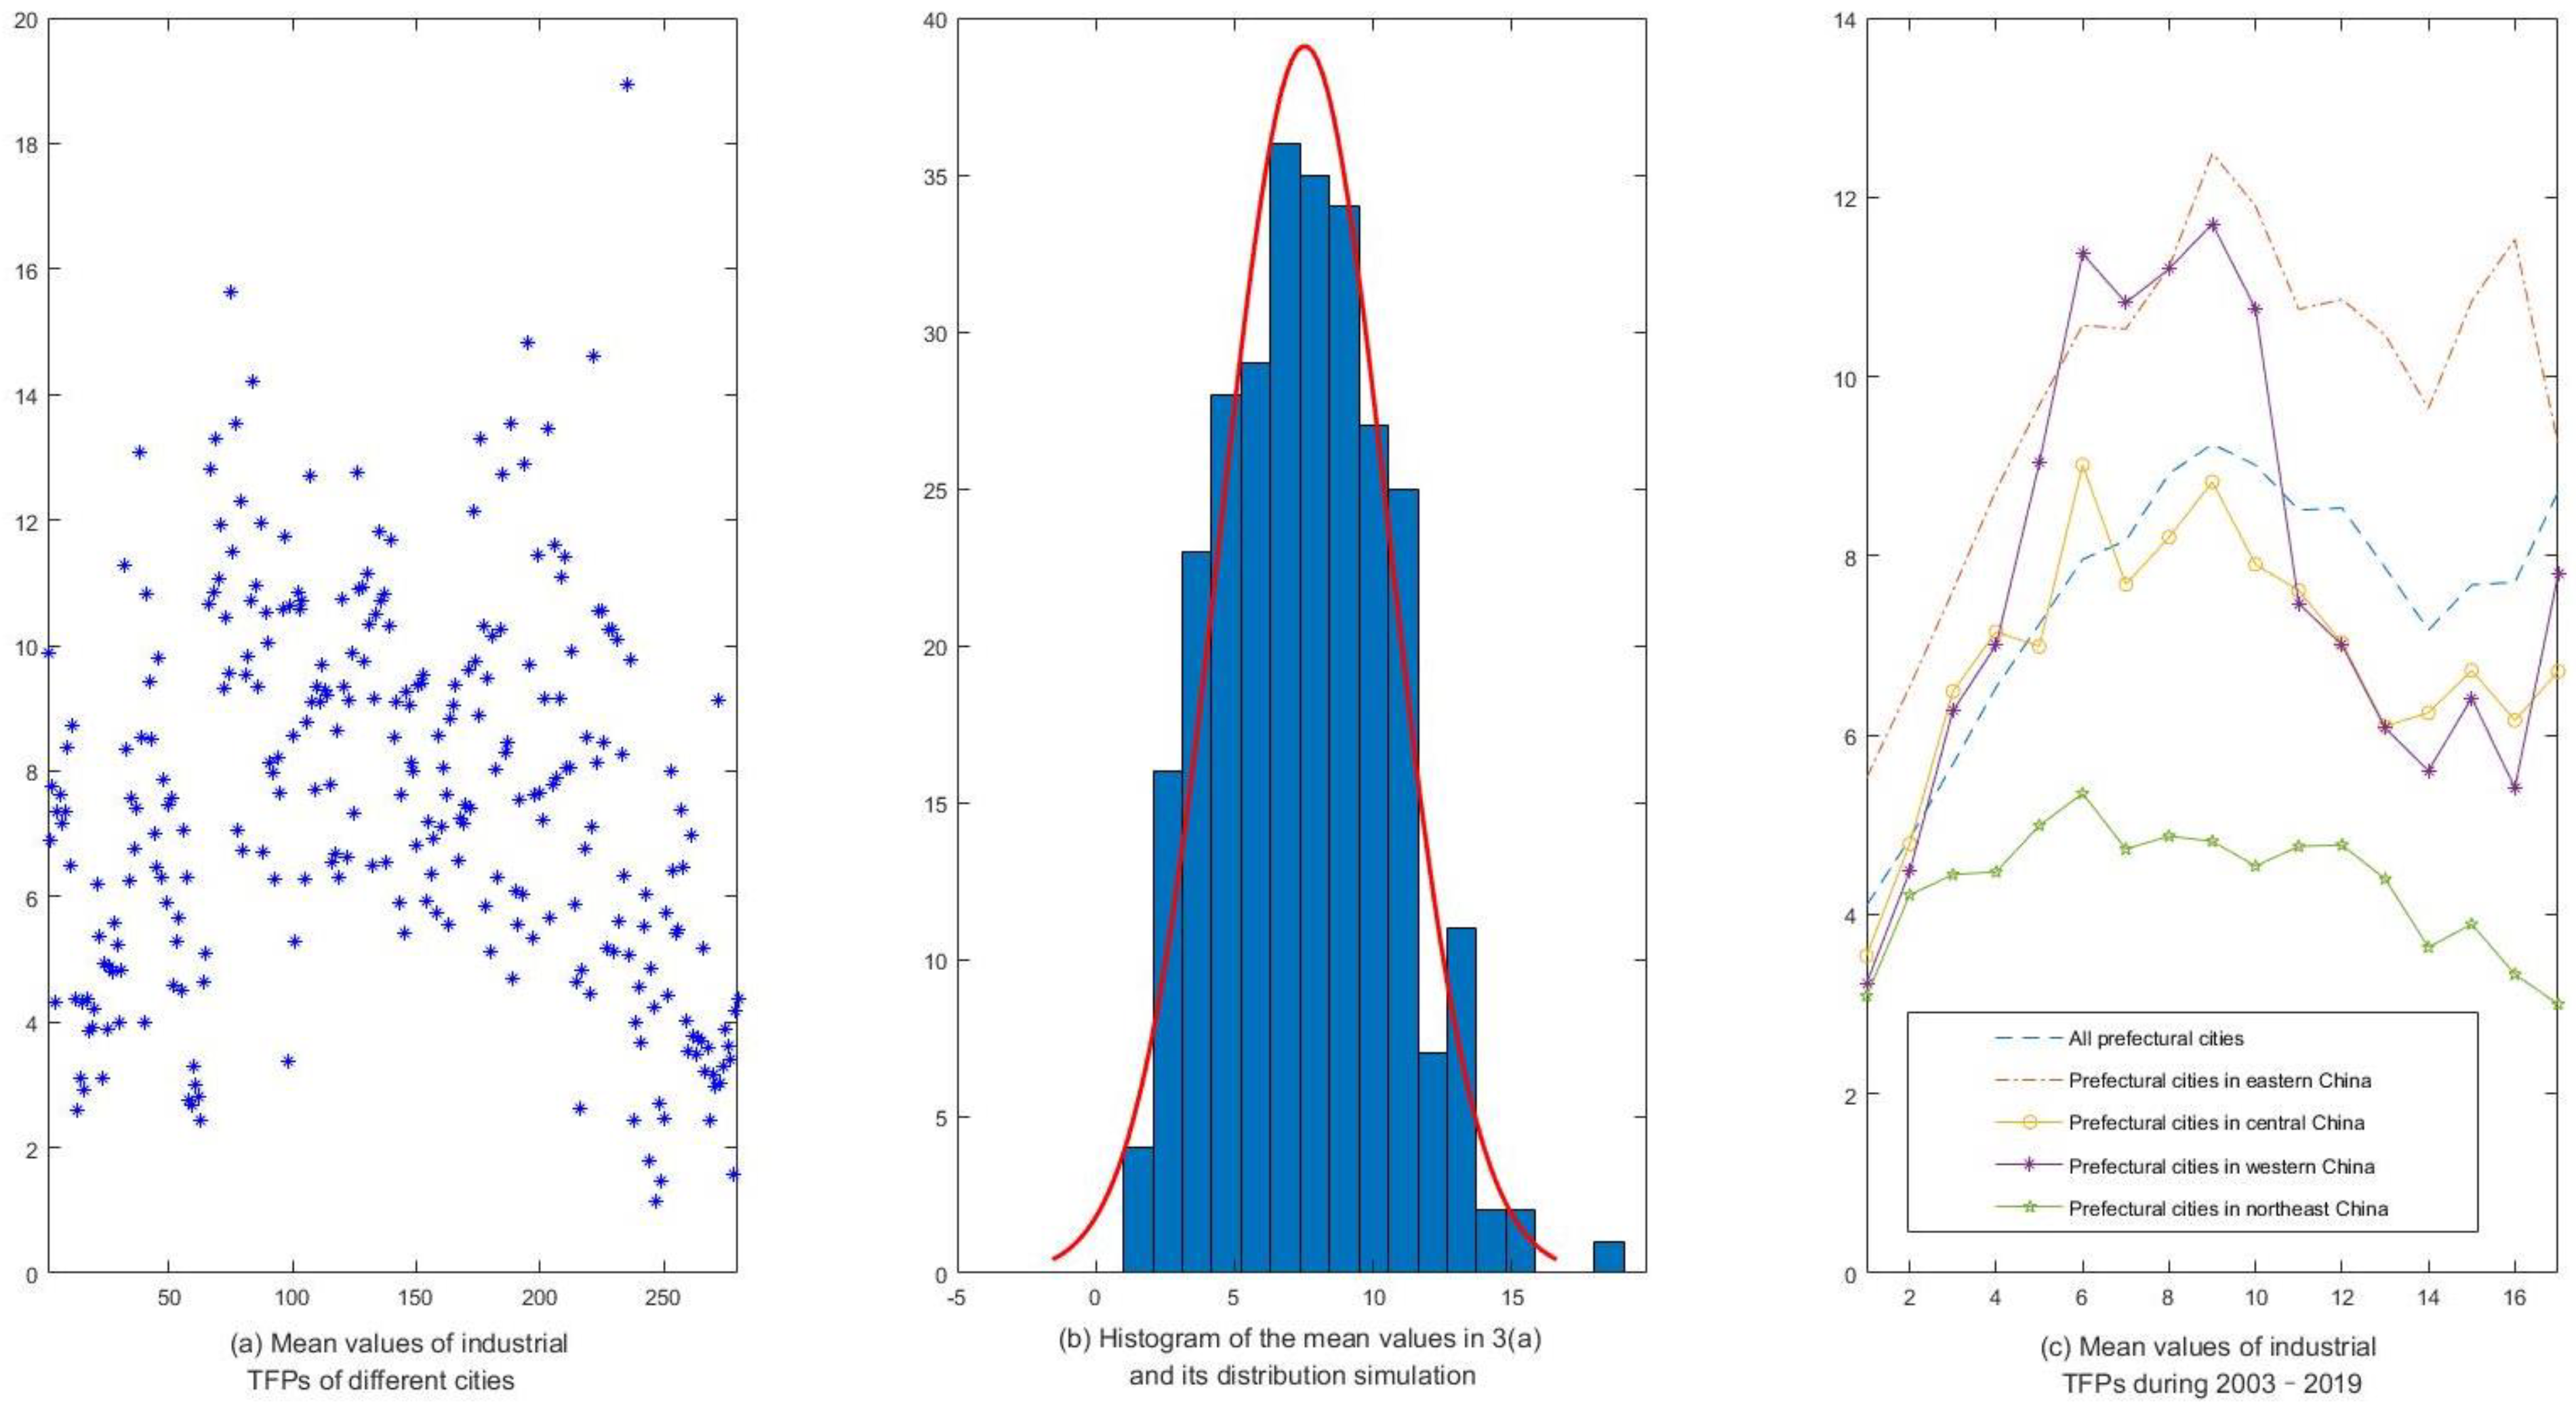
- There is an apparent spatial difference among China’s industrial TFPs at the prefectural level; it is best in eastern China and poorest in northeast China. Figure 3 below shows the mean value of the industrial TFPs at the prefectural level by region or period, where subgraph (a) shows the average industrial TFPs of the 280 prefectural cities, subgraph (b) shows the histogram of the average industrial TFPs in subgraph (a) and its simulation of normal distribution, and the subgraph (c) shows the average industrial TFPs in the year from 2003 to 2019. From Figure 3a, there is a significant spatial difference in the mean value of China’s industrial TFPs at the prefectural level, and its range is about 1~19. From Figure 3b, the mean value of China’s industrial TFPs at the prefectural level has an inevitable concentration trend. There are 156 cities with an average industrial TFP between 5 and 10, accounting for 55.71% of all the prefectural cities. From Figure 3c, during 2003–2019, the mean values of industrial TFPs of the prefectural cities in eastern China are higher than the mean values of the 280 prefectural cities, the mean values of industrial TFPs of the prefectural cities in northeast China are lower than the mean values of all the prefectural cities, and the mean values of the industrial TFPs of the prefectural cities in central and western China fluctuate considerably. From the perspective of development trends, the industrial TFPs of China’s prefectural cities show a trend of first rising, then declining, and then slowly recovering, where the recovery and development trends are apparent in central and western China recently, and there is still a downward trend in eastern and northeastern China in recent years.
- (2)
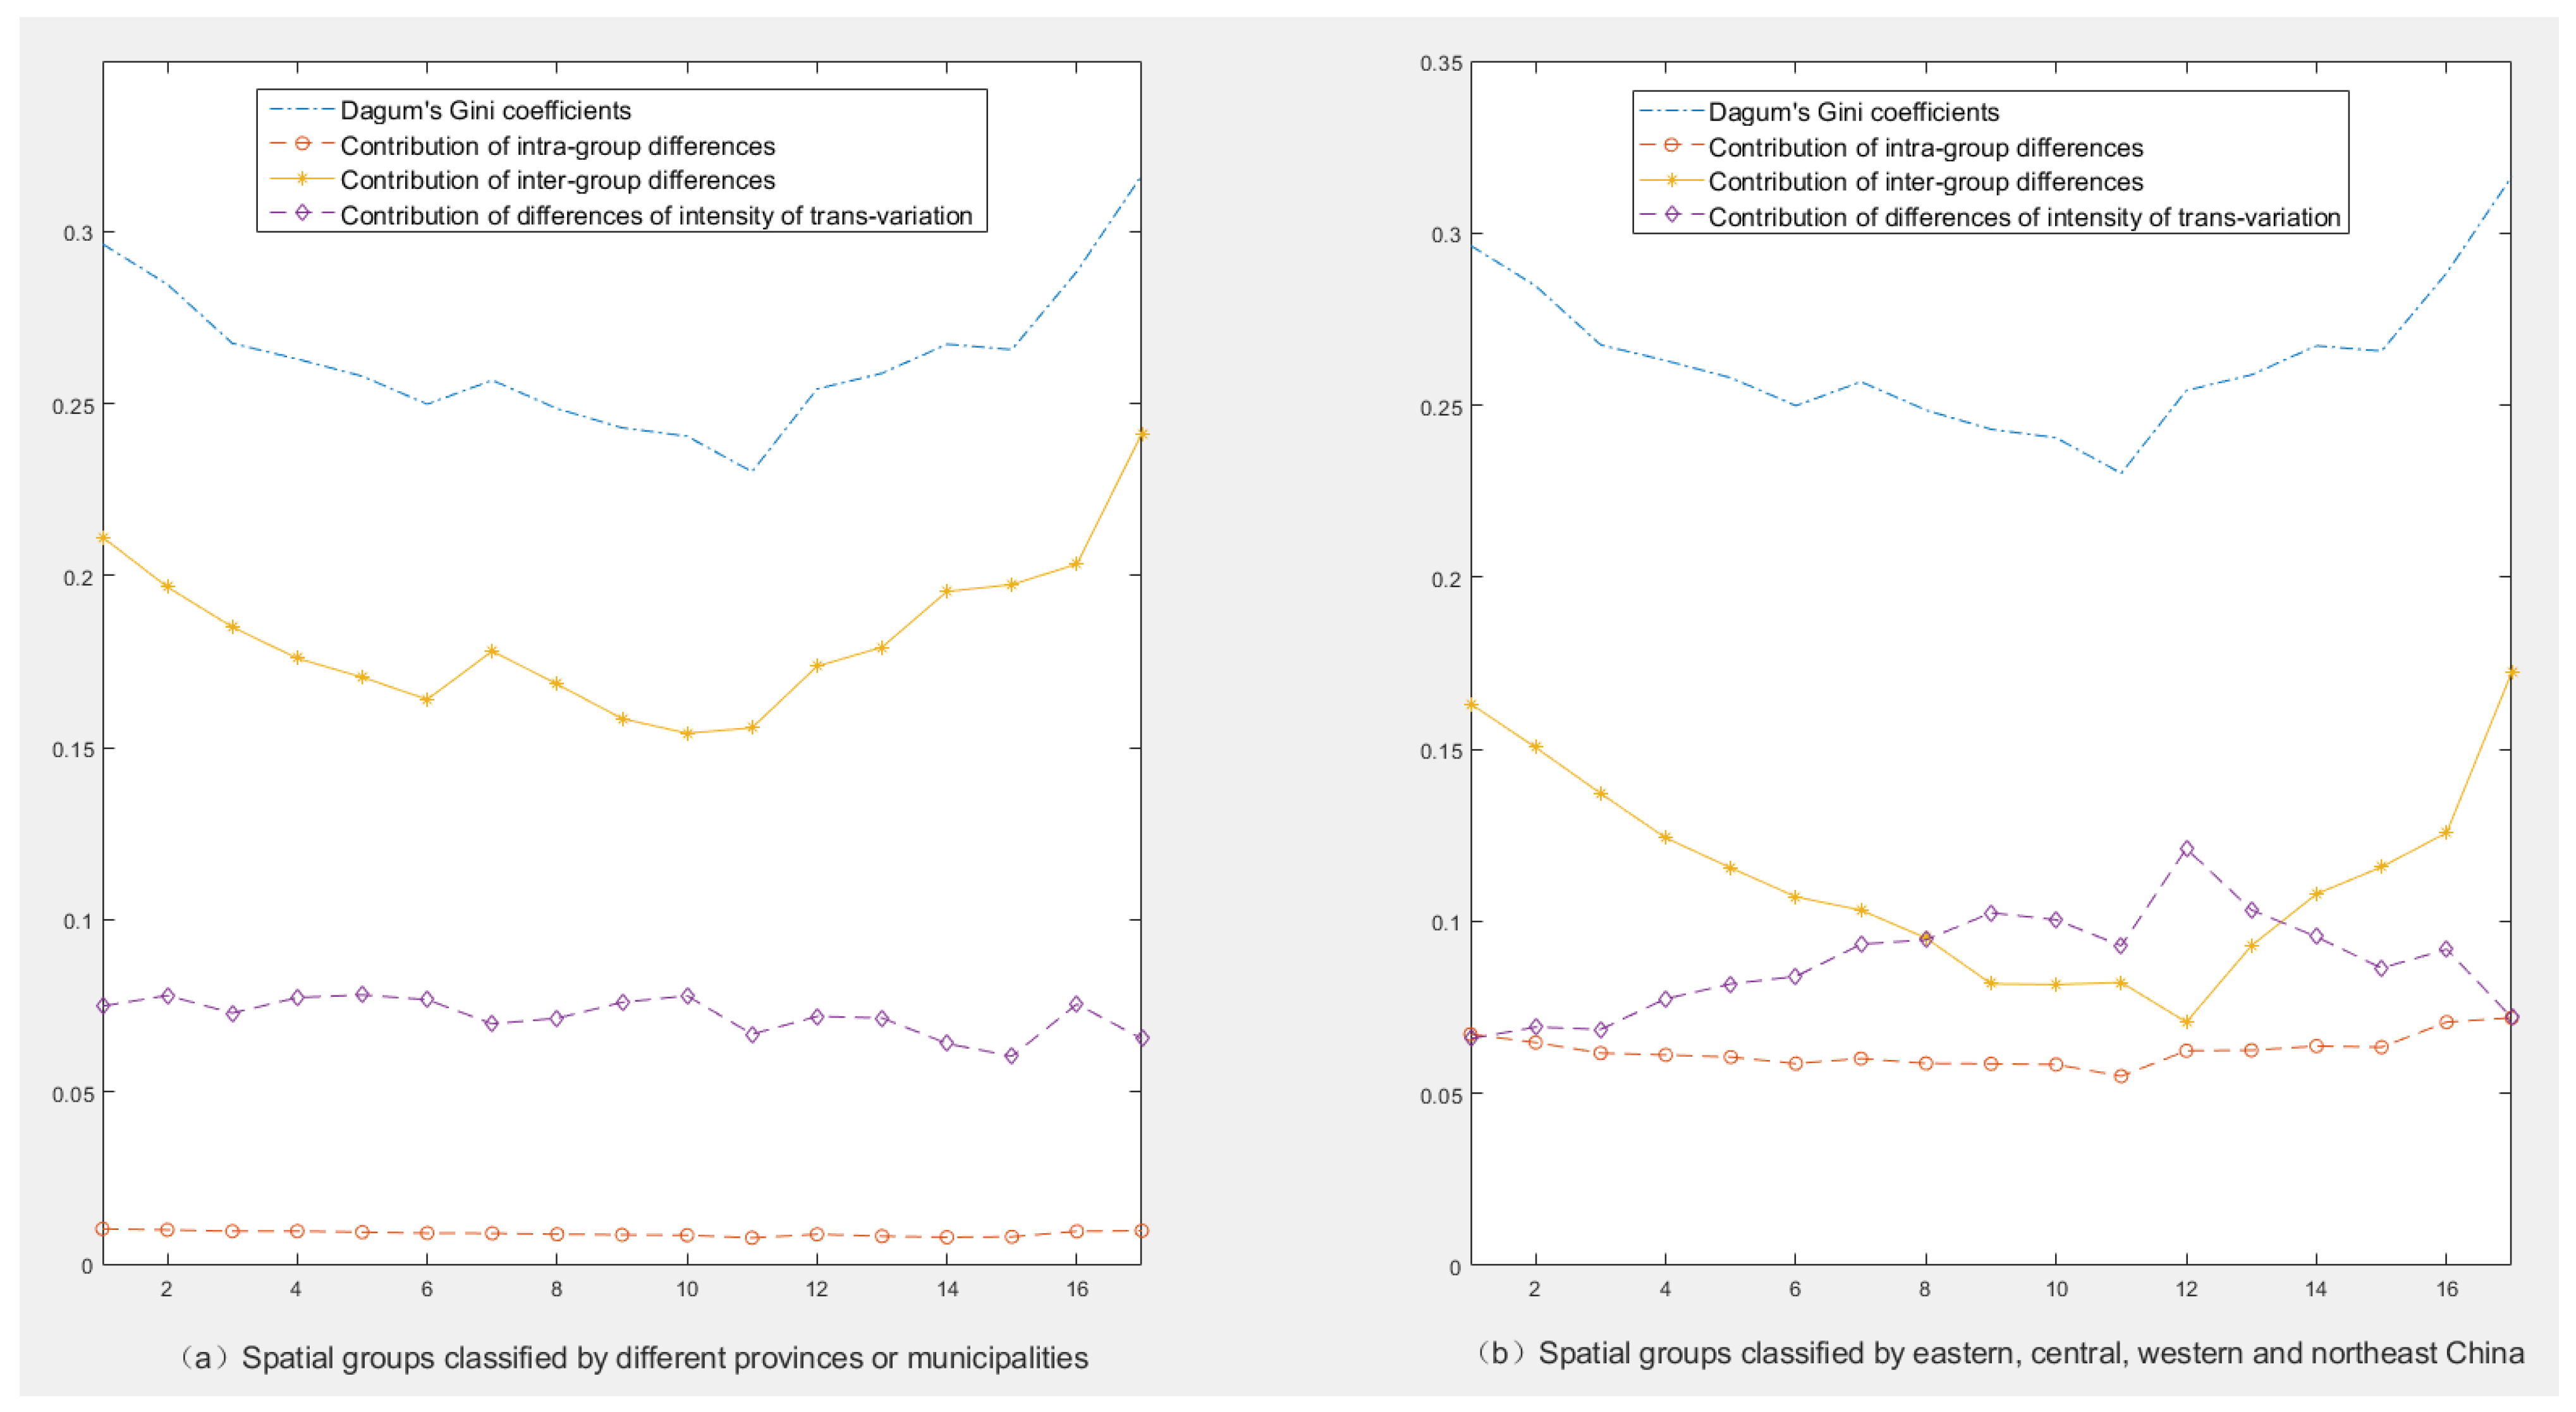
- The spatial difference level of China’s industrial TFPs at the prefectural level presents a general development trend of firstly decreasing and then rising, with a relatively lower contribution of intra-group differences, while the somewhat higher contribution of both the inter-group differences and the intensity of trans-variation differences. Figure 4 shows the Dagum’s Gini coefficients of China’s industrial TFPs at the prefectural level and their contributions originating from three parts, including the intra-group difference, the inter-group difference, and the difference in intensity of trans-variation. It is worth noting that the spatial groups in Figure 4a are classified by the prefectural cities belonging to different provinces or municipalities, while the spatial groups in Figure 4b are classified by the prefectural cities belonging to eastern, central, western, or northeast China. In Figure 4a, the overall Gini coefficient and the contribution part from the inter-group difference show U-shaped trends of firstly declining and then rising. The contribution part from the inter-group difference is higher than the contribution part separately from the intra-group difference and the difference in intensity of trans-variation. Moreover, the changes in the contributions from the intra-group difference and the difference in intensity of trans-variation are relatively gentle. In Figure 4b, the overall Gini coefficient and the contribution part from the inter-group difference also show the same trends as in Figure 4a. In contrast, the contributions from the inter-group difference and the difference in intensity of trans-variation are higher and fluctuate more than the contribution from the third part. Comparing Figure 4a with Figure 4b, under the different classifications of the spatial groups, the overall Gini coefficient is the same, and the contribution of the difference in intensity of trans-variation is also almost the same. However, the contribution from the intra-group differences is higher under the spatial groups classified according to eastern, central, western, and northeast China. In comparison, the contribution from the inter-group differences is higher on the condition of the spatial groups divided by the provincial administrative regions.
- (3)
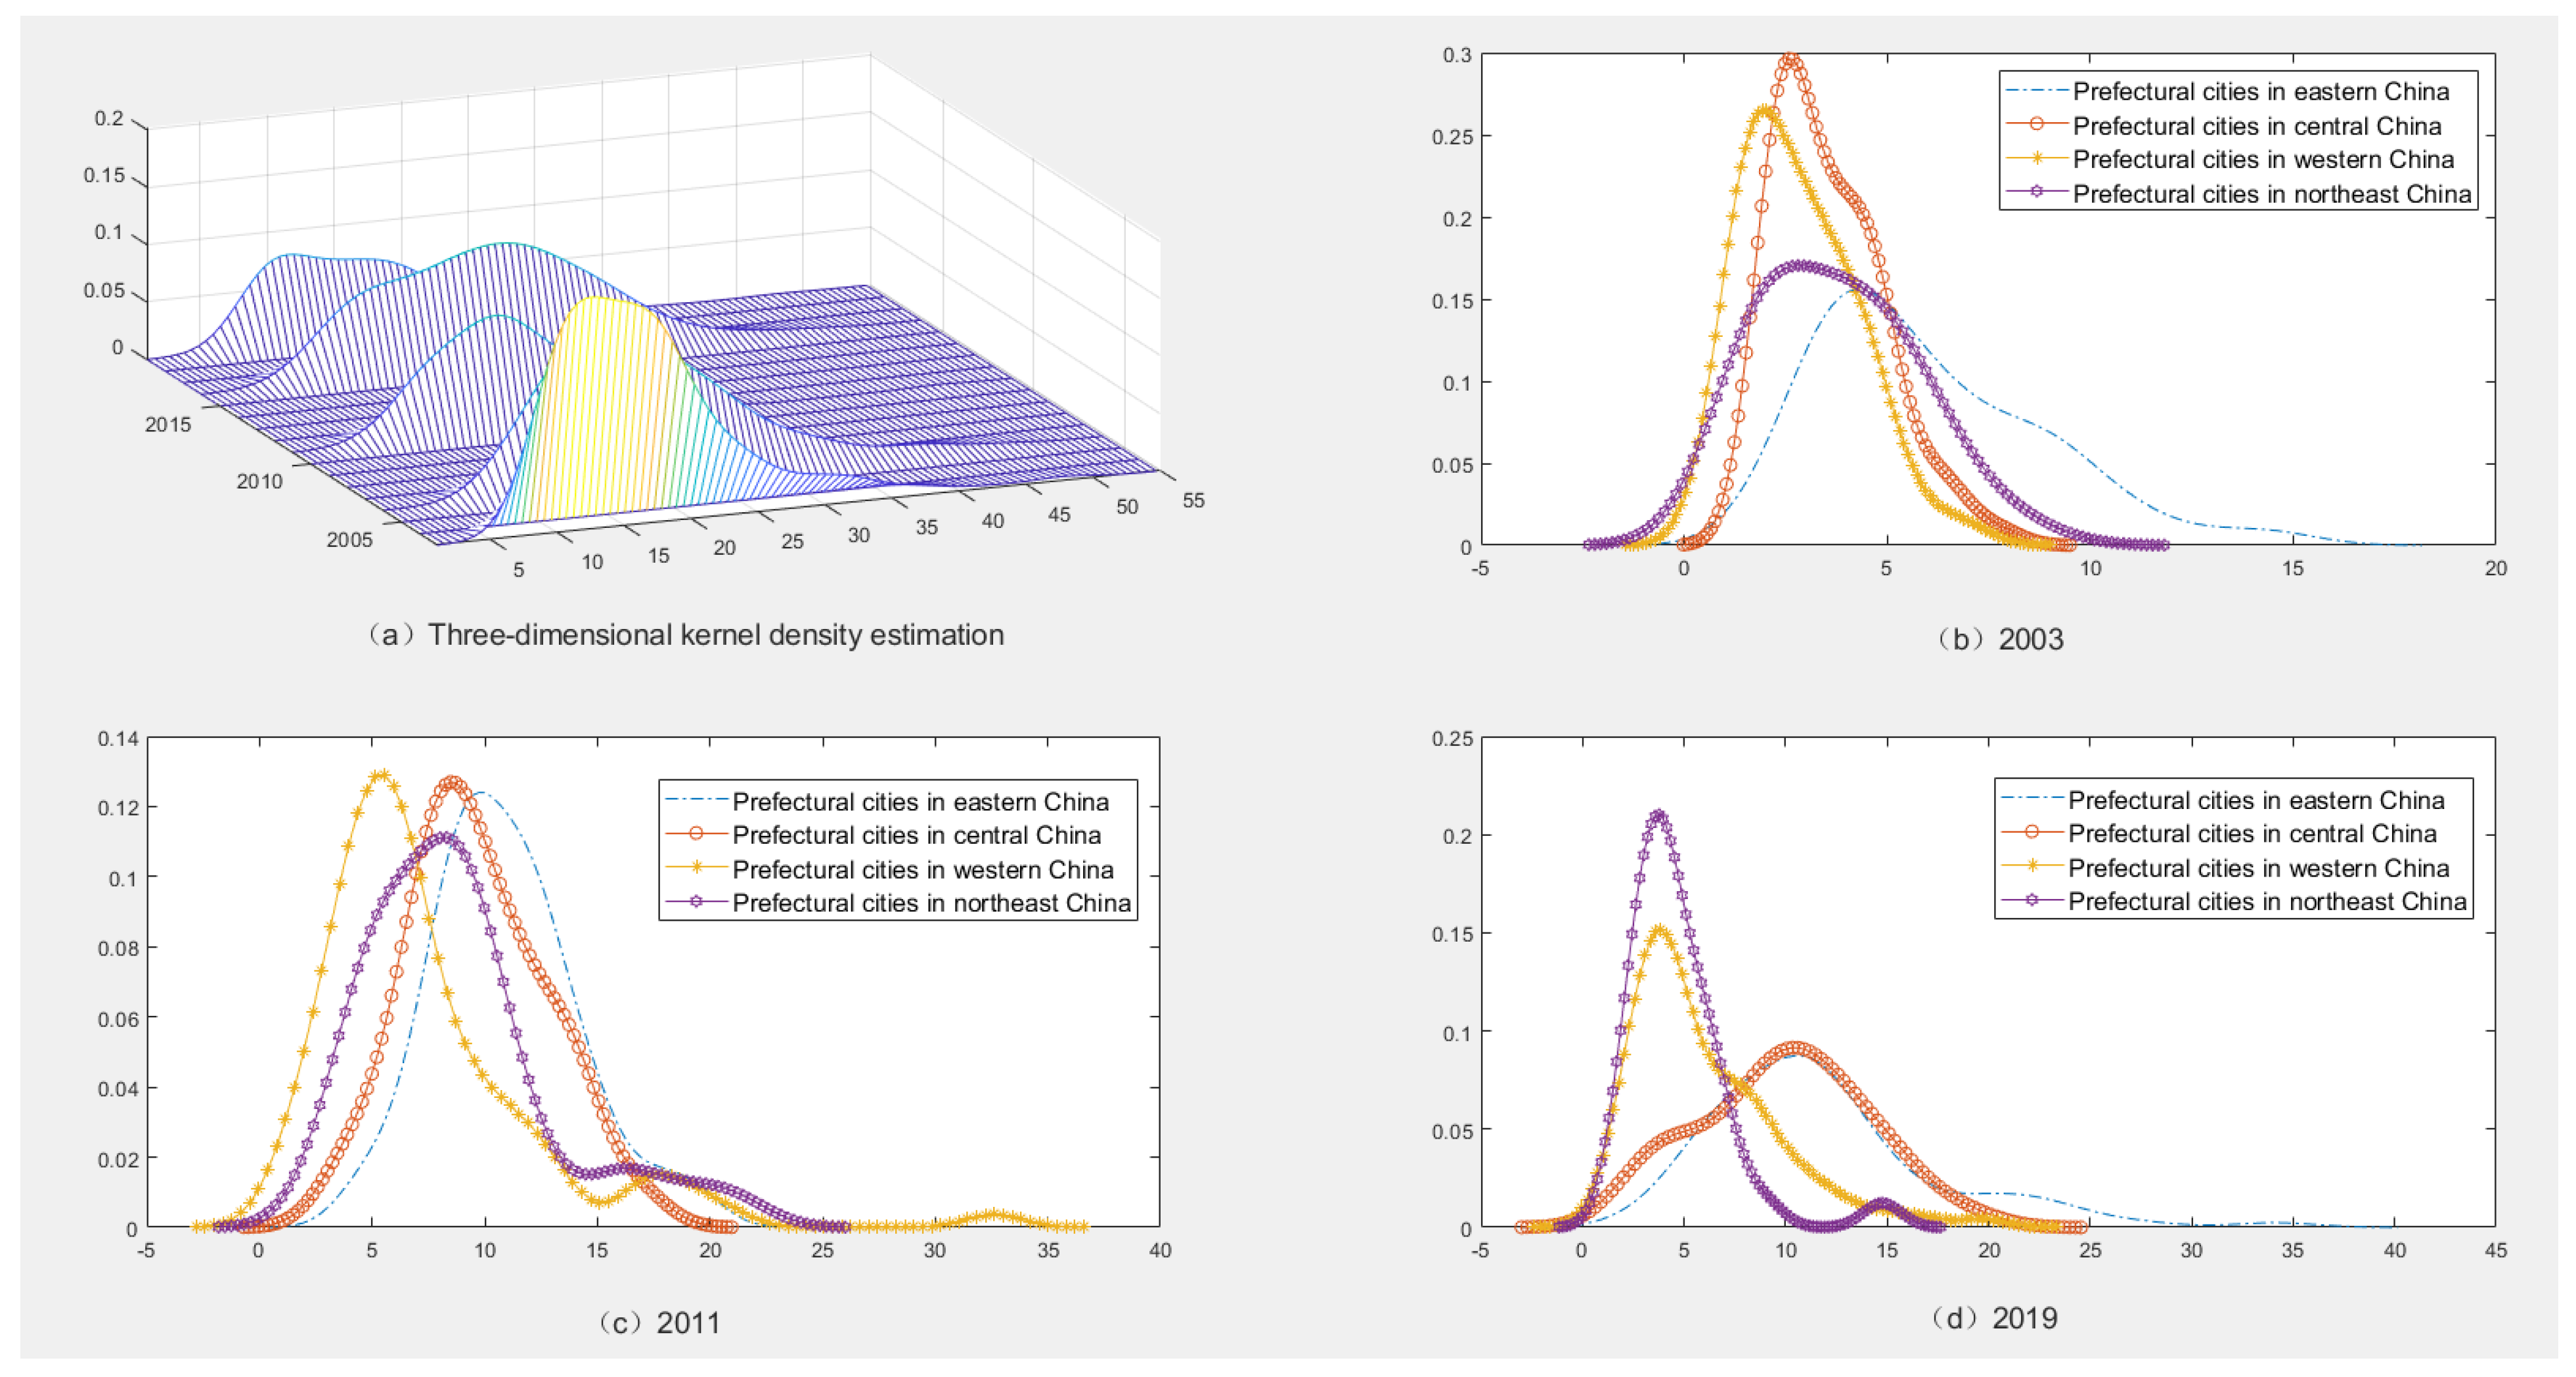
- The spatiotemporal evolution of China’s industrial TFP at the prefectural level has the following characteristics: the overall distribution curve moves towards firstly right and then towards left, the kernel density at the peak point continuously declines, and the distribution ranges are first widening and then narrowing. Figure 5a below shows the three-dimensional kernel density estimation of China’s industrial TFPs at the prefectural level in 2003, 2006, 2011, 2016, and 2019. From Figure 5a, compared with 2003, the overall distribution curve of the kernel density estimation shifts to the right in 2006, while the kernel density at the peak decreases, and the distribution range widens; compared with 2006, the distribution curve continued to shift to the right in 2011, the kernel density at the peak continues to decrease, and the distribution range continues to widen; compared with 2011, the distribution curve began to shift to the left in 2016, and the kernel density at the peak increases slightly, but the distribution range narrows; compared with 2016, the distribution curve shifts to the right slightly in 2019, the kernel density at the peak flatters and decreases, the distribution range widens. The tail of the distribution curve on the right side obviously extends.
- (4)
- There are also obvious spatial heterogeneities in the kernel density estimation of China’s industrial TFPs at the prefectural level. Figure 5b–d below separately show the two-dimensional kernel density estimation of the industrial TFPs of the prefectural cities belonging to eastern, central, western, and northeast China in 2003, 2011, and 2019. In Figure 5b, compared with the prefectural cities in central China, the distribution curve of the kernel density estimation of the industrial TFPs of the prefectural cities in eastern China in 2003 moves towards the right, the kernel density at the peak obviously decreases, the distribution range widens, and the tail of the distribution curve on the right side obviously extends; compared with the prefectural cities in central China, the distribution curve of the western prefectural cities in 2003 moves towards the left, the kernel density at the peak is also decreasing, the distribution range almost stays the same; compared with the western prefectural cities, the distribution curve of the northeast prefectural cities in 2003 moves towards the right slightly, the kernel density at the peak decreases while the distribution range obviously widens. The spatial heterogeneities of the kernel density estimation in 2011 and 2019 can also be analyzed in the same way as in 2003. In detail, we list the relative changes in the distribution curve, the kernel density at the peak point, the distribution range, and the tails of the distribution curve in the four regions, as shown in Table 5.
5. Conclusions and Further Research Directions
- (1)
- The optimal model of the estimated production functions of the industrial sectors in China’s prefectural cities is the SXL with both the individual fixed effects and the period fixed effects. From this optimal model, China’s industrial TFPs at the prefectural level can be calculated scientifically. From the calculation results, there are apparent spatial heterogeneities in these industrial TFPs, where the industrial TFPs of the prefectural cities in eastern China are higher, and those in northeast China are lower, while the industrial TFPs of the prefectural cities in central and western China fluctuate considerably.
- (2)
- The level of spatial differences of China’s industrial TFPs at the prefectural level shows an overall trend of first decreasing and then rising. Comparatively, the decomposed contribution of the general Gini coefficients from the intra-group differences is lower, and the contributions from the inter-group differences and the differences in the intensity of trans-variation are higher.
- (3)
- The spatiotemporal evolution of China’s industrial TFPs at the prefectural level has the following characteristics: first, the overall distribution curve moves firstly towards the right and then left; second, the kernel density at the peak point continuously declines; third, the distribution ranges are first widening and then narrowing; fourth, the tails of the distribution curve are constantly extending. Meanwhile, the distribution figures of the kernel density estimation in different regions show apparent heterogeneity.
6. Policy Suggestions
- (1)
- Further improve the resource allocation efficiency of China’s industrial sectors at the prefectural level. From Equation (10), the industrial TFPs in China’s prefectural cities are determined by three parts: the industrial outputs per capita, the inputs of capital per capita and energy per capita in the industrial sectors, and the shares of capital and energy. Moreover, higher outputs and lower inputs and their shares will lead to higher industrial TFPs. Therefore, improving the allocation efficiency of capital, labor, and energy will be a necessary means to improve the industrial TFPs in China’s prefectural cities. Here, we propose three suggestions for improving the allocation efficiency of the three main input factors. First, the capital should be guided actively to invest in regions with lower industrial TFPs with more favorable tax subsidies, land concessions, etc. Second, the establishment of colleges and vocational schools should be actively promoted in the prefectural cities to cultivate high-level skilled talents and workers needed for industrial development. Third, the construction of industrial energy storage bases and related equipment (such as photovoltaic power generation, etc.) should be further strengthened through special subsidies to reduce the cost of industrial electricity consumption.
- (2)
- Further promote industrial and technological innovation to improve the industrial TFPs of China’s prefectural cities comprehensively. Generally, industrial innovation and technological innovation are vital paths to the growth of industrial outputs. These two kinds of innovations can also change the structure of industrial input factors and then promote the development of the industrial sectors in China’s prefectural cities. As a matter of fact, the improvement of industrial TFPs itself is an important manifestation of industrial innovation and technological innovation, and also an inevitable result of these innovative developments. Therefore, we suggest promoting industrial innovation and technological innovation from the following three aspects: First, strengthen the supply side structural reform and find the scientific mode and path to promote the high-quality development of the industrial sectors at the prefectural level. Second, accelerate the application of new concepts, new business types, and new scenes (such as intelligent digital manufacturing, “Internet plus”, artificial intelligence, and the meta-universe, etc.) in the industrial sectors to cultivate new drivers of industrial development. Third, promote new technologies to be the inexhaustible driving force for the improvement of China’s industrial TFPs at the prefectural level by more applications of new generation technologies (such as industrial robots, cloud computing, and the internet of things) in the industrial sectors.
- (3)
- Promote the coordinated development of the industrial TFPs of China’s prefectural cities through effective regional coordination among industries of different cities. The biggest obstacle to the overall improvement of the industrial TFPs in China’s prefectural cities lies in their imbalance among different regions. Specifically, there are big gaps between the development levels of the industrial TFPs in the prefectural cities between eastern and northeast China. This problem requires special attention. We hope that the coordinated development of the industries among different regions will help to promote the overall improvement of the industrial TFPs in China’s prefectural cities. Thus, we provide three suggestions to improve the TFPs from the perspective of industrial-coordinated development. First, promote the efficient transfer of industries from eastern and central China to the vast western and northeast China, and enhance the environmental protection examination in the transfer of the industries comprehensively considering the resource endowment and development conditions of the cities where the industries are transferred. Second, strengthen the co-construction and sharing of industrial data and resources. Moreover, build a new integrated development pattern of industrial services by constructing regional industrial service platforms. Third, promote the development of the industrial sectors collaboratively by further strengthening the integration of resources of the industrial sectors in the prefectural cities, primarily through the integration of the platforms of the enclave industrial zones and adjacent industrial zones, etc.
Author Contributions
Funding
Institutional Review Board Statement
Informed Consent Statement
Data Availability Statement
Conflicts of Interest
References
- Farrell, M.J. The measurement of productive efficiency. J. R. Stat. Soc. A Stat. 1957, 120, 253–290. [Google Scholar] [CrossRef]
- Charnes, A.; Cooper, W.W.; Rhodes, E. Measuring the efficiency of decision-making units. Eur. J. Oper. Res. 1978, 2, 429–444. [Google Scholar] [CrossRef]
- Tone, K. A slacks-based measure of efficiency in data envelopment analysis. Eur. J. Oper. Res. 2001, 130, 498–509. [Google Scholar] [CrossRef] [Green Version]
- Yang, X.; Jia, Z.; Yang, Z. How does technological progress impact transportation green total factor productivity: A spatial econometric perspective. Energy Rep. 2021, 7, 3935–3950. [Google Scholar] [CrossRef]
- Malmquist, S. Index numbers and indifference surfaces. Trabajos de Estadistica 1953, 4, 209–242. [Google Scholar] [CrossRef]
- Caves, D.W.; Christensen, L.R.; Diewert, W.E. The economic theory of index numbers and the measurement of input, output, and productivity. Econometrica 1982, 50, 1393–1414. [Google Scholar] [CrossRef]
- Shen, N.; Liao, H.; Deng, R.; Wang, Q. Different types of environmental regulations and the heterogeneous influence on the environmental total factor productivity: Empirical analysis of China’s industry. J. Clean. Prod. 2019, 211, 171–184. [Google Scholar] [CrossRef]
- Chambers, R.; Fāure, R.; Grosskopf, S. Productivity growth in APEC country. Pac. Econ. Rev. 1996, 1, 181–190. [Google Scholar] [CrossRef] [Green Version]
- Zhao, M.; Lv, L.; Wu, J.; Wang, S.; Zhang, N.; Bai, Z.; Luo, H. Total factor productivity of high coal-consuming industries and provincial coal consumption: Based on the dynamic spatial Durbin model. Energy 2022, 251, 123917. [Google Scholar] [CrossRef]
- Chang, T.; Hu, J.; Chou, R.Y.; Sun, L. The sources of bank productivity growth in China during 2002–2009: A disaggregation view. J. Bank. Financ. 2012, 36, 1997–2006. [Google Scholar] [CrossRef]
- Fang, C.; Cheng, J.; Zhu, Y.; Chen, J.; Peng, X. Green total factor productivity of extractive industries in China: An explanation from technology heterogeneity. Resour. Policy 2021, 70, 101933. [Google Scholar] [CrossRef]
- Zhou, L.; Tang, L. Environmental regulation and the growth of the total-factor carbon productivity of China’s industries: Evidence from the implementation of action plan of air pollution prevention and control. J. Environ. Manag. 2021, 296, 113078. [Google Scholar] [CrossRef] [PubMed]
- Kumbhakar, S.C.; Lovell, C.A.K. Stochastic Frontier Analysis; Cambridge University Press: Cambridge, UK, 2000. [Google Scholar]
- Kumbhakar, S.; Denny, M.; Fuss, M. Estimation and decomposition of productivity change when production is not efficient: A panel data approach. Economet. Rev. 2000, 19, 312–320. [Google Scholar] [CrossRef]
- Zhao, X.; Liu, C.; Yang, M. The effects of environmental regulation on China’s total factor productivity: An empirical study of carbon-intensive industries. J. Clean. Prod. 2018, 179, 325–334. [Google Scholar] [CrossRef]
- Nadiri, M.; Prucha, I. Dynamic factor demand models, productivity measurement, and rates of return: Theory and an empirical application to the US bell system. Struct. Chang. Econ. D 1990, 1, 263–289. [Google Scholar] [CrossRef] [Green Version]
- Bloch, H.; Tang, S.H.K. The effects of exports, technical change and markup on total factor productivity growth: Evidence from Singapore’s electronics industry. Econ. Lett. 2007, 96, 58–63. [Google Scholar] [CrossRef]
- Abramovitz, M. Resource and output trends in the United States since 1870. Am. Econ. Rev. 1956, 46, 5–23. [Google Scholar]
- Theil, H. The information approach to demand analysis. Econometrica 1965, 33, 67–87. [Google Scholar] [CrossRef]
- Jorgenson, D.W.; Gollop, F.M.; Fraumeni, B.M. Productivity and U.S. Economic Growth; Harvard University Press: Cambridge, MA, USA, 1987. [Google Scholar]
- Georganta, Z. The effect of a free-market price mechanism on total factor productivity: The case of the agricultural crop industry in Greece. Int. J. Prod. Econ. 1997, 52, 55–71. [Google Scholar] [CrossRef]
- Solow, R.M. Technical change and the aggregate production function. Rev. Econ. Stat. 1957, 39, 312–320. [Google Scholar] [CrossRef] [Green Version]
- Chang, C.L.; Robin, S. Public policy, innovation and total factor productivity: An application to Taiwan’s manufacturing industry. Math. Comput. Simulat. 2008, 79, 352–367. [Google Scholar] [CrossRef]
- Wang, Z.; Zhao, X.; Zhou, Y. Biased technological progress and total factor productivity growth: From the perspective of China’s renewable energy industry. Renew. Sust. Energy Rev. 2021, 146, 111–136. [Google Scholar]
- Ghebremichaela, A.; Potter-Witter, K. Effects of tax incentives on long-run capital formation and total factor productivity growth in the Canadian sawmilling industry. Forest Policy Econ. 2009, 11, 85–94. [Google Scholar] [CrossRef]
- Scherngell, T.; Borowiecki, M.; Hu, Y. Effects of knowledge capital on total factor productivity in China: A spatial econometric perspective. China Econ. Rev. 2014, 29, 82–94. [Google Scholar] [CrossRef] [Green Version]
- Oh, D.; Heshmati, A.; Lööf, H. Total factor productivity of Korean manufacturing industries: Comparison of competing models with firm-level data. Jpn. World Econ. 2014, 30, 25–36. [Google Scholar] [CrossRef] [Green Version]
- Zhu, P.; Chen, L. Industrial added value and total factor productivity estimation—Evidence from the Quasi-Monte-Carlo experiment of China’s manufacturing industry. China Ind. Econ. 2020, 7, 24–42. [Google Scholar]
- Li, X.; Zhu, Z. Calculation of total factor productivity in China’s industrial sector: A study based on sub-sector panel data. J. Manag. World 2005, 4, 56–64. [Google Scholar]
- Olley, G.S.; Pakes, A. The dynamics of productivity in the telecommunications equipment industry. Econometrica 1996, 64, 1263–1297. [Google Scholar] [CrossRef]
- Levinsohn, J.; Petrin, A. Estimating production functions using inputs to control for unobservables. Rev. Econ. Stud. 2003, 70, 317–341. [Google Scholar] [CrossRef]
- Blundell, R.; Bond, S. Initial conditions and moment restrictions in dynamic panel data models. J. Econometr. 1998, 87, 115–143. [Google Scholar]
- Lu, X.; Lian, Y. Estimation of total factor productivity of industrial enterprises in China: 1999–2007. China Econ. Q. 2012, 11, 541–558. [Google Scholar]
- Tientao, A.; Legros, D.; Pichery, M.C. Technology spillover and TFP growth: A spatial Durbin model. Int. Econ. 2016, 145, 21–31. [Google Scholar] [CrossRef]
- Barilla, D.; Carlucci, F.; Cirà, A.; Loppolo, G.; Siviero, L. Total factor logistics productivity: A spatial approach to the Italian regions. Transport. Res. A-Pol. 2020, 136, 205–222. [Google Scholar] [CrossRef]
- Elhorst, J.P. Spatial Econometrics from Cross-Sectional Data to Spatial Panels; Springer: Berlin/Heidelberg, Germany, 2014. [Google Scholar]
- Zhao, Q.; Fan, Q.; Zhou, P. An integrated analysis of GWR models and spatial econometric global models to decompose the driving forces of the township consumption development in Gansu, China. Sustainability 2022, 14, 281. [Google Scholar] [CrossRef]
- Fan, Q.; Hudson, D. A new endogenous spatial-temporal weight matrix based on ratios of global Moran’s I. J. Quant. Tech. Econ. 2018, 35, 131–149. [Google Scholar]
- Fan, Q.; Guo, A. An improved Solow residual method for TFP calculating under the framework of spatial econometrical analysis. J. Quant. Tech. Econ. 2019, 36, 165–181. [Google Scholar]
- Dagum, C. A new approach to the decomposition of the Gini income inequality ratio. Empir. Econ. 1997, 22, 515–531. [Google Scholar] [CrossRef]
- Silverman B., W. Density Estimation for Statistics and Data Analysis; Chapman and Hall: London, UK, 1986. [Google Scholar]
- Guo, A.; Fan, Q. Calculating China’s industrial TFP at the prefectural level using spatial econometric local analysis. J. Quant. Tech. Econ. 2022, 39, 61–80. [Google Scholar]
- Hsiao, C. Analysis of Panel Data; Cambridge University Press: Cambridge, UK, 2003. [Google Scholar]

| Models | Share of Capital Inputs () | Share of Energy Inputs () |
|---|---|---|
| GNSM | ||
| SDM | ||
| SDEM | ||
| SXL | ||
| SAC | ||
| SAR | ||
| SEM | ||
| NSM |
| Gross Value of Industrial Outputs (100 Million Yuan) | Industrial Capital Stock (100 Million Yuan) | Industrial Total Employed Persons (10 Thousand) | Industrial Electricity Consumption (100 Million kWh) | |
|---|---|---|---|---|
| Mean | 200.41 | 239.67 | 15.48 | 107.15 |
| Median | 121.62 | 137.56 | 9.43 | 65.66 |
| Maximum | 2160.22 | 3984.01 | 260.92 | 1611.90 |
| Minimum | 3.29 | 2.14 | 0.31 | 0.23 |
| Std. Dev. | 235.51 | 291.34 | 20.73 | 133.45 |
| Skewness | 2.93 | 3.04 | 5.15 | 4.15 |
| Kurtosis | 14.66 | 18.42 | 43.34 | 30.69 |
| Jarque-Bera | 3.38 × 10⁴ | 5.45 × 10⁴ | 3.44 × 10⁵ | 1.66 × 10⁵ |
| Probability | 0.0000 | 0.0000 | 0.0000 | 0.0000 |
| Sum | 9.54 × 10⁵ | 1.14 × 10⁶ | 7.37 × 10⁴ | 5.10 × 10⁵ |
| Sum Sq. Dev. | 2.64 × 10⁸ | 4.04 × 10⁸ | 2.04 × 10⁶ | 8.48 × 10⁷ |
| Observations | 4760 | 4760 | 4760 | 4760 |
| NSM | SXL | SAR | SDM | SEM | SDEM | SAC | GNSM | |
|---|---|---|---|---|---|---|---|---|
| 1.8445 (66.69 ***) | 1.1687 (22.76 ***) | −0.2521 (−5.62 ***) | 0.2062 (43.22 ***) | 20.414 (86.63 ***) | 19.635 (119.43 ***) | 1.3248 (9.76 ***) | 2.4504 (6.14 ***) | |
| 0.6128 (51.41 ***) | 0.4774 (33.22 ***) | 0.3498 (32.95 ***) | 0.4552 (11.21 ***) | 0.456 (66.62 ***) | 0.4503 (43.41 ***) | 0.4502 (41.21 ***) | 0.4404 (40.07 ***) | |
| 0.066 (6.04 ***) | 0.0817 (7.26 ***) | 0.0942 (10.89 ***) | 0.0995 (7.95 ***) | 0.0992 (11.42 ***) | 0.1088 (12.07 ***) | 0.1009 (11.77 ***) | 0.1069 (11.86 ***) | |
| 0.5161 (14.77 ***) | −0.4676 (−38.29 ***) | −0.0433 (−1.40) | −0.2676 (−4.91 ***) | |||||
| −0.0748 (−2.40 **) | −0.0764 (−2.73 ***) | 0.1013 (3.51 ***) | 0.0964 (3.23 ***) | |||||
| 0.866 (53.58 ***) | 0.9899 (33.58 ***) | −0.133 (−3.24 ***) | 0.4004 (4.46 ***) | |||||
| 0.99 (5040.3 ***) | 0.99 (7078.2 ***) | 1.2072 (64.20 ***) | 0.9019 (43.24 ***) | |||||
| 0.4788 | 0.5053 | −0.3163 | −520.13 | −0.3163 | 0.7044 | 0.7113 | 0.7032 | |
| 0.3265 | 0.3099 | 0.2037 | 0.1854 | 0.2037 | 0.1850 | 0.1807 | 0.1857 | |
| −4088.4 | −3963.1 | −1354.6 | −1123 | −1354.6 | −1117.7 | −1084.5 | −2771.7 |
| Individual Fixed Effects Models | Period Fixed Effects Models | Individual and Period Fixed Effects Models | ||||
|---|---|---|---|---|---|---|
| NSM | SXL | NSM | SXL | NSM | SXL | |
| 0.7186 (78.44 ***) | 0.5919 (43.52 ***) | 0.4581 (34.37 ***) | 0.4104 (29.33 ***) | 1.201 (137.28 ***) | 0.5649 (44.53 ***) | |
| 0.2062 (18.64 ***) | 0.1417 (14.10 ***) | 0.0563 (5.62 ***) | 0.0792 (7.61 ***) | 0.2058 (16.88 ***) | 0.1202 (12.83 ***) | |
| −0.8341 (−18.13 ***) | 0.3987 (11.20 ***) | 0.519 (9.75 ***) | ||||
| 1.9307 (33.56 ***) | −0.1981 (−6.87 ***) | 0.4655 (6.65 ***) | ||||
| 0.7389 | 0.7927 | 0.2831 | 0.3016 | 0.036 | 0.4504 | |
| 0.0969 | 0.0769 | 0.265 | 0.2581 | 0.1103 | 0.0629 | |
| −1197.4 | −647.22 | −3592.1 | −3528.7 | −1505.1 | −166.79 | |
| Year | Analyzed Regions | Benchmark Regions | Movement Direction of the Distribution Curve | Kernel Density at the Peak Point | Distribution Range | Tails of the Distribution Curve |
|---|---|---|---|---|---|---|
| 2003 | Eastern | Central | → | ↓ | Widen | Extend |
| Western | Central | ← | ↓ | Almost the same | - | |
| Northeast | Western | → | ↓ | Widen | - | |
| 2011 | Eastern | Central | ← | ↑ | Almost the same | - |
| Western | Central | ← | Almost the same | Almost the same | Extend | |
| Northeast | Western | → | ↓ | - | Narrow | |
| 2019 | Eastern | Central | Almost the same | ↑ | - | Narrow |
| Western | Central | ← | ↑ | - | - | |
| Northeast | Western | Almost the same | ↑ | Narrow | Narrow |
Disclaimer/Publisher’s Note: The statements, opinions and data contained in all publications are solely those of the individual author(s) and contributor(s) and not of MDPI and/or the editor(s). MDPI and/or the editor(s) disclaim responsibility for any injury to people or property resulting from any ideas, methods, instructions or products referred to in the content. |
© 2022 by the authors. Licensee MDPI, Basel, Switzerland. This article is an open access article distributed under the terms and conditions of the Creative Commons Attribution (CC BY) license (https://creativecommons.org/licenses/by/4.0/).
Share and Cite
Wei, W.; Fan, Q.; Guo, A. China’s Industrial TFPs at the Prefectural Level and the Law of Their Spatial–Temporal Evolution. Sustainability 2023, 15, 322. https://doi.org/10.3390/su15010322
Wei W, Fan Q, Guo A. China’s Industrial TFPs at the Prefectural Level and the Law of Their Spatial–Temporal Evolution. Sustainability. 2023; 15(1):322. https://doi.org/10.3390/su15010322
Chicago/Turabian StyleWei, Wei, Qiao Fan, and Aijun Guo. 2023. "China’s Industrial TFPs at the Prefectural Level and the Law of Their Spatial–Temporal Evolution" Sustainability 15, no. 1: 322. https://doi.org/10.3390/su15010322
APA StyleWei, W., Fan, Q., & Guo, A. (2023). China’s Industrial TFPs at the Prefectural Level and the Law of Their Spatial–Temporal Evolution. Sustainability, 15(1), 322. https://doi.org/10.3390/su15010322


