Article

Examining the Location Characteristics of Knowledge Industrial Space for Smart Planning and Industry 4.0: A Case Study of Hangzhou, China

College of Design and Architecture, Zhejiang University of Technology, Hangzhou 310024, China
*
Author to whom correspondence should be addressed.
Sustainability 2022, 14(21), 14594; https://doi.org/10.3390/su142114594
Submission received: 18 October 2022 / Revised: 31 October 2022 / Accepted: 2 November 2022 / Published: 6 November 2022

Abstract

:
In the era of Industry 4.0, the knowledge economy is reshaping the global economic structure, which makes the research on the layout of knowledge industries particularly important. This study, using Hangzhou in China as a case, constructs an index system from two dimensions (i.e., business and living amenities), and compares three typical representative knowledge industries. The nearest neighbor index, kernel density, and stepwise regression model were adopted. Results revealed that: (1) The spatial agglomeration intensity of knowledge industries is varied in different classes, with the financial industry being the most agglomerated, scientific research technology service industry the second, and smart manufacturing industry the least agglomerated. (2) The spatial distribution of knowledge industries is agglomerated in the shape of “#”, which is in line with the urban skeleton. (3) For the distribution of the financial industry, parking lots and cafés are strong influencing factors. The scientific research technology service industry locates closer to sports and fitness amenities, colleges and universities, and parks, while the smart manufacturing industry has a strong connection with snacking spots, fast food, and scientific research institutions. The results can provide a decision-making basis for the micro-location selection of urban knowledge industries and the adjustment of future industrial planning in the intelligent era.

1. Introduction

Since entering the fourth industrial revolution, a new round of scientific and technological revolutions and industrial transformation have not only reconstructed the global innovation map and reshaped the global economic structure, but also promoted the driving force of the economic development of all countries in the world from factor driving to knowledge innovation driving [1], where knowledge factors have become unprecedentedly important in regional development [2]. As the backbone of the national economy, knowledge industries reflect the effective transformation of regional scientific and technological innovation achievements while promoting the high-quality development of the regional economy. Knowledge industries are characterized by knowledge leading, knowledge service, and knowledge production and their development conforms to the trend of the times and the demand for the high-quality transformation of countries. Therefore, building a new type of space for the innovative activities of knowledge industries will become the focus of future urban transformation and optimization.
With the integration and application of various intelligent technologies such as 5G, artificial intelligence, and the Internet of Things, everything in the city can be digitized and interconnected and urban development is accelerating into the “Industry 4.0 era” [3]. At present, the relatively static, fragmented, siloed, and single-target urban governance model cannot adapt to and meet the modernization requirements of urban governance and it is necessary to actively explore the new model of “real-time dynamic, intelligent integration and information interconnection” of intelligent planning [4]. Smart planning is based on the interaction of people, technology, and space, forming the driving force and strategic focus of urban wisdom development. [5]. Its focus is not only on the construction of wisdom and information technology, but also on strengthening the interconnection of the population, economy, science, and technology among cities; breaking geographical and spatial isolation; and building innovative and competitive cities.
Urban internal industrial spatial pattern and location selection factors are classic topics in urban planning and economic geography. Scholars have performed extensive in-depth research on the spatial distribution of certain knowledge industries, such as the finance industry [6,7], the software industry [8,9,10], the information consulting service industry [11], and the cultural and creative industry [12,13]. Generally speaking, since the term “knowledge industries” covers various types of industries, their spatial patterns often show differences in shape, scale, and structure, and the existing research pays little attention to those differences.
Regarding the factors affecting the spatial location of knowledge industries, the empirical research of scholars in the pioneering countries has shaped the consensus that “smart factories follow talents and talents choose the environment.” For example, Florida claims that the high-quality urban living environment attracts the innovative strata, thus driving the industrial gathering [14]. Furthermore, “The Theory of Scenes,” founded by Terry Nichols Clark and Daniel Aaron Silver, explains that the advantages of post-industrial cities are reflected in the ability to attract high-quality talents, that is, the culture and lifestyle that cities can provide [15]. Arthur Grimes et al. found that smart manufacturing industries are willing to choose high-quality production and consumption amenities [16]. However, at present, the research on knowledge industries locations in developing countries, such as China, mainly focuses on the traditional location and agglomeration economy theory, such as industrial input and output [17], technological innovation [18], coordinated development [19,20], and enterprise scale [21]. In recent years, a few scholars have examined the impact of urban comfort on creative industries [22,23], R&D elements [24], innovation ability [25], and living environment [26], which provides new ideas for the research of knowledge industries.
Knowledge-driven innovation is the driving force behind the future development of cities [27]. However, at present, numerous cities worldwide are facing difficulties, such as a shortage of skilled talents in knowledge industries [28], poor level of labor division and cooperation among enterprises [29], and low spatial concentration [30]. There are also problems in various sub-sectors of the industry, including low innovation efficiency [31], unbalanced internal efficiency structure [32], and yet-formed scale benefits [33]. The industrial space needs to be optimized and adjusted urgently. Therefore, using the Chinese city of Hangzhou as an example, this study selects three representative knowledge industries: the financial industry, the scientific research and technical service industry, and the smart manufacturing industry, for comparative analysis. The study examines their spatial pattern by using the nearest neighbor index and nuclear density, constructs an index system from two dimensions of business and living amenities, explores the influencing factors of the location of the knowledge industries through a stepwise regression model, and puts forward guidance and incentive policies to help maximize the value of knowledge.
The article is divided into three parts: The first one explores the spatial structure characteristics of knowledge industries. The second part examines the spatial location characteristics of knowledge industries and the third part discusses the factors influencing the location choice of knowledge industries. The research results can not only provide a decision-making basis for the in-depth analysis of the micro-location choice of urban knowledge industries, future industrial planning adjustment, and related policy formulation, but also provide an explanatory framework for expanding the labor force, provide Chinese evidence for the academic debate on the role of urban comfort and economic opportunities for high-level talents, and provide inspiration for “talent attraction” in cities.

2. Study Site and Data Sources
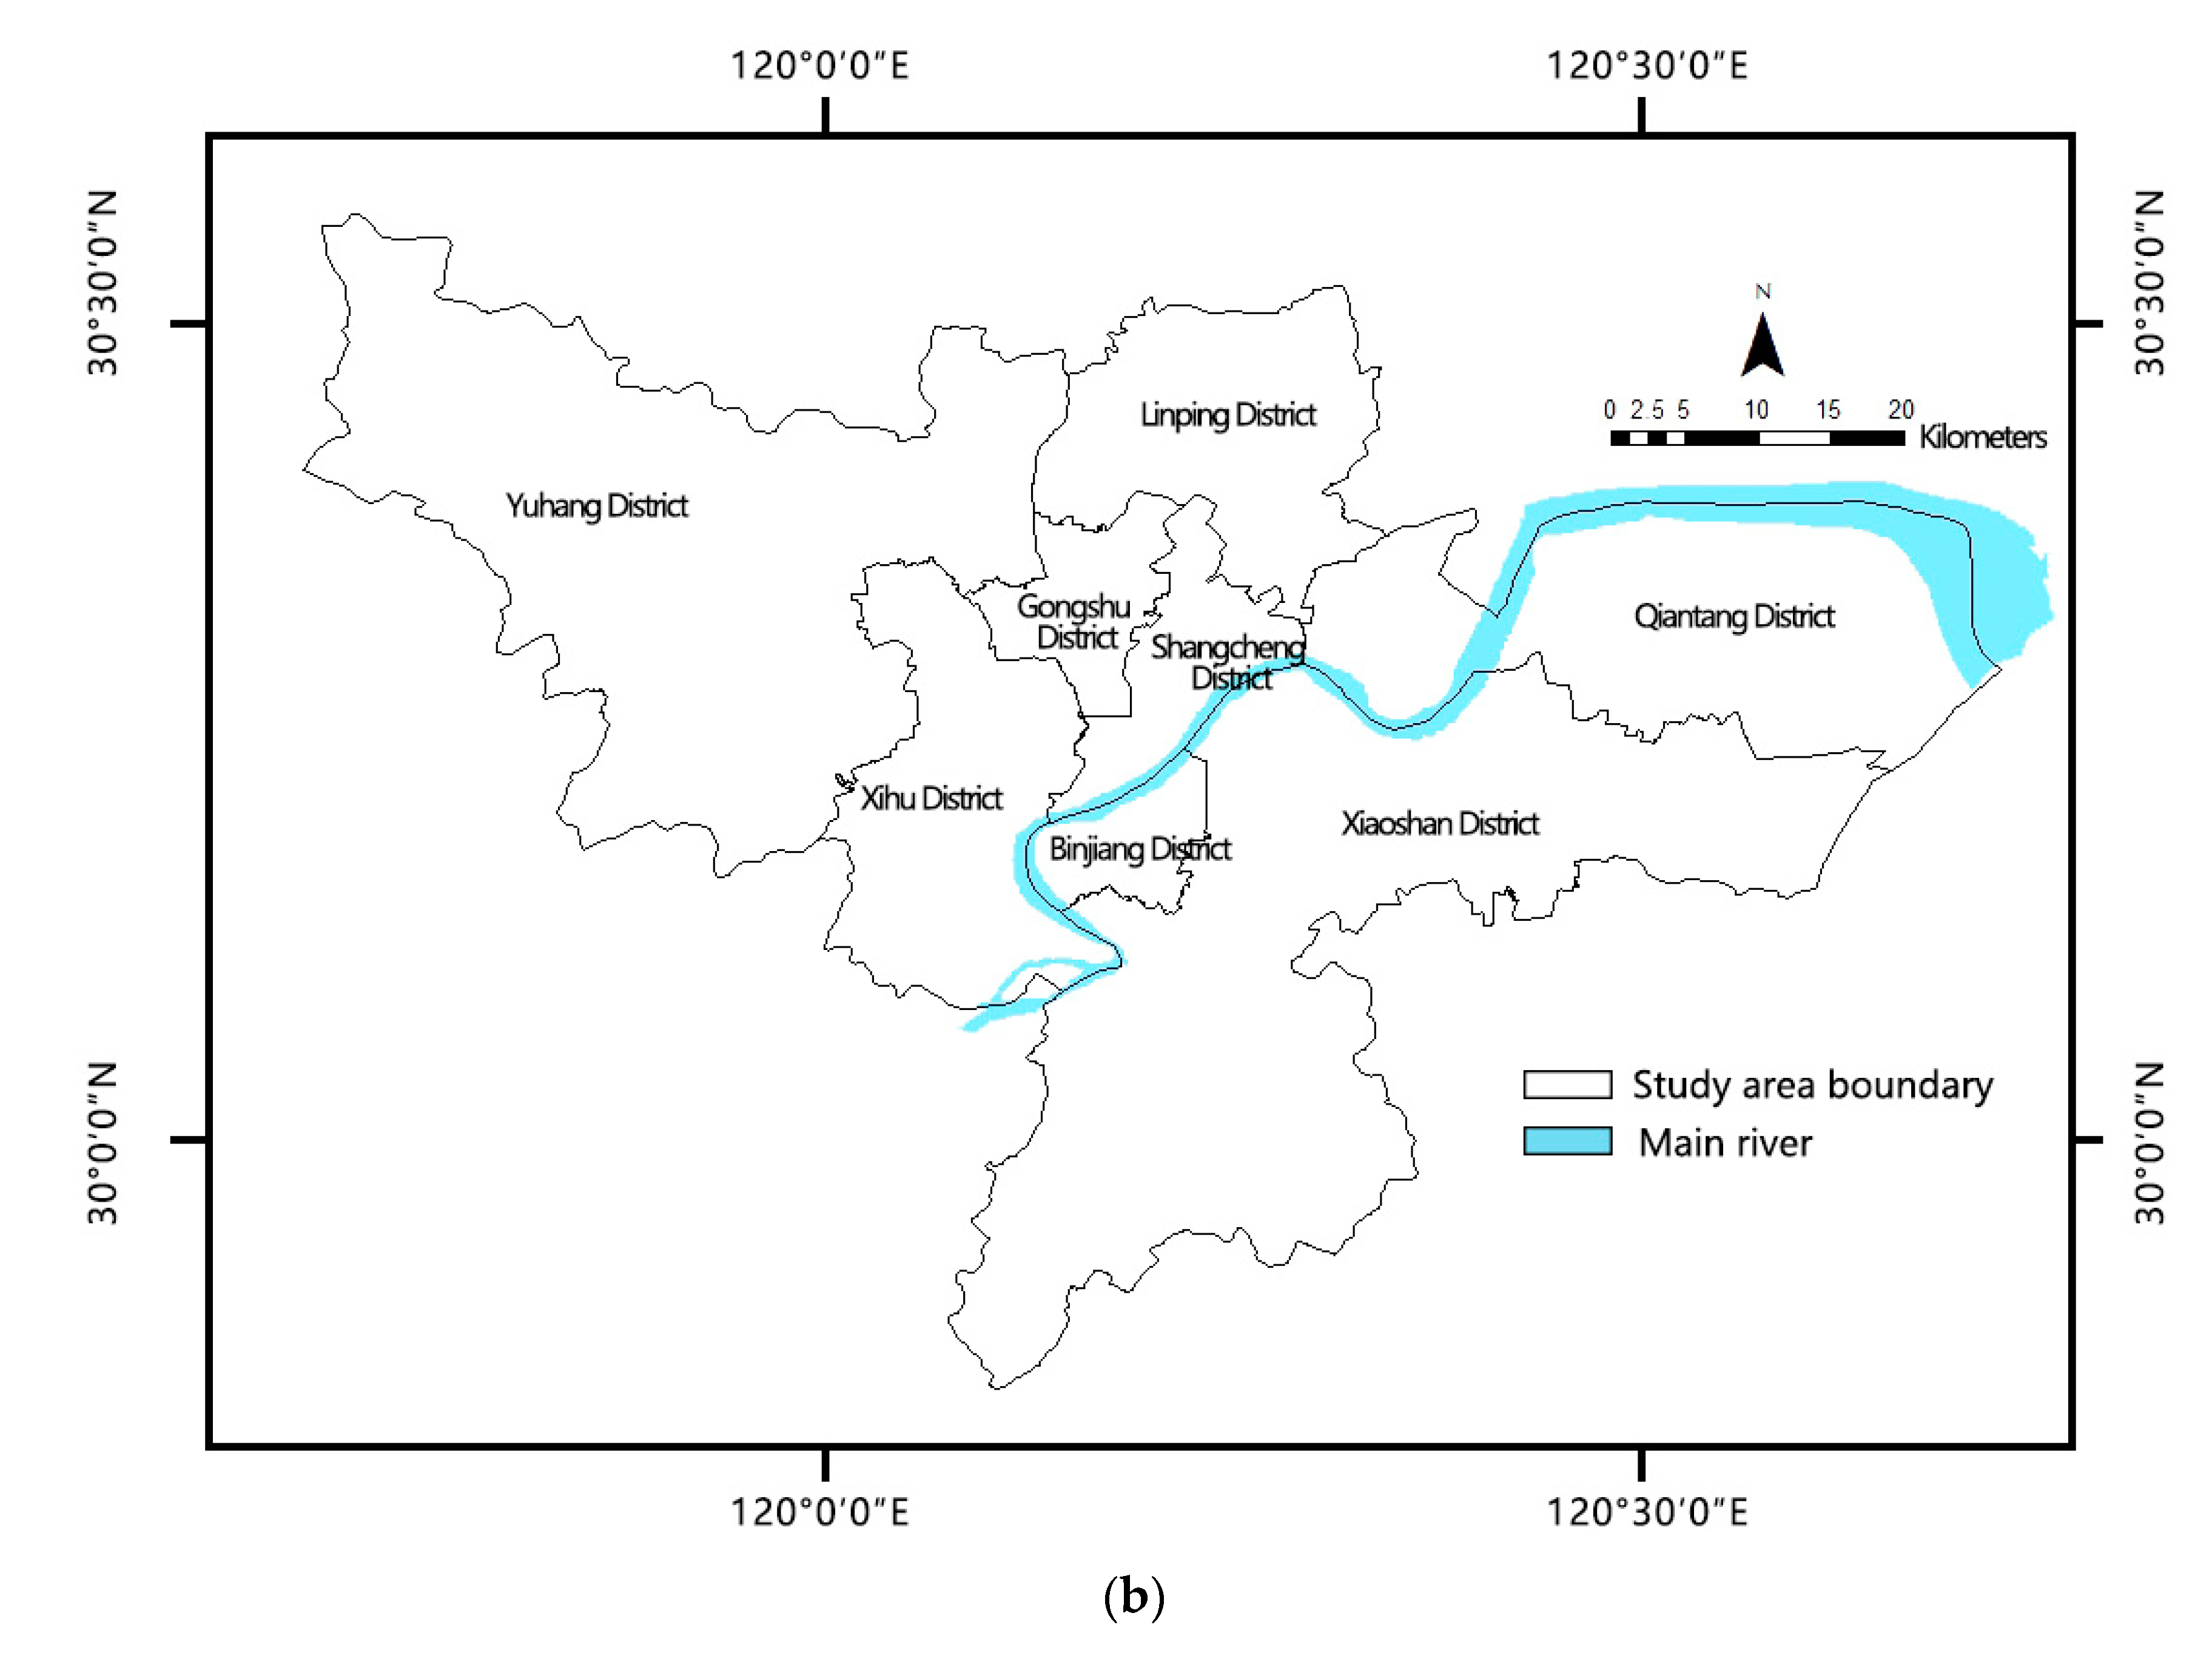
2.1. Study Site

Hangzhou is an important representative city of Chinese new economic development and is known as the “city of innovation and vitality.” In recent years, Hangzhou has firmly implemented a development strategy driven by knowledge innovation. The number of national smart factories in the city has reached 10,222. The net inflow rate of talents, overseas talents, and internet talents has been leading in the country for many years, and Hangzhou’s innovation ability ranks second in the country (note: the data come from the China Institute of Science and Technology Information, Ministry of Science and Technology: “Evaluation Report on Innovation Capability of National Innovative Cities 2021.”). According to the data, the influx of high-level talents in Hangzhou has strongly supported the scientific and technological innovation in knowledge industries: enterprises absorb about 58% of talents, of which the information technology industry accounts for 28%, the scientific research and technical service industry accounts for 20%, and the smart manufacturing industry accounts for 15% (note: the data come from the announcement of high-level talents in Hangzhou’s high-level talents classification and declaration system, from 2015 to 2020.). Therefore, it is of typical significance to study knowledge industries in Hangzhou. In this study, the main urban area of Hangzhou is selected as the research area, including eight municipal districts: Shangcheng, Qiantang, Gongshu, West Lake, Binjiang, Xiaoshan, Yuhang, and Linping (Figure 1).

2.2. Conceptual Connotation

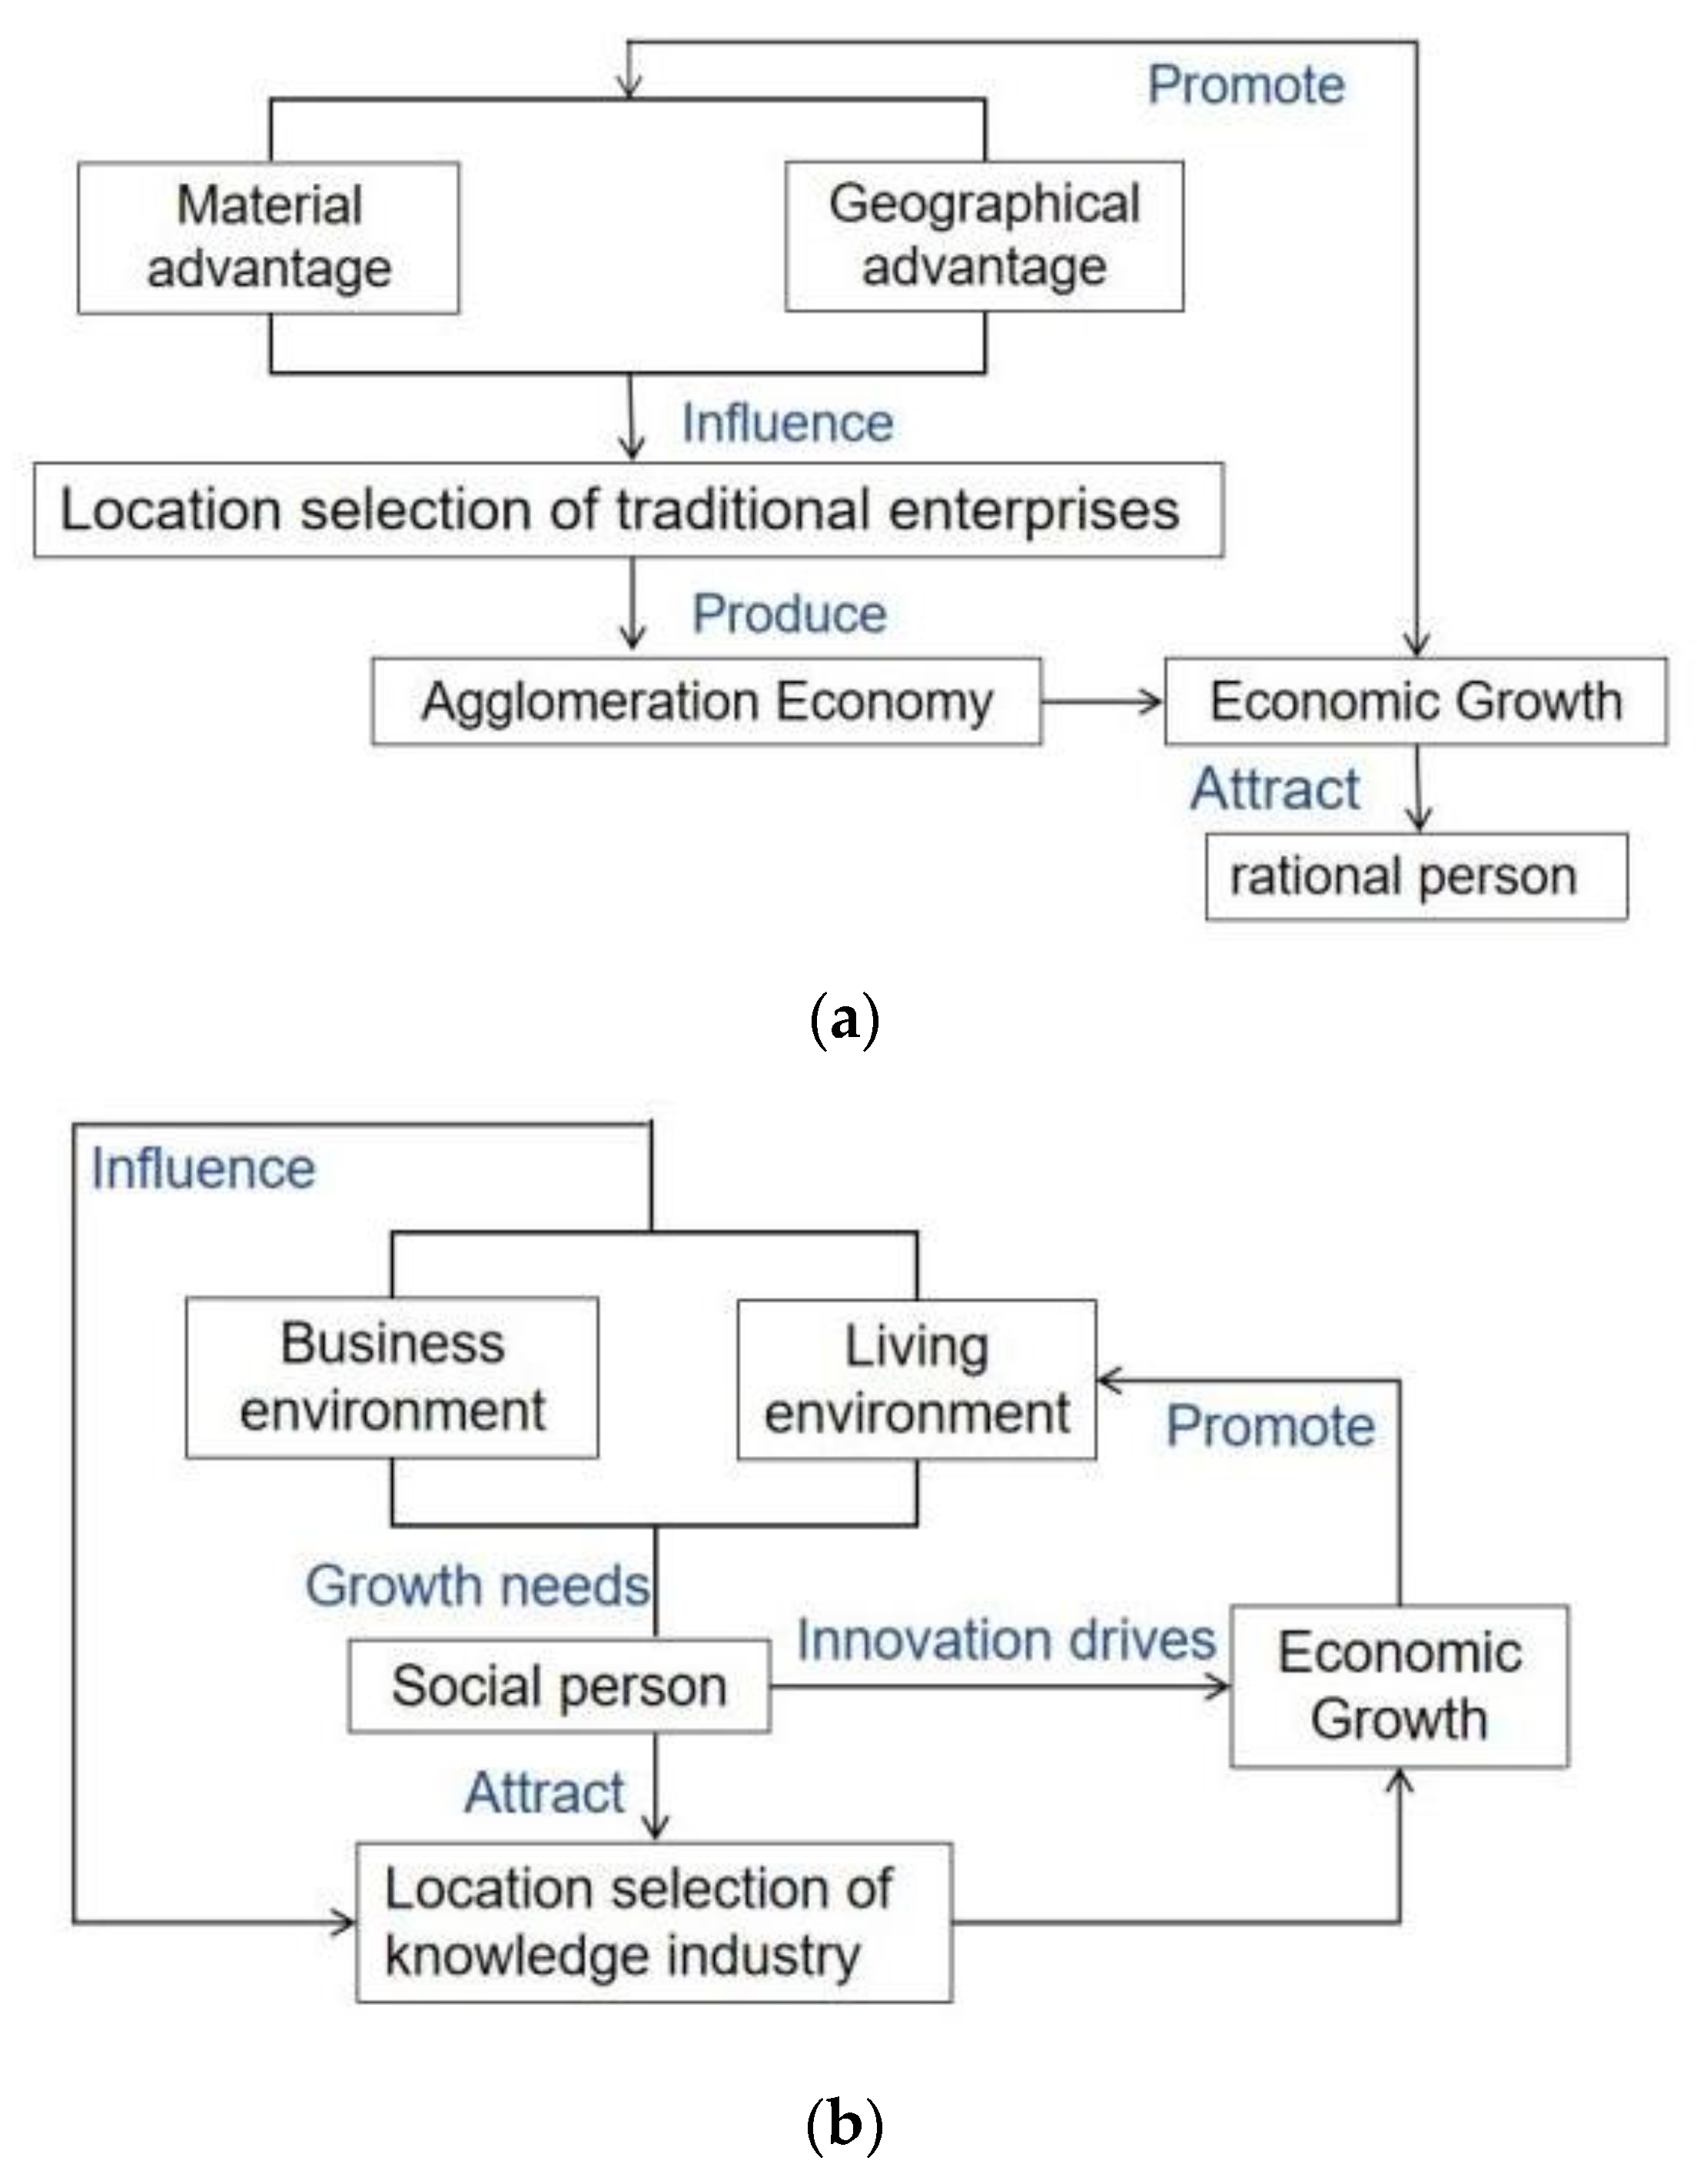
2.2.1. Knowledge Industry

Knowledge industries are also called knowledge-intensive industries and intellectual industries [34]. The term “knowledge industry” was first put forward by the American economist Fritz Machlup in his book The Production and Distribution of Knowledge in the United States [35]. With the advent of the information age, this concept has been popularized, with its contents gradually expanding, including topics such as Knowledge Economy [36], Internet Capitalism [37], and Creative Economy [38]. Due to the differences in economic and social development levels and cultural backgrounds of various countries and regions, scholars and governments in various countries have different understandings of the connotation of knowledge industries, which leads to the disunity of its industry composition and classification.
At present, there is no unified conclusion on its definition and scope. However, the main characteristics of knowledge industries remain constant and can be summed up as follows (Table 1): First, the application of knowledge, technology, skills, and other brainpower is the main source of wealth acquisition and competitiveness improvement in the production activities of knowledge industries; that is, human capital is the first production factor of knowledge industries. Secondly, unlike large-scale production in industrialization, knowledge-based industries create high value-added products and brands through knowledge service, innovation, and various business models. Third, knowledge industries mainly rely on the innovative activities of high-level talents, meaning that their location choice often reflects the strategic behavior of talents oriented by knowledge value (Figure 2).
According to the previous summary of the characteristics of knowledge industries, this study refers to Allen Scot’s classification of the cognitive—cultural economy (note: Allen Scot’s cognitive—cultural economy is characterized by its high dependence on a high-level scientific and technical workforce, which is consistent with the concept of knowledge industry emphasized in this study. Allen Scot divides it into three types: business and financial services, cultural and technological services, and high-tech services.) [39], selecting three representative knowledge industries for comparative analysis: the financial industry, the scientific research and technical service industry, and the smart manufacturing industry (Table 2).

2.2.2. Knowledge-Oriented Talents

Since knowledge-oriented talents play an important role in the location selection of knowledge industries, it is necessary to analyze the characteristics of knowledge-oriented talents in-depth. As seen from Figure 3 and Figure 4, with the increasing demand for human capital and high-end resources in knowledge industries, the demand of different knowledge-oriented employment groups in Hangzhou is quite different. The financial industry and the scientific research and technical service industry have higher academic requirements and wage levels, while the intelligent manufacturing industry has lower academic requirements and wage levels. In addition, the proportion of professional and technical personnel in the scientific and technological service industry is significantly greater than that in the smart manufacturing industry, which indicates that the scientific and technological service industry has higher requirements for talents’ skills. Therefore, this study further divides the knowledge talents driven by innovation factors into three classes: the working class (corresponding to the smart manufacturing industry), the middle- and high-end white-collar class (corresponding to the scientific research and technical service industry), and the high-paid elite class (corresponding to the financial industry).

2.2.3. Urban Amenity

According to the traditional location theory, the spatial distribution of an industry is mainly influenced by economic factors, such as geographical location, raw materials, and the professional labor market [40,41]. However, in the information economy era, due to changes in the space and production factors of knowledge industries, the classical location theory cannot fully explain the spatial distribution law [42,43]. Reviewing the current research, “the Theory of Comfort, Creative Class, and Urban Scene” points out that knowledge industries have a strong demand for high-level talents and high skills, which leads to their employees having a stronger perception of environmental quality [44]. This new perspective of focusing on environmental quality includes two main aspects: “quality of life” and “quality of business” [16,45]. Based on the above theory and research, this study selects 13 indicators covering the six dimensions of transportation, education, landscape, catering, service, and entertainment amenities, from two aspects, namely life and business amenities (Table 3). The following is a description of each variable:

2.3. Data Processing

This study adopts geospatial data and socioeconomic statistics to analyze the spatial characteristics and influencing factors of knowledge industries in Hangzhou in 2021. The data sources are as follows:
1. Knowledge industry data. Mainly from the statistical results of the Qichacha website (https://www.qcc.com/?utm_source=baidu1&utm_medium=cpc&utm_term=pzsy, accessed on 1 October 2022) (as of 2021), including company name, industry type, registered capital, company address, and property information.
2. Urban amenity data. Includes Point of Interest (POI) and Area of Interest (AOI) data. Among them, the POI data comes from the Baidu map API interface and includes serial number, name, address, longitude, latitude, and other class attribute data. The planar data builds a Baidu map drawing tool by writing an HTML web code, manually draws community boundaries online, and obtains Hangzhou AOI data in batches before converting the geographic coordinates of all boundary data into WGS84 coordinates, which are then convenient for spatial calculation. Data were collected at the end of 2021.
3. Knowledge-oriented talent data. The data mainly come from the “Hangzhou 2017 Statistical Yearbook,” the “Hangzhou 2021 Statistical Yearbook,” and the “Hangzhou 2021 Human Resources and Social Security Bureau.”
The main steps of the data processing are as follows: (1) data preprocessing: this research uses the Baidu map API interface to identify the geospatial information of enterprise coordinates, followed by the ArcGIS 10.3 to convert the coordinates into enterprise spatial point data files; (2) data space analysis: with the support of ArcGIS, the enterprise data is analyzed by nearest neighbors and kernel density to obtain the location characteristics of knowledge industries and the spatial layout is visualized; (3) statistical data analysis: applying the SPSS stepwise regression model to explore the life and business influencing factors of amenities on the location of knowledge industries.

2.4. Method

2.4.1. Nearest Neighbor Index

The Nearest Neighbor Index (NNI) measures the average of all distances between spatial point elements of knowledge industries and their nearest spatial point elements, before comparing it with the theoretical average distance of spatial point elements under the assumption of random distribution. If the average distance of the actual knowledge industries distribution is less than the theoretical average distance of random distribution, it means that knowledge industries show spatial agglomeration distribution [46,47]. The opposite relationship between the values indicates spatial dispersion distribution. If they are equal, the distribution is uniform.

2.4.2. Kernel Density Estimation

Kernel Density Estimation (KDE) is a common method to analyze the spatial pattern of points [48,49]. It converts the point data into a continuous grid, where each grid unit records the number of points in the unit space, which then becomes a kernel density map. The map helps to understand the hot spots in the space. Using the “nuclear density” tool in the ArcGIS10.3 software, this study maps and analyzes the density of knowledge industries with 0.05 km2 as the unit and 2 km as the search radius, before analyzing the overall pattern of its spatial distribution and its agglomeration.

2.4.3. Multivariate Linear Regression

Since there is often a strong correlation between the variables of urban environmental amenities, in a way that independent variables may be collinear, the stepwise regression model can correct this problem to some extent [50]. Therefore, in order to scientifically reveal the mechanism of knowledge industry agglomeration, this study adopts the stepwise regression model of Ibm Spss Statistics 26 for analysis. Assuming that the dependent variable is Y, the regression equation between it and a series of independent variables X1, X2,…, and Xn can be expressed as follows:
Y = ɑ0 + ɑ1X1 + ɑ2X2 + … + ɑnXn + ε,
where Y is the dependent variable, which means the spatial density of knowledge industry in the street; X is the dependent variable, which means the spatial density of urban amenities in the street; ɑ0 is the equation constant, ɑ1 is the coefficient of the urban amenities X1, and so on. ɑn is the coefficient of the independent variable Xn and ε is a random error.

3. Results

3.1. Characteristics of the Spatial Structure of Knowledge Industries

The results in Table 4 show that there are obvious differences in the spatial agglomeration intensity among knowledge industries. On the one hand, the NNI of knowledge enterprises in Hangzhou is 0.054 and it has passed the significance level test of 0.05, which indicates that it has significant spatial agglomeration characteristics; on the other hand, the NNI is adjusted from small to large, showing that the spatial agglomeration intensity of knowledge industries in Hangzhou is the highest for the financial industry, followed by the scientific research and technical services, and lowest for the smart manufacturing industry. In other words, the financial industry has the smallest spatial distribution area and the most concentrated distribution range while the smart manufacturing industries are widely distributed and highly dispersed.

3.2. Spatial Location Characteristics of Knowledge Industries

3.2.1. Overall Spatial Location Characteristics of Knowledge Industries

The overall agglomeration pattern in Figure 5a shows that the knowledge industries are in a multi-center decentralized layout and their high-density areas are mainly distributed in the Yuhang Future Science and Technology City, the West Lake Zijin Port Science and Technology City, the Wulin and Lakeside Center, the Chengbei Xintiandi, Binjiang High-tech Zone, and the Xiasha Economic and Technological Development Zone. The high-density areas of knowledge industries in Hangzhou are developed around the “#”-shaped urban traffic skeleton (horizontally from the Wenyi West Road to the Desheng Expressway and from the Jiangnan Avenue to the Airport Expressway and vertically from the Shangtang Elevated Road to the Times Elevated Road and from Qiu Shi Elevated Road to Fengqing Expressway). Four characteristic plates, namely the Hangzhou West Science and Technology Innovation, East Zhizao, the North Canal Wenchuang, and the South Digital Economy, are connected in series through four traffic corridors.

3.2.2. Spatial Location Characteristics of Different Types of Knowledge Industries

According to the nuclear density diagrams of different types of knowledge industries in Figure 5b–d, the financial industry with strong economic activities occupies the core position of the city. The scientific research and technical service industry, which is dominated by emerging information technology, grows from the center to the outside along the traffic corridor, while the smart manufacturing industry, with high land demand intensity, spreads vine-like in the periphery of the axis.
Figure 5b shows that the overall distribution of the financial industries adopts the characteristics of core agglomeration, with obvious centripetal and business district orientation. Among them, the high-density areas of the financial industry mainly include Wulin, Qingchun, and the Qianjiang New City Business District, which is the commercial, administrative, economic, and cultural center of Hangzhou, and has laid the urban development pattern from the “West Lake era” to the “Qiantang River era.” The central area of the city is the intersection of capital flow, information flow, logistics, technology flow, and talent flow. It is not only a hub for commercial and business enterprises, but also a transportation and communication hub. The financial industry occupies the core area of the city, which is highly coincident with the core business district that has the highest development intensity.
Figure 5c illustrates that the distribution of the scientific research and technology service industry possesses the characteristics of central edge layout, with the orientation of cultural and educational areas. The high-density areas of the industry are mainly concentrated in a few zones: the West Cultural and Educational Zone, with the Zhejiang University at its core, includes the West Lake Digital Software Park, the East Software Park, and others; the Cangqian Higher Education Zone, with the Hangzhou Normal University as its core, includes the Alibaba headquarters, Dream Town, and so on; the Binjiang Higher Education Park, formed by the Zhejiang University of Traditional Chinese Medicine and the Zhejiang Police College, includes the Hikvision and Netease headquarters; and the Xiasha Higher Education Park, consisting of 14 universities, includes the Zhejiang University of Finance and Economics and the Zhejiang Gongshang University. With the Xihu District, the Yuhang District, and the Binjiang District at its core, the Hangzhou Cultural and Educational Zone, combined with the national high-tech industrial development zone, is Industry—University—Research integrated, becoming not only a training base for enterprise human resources, but also a practice base for college students.
Figure 5d indicates that the smart manufacturing industry possesses the characteristics of a peripheral distributed multi-area layout, which has the orientation of an industrial park. As a whole, it has formed high-end manufacturing clusters based around the Hangzhou High-tech Development Zone (Binjiang), the Dajiangdong Industrial Cluster Zone (Linjiang National High-tech Zone), the Hangzhou Economic and Technological Development Zone (Qiantang District), the Xiaoshan Economic Development Zone, the Qianjiang Economic Development Zone (Yuhang District), and the Airport Economic Demonstration Zone. On the one hand, due to the large area of industrial parks, the large investment scale, the long construction period, and the slow value transfer, the high-tech industries with parks based around parks are forced to move outward due to the increased rents in the city center. On the other hand, industrial parks are generally far from the city center, and various amenities are relatively lacking. High-tech employees are mainly engineers and technicians who are engaged in the primary production activities of knowledge-based products.

3.3. Influencing Factors of Knowledge Industrial Location

The stepwise regression model is used to further examine the influence of the urban environment on employment groups in different knowledge industries. The influencing factors with a coefficient of variance expansion (VIF) greater than 10 are excluded (note: it is considered that when the coefficient of variance expansion (VIF) of general variables is greater than 10 and the tolerance is less than 0.1, the research variables are collinear with other variables) [51], obtaining three regression models. The model results in Table 5 show that urban amenities have a strong coefficient could explain the spatial agglomeration power of knowledge industries in Hangzhou, as all indicators of its diagnosis report hold: the sig is less than 0.01, passing the significance test; the value of f is greater than 0, meaning that all regression models are valid; and R2, which represents the goodness of the model fit, as well as the corrected R2 of the three models, are all greater than 0.4, indicating that the fitting effect of the model is valid [51].
Model 1 shows that the location of enterprises in the financial industry is mainly affected by transportation and catering amenities. First of all, there is a strong spatial correlation between the financial industry and the parking lot, with a coefficient of 0.659. It can be observed that the frequent face-to-face communication needs of high-paid employees mean that this group relies more on private than on public transportation. Door-to-door and point-to-point cars can provide convenient services, providing the clerks the highest business access opportunities per unit time. We also find a strong relationship between the geographical distribution of financial industries and urban cafés, with a coefficient of 0.318. As a consumption micro-space under multicultural integration, the city café is not only an important social structure for leisure, consumption, work communication, and personal privacy, but also a place for forming a personal social network, promoting higher-level thought exchange and innovation cooperation, and thus improving innovation output. Café amenities in cities are often gathered near large shopping malls and business districts, which is in line with the demand of high-paid elites to pursue an innovative atmosphere and the consumption concept of high-quality spiritual preference.
Further, Model 2 shows that the location of enterprises in the scientific research and technology service industry is mainly influenced by entertainment, education, and landscape amenities. (1) Regarding entertainment amenities, the influence of sports and fitness places on the location selection in this industry is significantly positive. With the continuous development of China’s social economy and medical level, white-collar workers have higher requirements for their quality of life and are paying more attention to health. The existence of sports and fitness places helps to attract knowledge workers. (2) In terms of educational amenities, there is a strong spatial relationship between the scientific research and technical service industry and universities. Colleges and universities are often hotspots for high-quality communities and gentrified areas. These places of cultural consumption have a strong knowledge atmosphere and many personalities, making them crucial for acquiring social capital and social networks. This result also explains why numerous scientific research and technology service enterprises have gathered around the Hangzhou Cultural and Educational Zone. (3) Regarding landscape amenities, parks have a significant impact on the science and technology service industries. Middle-and high-end white-collar workers pay more attention to physical and mental health and pursue a comfortable working lifestyle and parks help to relieve the working pressure of talents and stimulate their inspiration and imagination.
Model 3 shows that the location choice of smart manufacturing industries is mainly affected by catering, service, and educational amenities. (1) Regarding catering amenities, the smart manufacturing industry’s choice is affected by fast food amenities. Since the employment groups in high-tech industries have relatively low income, they mainly try to meet the basic living needs of “food, clothing, housing, and transportation,” paying more attention to basic living security amenities. (2) In terms of service amenities, there is a negative correlation between shopping centers and smart manufacturing industries. This phenomenon indicates that shopping centers often coexist with service-oriented enterprises with high profit margins and strong rent paying ability in the space, while smart manufacturing industries have weak rent space competing abilities and are “driven” to the suburbs, showing that the consumer market and infrastructure are relatively lagging behind. (3) Regarding educational amenities, scientific research institutions have a significant impact on the location of high-tech industries. These institutions can provide a steady stream of mid-level human resources for smart manufacturing companies, showing a development pattern of cooperation and common prosperity between scientific research institutions and smart manufacturing industries.

4. Discussion

4.1. Spatial Location Characteristics of Knowledge Industries

In the era of Industry 4.0, the new economy and new activities have a more flexible spatial layout and industrial knowledge activities tend to spread from the central area to the periphery. Modern high-end knowledge industries in Hangzhou, which are mainly composed of finance, R&D, commerce, science, and technology and information, are greatly influenced by the traditional urban core areas (West Lake, Gongshu, Riverside, and Shangcheng) and tend to gather in the central customer market. Smart manufacturing industries are mainly distributed in the old industrial areas of the main city (Yuhang, Linping, Qiantang, and Xiaoshan) due to the implementation of the related industrial policies, such as “retreating from two industries to three industries” and “leaving the city to enter the park.” The new generation development zones, represented by new cities and districts, have also become the basis of developing industries, showing a relatively scattered distribution trend.
Relying on the “#”-shaped skeleton of the city, Hangzhou’s knowledge industry has formed a mutually beneficial symbiotic ecosystem. The linearly distributed scientific research and technical service industry serves as a “bridge,” connecting the financial industry in the central area with the smart manufacturing industry in the outer suburbs, allowing them to realize technical services and information exchange. With the financial scientific research and technical service industry, innovative activities are continuously stimulated through knowledge sharing, financial support, and other means, so that the technological research and development capability are enhanced and the deep integration of technology and finance is realized. The financial and scientific research service industry provides professional support for the financing, R&D design, production technology, product testing, product marketing, after-sales service, and other links of the smart manufacturing industry, providing inexhaustible power for its industrial structure upgrading.

4.2. Influencing Factors of Knowledge Industrial Location

Because of the different industry attributes, the facilities preferences of employment groups in the knowledge industries are quite different. Employment groups in the financial industry, represented by high-paid businesspeople, have higher demands for spiritual activities and entertainment, preferring to pursue high-quality and fast-paced lifestyles and to be close to personalized consumption places. The employment groups of the scientific research and technology service industry, represented by middle- and high-level white-collar workers, have high demands for leisure and culture and thus prefer a good development environment. The characteristic space with pleasant ecology and strong innovation atmosphere has great attraction to them. The employees within the smart manufacturing industry, represented by the masses of wage earners, are mainly focused on their basic needs and safety, so more emphasis is placed on “food, clothing, housing, and transportation” amenities closely related to basic life.
In the age of intelligence, the knowledge industry is based on mental labor and intellectual services. The city attracting talents with a high-quality city life and comfortable facilities and then attracting industries with talents create prosperity, that is, “attracting industries with people”. In the context of urban renewal focusing on knowledge industries, the organic combination of industrial transformation and upgrading with urban renewal can, on the one hand, force the city to change its old appearance into a new one through industrial facilitation and, on the other hand, pave a good ecology for industrial development through urban renewal. By continuously upgrading the level of talent structure, we can promote the optimization of industrial structures and the development of technology-intensive and knowledge-innovative industries at the high end of the industrial chain. Therefore, cities need to create a research atmosphere and humanistic environment compatible with the demand of talents to attract talents and strengthen the collision among them, to promote the development of urban knowledge industries.

4.3. Policy Implications

According to the location characteristics and laws of Hangzhou’s knowledge industries, especially the special space requirements of knowledge innovation activities, the policymakers of each city should plan, guide, design, and create a suitable urban built environment to maximize the creative potential of knowledge human resources and promote the transformation and upgrading of urban industries.
Firstly, we suggest that policymakers should strengthen the macro-structure control and guide industries to optimize layout. The construction of the knowledge industry space system of the “central decision-making core-suburban innovation circle-outer suburban manufacturing city” should be sped up. The “decision-making core” remodeling of the traditional central area with the concept of the “city brain” is needed to strengthen the engine role of commercial finance in the development of knowledge industries and create a central dynamic area with intensive knowledge elements. We further suggest the “suburb innovation circle” with the concept of a “future community,” creating a knowledge industry innovation circle of the “integration of humanism, ecology and digitalization” and the “trinity” of industry, culture, and tourism, which will continuously stimulate the innovation power of high-quality talents. The next implication is the “outer suburb” manufacturing city reconstruction of the industrial park with the concept of the “industrial neighborhood” to improve the production and living service environment and promote universities, scientific research institutions, localities, and enterprises to jointly carry out technology research and development, achievement transformation and talent cultivation.
Secondly, we suggest that policymakers optimize meso-spatial connections and improve the overall efficiency of the industry. The necessary actions include relying on the “#”-shaped urban traffic skeleton; strengthening the construction of the urban “double express” system (express highway and express track); speeding up the formation of efficient channels of logistics, people flow, information flow, capital flow, and technology flow; and promoting the flow of innovative elements among knowledge industries. Further, we suggest extending, expanding, and upgrading the urban expressway; building a transportation network system of “urban accessibility and group intercommunication”; and promoting the rapid connection between the core urban area and several major industrial sectors in the southeast, northwest, and northwest of the city. Improving the “last mile” transportation connection system around the rail station is required to create a safe, healthy, comfortable, and pleasant walking or riding environment.
Finally, we suggest that policymakers refine the micro-environment design and improve the quality of urban living. The high-quality living environment becomes the key factor for high-quality talents to stay. We put forward the creation of a good atmosphere of innovation and openness, cultivating an innovative creative space through urban renewal, old factory renovation, and other forms. Furthermore, we suggest embedding more innovative cultural elements, such as musical fountains, thinkers’ sculptures, and various kinds of exotic leisure seats, and planning creative festivals, creative street art, and other cultural activities to stimulate creativity and communication. Using the basic commercial supporting amenities, such as restaurants, convenience stores, and consultation centers, on the ground floor of the building and adding functional amenities, such as clubs, tea bars, and gymnasiums, that consider leisure to strengthen the comprehensive diversity of services is needed. We lastly suggest relying on regional characteristics and contexts to darn the core public functions, building a regional ecological vitality space, as well as a one-stop “city-producing people” integration community with complex functions, high efficiency, and convenience.

4.4. Limitations and Further Study

There are some limitations to this study that are worthy of further research. First of all, the current measurement methods and data of knowledge activities mainly come from the traditional research of industrial agglomeration, so it is necessary to continue examining the measurement indicators and methods specifically for innovative knowledge agglomeration. Secondly, this study is a static observation and description, lacking the reflection of the dynamic evolution of innovation activities, such as agglomeration, diffusion, and structural adjustment. Finally, in terms of influencing factors, since the different indicators of urban amenities have varying effects on countries and cities, the difference of comfort effects combined with regional characteristics and its mechanism still need to be further discussed. Future surveys can use multi-source geospatial data, such as topography, population, and climate, to comprehensively consider the impact of location selection of urban knowledge industries from the aspects of social economy, natural conditions, and policy impact. In addition, we can perform dynamic comparative analyses in different years and cities to provide effective reference for rational regional planning.

5. Conclusions

At present, global industrialization has entered the 4.0 era, knowledge elements have become a new resource for competition among cities. Many countries in the world have begun to promote their own projects. Whether it is the Industrial Internet in the United States, Industry 4.0 in Germany, or Made in China 2025, their core aim is to enhance the competitiveness of cities through technological innovation, while appropriate urban planning based on the better understanding of the spatial agglomeration characteristics of knowledge-based industry will facilitate industrial development and evolution. Therefore, using Hangzhou, a city famous for its knowledge industry, as an example, this study makes an in-depth analysis of the spatial agglomeration characteristics and location selection factors of the urban knowledge industry by using the nearest neighbor index, nuclear density, and stepwise regression model. The following conclusions are obtained:
(1) From the perspective of spatial structure, the financial industry has the highest spatial agglomeration intensity of knowledge industries, followed by the scientific research and technology service industry, and the smart manufacturing industry with the lowest. From the perspective of the spatial distribution pattern, the spatial distribution of knowledge industries is agglomerated in the shape of “#”, which is in line with the urban skeleton. Among them, the financial industry is located at the core of the city, the scientific research and technical service industry grows along the traffic corridor in a beaded manner, and the smart manufacturing industry spreads in the periphery of the axis in a vine manner.
(2) The facility preferences of the different knowledge industries are quite different. The most significant correlation in the financial industry is with parking lots and cafés. The scientific research and technical service industry is closer to sports and fitness, universities, and parks, while the smart manufacturing industry has a strong connection with snacking spots and scientific research institutions.

Author Contributions

Conceptualization, validation, supervision, funding acquisition, writing—review and editing, Q.C.; resources, methodology, software, data curation, validation, formal analysis, visualization, writing—original draft preparation, J.C.; supervision, investigation, Y.Y. All authors have read and agreed to the published version of the manuscript.

Funding

This research was funded by “Research on Risk Assessment and Management Mechanism of Sponge City Construction” (No.16ZDA018).

Institutional Review Board Statement

“Not applicable” for studies not involving humans or animals.

Informed Consent Statement

”Not applicable” for studies not involving humans.

Data Availability Statement

The data presented in this study are available on request from the corresponding author.

Acknowledgments

The author gratefully acknowledges the editors and referees for their positive and constructive comments in the review process.

Conflicts of Interest

The authors declare no conflict of interest.

References

  1. Yonghui, L.; Bolan, S.; Shun, H.; Sen, L. The spatial effect of producer services agglomeration and urban technological innovation-an empirical analysis based on the panel data of 108 cities in the Yangtze River Economic Belt. Econ. Geogr. 2021, 41, 65–76. [Google Scholar] [CrossRef]
  2. Fan, X.; Jianzao, R.; Mindong, W.; Tianhui, L.; Wenying, F. Spatial and temporal distribution and influence mechanism of Chinese high-tech enterprises since the 21st century. Econ. Geogr. 2018, 38, 27–35. [Google Scholar] [CrossRef]
  3. Zhiqiang, W.; Jian, W.; Deren, L.; Lieyun, D.; Anrong, D.; Feng, Z.; Tao, Y.; Helin, L.; Junyan, Y.; Ying, L.; et al. The “cold” thinking under the boom of smart city academic writing. J. Urban Plan. 2022, 2, 1–11. [Google Scholar] [CrossRef]
  4. Honghui, Z.; Liang, H.; Siqi, T. Thinking about the Transformation of Urban Governance Model in the Context of Epidemic: Exploring the Logic, Concept and Path of “Dual Intelligence Synergy” Construction of Smart Planning and Smart City. China Urban Planning. 2020. Available online: https://mp.weixin.qq.com/s/MaKWBAPhn04JujRoYyF24g (accessed on 16 October 2022).
  5. Feng, Z.; Yu, K. A framework for “people-technology-space” integrated smart city planning. J. Urban Plan. 2021, 45–52. [Google Scholar] [CrossRef]
  6. Yang, W.; Ren, Y.; Qiang, L.; Xi, W. Spatial layout characteristics and patterns of Guangzhou banking industry. Geogr. Sci. 2016, 36, 742–750. [Google Scholar] [CrossRef]
  7. Ruogu, Y. A Study on the Spatial Divergence of Synergistic Agglomeration in the Financial Industry—An Observation Based on the Site Selection of Financial Enterprises in Shenzhen. Guangdong Soc. Sci. 2021, 5, 26–35. [Google Scholar]
  8. Min, X.; Hongyan, Z.; Nana, Z.; Yuanjun, Z. Spatial pattern evolution and location selection of software industry in Ningbo. Econ. Geogr. 2017, 37, 127—134+148. [Google Scholar] [CrossRef]
  9. Jinlei, G.; Huiming, Z. Spatial pattern evolution and location selection of software and information technology service enterprises in Chongqing’s main urban area. Trop. Geogr. 2021, 41, 1270–1279. [Google Scholar] [CrossRef]
  10. Chengjun, L.; Zhouyuanye, W.; Xushuang, L.; Jianping, Z.; Jianhua, J.; Hehong, H. Spatial Pattern Evolution and Location Choice of Internet Start-ups—Hangzhou as an Example. Econ. Geogr. 2021, 41, 107—115+146. [Google Scholar] [CrossRef]
  11. Lin, G.C.S.; Yang, F.F.; Hu, F.Z.Y. The new geography of information and consulting services in China: Comparing Beijing and Guangzhou. Habitat Int. 2012, 36, 481–492. [Google Scholar] [CrossRef]
  12. Dandan, W.; Renfeng, M.; Yue, Z.; Yixia, J.; Yiran, Z. Hangzhou Cultural and Creative Industry Agglomeration Characteristics and Spatial and Temporal Pattern Evolution. Econ. Geogr. 2018, 38, 127–135. [Google Scholar] [CrossRef]
  13. Ruzhong, C.; Yang, Z.; Yanlin, H.; Hua, G. Research on Spatial Agglomeration and Influence Effect of Cultural and Creative Industries in Yangtze River Delta Urban Agglomeration. Silk 2022, 59, 79–89. [Google Scholar]
  14. Florida, R. The Rise of the Creative Class: Revisited, 2nd ed.; Basic Books: New York, NY, USA, 2014; pp. 593–596. [Google Scholar]
  15. Aaron, S.D.; Nichols, C.T. Scenescapes:How Qualities of Place Shape Social Life; University of Chicago Press: Chicago, IL, USA, 2016; p. 2019. [Google Scholar]
  16. Grimes, A.; Badenhorst, S.; Maré, D.C.; Poot, J.; Sin, I. Quality of life, quality of business, and destinations of recent graduates: Fields of study matter. Ann. Reg. Sci. 2022, 7, 1–26. [Google Scholar] [CrossRef] [PubMed]
  17. Wei, C.; Rong, S.; Yongchao, Z.; Shihai, T. Research on performance evaluation of patent innovation in knowledge-intensive industries in China—Based on DEA-Malmquist index method. Manag. Rev. 2013, 25, 39—45+53. [Google Scholar] [CrossRef]
  18. Bing, S.; Jian, Z. Research on the diffusion and evolution of technological innovation in knowledge-intensive industries—from the perspective of network structure evolution analysis. J. Inf. 2013, 32, 198—203+184. [Google Scholar]
  19. Xiaoya, W.; Guoyang, W. Research on the synergy degree and influencing factors of knowledge-intensive industries. China Sci. Technol. Forum 2015, 47–53. [Google Scholar] [CrossRef]
  20. Peng, Y.; Xin, T.; Wenwu, P.; Huiqing, C. Research on the spatial association of potential innovation elements synergy and its relationship with the upgrading of high-tech industries in the Yangtze River Delta. Econ. Geogr. 2020, 1–14. Available online: http://kns.cnki.net/kcms/detail/43.1126.K.20200616.1623.002.html (accessed on 16 October 2022).
  21. Guangyu, L.; Zhongzhong, S.; Zijian, Z. Empirical test of the influencing factors of China’s high-tech industry innovation. Econ. Manag. Res. 2016, 37, 85–90. [Google Scholar] [CrossRef]
  22. Jinliao, H.; Gang, Z. Dynamic Mechanism of Creative Industry Agglomeration Driven by Urban Comfort—Taking Nanjing Brand Design Industry as an Example. Econ. Geogr. 2019, 39, 134—142+161. [Google Scholar] [CrossRef]
  23. Feilong, H.; Yuxin, Y.; Shijun, W. Spatial characteristics and influencing factors of innovation output in Changchun from the perspective of urban comfort. Hum. Geogr. 2020, 35, 61—68+129. [Google Scholar] [CrossRef]
  24. Yue, W. Does the flow of R&D elements promote the spatial convergence of regional innovation quality-from the perspective of urban comfort. J. Beijing Inst. Technol. 2021, 23, 62–70. [Google Scholar] [CrossRef]
  25. Chang, L.; Yingjie, Y.; Hui, L. The relationship between urban comfort, difference and innovation ability in Beijing. Geogr. Sci. 2022, 42, 115–125. [Google Scholar] [CrossRef]
  26. Jiang, X.; Fu, W.; Li, G. Can the improvement of living environment stimulate urban Innovation?—Analysis of high-quality innovative talents and foreign direct investment spillover effect mechanism. J. Clean. Prod. 2020, 255, 120212. [Google Scholar] [CrossRef]
  27. Dong, P. Research on Innovation and Development of Digital Economy Empowerment Strategic Emerging Industry. Theor. Discuss. 2022, 168–172. [Google Scholar] [CrossRef]
  28. Yingjie, R.; Jianguo, D.; Xia, Z. Innovation—Research on Employment under Industrial Upgrading. Sci. Manag. Res. 2022, 40, 83–90. [Google Scholar] [CrossRef]
  29. Bao, L. “Expertise and innovation” enterprises drive the construction of manufacturing power: Why is it possible and possible? Contemp. Econ. Manag. 2022, 44, 31–38. [Google Scholar] [CrossRef]
  30. Ling, N.; Yutong, S.; Chunyao, O. Analysis and Evaluation of Innovation Efficiency of Regional Marine High-tech Industry from the Perspective of Triple Helix Theory. Sci. Technol. Manag. Res. 2022, 42, 57–64. [Google Scholar]
  31. Naiquan, L.; You, W.; Guozhen, Z. The impact of specialized agglomeration and diversified agglomeration on regional innovation efficiency—An empirical analysis based on spatial Durbin model. Econ. Issues Explor. 2016, 2, 89–96. [Google Scholar]
  32. Wencheng, W.; Yuan, S. Research on the spatial effect of the collaborative agglomeration of producer services and high-tech industries on regional innovation efficiency. J. Manag. 2022, 19, 696–704. [Google Scholar]
  33. Qiang, Z.; Xia, D. Research on the Influence of Productivity Heterogeneity of Knowledge-intensive Service Industry. J. Henan Univ. 2022, 62, 21—27+152—153. [Google Scholar] [CrossRef]
  34. Jichuan, L. On Knowledge as the Power of Economic Growth. In Proceedings of the Documents of the Fourth National Congress of China Society of Dialectics of Nature, Beijing, China, 1 May 1996; pp. 70–73. [Google Scholar]
  35. Machlup, F. The Production and Distribution of Knowledge in the United States; Princeton University Press: Princeton, NJ, USA, 2007. [Google Scholar]
  36. Philip, C.; Andrea, P. Regional Development in the Knowledge Economy; Taylor and Francis: London, England, 2006; p. 2006. [Google Scholar]
  37. Peters, M.A.; Britez, R.; Bulut, E. Cybernetic capitalism, informationalism and cognitive labor. Geopolit. Hist. Int. Relat. 2009, 1, 11–40. [Google Scholar]
  38. Franke, S.; Kloosterman, R. Creativity and the City: How the Creative Economy Changes the City; NAi Publshers: Rotterdam, The Netherlands, 2006. [Google Scholar]
  39. Scott, A.J. Social Economy of the Metropolis: Cognitive-Cultural Capitalism and the Global Resurgence of Cities; Oxford University Press: Cary, NC, USA, 2008. [Google Scholar]
  40. Florida, R. High-Tech Dynamics. Science 1994, 264, 1614–1615. [Google Scholar] [CrossRef] [PubMed]
  41. Zheng, W.; Kejing, M.; Xiao, L.; Jingyuan, Z.; Shuling, X. Analysis of the location factors of the formation of high-tech industrial clusters. J. Geogr. 2005, 4, 567–576. [Google Scholar]
  42. Zahed, Y.; Hashem, D. How Do ICTs Affect Urban Spatial Structure? A Systematic Literature Review. J. Urban Technol. 2020, 27, 47–65. [Google Scholar]
  43. Song, Z.; Liu, W. The challenge of wide application of information and communication technologies to traditional location theory. J. Geogr. Engl. Ed. 2013, 23, 16. [Google Scholar] [CrossRef]
  44. Liu, J.; Feng, Z.; Shanqi, Z.; Yu, K.; Zhixuan, L. Spatial distribution characteristics and influencing factors of the new generation information technology enterprises in sss—A case study of downtown Nanjing. Econ. Geogr. 2022, 42, 114—123+211. [Google Scholar] [CrossRef]
  45. Chen, Y.; Rosenthal, S.S. Local amenities and life-cycle migration: Do people move for jobs or fun? J. Urban Econ. 2008, 64, 519–537. [Google Scholar] [CrossRef]
  46. Chengli, T.; Weiyang, C.; Jiamin, W.; Guohua, Z.; Meixia, W.; Xiashuang, G. Study on the Spatial Distribution and Industrial Aggregation Characteristics of Development Zones in Yangtze River Economic Zone. Geogr. Sci. 2020, 40, 657–664. [Google Scholar] [CrossRef]
  47. Yan, X.; Xuqiong, W.; Jun, X.; Shizhen, C. Analysis on the Spatial Distribution of Creative Industries and the Impact of Urban Location Function—A Case Study of Taichung City. Areal Res. Dev. 2022, 41, 52–58. [Google Scholar]
  48. Yarong, Z.; Renxu, G. Spatial pattern and influencing factors of digital creative listed companies in China. Geogr. Sci. 2022, 42, 1370–1380. [Google Scholar] [CrossRef]
  49. Qin, Y.; Xiaolei, X.; Senlin, H.; Gang, Z.; Jianlin, L. Spatial pattern and influencing factors of artificial intelligence industry in Yangtze River Delta. Resour. Environ. Yangtze River Basin 2022, 31, 526–536. [Google Scholar]
  50. Bing, Y.; Yan, Y. Stepwise regression analysis and its application. Stat. Decis. 2017, 14, 31–35. [Google Scholar] [CrossRef]
  51. Wentong, Z.; Wei, D. Advanced Course of SPSS Statistical Analysis; Higher Education Press: Beijing, China, 2013. [Google Scholar]
Figure 1. (a) The scope of Hangzhou city. (b) The scope of the research area in this study.
Sustainability 14 14594 g001aSustainability 14 14594 g001b
Figure 2. (a) Development path of traditional industries. (b) Development path of knowledge industry.
Sustainability 14 14594 g002
Figure 3. Education of knowledge industry workers in Hangzhou from 2016 to 2020.
Sustainability 14 14594 g003
Figure 4. Skill quality and salary of knowledge industry workers in Hangzhou in 2020.
Sustainability 14 14594 g004
Figure 5. (a) Analysis of kernel density estimation of knowledge industry. (b) Analysis of kernel density estimation of financial industry. (c) Analysis of kernel density estimation of scientific research technology service industry. (d) Analysis of kernel density estimation of smart manufacturing industry.
Sustainability 14 14594 g005aSustainability 14 14594 g005b
Table 1. Comparison between traditional and knowledge industries.
Traditional IndustryKnowledge Industry
PeriodIndustrial age, Industrial economyIndustry 4.0, knowledge economy
Factor of productionLabor, capital, raw materialsHuman capital, technology
Product featuresMechanization, standardizationIntelligent, added value
Location selection factorThe location requirements of the industry itselfLocation preference of knowledge talents
Influencing factors of employment“Material and production”: that is, wages and rents are the main reasons that affect the flow of labor and capital“Consumption and environment”: urban livability is the deep power that determines the spatial location of workers
Related theoriesIndustrial agglomeration theory, disequilibrium theoryCreative class theory, spatial equilibrium theory, scenes theory
Table 2. Classification of knowledge industries.
Industry NameSpecific SubdivisionNumbers
Financial industry (F)Financial services, capital market services, insurance, and other financial industries10,611
Scientific research and technical service industry (S)Research and experimental development, professional technical services, science and technology popularization, and application services.90,708
Smart manufacturing industry (M)Manufacturing, aviation, spacecraft and equipment manufacturing, electronic and communication equipment manufacturing, computer and office equipment manufacturing, medical equipment and instrumentation manufacturing, and information chemicals manufacturing.8726
Table 3. Variables of urban amenities.
Primary IndexSecondary IndexThree-Level IndexIndex Description
Business amenitiesTraffic amenitiesSubway stationsDensity of subway stations
Bus stationDensity of bus station
Parking lotDensity of parking lot
Educational amenitiesInstitutions of higher learningThe density of undergraduate, specialized, and junior colleges
Research instituteDensity of research institute
Landscape amenitiesParkProportion of park area
SquareDensity of the square
Living amenitiesCatering amenitiesCaféDensity of cafés
Snack barsDensity of snack bars
Service amenitiesShopping centerDensity of department stores and supermarkets
Beauty salonDensity of beauty, skin care, and barber shops
Recreational amenitiesFitness placeGym, bowling, Taekwondo, tennis courts, and other densities
Nightlife placeDensity of KTV, bars, nightclubs, and music bars
Table 4. Results of the nearest neighbor index of knowledge industry in Hangzhou.
Industry TypeObservation Distance (m)Expected Distance (m)NNIZ Scorep Value
Knowledge industry9.69126.370.08−549.22<0.01
Financial industry57.96418.720.14−63.31<0.01
Scientific research and technical service industry54.19332.330.19−179.46<0.01
Smart manufacturing industry141.93520.550.27−103.00<0.01
Table 5. Results of stepwise regression analysis of knowledge-based industries.
ModelVariableModel Parameter
BBetatsigVIF
(1)
Financial industry
(Constant)−0.569 −2.7130.008 R2 = 0.923,
Adjusted R2 = 0.922;
F = 565.444;
Durbin—Watson = 1.966
Parking lot (X1)0.1020.6598.86306.779
Café (X2)0.2970.3184.27606.779
Y = −0.569 + 0.102X1 + 0.297X2
(2)
Scientific research and technical service industry
(Constant)0.702 1.3270.188 R2 = 0.765,
Adjusted R2 = 0.758;
F = 101.020;
Durbin—Watson = 1.917
Fitness place (X1)1.0110.64310.16201.586
Institutions of higher learning (X2)33.1520.3936.68601.367
Park (X3)0.1730.132.370.0021.189
Y = 0.702 + 1.011X1 + 33.152X2 + 0.173X3
(3)
Smart manufacturing industry
(Constant)0.77 4.8310 R2 = 0.649,
Adjusted R2 = 0.637;
F = 57.221;
Durbin—Watson = 2.066
Snack bars (X1)0.2361.0076.75805.882
Shopping center (X2)−0.64−0.453−3.3010.0014.98
Research institute (X3)3.7680.2373.1650.0021.49
Y = 0.77 + 0.236X1 + −0.64X2 + 3.768X3
Publisher’s Note: MDPI stays neutral with regard to jurisdictional claims in published maps and institutional affiliations.

