Article

Growth Suitability Evaluation of Larix principis-rupprechtii Mayr Based on Potential NPP under Different Climate Scenarios

College of Forestry, Hebei Agricultural University, Baoding 071000, China
*
Author to whom correspondence should be addressed.
These authors contributed equally to this work.
Sustainability 2023, 15(1), 331; https://doi.org/10.3390/su15010331
Submission received: 5 December 2022 / Revised: 21 December 2022 / Accepted: 22 December 2022 / Published: 25 December 2022
(This article belongs to the Section Sustainable Forestry)

Abstract

:
Larch (Larix principis-rupprechtii Mayr) is a major coniferous tree species in northern China, and climate change has serious impacts on larch growth. However, the impact of future climate change on net primary productivity (NPP) and the growth suitability of larch is unclear. Based on forest inventory data, spatially continuous environmental factor data (climate, topography, soil), and NPP from the Carnegie-Ames-Stanford approach (CASA) model in the study area, the random forest (RF) model was used to simulate the potential NPP and growth suitability of larch under different shared socioeconomic pathways (SSP1-2.6, SSP2-4.5, SSP3-7.0, SSP5-8.5) for current and future (2041–2060, 2080–2100). The correlation between potential NPP and determinants under different climate scenarios was analyzed at the pixel scale. The results showed that: (1) RF showed excellent performance in predicting the potential NPP of the region (R2 = 0.80, MAE = 15.61 gC·m−2·a−1, RMSE = 29.68 gC·m−2·a−1). (2) Under current climatic conditions, the mean potential NPP of larch was 324.9 gC·m−2·a−1. Low growth suitability of larch occurred in most parts of the study area, and high growth suitability only existed in the Bashang area and the high-elevation mountains. (3) The total area of high and medium growth suitable areas were projected to be 76.0%, 66.7%, 78.2%, and 80.8% by the end of this century under the SSP1-2.6, SSP2-4.5, SSP3-7.0, and SSP5-8.5 climate scenarios, respectively. (4) Under the SSP1-2.6 and SSP2-4.5 climate scenarios, the temperature had a significant contribution to the accumulation of the larch’s NPP, whereas precipitation had less effect on the larch’s growth. The results provided a theoretical basis for the adaptive management of larch forests under global climate change.

1. Introduction

Forest ecosystems are a major component of global terrestrial ecosystems, covering about 30% of the world’s land area and having 75% of terrestrial gross primary production [1]. It plays a key role in regulating the global carbon balance, reducing greenhouse gas emissions, and mitigating climate warming [2]. However, climate change increases the probability and severity of extreme events [3], which will have some impact on forest ecosystem structure and function [4]. The Intergovernmental Panel on Climate Change reports that global temperatures have increased by about 0.6 °C in recent decades and are expected to continue to rise by 1.4–5.8 °C by 2100 [5]. With the intensification of global climate change, the global carbon cycle has become one of the central issues in climate research. Net primary productivity (NPP) is considered to be an important regulator in the global carbon cycle [6,7] and also a key indicator of forest productivity. Therefore, exploring the trends of forest productivity and the response mechanisms to environmental factors under climate change is significant for adaptive forest management and sustainable forest development [8,9].
Because NPP is susceptible to climate change [10], it can illustrate vegetation health and ecological quality to some extent [11] and has become an important indicator for assessing forest ecosystems in response to future climate change [12,13]. The dynamics of NPP are directly influenced mainly by environmental factors [14]. Currently, several studies have investigated the effects of climate [15], topography [16], soil [17], and CO2 concentration [18] on NPP. It is generally accepted that temperature and precipitation are the key determinants influencing forest NPP [19]. Ji et al. [20] identify precipitation variation as the main factor causing NPP variability in Chinese forests, followed by temperature factors. In contrast, Zhang et al. [21] obtained the opposite conclusion in their study. In the simulation of potential future forest NPP, it is found that forests responded differently to climate change in different regions [18], forest types [22], and under different climate scenarios [23], making the prediction results highly uncertain. How to accurately model and predict potential regional NPP is important for exploring forest ecosystem productivity.
It is crucial to choose a suitable algorithm to simulate regional NPP. With the development of remote sensing and GIS technologies, the estimation of vegetation NPP using remote sensing data has become the most prominent feature of NPP modeling studies and simulation methods [24]. Among them, the Carnegie-Ames-Stanford approach (CASA) model is widely used for NPP estimation at global and regional scales due to its less dependence on ground truth data and the relatively few input parameters of the model, which are easy to collect [25,26]. Chen [27] simulates the month-by-month NPP of terrestrial ecosystems in China for the past 31 years using the CASA model. Wang et al. [28] simulate the NPP of terrestrial ecosystems in China for the period 2001–2013 using a modified CASA model. For the simulation of potential NPP of forests under future climate conditions, some studies have linked environmental variables to NPP by indirect methods [29,30]. Multiple linear regression (MLR) [2], random forest (RF) model [31], and artificial neural networks (ANN) [10] have been applied to regional potential NPP simulations. Among them, the RF model shows good results in estimating NPP using remote sensing data [32]. Ong et al. [33] demonstrate the effectiveness of RF in simulating regional NPP; Li et al. [2] found that the prediction accuracy of the RF model is better than other models by comparing the performance of multiple models in estimating forest NPP in the study area. Yu et al. [32] show a good correlation between simulated regional NPP values and MODIS products using the RF model. Meanwhile, RF models are applied to assess the effects of different drivers on NPP [31]. Therefore, this study used the RF model to predict the potential NPP for regional forests under different climate scenarios.
Larch (Larix principis-rupprechtii Mayr) is a valuable native coniferous species in north China. It is widely used for afforestation in warm-temperate subalpine areas in China because of its rapid growth, excellent timber quality and high resistance to adversity [34]. Larch is considered to be sensitive in response to climate change [35]. Cheng et al. [36] show that the suitable distribution area of larch in northern China will be significantly reduced under future climatic conditions, and there is a tendency to migrate to higher latitudes. Meanwhile, it has been suggested that climate warming will probably promote the accumulation of larch’s NPP in northern China [37]. Wu et al. [38] found that different future climate scenarios may have different effects on the distribution and productivity of Larix kaempferi (Lamb.) Carr. However, we know little regarding the impact of climate change on productivity and suitable distribution areas for the growth of larch. Exploring the productivity and suitable distribution areas of larch under different future climate scenarios is important for improving silvicultural practices and developing forest management strategies.
In this study, we address the following three objectives to (1) predict the potential NPP of larch under current and projected climate scenarios; (2) assess the distribution area of growth suitability for larch using potential NPP indicator; (3) explore the effects of main determinants on the productivity of larch under future climate scenarios. The results may provide a theoretical basis for the adaptive management of larch forests under global climate change.

2. Materials and Methods
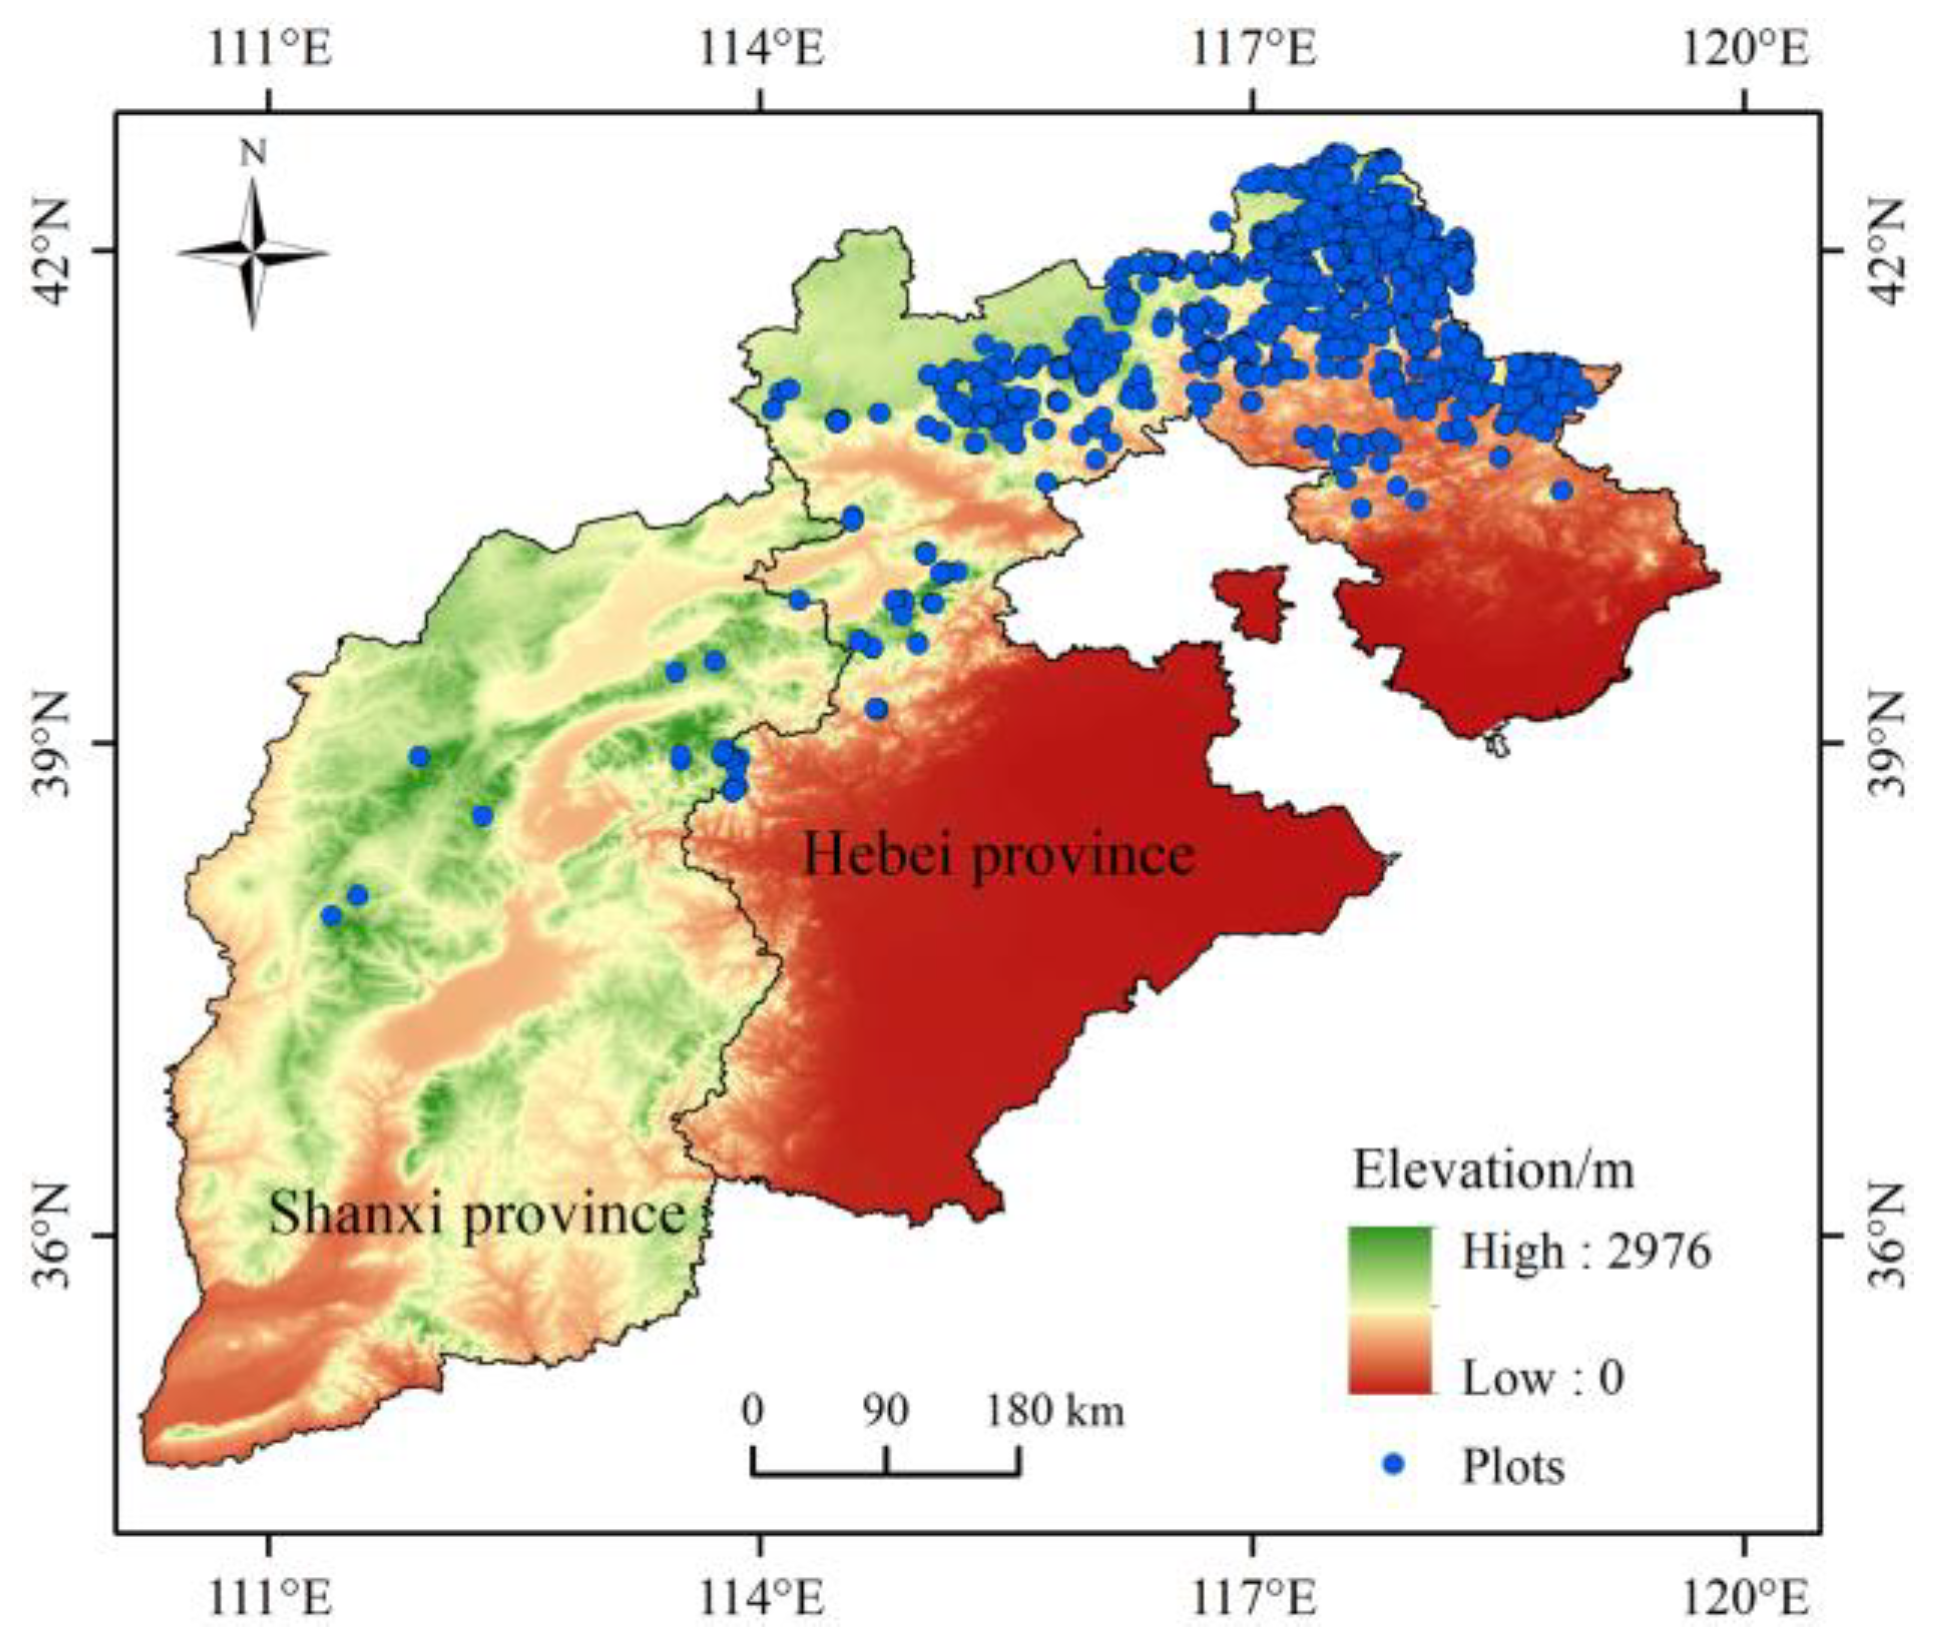
2.1. Study Site

The study area is located in Hebei and Shanxi provinces (110°14~119°50 E, 34°34~42°40 N), China, which is the original distribution area of larch. It is mainly distributed in the Bashang area and the upper part of the mountains above an altitude of 1400 m. The study area undergoes hot, rainy summers and cold, dry winters due to the temperate monsoon climate. The annual average temperature in Hebei province is 1.6–14.1 °C, which is low in the mountain area and high in the plain. The rainfall ranges from 341 to 745 mm. The annual average temperature in Shanxi province is 314 °C, and the temperature difference between day and night is large. The annual precipitation is 358–621 mm, and the summer (June-August) precipitation is relatively concentrated, accounting for about 60% of the annual precipitation. The main soil types include brown soil, tidal soil, brown soil, and chestnut calcium soil. The forest types mainly include broad-leaved and coniferous forests, and the main tree species are larch, Pinus tabulaeformis Carr., Populus davidiana Dode, Betula platyphylla Suk.), and Quercus dentata Thunb, and so on.

2.2. Data Collection

The data of larch sample plots used in this study were obtained from the ninth national forest inventory data (2016–2020) in Hebei and Shanxi provinces. The forest inventory data recorded information on dominant species, geographical location, stand age, and average tree height of the sample plots. In order to avoid bias in the simulation results due to age inconsistency, this study selected sample plots of larch with an age of 30 due to growth stabilization. We used ArcGIS 10.2 to generate a distribution point map of the sample plots (Figure 1). Because long-time series NPP cannot be measured directly at regional scales, the NPP dataset used in this study was derived from the Global Change Science Research Data Publishing System (http://www.geodoi.ac.cn (accessed on 18 March 2022)). Based on month-by-month meteorological data, soil texture data, land cover, and vegetation index data during 1985–2015, Chen [27] obtained a month-by-month NPP raster dataset of Chinese terrestrial ecosystems using CASA model. The resolution of NPP data was 1 km. We used ArcGIS 10.2 software to calculate the 31-year cumulative mean NPP and geographically aligned and masked it with the basic geographic data as the current actual NPP of the study area. The actual NPP was extracted using the distribution data of larch sample sites.

2.3. Environmental Factor

Current and future climate data are from the Global Climate Database (WorldClim, http://www.Worldclim.org (accessed on 19 April 2022)). The current climate data were averaged using cumulative annual data for the period 1970–2000 and contain 19 bioclimatic data related to temperature and precipitation [39]. Future climate data were based on the Shared Socioeconomic Pathways (SSPs) developed by the Intergovernmental Panel on Climate Change’s Sixth Assessment Report (IPCC AR6), which contain four core scenarios: SSP1-2.6, SSP2-4.5, SSP3-7.0, and SSP5-8.5 [40,41]. In this study, the widely used Beijing Climate Center Climate System Model version 2 (BCC-CSM2-MR) global circulation model was selected to simulate the current, 2050s (average for 2041–2060) and 2090s (average for 2081–2100) potential NPP for larch under four climate scenarios (SSP1-2.6, SSP2-4.5, SSP3-7.0, and SSP5-8.5). Topographic factors were obtained from the Global Climate Database (WorldClim, http://www.Worldclim.org (accessed on 19 April 2022)) for 30 s resolution DEM images, and ArcGIS10.2 was used to generate elevation, slope, and aspect. Soil data were obtained from the National Earth System Science Data Center shared platform (http://www.geodata.cn (accessed on 17 April 2022)), and 12 soil data of total nitrogen, total phosphorus, total potassium, alkaline nitrogen, fast-acting phosphorus, fast-acting potassium, capacitance, clay grain, powder grain, sand grain, rock chip, and organic matter were selected. These soil data were resampled as raster data with a resolution of 30 s using ArcGIS 10.2.
Pearson correlation analysis and variance inflation factor (VIF) analysis were used to solve the collinearity of environmental factors [42,43,44]. Environmental factors with |r| < 0.8 and VIF < 10 were selected. Finally, 18 environmental factors were finally retained (Table 1).

2.4. Potential NPP Simulation and Model Validation

In this study, the RF model [45] was used to predict the potential NPP in the study area. The model was built using the “RandomForest” package in the R program [46]. Bootstrap resampling method was used to model a decision tree, and the predictive result was the average of all decision trees. The number of nodes (mtry) and the number of decision trees (ntree) were two important parameters for RF. We optimized the two parameters to ensure the accuracy and stability of the modeling results. The mtry value (one-third of the total number of predictor variables) [47] and the ntree value (1000) [48] were used in this study.
In this study, the cumulative annual average of the multi-year simulation results of the region by Chen [27] was used as the current actual NPP in the study area. At the same time, in this study, 80% of the actual NPP data were set as training data, and the remaining 20% were used as testing data. The model coefficient of determination (R2), root mean square error (RMSE), and mean absolute error (MAE) were calculated to assess the simulation accuracy [49]. The calculation equations were as follows.
R 2 = i = 1 n ( p i a i ¯ ) 2 i = 1 n ( a i a i ¯ ) 2  
  R M S E = i = 1 n ( a i p i ) 2 n  
M A E = i = 1 n ( | a i p i | ) n
where ai is the measured NPP value of the i sample plot; pi is the predicted NPP value of the i sample plot.

2.5. Growth Suitability Evaluation

Potential NPP simulation results for current and future different climate scenarios were used for growth suitability classification. The natural interval method in ArcGIS 10.2 was used to classify the distribution area of larch into unsuitable, lowly suitable, moderately suitable, and highly suitable areas based on potential NPP. The main climatic factors driving the spatiotemporal change of vegetation NPP were temperature and precipitation. Therefore, the correlation between climatic factors (temperature and precipitation) and potential NPP was analyzed based on pixel scale. The correlation coefficients were calculated as follows.
R x y = i = 1 n [ ( x i x ¯ ) ( y i y ¯ ) ] i = 1 n ( x i x ¯ ) 2 · i = 1 n ( y i y ¯ ) 2  
where Rxy denotes the correlation coefficient of variables x and y; xi denotes the value of NPP/gC·m−2·a−1 in year i; yi denotes the value of climate factors (precipitation/mm and temperature/°C) of the year i; x ¯ , and y denote the average values of NPP and climate factors for n years, respectively.

3. Results

3.1. Model Accuracy

In this study, the predictive accuracy for RF was analyzed based on the training set (80%) and test set (20%) data. The goodness-of-fit statistics of the training set (R2 = 0.98, MAE = 6.69 gC·m−2·a−1, RMSE = 13.84 gC·m−2·a−1) and test set (R2 = 0.80, MAE = 15.61 gC·m−2·a−1, RMSE = 29.68 gC·m−2·a−1) indicated that the predictive performance of RF was acceptable (Figure 2). The simulation results could truly reflect the actual situation of potential NPP for larch tree species.

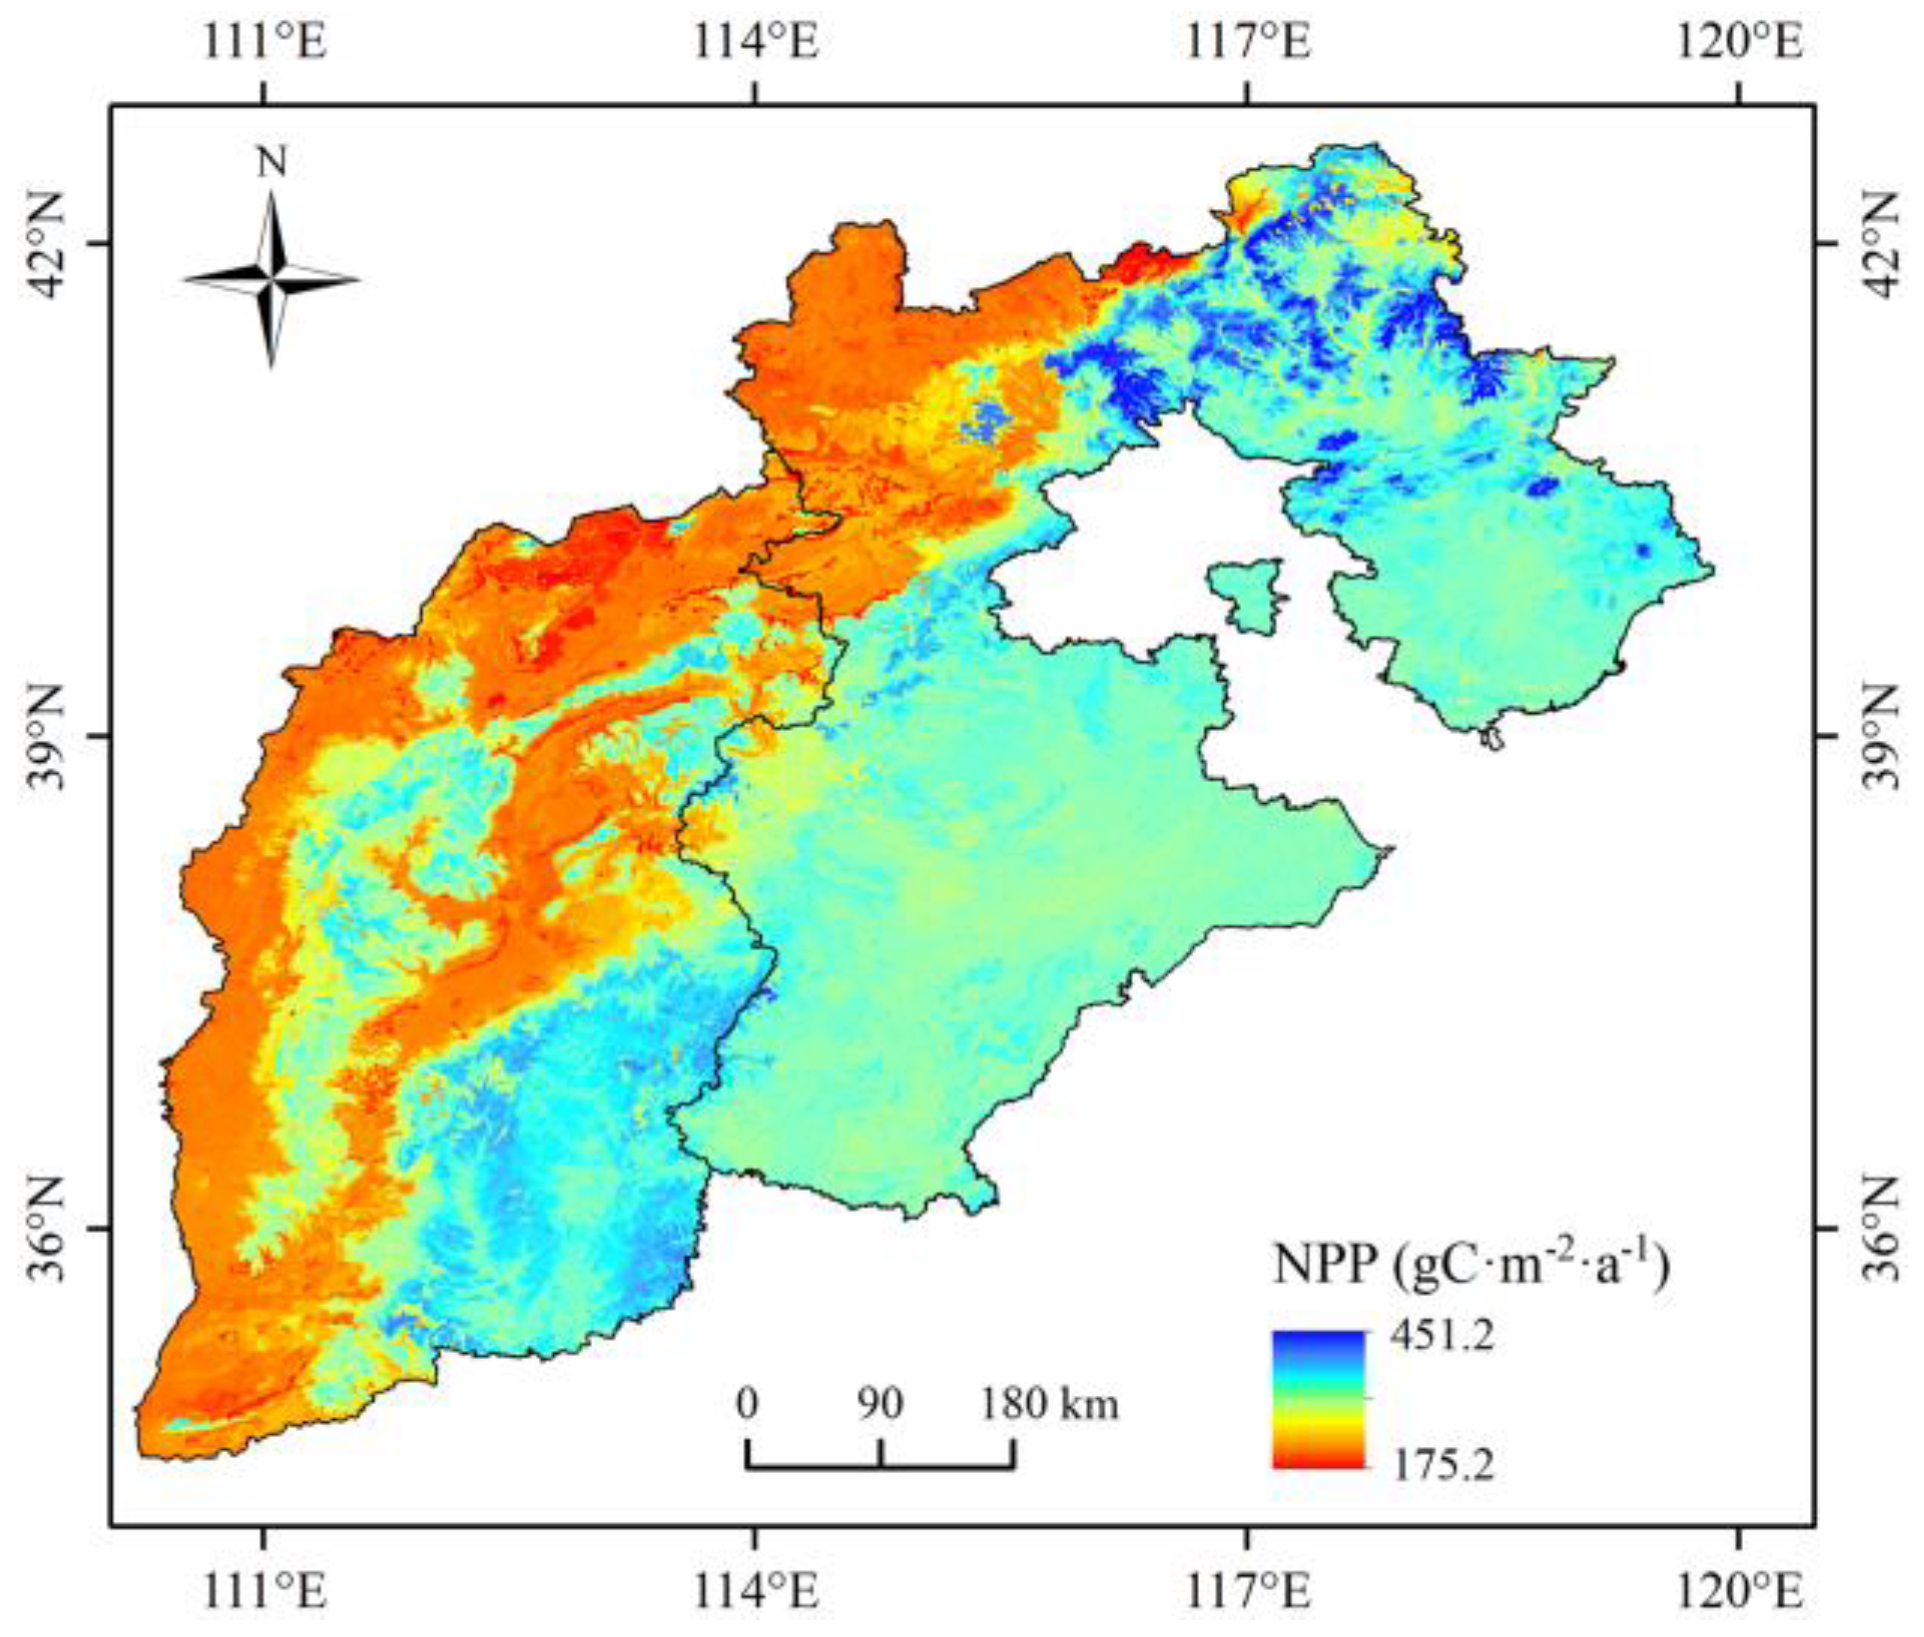
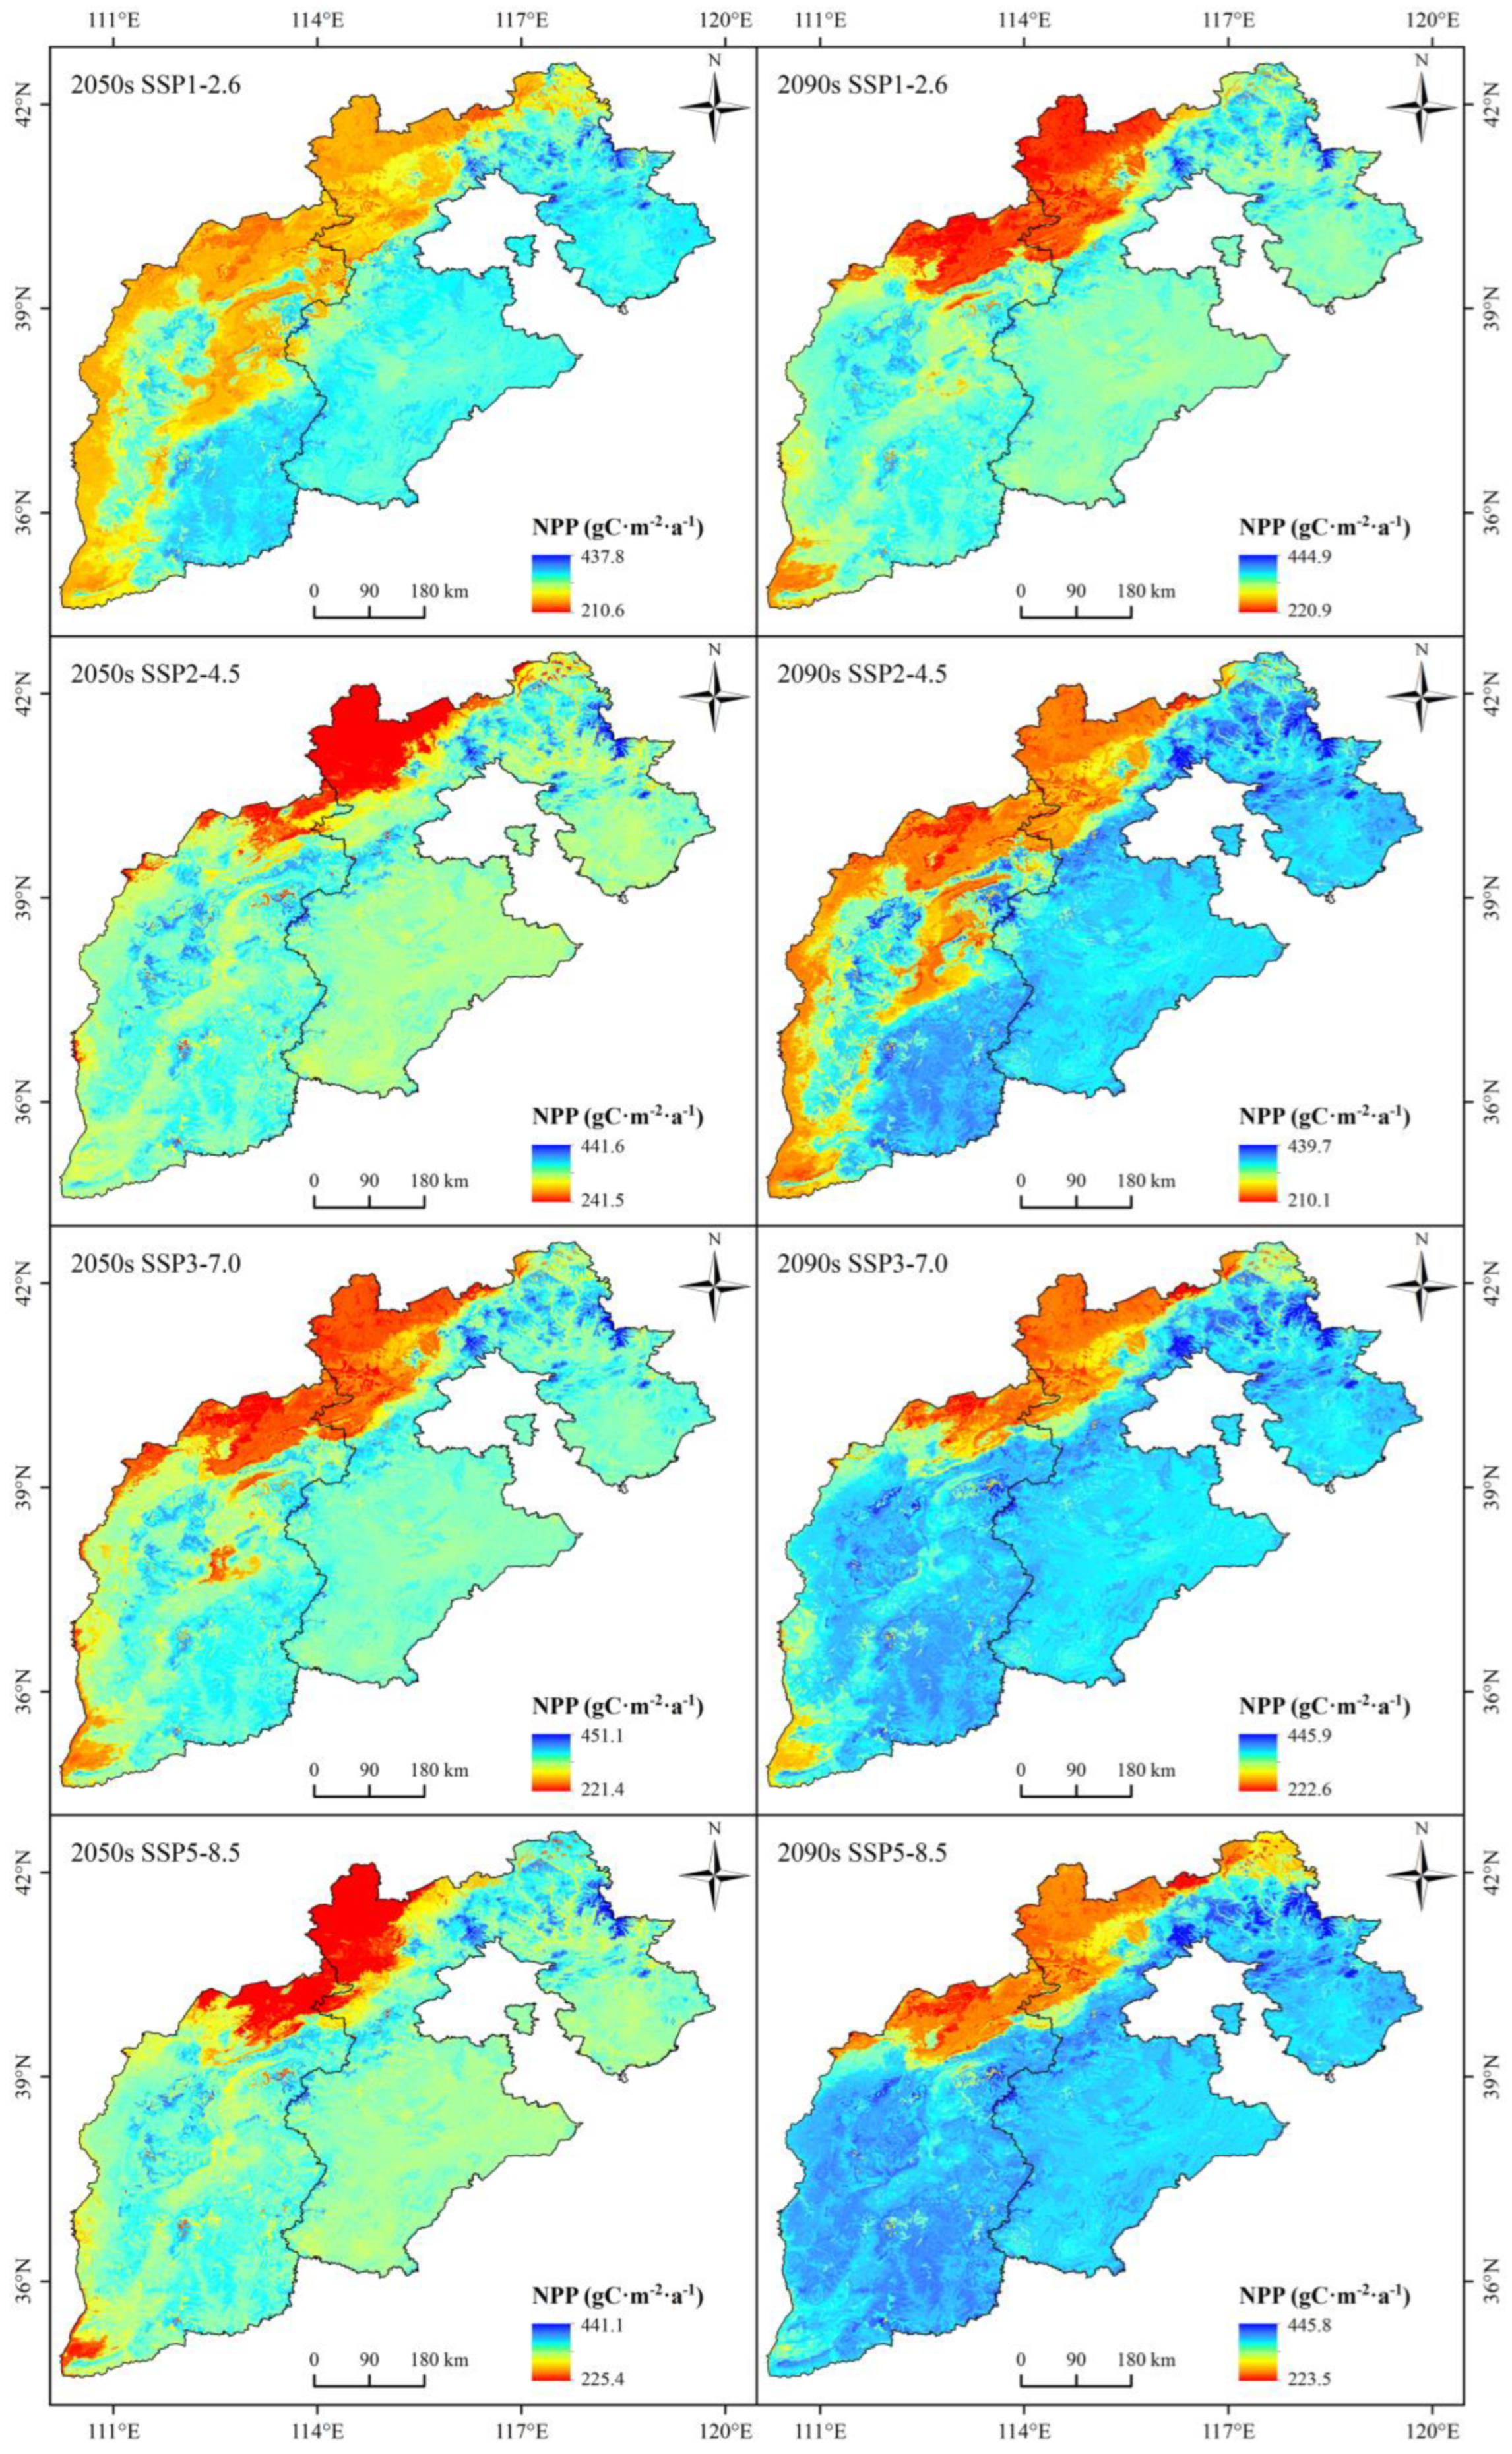
3.2. Potential NPP Distribution Pattern

Under current climate conditions, the potential NPP of larch in the study area ranged from 175.2 to 513.9 gC·m−2·a−1 with a mean value of 324.9 gC·m−2·a−1 (Table 2). The areas with high potential NPP of larch were mainly concentrated in the Bashang region and the high-elevation areas of Yanshan and Wuling Mountains, while scattered distribution in the central Taihang Mountains. The potential NPP was lower in the western and northwestern mountain ranges of the study area (Figure 3).
The potential NPP distribution of larch showed inconsistent patterns of variation under different future climate scenarios (Figure 4, Table 2). The potential NPP under the SSP1-2.6 and SSP3-7.0 climate scenarios was lower in the 2050s than in the 2090s. However, the potential NPP under the SSP2-4.5 and SSP5-8.5 climate scenarios was higher in the 2050s than in the 2090s.

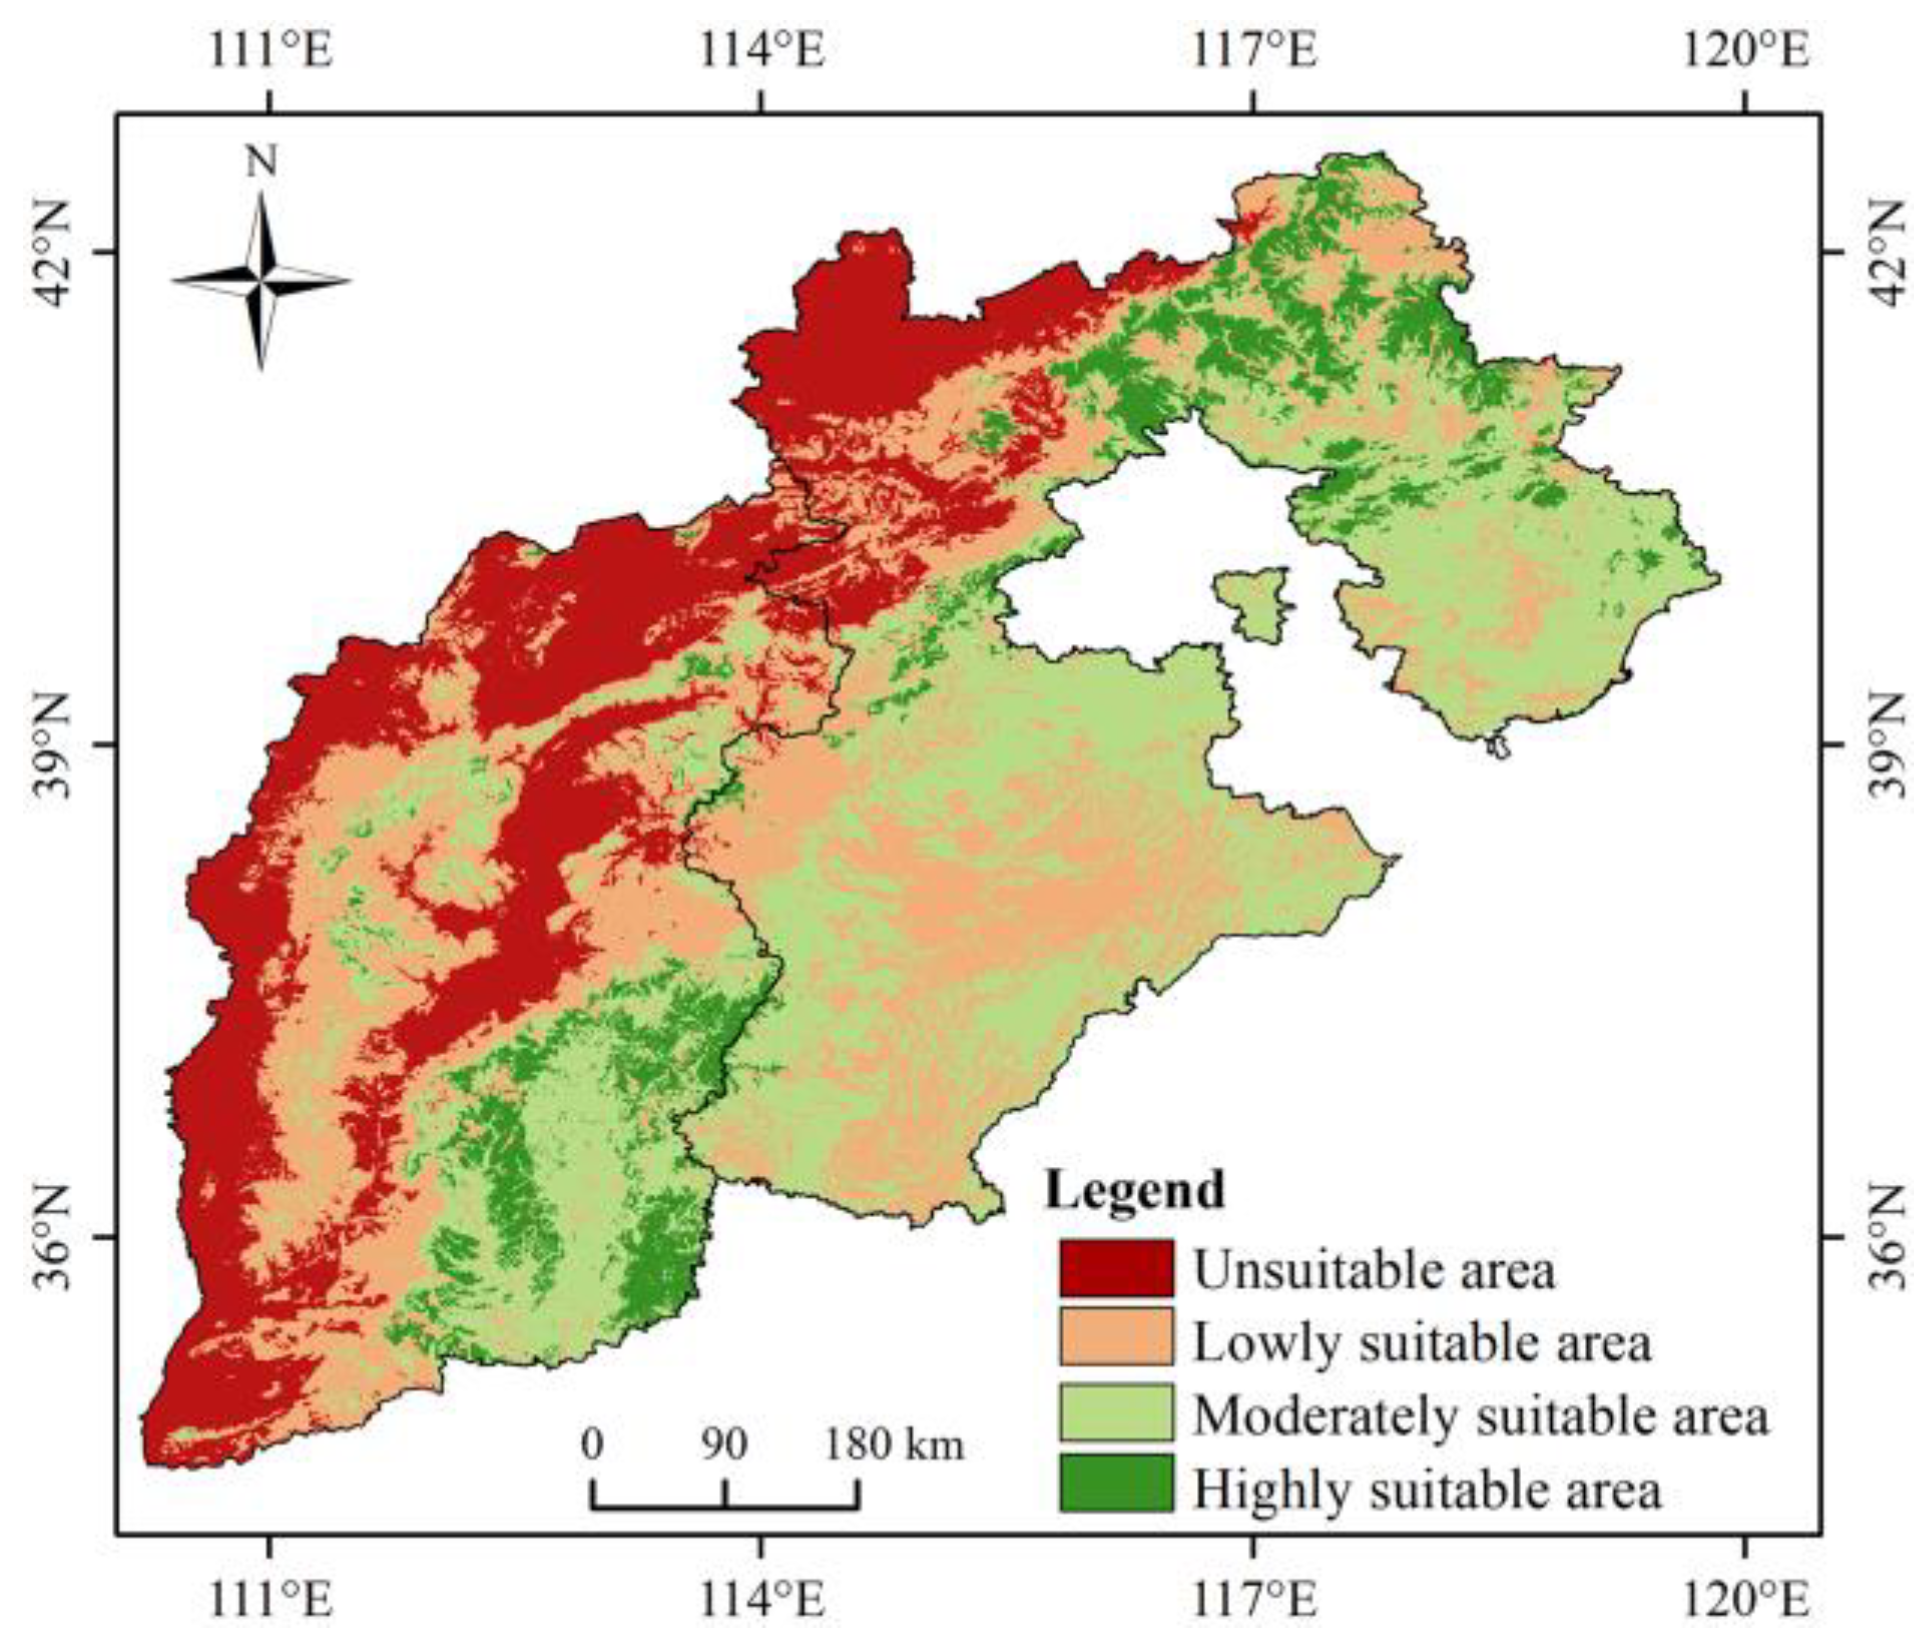
3.3. Growth Suitability Pattern

According to the results of the potential NPP classification of larch under current climatic conditions (Figure 5, Table 2), 55.3% of the study areas, including low elevation mountain range in the west, a high-elevation mountain range in the northwest and the plain area in the southeast, had low growth suitability. The area of the moderately suitable zone accounted for the largest proportion (38.4%) of the total suitable zone, and was mainly distributed in the eastern region and central plain of the study area. The area of the highly suitable area accounted for the small proportion (6.3%), and was mainly concentrated in the Bashang area and the high elevation mountains and scattered distribution in the central part of Taihang Mountain and the south part of Taiyue Mountain.
The suitable pattern of larch under future climate scenarios changed significantly (Figure 6). Under the SSP1-2.6 climate scenario, the projected unsuitable, lowly, moderately and highly suitable areas accounted for 27.8%, 10.5%, 34.3%, and 27.4% in 2050s, respectively. The areas of the highly suitable area further decreased by 2090, while the moderately suitable area expanded. Under the SSP2-4.5 and SSP5-8.5 climate scenarios, the area of moderately and highly suitable areas exhibited a significant expansion in the middle of the century (2050s), while shrinking in the end of the century (2090s). Under the SSP3-7.0 climate scenario, the total area of moderately and highly suitable areas showed a rising trend and was expected to reach 77.2% of the total area by the end of this century (2090s).

3.4. Relationship between Temperature and Precipitation and Potential NPP

In most of the study area, the potential NPP was positively correlated with temperature under the SSP1-2.6, SSP2-4.5, SSP3-7.0 and SSP5-8.5 climate scenarios. However, the potential NPP was negatively influenced by temperature in the northeastern part of the study area, especially in the Bashang and high elevation mountains (Figure 7).
Under the SSP1-2.6 and SSP2-4.5 climate scenarios, the area of potential NPP affected by precipitation was small, and the areas with low correlation accounted for 85.38% and 78.68% of the total area, respectively (Figure 8). Under the SSP3-7.0 and SSP5-8.5 climate scenarios, the potential NPP was strongly correlated with precipitation, and more than 60% of the areas were positively correlated with precipitation, mainly concentrated in the plain area and the low-elevation mountains in the northwest of the study area, while the areas with strong negative correlation with precipitation were mainly distributed in the high-elevation areas (Figure 8).

4. Discussion

According to the RF simulation results, the mean value of potential NPP of larch under current climate conditions was 324.9 gC·m−2·a−1 in the study area. Lv et al. [37] used the CASA model to simulate the potential NPP of larch with an average of 342.7 gC·m−2·a−1 in Hebei province. Based on MODIS remote sensing data and the CASA model, Yuan et al. [50] estimated the larch’s NPP with an average of 337.5 gC·m−2·a−1 in northern Hebei. The results of this study were similar to the above studies, but the mean NPP values were smaller than those of the above two studies. This might be due to differences in the study scale, selected methodology, and stand ages. Xie et al. [51] found that NPP gradually decreased with increasing stand ages. This study only focused on the stand age (30 years) when the growth of the larch tended to be stable.
The potential NPP of larch under different future climate scenarios exhibited different degrees of fluctuation but generally showed an increasing trend in the study area. Gang et al. [52] found that temperate forests showed an increasing trend in NPP under different climate scenarios. Under the SSP2-4.5 climate scenario, the changing trend of larch productivity was consistent with the results of Lv et al. [37]. The potential NPP increased significantly in the middle of this century and decreased by the end of this century. The possible reason might be that the high temperature inhibited larch productivity.
At present, species distribution models (SDMs) are often used to study the growth suitability of tree species. However, the SDMs are more concerned with the influence of environmental factors on species distribution and do not involve the growth of trees themselves. In this study, the potential NPP of larch was used to classify the growth suitability, which could accurately reflect the potential areas of suitable growth. The results showed that the current highly suitable area of larch was mainly located in the Bashang area and high-elevation mountain range, while the lowly suitable areas were mainly located in the plains at low elevation, which was consistent with the actual distribution areas [53,54]. Under future climate scenarios, the high-growth areas expanded significantly, and the low-growth areas shrank significantly, indicating that larch was sensitive to climate change, consistent with the response of alpine ecosystems to climate change [55].
Temperature and precipitation and their spatial patterns were the main factors influencing the potential NPP changes in vegetation [56]. This study examined the relationship between climatic factors (temperature and precipitation) and the potential NPP of larch under different climate scenarios. The results showed that there was a positive relationship between temperature and potential NPP in over 80% of the areas. The effects of temperature on NPP are mainly reflected in the following two aspects: enhancing photosynthesis by controlling the rate of plant metabolism [57], lengthening the growing season in forest ecosystems, facilitating nutrient accumulation, and thus increasing the growth rate [58,59]. However, when the temperature exceeds the optimum temperature for tree growth, it may cause rapid evaporation of soil moisture [38] and higher respiration of vegetation [60], leading to a decline in productivity. The correlation analysis showed that precipitation under SSP1-2.6 and SSP2-4.5 climate scenarios had less influence on NPP. Xie et al. [61] showed that in areas with sufficient moisture, the increase or decrease in precipitation had little effect on the growth of larch. The average annual precipitation in most areas of the study region was more than 400 mm, which basically satisfied the physiological needs of larch. Under the SSP3-7.0 and SSP5-8.5 climate scenarios, the correlation coefficient between precipitation and NPP was greater than 0.8 in more than 60% of areas. It is possible that future excessive warming will cause soil water stress and reduce the available water for trees, thereby inhibiting forest productivity.
The RF was used to predict the potential NPP of larch in the study area, and the potential NPP was used to divide the distribution areas into different types of growth suitability, which could provide a scientific basis for the foresters to make appropriate afforestation and management decisions. In this study, we only considered the response of temperature, precipitation, topography, and soil factors to the potential NPP and did not consider the anthropogenic factors, which made the results somewhat biased. These deficiencies should be avoided in future studies so as to make the prediction results more accurate and reliable.

5. Conclusions

With global climate change, assessment of the productivity of forest ecosystems and their suitability for growth has become particularly important. In this study, we used an RF model to predict the potential NPP dynamics of larch under different current and projected climate scenarios in the study area. According to the model evaluation indexes, the results could accurately reflect the potential NPP of larch. In the future, a high temperature and high humidity environment will have a positive promotion effect on the potential NPP of larch, and the promotion effect will be more obvious with the increase of CO2 emission. By the end of this century, the distribution range of highly and moderately suitable areas of larch showed different degrees of expansion under different climatic conditions. It also showed that under the SSP1-2.6 and SSP2-4.5 climate scenarios, the temperature had a significant effect on NPP, and there was a positive correlation between potential NPP and temperature in most parts of the study area. With increasing CO2 emissions in the future, our results advise increasing afforestation areas and developing large-diameter timber cultivation using larch trees in regions with high temperatures and high humidity in northern China. The results of this study may provide a scientific basis for creating higher ecological and economic values in larch forests under global climate change.

Author Contributions

Conceptualization, R.C., J.Z. and Z.Z.; methodology, software, visualization, R.C. and X.W.; investigation, data curation, Z.Z. and J.Z.; writing—original draft preparation, R.C and J.Z.; writing—review and editing, Z.Z. All authors have read and agreed to the published version of the manuscript.

Funding

This research was funded by the National Natural Science Foundation of China, grant number 32071759, the Natural Science Foundation of Hebei Province, China, grant number C2020204026, and the Hebei Province Key R & D Program of China, grant number 22326803D.

Institutional Review Board Statement

Not applicable.

Informed Consent Statement

Not applicable.

Data Availability Statement

The data presented in this study are available on request from the corresponding author.

Acknowledgments

We thank our graduate students and much of the local staff who have conducted the field investigation in the study area. Special thanks to the Global Change Science Research Data Publishing System, the National Earth System Science Data Center shared platform, and WorldClim for their available data in making this simulation possible.

Conflicts of Interest

The authors declare no conflict of interest.

References

  1. Jin, J.; Xiang, W.; Zeng, Y.; Ouyang, S.; Zhou, X.; Hu, Y.; Zhao, Z.; Chen, L.; Lei, P.; Deng, X. Stand carbon storage and net primary production in China’s subtropical secondary forests are predicted to increase by 2060. Carbon Balance Manag. 2022, 17, 6. [Google Scholar] [CrossRef] [PubMed]
  2. Li, T.; Li, M.; Ren, F.; Tian, L. Estimation and spatio-temporal change analysis of NPP in subtropical forests: A case study of Shaoguan, Guangdong, China. Remote Sens. 2022, 14, 2541. [Google Scholar] [CrossRef]
  3. Paquette, A.; Vayreda, J.; Coll, L.; Messier, C.; Retana, J. Climate change could negate positive tree diversity effects on forest productivity: A study across five climate types in Spain and Canada. Ecosystems 2018, 21, 960–970. [Google Scholar] [CrossRef] [Green Version]
  4. Liu, X.; Tian, Y.; Liu, S.; Jiang, L.; Mao, J.; Jia, X.; Zha, T.; Zhang, K.; Wu, Y.; Zhou, J. Time-lag effect of climate conditions on vegetation productivity in a temperate forest–grassland ecotone. Forests 2022, 13, 1024. [Google Scholar] [CrossRef]
  5. Field, C.B.; Barros, V.R.; Dokken, D.J.; Mach, K.J.; Mastrandrea, M.D.; Bilir, T.E.; Chatterjee, M.; Ebi, K.L.; Estrada, Y.O.; Genova, R.C.; et al. Summary for policymakers. In Climate Change 2014: Impacts, Adaptation, and Vulnerability; Assessment Report; The Intergovernmental Panel on Climate Change; Cambridge University Press: Cambridge, UK; New York, NY, USA, 2014; Available online: https://www.ipcc.ch/site/assets/uploads/2018/02/ar5_wgII_spm_en.pdf (accessed on 1 July 2022).
  6. Sun, G.; Mu, M. Assessing the characteristics of net primary production due to future climate change and CO2 under RCP4. 5 in China. Ecol. Complex. 2018, 34, 58–68. [Google Scholar] [CrossRef]
  7. Walker, A.P.; Zaehle, S.; Medlyn, B.E.; De Kauwe, M.G.; Asao, S.; Hickler, T.; Parton, W.; Ricciuto, D.M.; Wang, Y.P.; Wårlind, D. Predicting long-term carbon sequestration in response to CO2 enrichment: How and why do current ecosystem models differ? Glob. Biogeochem. Cycles 2015, 29, 476–495. [Google Scholar] [CrossRef]
  8. Manioudis, M.; Meramveliotakis, G. Broad strokes towards a grand theory in the analysis of sustainable development: A return to the classical political economy. New Political Econ. 2022, 27, 1–13. [Google Scholar] [CrossRef]
  9. Tomislav, K. The concept of sustainable development: From its beginning to the contemporary issues. Zagreb Int. Rev. Econ. Bus. 2018, 21, 67–94. [Google Scholar] [CrossRef] [Green Version]
  10. Li, P.; Peng, C.; Wang, M.; Li, W.; Zhao, P.; Wang, K.; Yang, Y.; Zhu, Q. Quantification of the response of global terrestrial net primary production to multifactor global change. Ecol. Indic. 2017, 76, 245–255. [Google Scholar] [CrossRef]
  11. Liu, Y.; Zhou, R.; Ren, H.; Zhang, W.; Zhang, Z.; Zhang, Z.; Wen, Z. Evaluating the dynamics of grassland net primary productivity in response to climate change in China. Glob. Ecol. Conserv. 2021, 28, e01574. [Google Scholar] [CrossRef]
  12. Sallaba, F.; Lehsten, D.; Seaquist, J.; Sykes, M.T. A rapid NPP meta-model for current and future climate and CO2 scenarios in Europe. Ecol. Model. 2015, 302, 29–41. [Google Scholar] [CrossRef]
  13. Wang, B.; Yang, S.; Lv, C.; Zhang, J.; Wang, Y. Comparison of net primary productivity in karst and non-karst areas: A case study in Guizhou Province, China. Environ. Earth Sci. 2010, 59, 1337–1347. [Google Scholar] [CrossRef]
  14. Lu, L.; Li, X.; Veroustraete, F.; Kang, E.; Wang, J. Analysing the forcing mechanisms for net primary productivity changes in the Heihe River Basin, north-west China. Int. J. Remote Sens. 2009, 30, 793–816. [Google Scholar] [CrossRef]
  15. Ding, Y.; Liang, S.; Peng, S. Climate change affects forest productivity in a typical climate transition region of China. Sustainability 2019, 11, 2856. [Google Scholar] [CrossRef] [Green Version]
  16. Chen, X.; Chen, J.; An, S.; Ju, W. Effects of topography on simulated net primary productivity at landscape scale. J. Environ. Manag. 2007, 85, 585–596. [Google Scholar] [CrossRef]
  17. Huang, X.; Huang, C.; Teng, M.; Zhou, Z.; Wang, P. Net primary productivity of Pinus massoniana dependence on climate, soil and forest characteristics. Forests 2020, 11, 404. [Google Scholar] [CrossRef] [Green Version]
  18. Reyer, C.; Lasch-Born, P.; Suckow, F.; Gutsch, M.; Murawski, A.; Pilz, T. Projections of regional changes in forest net primary productivity for different tree species in Europe driven by climate change and carbon dioxide. Ann. For. Sci. 2014, 71, 211–225. [Google Scholar] [CrossRef] [Green Version]
  19. Gonzalez-Benecke, C.A.; Teskey, R.O.; Dinon-Aldridge, H.; Martin, T.A. Pinus taeda forest growth predictions in the 21st century vary with site mean annual temperature and site quality. Glob. Change Biol. 2017, 23, 4689–4705. [Google Scholar] [CrossRef]
  20. Ji, Y.; Zhou, G.; Luo, T.; Dan, Y.; Zhou, L.; Lv, X. Variation of net primary productivity and its drivers in China’s forests during 2000–2018. For. Ecosyst. 2020, 7, 15. [Google Scholar] [CrossRef] [Green Version]
  21. Zhang, H.; Sun, R.; Peng, D.; Yang, X.; Wang, Y.; Hu, Y.; Zheng, S.; Zhang, J.; Bai, J.; Li, Q. Spatiotemporal dynamics of net primary productivity in China’s urban lands during 1982–2015. Remote Sens. 2021, 13, 400. [Google Scholar] [CrossRef]
  22. Guo, Y.; Peng, C.; Trancoso, R.; Zhu, Q.; Zhou, X. Stand carbon density drivers and changes under future climate scenarios across global forests. For. Ecol. Manag. 2019, 449, 117463. [Google Scholar] [CrossRef]
  23. Huang, Q.; Ju, W.; Zhang, F.; Zhang, Q. Roles of climate change and increasing CO2 in driving changes of net primary productivity in China simulated using a dynamic global vegetation model. Sustainability 2019, 11, 4176. [Google Scholar] [CrossRef] [Green Version]
  24. Wei, Y.; Wang, L. Simulating alpine vegetation net primary productivity by remote sensing in Qinghai Province, China. J. Mt. Sci. 2014, 11, 967–978. [Google Scholar] [CrossRef]
  25. Hadian, F.; Jafari, R.; Bashari, H.; Tartesh, M.; Clarke, K.D. Estimation of spatial and temporal changes in net primary production based on Carnegie Ames Stanford Approach (CASA) model in semi-arid rangelands of Semirom County, Iran. J. Arid Land 2019, 11, 477–494. [Google Scholar] [CrossRef] [Green Version]
  26. Cramer, W.; Kicklighter, D.W.; Bondeau, A.; Moore Iii, B.; Churkina, G.; Nemry, B.; Ruimy, A.; Schloss, A.L.; Model Intercomparison, T. Comparing global models of terrestrial net primary productivity (NPP): Overview and key results. Glob. Change Biol. 1999, 5, 1–15. [Google Scholar] [CrossRef]
  27. Chen, P. Monthly NPP dataset covering China’s terrestrial ecosystems at North of 18°N (1985–2015). J. Glob. Change Data Discov. 2019, 3, 34–41. [Google Scholar] [CrossRef]
  28. Wang, Q.; Zeng, J.; Leng, S.; Fan, B.; Tang, J.; Jiang, C.; Huang, Y.; Zhang, Q.; Qu, Y.; Wang, W.; et al. The effects of air temperature and precipitation on the net primary productivity in China during the early 21st century. Front. Earth Sci. 2018, 12, 818–833. [Google Scholar] [CrossRef]
  29. Sperlich, D.; Nadal-Sala, D.; Gracia, C.; Kreuzwieser, J.; Hanewinkel, M.; Yousefpour, R. Gains or losses in forest productivity under climate change? The uncertainty of CO2 fertilization and climate effects. Climate 2020, 8, 141. [Google Scholar] [CrossRef]
  30. Hu, X.; He, Y.; Kong, Z.; Zhang, J.; Yuan, M.; Yu, L.; Peng, C.; Zhu, Q. Evaluation of future impacts of climate change, CO2, and land use cover change on global net primary productivity using a processed model. Land 2021, 10, 365. [Google Scholar] [CrossRef]
  31. Song, L.; Li, M.; Xu, H.; Guo, Y.; Wang, Z.; Li, Y.; Wu, X.; Feng, L.; Chen, J.; Lu, X.; et al. Spatiotemporal variation and driving factors of vegetation net primary productivity in a typical karst area in China from 2000 to 2010. Ecol. Indic. 2021, 132, 108280. [Google Scholar] [CrossRef]
  32. Yu, B.; Chen, F.; Chen, H. NPP estimation using random forest and impact feature variable importance analysis. J. Spat. Sci. 2017, 64, 173–192. [Google Scholar] [CrossRef]
  33. Ong, A.K.S.; Prasetyo, Y.T.; Velasco, K.E.C.; Abad, E.D.R.; Buencille, A.L.B.; Estorninos, E.M.; Cahigas, M.M.L.; Chuenyindee, T.; Persada, S.F.; Nadlifatin, R.; et al. Utilization of random forest classifier and artificial neural network for predicting the acceptance of reopening decommissioned nuclear power plant. Ann. Nucl. Energy 2022, 175, 109188. [Google Scholar] [CrossRef]
  34. Duan, G.; Lei, X.; Zhang, X.; Liu, X. Site index modeling of Larch using a mixed-effects model across regional site types in Northern China. Forests 2022, 13, 815. [Google Scholar] [CrossRef]
  35. Sun, Y.; Wang, L. Global research progresses in dendroclimatology of Larix Miller. Prog. Geogr. 2013, 32, 1760–1770. [Google Scholar] [CrossRef]
  36. Cheng, R.; Wang, X.; Jing, Z.; Zhao, J.; Ge, Z.; Zhang, Z. Predicting the Potential Suitable Distribution of Larix principis-rupprechtii Mayr under Climate Change Scenarios. Forests 2022, 12, 1428. [Google Scholar] [CrossRef]
  37. Lv, Z.; Li, W.; Huang, X.; Zhang, Z. Larix principis-rupprechtii growth suitability based on potential NPP under climate change scenarios in Hebei Province. Sci. Silvae Sin. 2019, 55, 37–44. [Google Scholar] [CrossRef]
  38. Wu, C.; Chen, D.; Shen, J.; Sun, X.; Zhang, S. Estimating the distribution and productivity characters of Larix kaempferi in response to climate change. J. Environ. Manag. 2021, 280, 111633. [Google Scholar] [CrossRef]
  39. Fick, S.E.; Hijmans, R.J. WorldClim 2: New 1-km spatial resolution climate surfaces for global land areas. Int. J. Climatol. 2017, 37, 4302–4315. [Google Scholar] [CrossRef]
  40. Petrie, R.; Denvil, S.; Ames, S.; Levavasseur, G.; Fiore, S.; Allen, C.; Antonio, F.; Berger, K.; Bretonnière, P.A.; Cinquini, L.; et al. Coordinating an operational data distribution network for CMIP6 data. Geosci. Model Dev. 2021, 14, 629–644. [Google Scholar] [CrossRef]
  41. Waliser, D.; Gleckler, P.J.; Ferraro, R.; Taylor, K.E.; Ames, S.; Biard, J.; Bosilovich, M.G.; Brown, O.; Chepfer, H.; Cinquini, L.; et al. Observations for Model Intercomparison Project (Obs4MIPs): Status for CMIP6. Geosci. Model Dev. 2020, 13, 2945–2958. [Google Scholar] [CrossRef]
  42. Radosavljevic, A.; Anderson, R.P. Making better Maxent models of species distributions: Complexity, overfitting and evaluation. J. Biogeogr. 2014, 41, 629–643. [Google Scholar] [CrossRef]
  43. Jiang, X.; An, M.; Zheng, S.; Deng, M.; Su, Z. Geographical isolation and environmental heterogeneity contribute to the spatial genetic patterns of Quercus kerrii (Fagaceae). Heredity 2018, 120, 219–233. [Google Scholar] [CrossRef] [PubMed] [Green Version]
  44. Dang, A.T.N.; Kumar, L.; Reid, M.; Anh, L.N.T. Modelling the susceptibility of wetland plant species under climate change in the Mekong Delta, Vietnam. Ecol. Inform. 2021, 64, 101358. [Google Scholar] [CrossRef]
  45. Breiman, L. Random Forests. Mach. Learn. 2001, 45, 5–32. [Google Scholar] [CrossRef] [Green Version]
  46. Liaw, A.; Wiener, M. Classification and regression by randomForest. R News 2002, 2, 18–22. [Google Scholar]
  47. Ließ, M.; Glaser, B.; Huwe, B. Uncertainty in the spatial prediction of soil texture: Comparison of regression tree and Random Forest models. Geoderma 2012, 170, 70–79. [Google Scholar] [CrossRef]
  48. Yang, R.; Zhang, G.; Liu, F.; Lu, Y.; Yang, F.; Yang, F.; Yang, M.; Zhao, Y.; Li, D. Comparison of boosted regression tree and random forest models for mapping topsoil organic carbon concentration in an alpine ecosystem. Ecol. Indic. 2016, 60, 870–878. [Google Scholar] [CrossRef]
  49. Castaño-Santamaría, J.; López-Sánchez, C.A.; Ramón Obeso, J.; Barrio-Anta, M. Modelling and mapping beech forest distribution and site productivity under different climate change scenarios in the Cantabrian Range (North-western Spain). For. Ecol. Manag. 2019, 450, 117488. [Google Scholar] [CrossRef]
  50. Yuan, J.; Niu, Z.; Wang, C. Vegetation NPP distribution based on MODIS data and CASA model—A case study of northern Hebei Province. Chin. Geogr. Sci. 2006, 16, 334–341. [Google Scholar] [CrossRef]
  51. Xie, Y.; Wang, H.; Lei, X. Effects of climate change on net primary productivity in Larix olgensis plantations based on process modeling. Chin. J. Plant Ecol. 2017, 41, 826–839. [Google Scholar] [CrossRef] [Green Version]
  52. Gang, C.; Zhang, Y.; Wang, Z.; Chen, Y.; Yang, Y.; Li, J.; Cheng, J.; Qi, J.; Odeh, I. Modeling the dynamics of distribution, extent, and NPP of global terrestrial ecosystems in response to future climate change. Glob. Planet. Change 2017, 148, 153–165. [Google Scholar] [CrossRef]
  53. Fang, W.; Cai, Q.; Zhu, J.; Ji, C.; Yue, M.; Guo, W.; Zhang, F.; Gao, X.; Tang, Z.; Fang, J. Distribution, community structures and species diversity of larch forests in North China. Chin. J. Plant Ecol. 2019, 43, 742–752. [Google Scholar] [CrossRef]
  54. Lv, Z.; Li, W.; Huang, X.; Zhang, Z. Predicting suitable distribution area of three dominant tree species under climate change scenarios in Hebei Province. Sci. Silvae Sin. 2019, 55, 13–21. [Google Scholar] [CrossRef]
  55. Oddi, L.; Migliavacca, M.; Cremonese, E.; Filippa, G.; Vacchiano, G.; Siniscalco, C.; Morra di Cella, U.; Galvagno, M. Contrasting responses of forest growth and carbon sequestration to heat and drought in the Alps. Environ. Res. Lett. 2022, 17, 045015. [Google Scholar] [CrossRef]
  56. Sun, J.; Zhou, T.; Du, W.; Wei, Y. Precipitation mediates the temporal dynamics of net primary productivity and precipitation use efficiency in China’s northern and southern forests. Ann. For. Sci. 2019, 76, 92. [Google Scholar] [CrossRef]
  57. Rahman, M.S.; Akter, S.; Al-Amin, M. Forest and agro-ecosystem productivity in Bangladesh: A climate vegetation productivity approach. For. Sci. Technol. 2015, 11, 126–132. [Google Scholar] [CrossRef]
  58. D’Orangeville, L.; Houle, D.; Duchesne, L.; Phillips, R.P.; Bergeron, Y.; Kneeshaw, D. Beneficial effects of climate warming on boreal tree growth may be transitory. Nat. Commun. 2018, 9, 3213. [Google Scholar] [CrossRef] [Green Version]
  59. Fang, O.; Wang, Y.; Shao, X. The effect of climate on the net primary productivity (NPP) of Pinus koraiensis in the Changbai Mountains over the past 50 years. Trees 2015, 30, 281–294. [Google Scholar] [CrossRef]
  60. Lebourgeois, F.; Bréda, N.; Ulrich, E.; Granier, A. Climate-tree-growth relationships of European beech (Fagus sylvatica L.) in the French Permanent Plot Network (RENECOFOR). Trees 2005, 19, 385–401. [Google Scholar] [CrossRef]
  61. Xie, Y.; Lei, X.; Shi, J. Impacts of climate change on biological rotation of Larix olgensis plantations for timber production and carbon storage in northeast China using the 3-PGmix model. Ecol. Modell. 2020, 435, 109267. [Google Scholar] [CrossRef]
Figure 1. Distribution points of larch in Hebei and Shanxi provinces.
Sustainability 15 00331 g001
Figure 2. Comparison between observed and predicted NPP values of larch for training (left) and testing (right) data.
Sustainability 15 00331 g002
Figure 3. Spatial distribution pattern of potential NPP of larch tree species.
Sustainability 15 00331 g003
Figure 4. Spatial distribution pattern of potential NPP of larch under different climate scenarios in 2050s and 2090s.
Sustainability 15 00331 g004
Figure 5. Distribution pattern of current growth suitability of larch.
Sustainability 15 00331 g005
Figure 6. Distribution pattern of growth suitability of larch under climatic scenarios in 2050s and 2090s.
Sustainability 15 00331 g006
Figure 7. Spatial distribution of correlation coefficients between potential NPP and temperature.
Sustainability 15 00331 g007
Figure 8. Spatial distribution of the correlation coefficients between potential NPP and precipitation.
Sustainability 15 00331 g008
Table 1. Environmental factors used for building models.
Environment
Variables
CodeVariable NameUnit
TemperatureBIO4Temperature seasonality
(standard deviation × 100)
-
BIO5Max temperature of warmest month°C
BIO10Mean temperature of warmest quarter°C
PrecipitationBIO13Precipitation of wettest monthmm
BIO18Precipitation of warmest quartermm
TerrainELEVElevationm
SLPSlope based on a digital elevation model°
ASPAspect based on a digital elevation model%
SoilANSoil alkali-hydrolysis nitrogenmg·kg−1
APAvailable phosphorusmg·kg−1
TKSoil total kaliumg·kg−1
TNSoil total nitrogeng·kg−1
TPSoil total phosphorusg·kg−1
SOMSoil organic matter%
GRAVSoil rock fragment%
CLAYPercentage of clay in soil%
SANDPercentage of sand in soil%
BDSoil bulk densityg·cm−3
Table 2. Changes of potential NPP and growth suitability zones of larch in different periods.
ScenariosPeriodsRange
(gC·m−2·a−1)
Mean
(gC·m−2·a−1)
Unsuitable
(%)
Lowly
(%)
Moderately
(%)
Highly
(%)
-Current175.2–513.9324.932.323.038.46.3
SSP1-2.62050s210.6–437.8320.127.810.534.327.4
2090s220.9–444.9339.014.59.451.224.8
SSP2-4.52050s241.5–441.6347.07.912.354.925.0
2090s210.1–439.7327.223.49.843.423.3
SSP3-7.02050s211.4–451.1336.615.911.152.420.6
2090s222.6–445.9340.212.39.551.127.1
SSP5-8.52050s225.4–441.1345.58.28.454.029.4
2090s223.5–445.8339.413.55.747.333.5
Disclaimer/Publisher’s Note: The statements, opinions and data contained in all publications are solely those of the individual author(s) and contributor(s) and not of MDPI and/or the editor(s). MDPI and/or the editor(s) disclaim responsibility for any injury to people or property resulting from any ideas, methods, instructions or products referred to in the content.

