Abstract
The transition to the circular economy is a basic principle of the policy of the European Union, it is the chance for a cleaner world, an ideal world with “zero waste”. This document analyzes the implementation degree of circular economy in Romania through 10 monitoring indicators defined by European Commission in ”Measuring progress towards the circular economy in the European Union—Key indicators for a monitoring framework”, released in January 2018. In order to understand the paper, it was considered necessary to define the indicators with reference to the targets proposed by the European Union. The analysis of the stage of implementation of the circular economy in Romania was made by using the data published by Eurostat. Methodologically, a comparative study was carried out between the level of implementation of circular economy indicators in Romania and the EU and the position occupied by Romania among the member states was identified for each of these 10 circular economy monitoring criteria. Each indicator is analyzed and the causes and motivations that led to the obtaining of the mentioned values are identified. The results of the study show that Romania is in the upper part of the hierarchy for certain indicators, contributing to the achievement of EU targets. It also identifies the causes that delay performance in others, indicating future solutions, necessary to be adopted to remedy the situation. Implementing the circular economy requires long-term vision, political determination and consistency, and, last but not least, funding. In these directions, governmental measures must be taken to increase performance at the national level. In conclusion with an economy that is not sufficiently strong, and affected as it is by the current crises, Romania is moving forward on the path of transitioning to a circular economy.
1. Introduction
The transition to the Circular Economy (CE) involves the reconsideration of the linear economic model in which the economic chain involves: raw materials, manufacturing, marketing, use and waste generation, which are then destroyed. The old economic consumes a large amount of resources and generates a large amount of waste. The transformation of linear model into a circular one assumes reconsidering unsustainable aspects, considerable reduction of waste, reuse, repair, recycling of existing materials and products, etc.
Ideas specific to the circular economy have appeared since the 18th century. Hans Carl von Carlowitz (1645–1714) was the first who introduced the concept of sustainability, advocating for sustainable use of the forest. John Law (1671–1729) and Richard Cantillon (1680–1734) tried to describe the circular flow of income and expenditure. In 1798, Thomas Malthus, in the work entitled “An Essay on the Principle of Population”, pointed out that continued population growth would diminish the world’s ability to feed itself. John Stuart Mill (1806–1873) postulated that the economy is governed, in fact, by the laws of nature and not by human will. He believed that it was preferable for the economy to reach a stationary stage that would facilitate the transformation of capitalism into a more humane economic system [1].
The concept of circular economy, in the current understanding represents the contribution of several authors or even several schools. According to the Ellen MacArthur Foundation [2], the EC paradigm is based on the activity of seven schools: industrial ecology, biomimicry, natural capitalism, regenerative design, cradle-to-cradle, blue economy, performance economy.
Industrial Ecology(IE) aimed to understanding the materials circulation and energy flows. The role of IE is to facilitate the understanding of the industrial ecosystem functioning, its regulation and the interaction with the biosphere [3]. In this sense, IE proposes the transition to closed cycles of materials and energy, thus minimizing industrial losses. For the French Environment and Energy Management Agency [4], industrial ecology is also one of the several pillars needed to build a circular economy, among ecodesign or product-as-a-service.
In accord with S. Erkman are defines four key principles of the IE [5]:
- the systematic valorized of waste and by-products;
- the minimization of loss caused by dispersion;
- the dematerialized of economy;
- the reduction of energy in base of fossil hydrocarbon.
The Regenerative Design school of thought was founded by John T. Lyle, in 1996, with the publication of his work entitled “Regenerative Design for Sustainable Development”. This work is intended to be a practical guide to designing systems (not just in agriculture) such as those that supply energy and materials, that should be self-renewing or regenerative during their operation.
The ”father of performance economy” Walter R. Stahel and one important figure in the field of circular economy has proposed a “Functional Service Economy” through changing the way of organization, strategy and business model of companies [6]. A functional economy supposes the optimization of goods and services in order to consume material resources and energy so as possible. From here derives the sustainable aspect of the functional economy in relation to the traditional economy. A functional economy generates a performance economy. The performance economy is based on three important objectives [6]: higher growth, more jobs and lower resource consumption. This theory moves the economy towards sustainability and shifts economic thinking from “doing things right’” to “doing the right things”.
The “Cradle to Cradle” concept was mainly developed by Michael Braungart and Bill McDonough. This concept means design and production of goods in such manner that at the end of their life, they can be recycled. The main principles of this concept are:
- waste equals food (eliminate the concept of waste);
- use renewable energies;
- support (celebrate) diversity.
The term “Biomimicry” was introduced by Janine Benyus in 1997 in her book “Biomimicry: Innovation inspired by nature”. Biomimicry means to imitate life. In nature there is no waste, so materials and energy circulate in nature without creating pollution. Biomimicry is an approach that tries to implement sustainable innovation in design, business, engineering etc. by applying successful strategies found in nature.
The Biomimicry theory is focused on the following aspects [7]:
- nature as model (nature can provide models and solutions in order to solve human problems);
- nature as measure (nature can be viewed as a standard to judge the sustainability of our innovation);
- nature as mentor (nature can be viewed as a source of knowledge for our innovation).
In 2004, Gunter Pauli has introduced the “Blue Economy” concept based on the ZERI (Zero Emissions Research and Initiatives) philosophy. The concept of the Blue Economy means the use of seas and coasts for economic activities. The main principles of the Blue Economy are the innovative business model and competitiveness.
The development of the concept of Circular Economy has also involved different approaches to how this type of economy is defined. Thus, the specialized literature contains over 100 definitions regarding the circular economy, focused on key concepts such as: sustainable development, the 4Rs (Reduce, Reuse, Recycle, Recover), the systemic approach (micro, meso, macro), the waste hierarchy [8]. Starting from the common elements of these concepts, Kirchherr proposed a concise definition of the circular economy: “CE is an economic system that replaces the ‘end-of-life’ concept with reducing, alternatively reusing, recycling and recovering materials in production/distribution and consumption processes”.
The CE concept has been understood differently depending on the cultural, social and political systems where it has been implemented. For example, in Germany, the CE concept was introduced into environmental policy in the early 1990s in order to solve the problems associated with raw materials and the use of natural resources [9]. Germany is considered to be a pioneer in sustainable development, as it prioritized the efficient use of resources and implicitly increased energy efficiency [10]. In other European countries, such as the UK, Denmark, Switzerland and Portugal, the CE concept was initially associated with waste management [11].
Previously applied and understood differently, the CE benefited from a unitary approach at the level of the European Union states in July 2014, in Brussels, when the European Commission sent the document entitled “Towards a circular economy: A zero waste program for Europe” (No 398/2014) to the European Parliament, the European Council, the European Economic and Social Committee and the European Committee of the Regions [12]. One year later, in December 2015, the Circular Economy Package [13] was launched, a document that marks CE as a basic principle in the EU economic development. The following documents published in 2018 and 2020 (we will return to them in the following paragraphs) establish criteria for the monitoring of the progress towards a genuine circular economy and update the 2015 action plan through the document “A new Circular Economy Action Plan for a cleaner and more competitive Europe” [13] in order to accelerate the transition towards this new regenerative economic model.
Following the new Circular Economy Plan, the European Commission establishes specific regulations regarding sustainable batteries (December 2020), organic pollutants from waste and waste transport (2021).
The year 2022 is intense from the point of view of documents related to the circular economy: in March the Commission proposed a package of measures that complements the New Circular Economy Plan and imposed new rules on the design, manufacture and use of products, which must meet new energy efficiency standards and impact on the environment. In April, the adopted measures regarding pollutants produced by large industrial facilities were published.
The real transformation of the linear economy into a circular economy with intelligent and sustainable utilization of resources and with almost zero waste is an ongoing process, different from country to country that still requires legislative measures and careful monitoring.
The purpose of this paper is to analyze the progress made by Romania in the implementation of the circular economy. The indicators defined by the European Commission for monitoring the transition to the EC are analyzed. The work provides a complete picture of Romania’s transition to the circular economy, its position among the member states and the extent to which it contributes to reaching the targets proposed by the EU. The factors that led to these results and the necessary future measures to be adopted are identified.
The work is organized in the following chapters: 1. Introduction, in which a presentation of the formation of the circular economy concept is made; 2.Research Methodology where the four action areas of the EC and the indicators corresponding to each are defined, used in the following section as tools for the proposed analysis; 3.Results: The implementation of the circular economy in Romania, chapter that presents, based on the previously defined indicators, the progress made in recent years in Romania, and the causes that determined the respective values of the indicators are identified; 4.Discussion, section in which a comparative analysis is made between Romania and the EU-27, and Romania’s contribution to the fulfillment of the targets proposed by the European Commission is evaluated. This section also presents the conclusions obtained from the study regarding the measures that must be adopted to accelerate the transition to the circular economy of Romania.
2. Research Methodology
According to the decision of the European Union the transition to a circular economy is essential in order to ensure a sustainable development, a smart use of natural resources and to prevent dramatic changes of the climate on earth. To evaluate the progress to a circular economy of each country, ten main indicators with different sub-indicators grouped in four areas of economy were established by the European Commission and presented in the European Parliament on 16th January 2018. The documents ”Communication from the Commission on a monitoring framework for the circular economy, COM no. 29, 2018” and “Commission Staff Working Document: Measuring progress towards circular economy in the European Union—Key indicators” [14] explain the reasons for establishing the areas that must be monitored from the point of view of the circular economy and the choice of indicators that must track how raw materials enter the economy, produce goods and then leave the economy. The area and the corresponding indicators are presented in Figure 1.

Figure 1.
Circular Economy indicators.
There are many discussions concerning the validity of the 10 indicators, and the extent to which they manage to measure the correctness of the paths of different countries towards the circular economy, but at this time they are a reference system in the comparison of the progress made by European countries towards the circular economy.
These indicators will be analysed for Romania and the European Union, to identify the strengths and weaknesses in the application of the circular economy, the political deficiencies and the measures that have to be taken to improve the sustainable development of Romanian economy and society.
The areas monitored by the European Union through the ten main indicators follow the circuit of raw materials in economy, but at the same time give value to competitiveness and innovation, emphasizing the importance of the discovery of new technologies and scientific progress. We believe that a discussion of circular economy indicators is necessary.
2.1. Production and Consumption Area
It follows the circuit of raw materials in economy, the way they are used in industry and by domestic consumers, the amount recovered, the reuse of these raw materials, it monitors the ratio between the quantity/volume of raw materials used and the resulting waste. There are four main indicators (Figure 1) in this area. The first of them is EU self-sufficiency for raw materials.
EU is deficient in certain “critical raw materials”, which can only be obtained from imports or must also be purchased from imports [15]. The non-existence of these raw materials in the countries of the European Union or the small amount in which they exist in the EU make them all the more valuable. Extracting them from products at the end of their life cycle and re-introduction them into the economic circuit is a way to increase the degree of independence of the European Union, which is ever more important in the current global economic-political situation in which the flow of supply can be blocked at anytime.
Self-sufficiency of raw materials for production in the EU(SS) indicator (or EU self-sufficiency for raw materials, as it is called in the European Commission document from 2018) is expressed as a percentage [%] and measures the EU’s ability to ensure from its own resources (extractive or recovery) the raw materials from the category of critical ones, and implicitly to ensure its autonomy from this point of view.
The indicator is calculated for each type of raw material by using the following relations [14]:
Self-sufficiency can have values from 0 to 100% and does not evaluate the actual amount of raw materials available, but only their relation to the economic need. It should be noted that the situation of these critical raw materials is constantly changing, depending on economic trends, their list being updated every 3 years. There are worries about the fact that the number of critical raw materials has been continuously increasing from 14 positions in 2011, the year of the first assessment, to 30 critical raw materials in 2020, according to the European Commission’s “Study on the EU’s list of Critical Raw Materials (2020)” [15].
The progress of the massive transition to the use of renewable energies is deepening the crisis of raw materials in the EU. Solutions are needed to cover the possible crisis of these materials, through the creation and successful use of substitutes with similar performances and, thanks to the European Cooperation in Science and Technology, intensive studies are being carried out in this direction [16].
In general, this indicator, established by categories of raw materials, is analyzed together with the map of the countries possessing these resources and thus determines the directions of the European Union’s foreign and commercial policy. Foreign policy is always a mix between democratic principles and economic interests.
The next indicator in the field of Production and consumption is related to the position of national, regional and local authorities regarding green public procurement.
The Green public procurement (GPP) indicator was introduced as a way for the state to impose its environmental protection policy (an expected result of the application of the circular economy) in the public procurement system of subordinate bodies.
Public procurement represents about 14% of the EU’s gross domestic product [17] and its orientation towards environmentally friendly products generates an impact on the area of production and consumption [18]. If this important sector with important acquisitions and desired as a commercial partner by many industrial branches imposes certain quality conditions, including in terms of environmental impact, this may cause changes in the design of products and their manufacturing technologies [18,19].
Designing is the main stage in the creation of sustainable products and, as it is known, about 80% of the impact on the environment is generated in the design phase, the stage in which the product’s life span, its repair, reuse and recycling possibilities are established [20]. Related to this design stage, on 30 March 2022, the European Commission launched a set of initiatives that complement the Circular Economy Package, establishing new rules for the ecological and sustainable design of products [21].
The importance of designing does not refer only to the utility and components of some final products. The development of a production line must be conceived from the beginning so that each stage be done with a minimum consumption of energy and primary resources, and with complete knowledge of what happens to the secondary products and the resulting waste.
Green public procurement (GPP) as an indicator of the transition to the circular economy still poses problems of clarifying terms like “green products”, “ecological procurement”, “low environmental impact”, as they are differently understood and approached by authorities in different countries and regions. Also present in sustainable development strategies, the GPP principle is adopted on a voluntary basis and with very elastic limits in terms of environmental impact. The latest documents of the European Commission established green procurement criteria for 19 categories of products and services. The majority of European states have adopted in their national legislation provisions regarding green public procurement, as a step towards achieving the objectives of the 2030 Agenda. According to the documents issued by the European Commission in 2018 [14], the year 2021 was set as the starting point for the collection of this information.
Currently, this indicator is not reported by the member countries and there is no data that allows the analysis of the progress towards the circular economy of a member state, including Romania, based on this indicator. Also, data processing and reporting will most likely take 1–2 years.
The next indicator in the Production and consumption area refers to the generation of waste.
The Waste generation indicator refers to municipal waste and monitors its generation and, together with the indicators in the Waste management area, its recycling. Waste generation provides an overview of how national policies lead to the reduction of the amount of waste produced at municipal level and, implicitly, of the behavior model of the population. The financial efforts of municipalities vary between 20% of the local budget in the case of low-income countries and decrease to about 4% for developed, high-income countries [22].
At the EU level, the amount of waste resulting from all economic sectors is of 2.5 billion tons annually [23], which means approximately 5 tons per inhabitant and year. As can be seen from Figure 2, the amount of waste per capita remained approximately constant in the 2005–2020 period. The document also stipulates the need to decouple economic growth from the amount of produced waste, otherwise the 65% target proposed for the recycling and reuse of municipal waste by 2035 through the Waste Framework Directive 2018 [24,25] will not be reached.
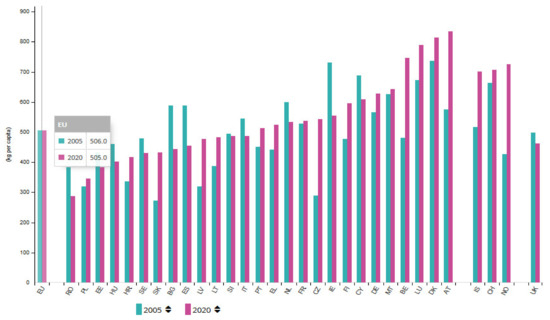
Figure 2.
Waste generation in UE: 2005 vs. 2020. Source: Eurostat [26].
The Waste generation indicator is divided into three sub-indicators that aim to describe several aspects of the relationship between consumption and waste.
- Generation of municipal waste per capita—expressed in Kg per capita—it indicates the quantity of waste collected from the territory of a municipality and managed through the waste management system. Waste produced by residents, commerce, offices, and public institutions is included here. This category does not include industrial waste and waste resulting from agricultural activity. Figure 2 exemplifies the per capita distribution of municipal waste in EU countries.
- Generation of waste excluding major mineral waste per GDP unit—it evaluates the quantity of waste collected in a country (expressed in mass unit), per GDP unit (expressed in Euro) excluding major mineral waste. The measure unit of the indicator is Kg per thousand Euros. The calculus of this indicator includes all types of waste (from economic/industrial sectors and from households) but excludes the major mineral waste as that resulting from construction/demolition or mining activities. Being related to the gross domestic product, it makes a connection between economic development and the amount of waste generated. The desired decoupling of economic growth from the resulting volume of waste requires high-performance technologies, intelligent design, creativity.
- Generation of waste excluding major mineral waste per domestic material consumption—it reports all waste generated in a country (in mass unit), excluding major mineral waste, to the domestic material consumption (DMC) of a country. It is expressed in percentage (%) as both factors are measured in tons. The indicator reflects the efficiency of the use of raw materials.
The fourth indicator from the Production and consumption group focuses on food waste.
The Food waste indicator evaluates the quantity of the waste generated by the food industry, in all its stages: production, distribution and consumption. It is expressed in tons per year.
In a world where approximately 10% of the world’s population suffers from hunger, the waste of food is not only an environmental and financial cost problem, but also an ethical one. According to the United Nations, in 2019, 690 million people suffered from hunger, which indicates an increase of 10 million compared to 2018. The health crisis induced by COVID-19, doubled by the economic crisis, has further disrupted food chains and deepened the deficiencies where they were already manifest. Estimates show that between 720 and 811 million people were deprived of food during 2020 and approximately 2.37 billion people did not have access to a healthy diet, no region of the globe being excluded [27].Progress towards the desired target of eradicating hunger by 2030, set by the Agenda for Sustainable Development, does not seem to be achievable.
On the other hand, it should be emphasized that, according to the report drawn up by the World Bank [22], food waste (and we also include the green waste here), represents over 50% of waste in the case of low and mediumincome countries. In the case of rich countries, the proportion of organic waste represents around 32%.A lot of food is wasted all along the chain from production to consumer. Estimates made by the Food and Agriculture Organization (FAO) of the United Nations [28] indicate an average percentage of approximately 14% losses between the harvesting of the raw material and the distribution of the final product to the consumer, with large variations from continent to continent and from country to country. These waste and losses include significant amounts of resources and energy. It is estimated that globally 25% of the water used in agriculture is wasted through these losses and generates 8% of greenhouse gases [29].
The Food waste indicator, established at the EU level to measure progress towards a circular economy, despite its importance, does not have any data yet. The regulations of the European Commission are still in the making, there are aspects to be clarified regarding the difference between food waste and food loss, and the modes of data collection and reporting.
The most recent information on this topic can be found on the Statista website [30]. Figure 3 and Figure 4 presents some of these results from 2019 and 2020.
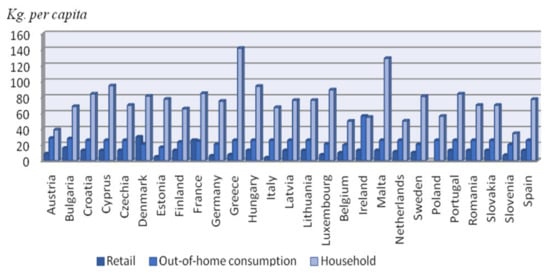
Figure 3.
Food waste in the UE countries in 2019. Source: Authors’ elaboration based on [31].
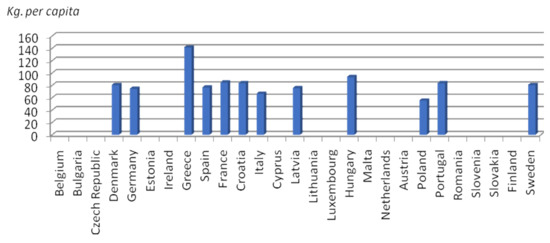
Figure 4.
Food waste in 2020. Source: Authors’ elaboration based on [32].
This data must be viewed with some caution given the lack of a unitary methodology for their collection and the fact that in many countries food packaging and food waste are counted together.
In order to analyze the Production and consumption area, other indicators from the sphere of the circular economy can be used, even if they are not part of the ten indicators nominated in the first documents of the European Commission: Material footprint, Resource productivity, Generation of packaging waste per capita, Generation of plastic packaging waste per capita.
2.2. Waste Management
An important chapter of the circular economy is waste management, which subscribes equally to sustainable development strategies and obviously to all environmental protection programs. Waste is an important huge problem, difficult to manage given the amount produced annually.
The evolution of municipal waste treatment and the percentages in which the different procedures are applied, according to Eurostat data for the period 2010–2018 (the last update of the data was made in May 2021), are presented in Figure 5.
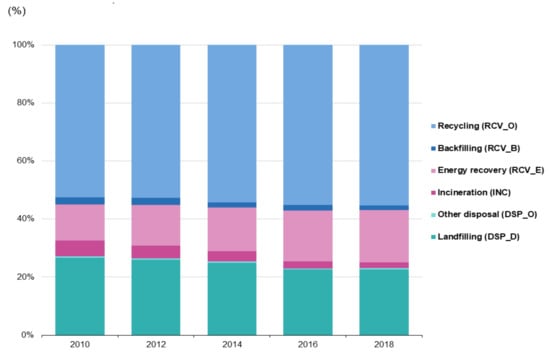
Figure 5.
Treatment rates of municipal waste. Source: Eurostat [33].
From the broad area of waste management, circular economy indicators primarily track the proportion of waste recycled and reintroduced into the economic circuit. Among all the waste disposal methods we may mention: landfill, incineration, composting and recycling, the last being the one that brings value to the economy.
There are two main indicators that deal with this:
- Recycling rates (the share of waste which is recycled);
- Recycling rates for specific waste streams (packaging waste, biowaste, e-waste, etc.
- The first of these two indicators is in turn subdivided into Recycling rate of municipal waste and Recycling rate of all waste excluding major mineral waste.
Municipal waste represents approximately 10% of the total generated waste [33] or, if major mineral wasteis excluded, their proportion reaches 27% [34]. The management of household waste is much more difficult than that of industrial waste given the wide variety of existing types and the costs involved in their management. The European Commission, through the Circular Economy Plan, has set a 50% reduction in non-recycled municipal waste as a target for 2030. This percentage will be increased to 65% by 2035 [35].
The Recycling rate of municipal waste indicates the recycled percentage of the volume of municipal waste, while the Recycling rate of all waste excluding major mineral waste takes into account not only municipal waste, but also commercial and industrial waste with the exception of major mineral waste that basically comes from mining activities or construction. Obviously, both indicators refer to the waste produced on the territory of a country, not on any of its administrative sub-areas.
The indicators grouped in the Waste management category track the progress made by European states in the field of recycling in order to reach the targets for 2035. However, recycling is the third measure included in the Framework Directive on waste [35], being preceded by prevention and reuse.
The Recycling rates for specific waste streams indicator actually groups six sub-indicators that monitor the reintroduction into the economic circuit, thus satisfying the principles of circularity of specific types of waste.
The Recycling rate of overall packaging indicator quantifies the percentage of recycled packaging from the packaging waste total. The Packaging Waste Directive [36] issued in 1994 and updated on 7 July 2018, sets the targets to be achieved by the member countries: “at the latest by 31 December 2025, at least 65% of the weight of all packaging waste will be recycled; by 31 December 2030 at the latest, at least 70% of the weight of all packaging waste will be recycled”. The document sets targets for each category of packaging waste.
The Recycling rate of plastic packaging indicator monitors the recycled percentage of the total plastic packaging. The target set in the aforementioned document is 50% for 2025 and 55% by 2030.
The Recycling rate of wooden packaging indicator is defined as the ratio between the amount of recycled wooden packaging waste and the total amount of wooden packaging waste produced. In the case of this type of packaging, the first recommendation is to repair and reuse it, which is perfectly feasible given the characteristics of the material, and only afterwards to recycle it. With this in mind, the proposed targets for recycling are 25% by 2025 and 30% by 2030.
The Recycling rate of electrical and electronic waste (e-waste) indicator supervises the recycling of electrical and electronic equipment, including their various components. The calculation of this indicator is done by multiplying the “collection rate” by the “reuse and recycling rate”, both values established by the WEEE Directive 2012/19/EU [37]. The minimum collection rate, expressed as a percentage, is established as the ratio between the total weight of electrical and electronic waste collected in a given year and the weight of products of the same type introduced on the market, calculated as the average of the last three years. The minimum collection rate set in 2016 is 45% and 65% starting with 2019.
By the same document, the “reuse and recycling rate”, also expressed in percentages, is determined as the ratio between the weight of electrical and electronic waste that will support the preparation process for reuse or recycling and the weight of all electrical and electronic waste obtained following its selective collection.
The Recycling of biowaste indicator obviously refers to waste of biotic origin, and it monitors their recycling. The biological component is prevalent in municipal waste, including food waste and clippings from parks and gardens, and from this point of view this indicator is corroborated with the Food waste and Recycling rate of municipal waste indicators for an overall vision regarding the implementation of the circular economy. Landfilling biotic waste is an unrecommended solution as its decomposition leads to the release of gas, mainly methane, with an impact on climate change [38].
The essential difference introduced by the Recycling of biowaste indicator is that it takes into account the municipal waste recovered through composting or anaerobic fermentation, related to the number of inhabitants, and it is expressed not in percentages but in units of mass per capita. In addition to composting and methanization, newer solutions propose the energy recovery of bio-waste or the extraction of valuable components such as chemicals, biofuels, fibers, nutritional ingredients for animal feed.
The European Union supports reducing the amount of food waste generated by 50% by 2030, this being the target 12.3 of the Sustainable Development plan, but, at the same time, through the revised Waste Framework Directive [35], member states are required to collect and recycle bio-waste separately beginning with 2023, and to report annually the amount of food waste generated starting with 2020.
The Recovery rate of construction and demolition waste indicator monitors one of the largest sources of waste in Europe, but which can fortunately be reintroduced into the economic circuit. The indicator is defined as the ratio between the waste recovered through reuse, recycling, including backfilling operations and the total waste collected, resulting from construction or demolition activities. It should be noted that the term backfilling was defined by the European Commission as “a recovery operation where suitable waste is used for reclamation purposes in excavated areas or for engineering purposes in landscaping and where the waste is a substitute for non-waste materials” [31]. The subject of backfilling is taken up again in the Commission’s 2018 documents revising the Waste Framework Directive, introducing the possibility of future limitations on the amount of materials resulting from construction and demolition that can be used in backfilling operations.
Compared to municipal waste, the collection and selection of construction and demolition waste is easier to achieve, as it is produced in a specific place and time. For this reason, European countries have a good indicator for this type of waste, the data for 2018 showing a collection at the EU-28 level of approximately 90% [32]. It is true that this figure also includes the use of backlandfill, in the case of some countries with a percentage of about 90%, a type of use that is less advantageous from the point of view of the recovery of the materials that make up this waste.
2.3. Secondary Raw Materials
Is the third area identified by the circular economy and it includes two indicators: Contribution of recycled materials to raw materials demand and Trade of recyclable raw materials between the EU Member States and with the rest of the world.
The secondary raw materials include all raw materials re-entered into the national economic circuit as well as those traded outside the country’s borders. Although recycling and extracting raw materials can be a costly process in terms of money or time, it contributes to the economic independence of the European Union and its transformation into a circular one.
The first indicator, „Contribution of recycled materials to raw materials demand”, actually cumulates the results of two sub-indicators: End-of-life recycling input rates and Circular material use rate.
End-of-life recycling input rates (EOL-RIR) express in percentages the amount of raw materials recovered through recycling that contribute to satisfying the total demand for a certain category of materials. When calculating this indicator, the recovery of materials made after the product in which they were incorporated has reached the end of its life cycle is taken into account. The indicator is calculated for the types of raw materials selected according to market demands. For example, for the year 2019, 12.3% of the aluminum demand, 22.1% of the cobalt demand, 16.9% of the copper demand [39] were ensured from recycling.
The most used indicator in the Secondary raw material group is the Circular material use rate, which provides an overview of the supply of the economy with secondary raw materials. It is calculated as the ratio between secondary raw materials and the totality of raw materials used, as the sum of new and secondary raw materials introduced into the economy. The indicator is calculated for each type of raw materials.
The Trade of recyclable raw materials between the EU Member States and with the rest of the world indicator monitors the amount of waste, scrap and recyclable by-products that are traded within the European Union and beyond its borders. According to Eurostat data, five groups of recyclable waste are tracked: plastics, including rubber, paper and cardboard, ferrous metals, precious metals, copper, aluminum and nickel. The indicator is expressed in mass units, tons of traded material or in thousands of euros, the financial value corresponding to the transactions made.
As a general trend, an increase in the volume of transactions has been observed in recent years. In 2021, the amount of traded recyclable waste increased by 16% as compared to 2017 [40].
2.4. Competitivness and Innovation
The transition to a circular economy requires better-made products, with a longer lifespan, conceived from the very beginning to be repairable and reusable, to have an easy maintenance and modules that can be recycled at the lowest possible cost. The valorization of secondary products, of waste, requires the development of new technologies and new products. As a result, competitiveness in terms of product quality on the market and new product innovation are intrinsic components of the circular economy. These activities, from the design phase to recycling, will determine the emergence of new jobs and new economic branches.
Two major indicators are considered in this group, the first of them being Private investment, jobs and gross value added related to circular economy sectors. Basically, as the name suggests, this indicator collects three types of information:
- Gross investment in tangible goods related to circular economy sectors, which cumulates the private investments in tangible goods made during a year and whose lifetime exceeds that year. Investments in the repair, reuse and recycle sector, even rentals, including land acquisition, if applicable, are included here. It is expressed as a percentage from the gross domestic product;
- Number of persons employed in the circular economy sectors, which is also expressed as a percentage of the total employment achieved in a year, highlighting the number of jobs created through the transition to a circular economy in which repair, recycling and selection activities, together with waste recovery are becoming more and more important;
- Gross value added at factor cost in the circular economy sectors is calculated in millions of euro and then, in relation to the gross domestic product, the contribution of the sectors specific to the circular economy to the economy of the respective country is obtained in percentages.
The second indicator of the group is very interesting, being directly related to the creative capacity of EU states and it refers to Patents related to recycling and secondary raw materials. It practically counts the patents developed in areas of the circular economy, starting from recipes for recovering household plastic material waste, to technologies for extracting precious metals, obtaining secondary raw materials, creating new construction materials, etc. Patents for new technologies for recycling and obtaining secondary raw materials are granted on the basis of the codification in the Cooperative Patent Classification [41]. The indicator is expressed in the total number of patents granted or in the number of patents per million inhabitants.According to official data, at the EU-27 level, there were 350.03 patents per one million inhabitants in 2015, while in 2019 the figure dropped to 295.32 patents [42].
Considering the EC indicators defined and the problems raised by their implementation clarified, in the next section they will be used to analyze the progress in the introduction of the CE in Romania.
3. Results: The Implementation of the Circular Economy in Romania
Romania was interested in environmental issues and the principles of sustainable development even before accession (being one of the first signatories of the Rio de Janeiro declaration in 1992), so the circular economy found favourable ground for its introduction into Romania’s economic policy and social. With oscillations generated by financial priorities and currents of different opinions, by the various crises it has gone through, Romania has gradually implemented the principles of the circular economy.
This paper analyses Romania’s position compared to the EU average in terms of circular economy implementation indicators. The data provided by Eurostat were mainly used and also other sources of information: national legislation, press statements.
3.1. Self-Sufficiency of Raw Materials for Production in the EU
The principles of the circular economy as well as the need for autonomy in terms of primary material resources have led European states to recovery and recycling operations, especially in the case of critical raw materials. Additions to the list of these materials have been continuously made, and the requested quantities have also increased as new technologies have developed.
The geological structure of Europe does not provide all these raw materials, whose updated list for the year 2020 can be found in Table 1.

Table 1.
2020 Critical Raw Materials.
Romania’s mineral resources are managed through the National Mineral Resources Agency, the authority that issues research or exploitation licenses and which is very reluctant in making the information on the country’s mineral resources public. However, we can say that Romania provides 2% of the natural graphite requirement [43] at the EU level, it has important quantities of copper and significant amounts of gold and silver. Other ores, with deposits partially exploited or identified through geological explorations, are: molybdenum, tungsten, bismuth, nickel, boron, uranium, magnesium, bauxite, rare earths [44,45,46,47,48,49], but such information comes from competent persons in the field and not from official sources.
Many of the exploitations that existed decades ago were closed due to technologies with a negative impact on the environment, or to the costs of exploitation that were higher than the costs of the capitalization of the extracted materials. The current crisis, the increase in the prices of raw materials needed for a wide range of products, starting from batteries for mobile phones to those for electric cars, as well as the new technologies that have appeared, can lead to the exploitation of these deposits in Romania, which would be also beneficial for the European Union.
3.2. Green Public Procurement (GPP)
At the level of Romania, in 2018, the Guide for green public procurement was issued, which obliges public authorities to comply with a minimum of environmental protection criteria in the case of 6 categories of products and services [48] ranging from exterior and interior furniture, to transport vehicles, to IT equipment and paper. This guide came in addition to Law no 69 of 2016 on green public procurement [49]. Unfortunately, the analyses made by independent bodies [50] show that, in 2021, the requirements regarding green purchases were not met. For example, in the case of paper, less than 10% of local authorities applied the criteria specified in the 2018 guide.
According to the GPP Guide, the specifications for public investments must provide for compliance with environmental protection conditions. However, more than 70% of public authorities [50] do not introduce these criteria in public documentation. The introduction of environmental criteria in public procurement would generate changes in the economy, in the production of goods, and last but not least in the attitude of the population.
One of the problems that generates this indifference to green purchases is the lack of a monitoring and control system. Within the electronic public procurement system (SEAP) through which public authorities make purchases, there is no reporting and monitoring document for green procurement.
An opinion survey carried out in the fall of 2019 [51] among local and regional authorities of different levels (communes, towns, cities) reveals a worrying figure: only 31% of respondents stated that environmental protection is always a priority taken into account in the case of public procurement. In the other cases, which form the majority, the priority is the cost of the product, which can be explained considering the limited budgets of local administrations, especially the small ones. However, 90% of the respondents consider it necessary to introduce criteria regarding ecological purchases.
Another conclusion resulting from the work of the authors Ciumara and Lupu highlights that trainings on this subject took place in only 5% of cases, most of them in big cities. The specific awareness-raising activities of local authorities, public institutions or civil society carried out so far are not enough.
The conclusions are self-evident: Romania’s legislation in the field of GPP must be updated, the public procurement system must be completed through monitoring greenprocurement, training courses in the field for institution managers, the education of the general public and of the community in this respect. We may also add bigger budgetsand more money for local and regional authorities.
3.3. Waste Generation
Waste generation is one of the indicators in which Romania has an extremely good position. As can be seen from Table 2, the amount of municipal waste generated in Romania is below the European average in the 2015–2020 period. In fact, from 2000 to 2009, according to the data provided by Eurostat, Romania was in the second position in terms of the smallest amount of waste generated per capita, being overtaken by Slovakia. In 2008, a maximum of 411 kg per capita was reached, after which municipal waste decreased in quantity. In the 2009–2020 interval, at the EU-27 level, Romania generated the lowest amount of waste with variations between 256 and 287 kg per capita. The second place in this list of the least generated waste is occupied by Poland, with 297 kg per capita in 2013 and 346 kg per capita in 2020. In the same year, 2020, the European average was 505 kg per capita, the most waste being generated in Austria (834 kg/capita), Denmark (814) and Luxembourg (790 kg per capita). At the same time, as can be seen in Table 3, these three countries have a GDP above the EU average.
Table 2.
Generation of municipal waste per capita (kg per capita).
Table 3.
Real GDP per capita (euro per capita).
By comparing the data from Table 2 and Table 3 for the 2015–2020 years, we can make the following comments:
- first of all, there is a clear link between the standard of living, the GDP of a country, the amount of goods circulating in the economy and implicitly, the amount of waste generated;
- the income level was not reflected in the same way in the amount of waste generated, as the differences among countries depend on several factors: the way municipalities collect waste, the appearance on the market of more sustainable products, the increase in the population’s level of information regarding waste management, discipline and changes in its behavior;
- in the 2015–2019 period (we exclude the year 2020 from the calculation due to the extreme situation brought about by the pandemic, with a significant impact on the GDP), the amount of municipal waste increased by 4.3%, while the GDP at the EU 27 level, increased by approximately 8.1%; it can be said that steps have been taken in decoupling economic growth from the amount of waste generated, according to the principles of the circular economy and in accordance with Article 30 of the revised Waste Framework Directive;
- the next indicator from the Production and consumption group, Generation of waste excluding major mineral wastes per GDP, “reflects the waste intensity of the economy and provides a measure of ‘eco-efficiency” [52];
- according to Table 4, for this indicator, Romania is far above the European average and the situation is similar in the case of all emerging countries whose GDP per capita is low. Poland, to take the previous example, has values between 184 in 2010 and 169 kg per thousand euro in 2018 [53], while having a higher GDP than Romania. At the same time, the indicator has decreasing values for Romania, which indicates a favorable economic evolution and a certain control over the amount of waste generated. According to the 2018 data, Romania ranks 24th, followed by Poland, Bulgaria and Estonia. From our point of view, this indicator that reports the amount of waste to the GDP is not relevant from the EC’s point of view.
Table 4. Generation of waste excluding major mineral wastes per GDP unit in (kg per thousand euro).
Generation of waste excluding major mineral wastes per domestic material consumption (Table 5) is the indicator that expresses the efficiency of the use of raw materials in the economy. A small value of this ratio indicates a small amount of waste generated in relation to the raw materials entering the national economy. In 2018, Romania ranked 3rd among EU countries, with a performance of 46.8% better than the European average.
Table 5.
Generation of waste excluding major mineral wastes per domestic material consumption in Romania and EU average (%).
We can also notice, between 2010 and 2018, the increase in performance in terms of the efficiency of the raw materials used in the economy, with decreasing values in the percentages.
Food waste is the most sensitive indicator in the current socio-economic situation. The application of the principles of the circular economy all along the food chain, from the harvesting of the raw material to the consumer, is of particular importance from the point of view of environmental protection, and at the same time it determines the superior capitalization of raw materials, preserving the value of the resources offered by nature (soil, water) of the invested energies (agricultural works, irrigation, harvesting, further processing, etc.) and last but not least, the generation of new jobs.
According to the data presented by the United Nations Environment Program (UNEP) in the Food Waste Index Report 2021, an amount of approximately 932 million tons of food was lost in 2019 and of these, 61% (570 million tons) came from population households, 26% from public food services (restaurants, canteens, etc.) and 13% from distribution activities [54]. A global average of 74 kg of food waste per year corresponds to every inhabitant of the planet. At the European level, it is estimated that an amount of 88 million tons of food is lost annually [55,56], which, in a population of 746.4 million inhabitants (according to 2018 data), leads to an average of approximately 118 kg per capita and year. Of this, approximately 70% (47 million tons) comes from households and the rest from intermediary chains.
Data currently available on food waste are insufficient, and approaches to quantifying are very different. The previously presented figures resulted from the voluntary contribution of some states to the evaluation of progress for Sustainable Development Goal 12.3: “By 2030, halve per capita global food waste at the retail and consumer levels and reduce food losses along production and supply chains, including post-harvest losses”. The official statistics of the European Commission regarding the indicators of the Circular Economy do not include data on the amount of wasted food, as they are going to be collected based on a common methodology.
Statistical data estimate approximately 1.35 million tons of food waste per year for Romania, which leads to an average of 70 kg per inhabitant per year, a value below the European average [55]. In conclusion, Romania wastes less food than the EU-27.
Romania adapted its legislation regarding food waste in 2016 through Law 217 on the reduction of food waste, followed by Government Decision No. 51/2019, which approved the methodological rules for the application of the law.
3.4. Waste Management
Romania’s accession to the European Union in 2007 also led to the assumption of the Union’s programs in terms of sustainable development. The last document in the field is the National Strategy for the Sustainable Development of Romania 2030, which includes the 17 socio-economic and environmental targets established by the United Nations, including the transition to the circular economy and integrated waste management.
In the main, even if with some delays, European directives have been transposed into national legislation. We further present the most relevant documents regarding waste management issued in Romania in accordance with the EU policy in the field. Thus, the Waste Directive 2008/98/EC was applied by Law 211/2011. Later, Law no. 249/2015 regarding the method of managing packaging and packaging waste and Emergency Ordinance no. 5/2015 on electrical and electronic equipment waste were adopted. In 2018, Emergency Ordinance no. 74/2018 added and amended Law no. 211/2011 regarding the waste regime, Law no. 249/2015 regarding the management of packaging and packaging waste and Government Emergency Ordinance no. 196/2005 regarding the Environmental Fund. A new addition to Law 249/2015 was brought by Ordinance no. 1/2021 which introduces “measures intended, as a priority, to prevent the production of packaging waste and, as additional fundamental principles, to reuse packaging, recycling and other forms of capitalization of waste packaging and, consequently, to reduce the final disposal of such waste, in order to contribute to the transition to a circular economy” [57]. Considering the delays in the management of certain types of packaging, the Ordinance also stipulates the possibility of extending by up to 5 years the deadlines for meeting the waste paper, cardboard and glass targets established for 2025 and 2030.
We can add here that Romania, given the multiple economic and social transformations it had to make, also negotiated other exemptions. Thus, according to Directive 2012/19/EU of the European Parliament and of the Council of 4 July 2012, together with Bulgaria, Hungary, the Czech Republic, Latvia, Lithuania, Malta, Poland, Slovenia and Slovakia, Romania received the right to collect a smaller quantity of electrical and electronic equipment waste (WEEE) by 2021, below the agreed 45%value for the member states, but above 40% of the average weight introduced on the market in the previous three years [37] by 2021. However, the data from Table 6 indicate a 25% WEEE recycling rate in Romania in 2016 and the same figure can be found on the European Parliament Infographic [58] for 2017 as well.
Table 6.
Recycling and recovery rate in Romania and EU.
European Union Directive 2019/904 regarding single-use plastic objects and the impact of plastic products on the environment was transposed into national legislation by Emergency Ordinance no. 6/2021 by which the sale of certain single-use plastic products was prohibited in Romania.
The National Waste Management Strategy was approved by Government Decision no. 870/2013 and the National Waste Management Plan (NWMP) was approved by Government Decision no. 942/20.12.2017.
Indicators from the waste management group are important for the assessment of a country’s progress towards the circular economy. The general situation of recycling in Romania as compared to the European average can be found in Table 6.
The analysis of Table 6 shows that Romania is below the European average for all indicators. There is progress, but waste management in Romania is largely based on storage, with a percentage of about 72% [59] of waste being sent directly to landfills.
As other authors [60] have noted, upon the recommendation of the European Commission, many states, including Romania, introduced chapters on waste management in the National Recovery and Resilience Program (Component 3. Waste management, Reform 1). Moreover, Romania has committed to produce the National Strategy on the circular economy by September 2022 [61].
Romania is below the EU average in terms of household waste recycling, with a rate of only 13.7% in 2020, of which approximately 7% are recycled materials, the difference being given by composting. The reason for the low values of the recycling indicators obviously starts from the faulty selection of waste. Romania recorded delays in updating the national legislation and bringing it into line with European directives, which is why the European Commission decided to launch infringement procedures aimed at the non-communication of the national measures for the transposition of Directive (EU) 2018/851, Directive (EU) 2018/850 and Directive (EU) 2018/852. These directives were supposed to be transposed into national law by 5 July 2020, but this was done with a delay of over a year:
- the Landfill Directive—Directive (EU) 2018/850) was adopted through Ordinance no. 2/2021-08-11;
- the Waste Framework Directive—Directive (EU) 2018/851 was transposed through the Government Emergency Ordinance of 19 August 2021, GEO 92/2021;
- the Packaging and Packaging Waste Directive—Directive (EU) 2018/852 is the subject of the Government Ordinance of 11 August 2021, GO no. 1/11.08.2021.
Delays in the national application of European directives, unclear measures, lack of coherence and continuity, lack of information available to the population and sanctions regarding the non-separation of waste, determined the low values of the recycling indicators and the strange situations indicated by them.
The most consistent evolution is observed in the Recovery rate of construction and demolition waste, where the percentages are increasing, from 47% in 2010 to 85% in 2016, with a relapse to 74% in 2018. However, the recycling trend is increasing. The Recycling rate of all waste excluding major mineral waste also has an upward trend starting from 26% in 2010, reaching 30% in 2016 and 29% in 2018.
Returning to the values in Table 6, two indicators have a downward evolution: the Recycling rate of packaging waste by type of packaging and the Recycling of biowaste.
The causes, as previously mentioned, are related to the non-adaptation of the national legislation to the European directives, the non-involvement of political factors, the lack of standards regarding the definition of food waste and its circuit, the lack of national norms regarding compost. Some steps have been taken and probably the next reports will show this. On 25 August 2021, Ordinance no. 6 (OG 6/2021) on reducing the impact of certain plastic products on the environment was adopted. The document requires the gradual elimination by 2026 of packaging and packaging waste made of plastic materials, products made of oxo-degradable plastic materials and fishing equipment waste containing plastic [62]. Also, along the lines of this ordinance, cutlery and other single-use containers made of plastic materials were taken out of circulation starting with September 2021 [59].
Another act issued in 2021 is Order no. 417/2021 for the approval of the List containing the Romanian standards that adopt the European standards in the field of treatment, including recovery, recycling and preparation for reuse of electrical and electronic equipment waste, in force from 22 March 2021.
To better understand the situation of the Recycling rate of packaging waste by type of packaging indicator and to identify Romania’s position among the other member countries, we use the data provided by Eurostat for each type of packaging (Table 7). Data are in percentages indicating the proportion of packaging waste made of a certain type of material (plastic, cardboard, etc.) which has been recycled from the totality of packaging waste.
Table 7.
Recycling rate (RR) of plastic packaging waste (%).
According to the definition, packaging waste means used materials that have been used to protect products in the various stages of the economic circuit, from manufacturing to the consumer or user.
Materials used for packaging are divided into five types:
- plastic packaging waste;
- paper and cardboard packaging;
- packaging made of wood;
- metal packaging of different types;
- glass packaging.
The member states annually report the data on the collected and recycled quantities, data that become public through European statistics.
Romania’s situation compared to the EU-27 average is presented in Table 7.
Some clarifications are necessary: when calculating the waste from recycled plastics, only the quantities that are reused to produce new plastic packaging are taken into account; in the case of wooden packaging, the packaging that has been repaired and reintroduced into the economic circuit is also taken into account.
Analyzing the indicators, it can be seen that in the 2015–2018 period, Romania exceeded the European average for the recycling of plastic packaging waste. It is an important success in the implementation of the circular economy [63].
In 2019, the exceptional situation caused by the outbreak of the pandemic affected not only the GDP of all countries, but also the quality of life for everyone, including in terms of packaging collection and recycling. A decrease in recycling indicators is observed both at the level of the EU average and in Romania.
Another indicator where Romania is above the European average is the Recycling rate of paper and cardboard packaging waste, with the exception, again, of 2019, the year in which the COVID-19 pandemic began.
The recycling of wooden packaging lowers Romania’s score as compared to the average European values. In 2015, a percentage of 69.5% was recycled and in 2018 there is an increase of up to 81.8%, which brings Romania to the 14th position among European countries, surpassing countries such as Germany, Greece, Estonia, Austria, Hungary.
When recycling metal packaging waste, the percentages achieved by Romania, as compared to the European average, are 80.8% in 2015 and 70.8% in 2018. Unfortunately, the percentages are decreasing, and the same trend is also observed at the EU level. The small percentage of 2018 places Romania on the 24th position among of the 27 member countries. It should be noted that Belgium managed to recycle 98.2% of metal packaging waste in 2018. For this indicator, Portugal and Croatia are also below Romania.
Regarding the Recycling rate of glass packaging waste indicator, Romania achieved the following percentages of the European average: 55.4% in 2015 and 80.8% in 2018, thus occupying the 20th position among the 27 EU states. The growth rate of recycling is positive, which represents a faster growth than the European average in the recycling of this type of packaging. It should be noted that Belgium recycled 100% of its glass packaging throughout the 2015–2018 period, including in 2019. The last positions are occupied by Malta, Hungary and Greece [63].
As a conclusion, we can say that Romania exceeded the EU average for 2 indicators, is making progress in recycling glass packaging, with the possibility of reaching the European average in the coming years (in the situation where the current crises will end soon) and is regressing in terms of metal waste recycling and wooden packaging waste indicators, being below the European average with oscillations between 1.2 and 2.4% for the latter indicator.
Returning to the main indicators (Table 6), Romania benefits from a grace period until August 2021 regarding the minimum amount of recycled electrical and electronic equipment (WEEE). According to specialists [64], only about 20% of electronic waste (especially IT equipment) is officially recycled, the difference of 80% either ends up in landfills or is repaired and recycled informally.According to the statements of the marketing director of the Environ Association, around 25,000 tons of WEEE were collected in 2020, which represents a 46.42% collection rate, exceeding the 45% objective [64].
The weakest indicator in the Waste Management area is the Recycling of biowaste. The causes are multiple and have generally been presented in the previous pages: the inefficiency of selection due to an inconsistent waste policy, the lack of infrastructure and standards regarding food waste composting and recovery, insufficient population information campaigns, non-application of the 6 steps of the food waste hierarchy. The value of this indicator for 2020 places Romania at the bottom of the ranking, ahead of only Estonia and Cyprus. However, it should not be omitted that Romania generates the smallest amount of municipal waste per capita and consequently the amount of recycled biological waste, also calculated per capita, will be small.
In order to comply with the principles of the circular economy and meet its objectives, Law no. 181 regarding the management of compostable non-hazardous waste was adopted in 2020. The law practically emphasizes the importance of biological waste from households and requires its selection and recovery. These resources must be returned to the economic circuit or the natural environment.
The law was supposed to become applicable 6 months after its publication, but the lack of technical norms regarding the activity of composting and anaerobic digestion, as well as the lack of a sufficient number of composting facilities, distributed in all counties, prevented its implementation.
The last indicator from the Waste Management group is the Recovery rate of construction and demolition waste. Being below the European average for recycling, Romania still shows a fairly rapid increase in this indicator. In the analyzed interval, the best positioning was in 2016, the year in which Romania was close to the European average (it achieved 97.7% of the European average in terms of the recovery rate of construction and demolition waste), and thus occupied the 21st position, while in 2018 (with a recycling rate of 84.1% from the European average) it fell by one place to the 22nd position among the 27 EU member states.
The main regulations in Romanian legislation regarding the construction and demolition waste can be found in GEO 92/2021, including the European objective that 70% of the mass of waste from these economic activities should be reused, recycled, and capitalized including through backfilling activities, replacing in this last case other materials and raw materials. However, at present there are few facilities for crushing and processing the material, which makes it all the more difficult to reach the proposed target.
3.5. Secondary Raw Materials
The reintroduction of secondary raw materials into the economic circuit has countless benefits that start with the conservation of natural resources, the increase of EU self-sufficiency in terms of providing raw materials, protecting the environment and finally, the implementation of the circular economy. As mentioned in the previous chapter, the indicators used to monitor the Secondary raw materials area are “End-of-life recycling input rates” (EOL-RIR) and “Circular material use rate” (CMU).
The EOL-RIR indicator is calculated for a certain type of material for the entire EU, as a unitary whole, with no public data on member countries.
CMU is an indicator of the degree of satisfaction of the economy with recovered materials, in relation to the total amount of materials entering the economy, including fossil fuels and the necessary amounts of energy. The data related to this indicator are presented by Eurostat in two ways, one of them, related to Romania and the EU can be seen in Table 8, so it presents the situation by country, while the second, by types of material received at the EU level, and which includes the categories: biomass, raw metallic ores, non-metallic minerals, fossil energy materials [65]. The relevance of this indicator in monitoring progress towards the circular economy is somewhat relative, as is also recognized in its calculation methodology. Thus, there is the possibility that, although the amount of secondary material reintroduced into the economy will increase, a positive thing, in the situation where the total amount of materials used has also increased, the CMU value will remain the same even though the respective state has made obvious progress in the area of material circularity.
Table 8.
Circular material use rate (%).
Romania’s situation regarding the recovery and recycling of materials has already been presented so it is not surprising the position it occupies in this indicator and which is presented in Table 8.
In the analyzed period, Romania achieved between 14.7% and 10.1% of the European average, being in the last position both in 2016 and in 2020. Obviously, this positioning also affects the following indicator, Trade in recyclable raw materials (Table 9).
Table 9.
Trade in recyclable raw materials (tonne).
According to this data regarding the exploitation through commercialization of waste, recyclable waste and secondary products, in 2017, Romania achieved 1.2% of the European average and in 2021, 1.65%. In general, when compared to most states, this indicator does not have very good results, so Romania was in the 14th position in 2017 and occupied the 13th place in 2021.
In the case of Romania, the analysis carried out revealed several main reasons: the lack of an adequate number of installations for the recovery of valuable raw materials, the cost of their acquisition and operation, the low yield of most technologies used at the moment, the small number of operators in the field.
3.6. Competitivness and Innovation
The circular economy requires a new way of designing and manufacturing products, it requires new concepts and technologies for valorizing secondary products and waste, and a new way of thinking and developing a business. All this is achieved through intelligence, creativity and financial effort, generating a more competitive economy, the creation of new jobs and certainly a healthier environment. Competitiveness and innovation is the fourth area monitored by the circular economy, and the indicators established by the European Commission follow the efforts of the states regarding this.
Table 10 presents the indicator “Private investments, jobs and gross value added related to circular economy sectors”, consisting of six sub-indicators, making, as in the previous cases, a comparison between Romania and the EU.
Table 10.
Private investments, jobs and gross value added related to circular economy sectors.
Among these sub-indicators, relevant for the evolution towards the circular economy are those that relate to GDP.
For the “Value added at factor cost-percentage of GPD” indicator, in 2015, Romania achieved 75% of the European average and in 2019 76.6% of the European average, ranking 26th among the member states [66].
In the case of the investment in tangible goods as percentage of GDP, Romania is above the European average by approximately 82% in 2015 and by 41.6% in 2019, ranking 15th. To get these results, not only the intensity of the development of new economic sectors contributes but also the small domestic product of the country.
The number of newly created jobs in fields adjacent to circular economy increased in Romania by 2% in 2019 compared to 2015, and at the EU level the increase was approximately 8%. In the case of the percentage of the peole employedin the area of total employment persons in 2015 Romania achieved 89.5% of the European average and in 2019 a percentage of 88% of the European average, ranking 21st.
As it was observed from the analysis of the previously presented indicators which monitor waste management and the use of recovered materials, these economic branches are not sufficiently well developed in Romania and this situation is directly correlated with the indicators in the area of the competitiveness. The investments in technologies, installations and equipment for the processing and recycling of waste, for the recovery of valuable materials, are still modest. Legislation in the field exists, but for a faster advance, the authorities should consider these economic areas as priority areas and grant certain fiscal facilities to encourage investments.
The “Patents related to recycling and secondary raw material” indicator (Table 11), with data taken by Eurostat [42] from the European Patent Office can be viewed in two ways: as a total number of patents and as a number of patents per million inhabitants. Romania is below the European average throughout the 2015–2019 interval.
Table 11.
Patents related to recycling and secondary raw material (per million inhabitants).
In 2015, Romania achieved 29% of the European average for this indicator and in 2019,42.4% of the European average, ranking 18th.Romania’s result on this indicator has two main motivations: the budget allocations for research institutes in this sector are not generous and the departure of many valuable researchers from the country, the so-called brain drain. At the same time, private companies active in fields related to the circular economy they are not financially strong enough to develop powerful research laboratories. However, research activities are taking place, especially within universities, and appropriate funding, public-private partnerships would boost this sector.
4. Discussion
The analysis of Romania’s position within the EU regarding the implementation of the circular economy was made using the indicators defined in the document issued in 2018 by the European Commission regarding the monitoring framework for the circular economy [14] and available at the Commission’s web address (https://ec.europa.eu/eurostat/web/circular-economy/indicators/monitoring-framework, accessed on 16 June 2022).
The latest data updates from Eurostat include different years, depending on the indicators (2018–2020), so in order to make an assessment of Romania’s position at a given moment, the data we selected to present is from 2018, the year for which there is complete information for all indicators. The synthesis of these data with reference to Romania’s achievements compared to the European average and its position within the EU-27 are presented in Table 12. The interpretation of the data was made taking into account that there are indicators for which the lowest values below the European average are of interest (for example, the case of the indicator Generation of waste excluding major mineral wastes per domestic material consumption), which is otherwise reflected by the position occupied by the member states.
Table 12.
Circular economy indicators achieved by Romania in relation to the European average. * estimated data.
The Figure 6 illustrates in percents the main indicators of the Circular Economy achieved by Romania in relation to the European average. The figures written in green indicate values better than those of the EU in blue the values close to the European ones and in red those far behind the European average. Even if, as it was shown before, Romania is at the beginning of implementing the circular economy, there are chapters where the European average is exceeded.

Figure 6.
Circular economy indicators of Romania (in red) and EU-27. Note: in green indicate values better than those of the EU blue the values close to the European ones and in red those far behind the European average.
In the area of Production and consumption, Romania has very good results for three of the indicators, being in the first position among the member countries in terms of those indicators. Romania is far below the European average in terms of the amount of municipal waste generated (54.8%), the Generation of waste excluding major mineral wastes per domestic material consumption indicator also has a low value (37.5% of the EU average), it wastes little food (59.3%) as compared to the European average. The indicator Generation of waste excluding major mineral wastes per GDP unit downgrades it due to the large difference in terms of Gross Domestic Product, as compared to countries with a strong economy. The solution lies in further reducing the amount of municipal waste and increasing the GDP, which requires time, public and private investment, a stronger economy. At the level of 2021, according to [67], Romania was on position 22 in terms of gross domestic product. The current economic crisis affecting the countries of the world, with economies weakened by the pandemic and now threatened by the increase in fuel and energy prices, against the background of the war in Ukraine, does not offer optimistic prospects for the expected economic jump. Waste management is the area where Romania has important progress to make. All main indicators are well below the European average. The share of municipal waste that is recycled is very small, of only 23.5% of the European average (given that the EU itself recycles less than 50% of the produced quantity), but in recent years significant investments have been made in waste management, with town halls financing differentiated collection and sorting stations, leading to the closure of non-compliant storage. Moreover, through the National Recovery and Resilience Plan, Romania invests 1.3 billion euros for waste management. The percentage of biowaste is also very small, 10.5% of the EU average, which means approximately 9 kg per capita and year. The positions confirmed by these percentages are 26 in the case of municipal waste recycling and 25 for biowaste recycling.
The prediction for the period 2022–2025 in case of municipal waste recycling, made with the “Forecast.ets” function in excel, based on the data collected by Eurostat in the period 2015–2019 (standardizing the data from the pandemic period) shows the upward trend of Romania and the reduction of the gap reported to the European average, it is presented in the Figure 7. Obviously, the analysis did not take into account the latest investments that will lead to the acceleration of the recovery of the gaps with the EU.
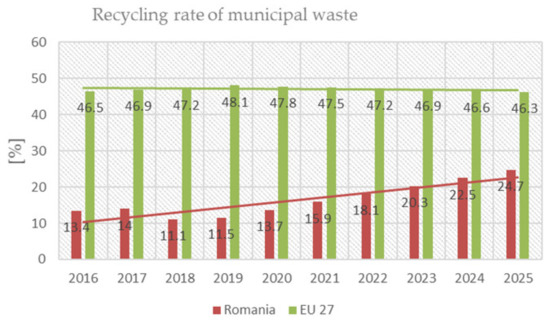
Figure 7.
Prediction of the recycling rate of municipal waste.
The Recycling rate of packaging waste by type of packaging indicator secures an additional position for Romania placing it in the 24th place. Analyzing the sub-indicators included in the Recycling rate of packaging waste by type of packaging indicator, certain progress is worth noting:
- Romania is above the European average in recycling plastic, cardboard and paper waste. The Figure 8 and Figure 9 show the estimated evolution of these indicators until 2025 and according to the results, Romania maintains its advantage compared to UE.
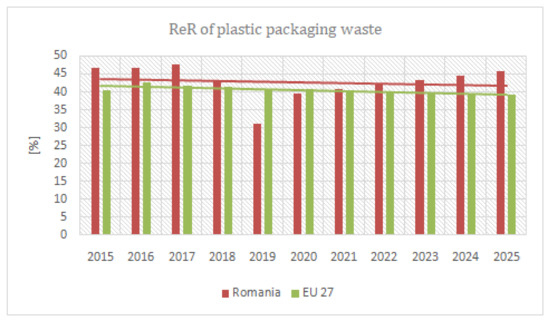 Figure 8. Prediction of the Recycling Rate of plastic packaging waste.
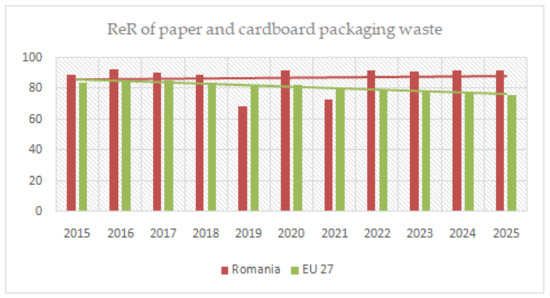 Figure 9. Prediction of the Recycling Rate of paper and cardboard packaging waste.
 - It achieves a percentage below the European average (81.8% of the EU average) but quite good compared to other states, in the recovery and recycling of wooden packaging, occupying position 14 at the European level.
- It is far behind compared to European countries in the recycling of metal and glass packaging waste. With a percentage of 70.8% of the EU average, it ranks 25th for metal packaging and 20th for glass packaging, recycling only 80.6% of the EU average, whereas there are states that recycle 100% of the glass packaging and the EU recycles 75.8% of the collected glass packaging on average.
European countries recycle a large amount of waste resulting from construction and demolition activities: Netherlands and Malta do it by 100% (2.37). Romania is in the 21st position with an achieved percentage of 84% of the EU average.
Waste management is a sensitive problem in Romania and, as other authors have argued, there are possible solutions to improve these indicators. Below we list some of them:
- Complete transposition of European directives into the national legislation;
- Better performances in terms of the selective collection of municipal waste and biowaste through the extension of a greater number of collection points;
- Development of the necessary infrastructure and standards regarding food waste composting and recovery, more applied educational campaigns with greater impact among the population, application of penalties for accidental or improper waste storage;
- Uniform distribution throughout the country of recycling facilities for different types of waste: plastic packaging, glass, etc., and especially for waste resulting from construction and demolition;
- Updated methodologies and digital tracking of waste flows;
- A policy to encourage commercial companies operating in the circular economy field through lower taxation, lower tax for workers in these fields, etc.
Secondary raw materials is an area where Romania’s performance is below the European average, a direct reflection of the reduced capacity to recycle waste and extract valuable materials from end-of-life products. The specific solutions are the same as for the Waste management area, to which one could add:
- Creation of a digital waste platform for its recovery, including that containing scarce raw materials;
- An adequate functioning market for waste and recycled raw materials.
The last area monitored for measuring progress towards the circular economy is Competitiveness and innovation. Analyzing Romania’s positioning among the member states, as presented in the Table above, it can be noted that it ranks in the upper half of most indicators. However, the added value realized from activities specific to the circular economy is still small. In direct correlation with the volume of these activities is the number of newly created jobs, which places Romania in the 13th place. The evolution of the persons employed in the area of circular economy, using Forecast (Excel function) is presented in Figure 10. According to this evaluation, measures are needed to increase investments in economic branches related to the circular economy. This will also lead to an increase in the number of jobs in the field.
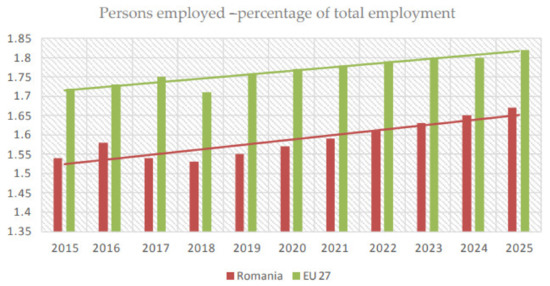
Figure 10.
Estimated evolution of the persons working in CE from the total number of employed people.
It occupies the same position in terms of the number of patents for new technologies and procedures for capitalizing secondary products and waste, waste collection and sorting, extracting scarce raw materials from the composition of products, and all other new and creative things that might favor the circular economy. The situation can be improved by several measures:
- Establishing research grants dedicated to the fields of environmental protection and the circular bioeconomy;
- Introducing study programs dedicated to the circular economy in the offer of universities and the creation of skills in the field.
The palette of measures that can be adopted for the implementation of the circular economy is much wider, some of them can be addressed directly to companies through requirements related to the circularity of secondary products and a more rigorous waste management.
The transition from the linear economy to the circular economy requires political determination and consistency, financial support and time. The situation is even more difficult for emerging countries, where budgets must be carefully managed. Romania is committed to implementing the circular economy and the analysis of the indicators shows this, with all the fluctuations inherent in a difficult transition and a complicated economic period.
Offering an overview of the major indicators of the circular economy in the case of Romania, the present paper is useful to all those involved in this field, from anywhere, the problems and difficulties of transposing the principles of the circular economy into practice being general, and also encountered by other countries.
Author Contributions
Conceptualization, L.T. and P.G.P.; methodology, L.T. and P.G.P.; validation, C.D. and V.V.T.; formal analysis L.T. and P.G.P.; investigation, L.T., P.G.P., C.D. and V.V.T.; resources L.T., P.G.P. and C.D.; writing—original draft preparation L.T. and P.G.P.; writing—review and editing, L.T., P.G.P. and V.V.T.; visualization L.T. and P.G.P. All authors have read and agreed to the published version of the manuscript.
Funding
This research received no external funding but the idea of the research and a part of information originated from the project “MULTITRACES—Multidisciplinary training in circular economy and smart valorisation of the rural area for new business models”, financed by Erasmus+ Program, ID Proiect: 2018-1-ES01-KA204-050430.
Institutional Review Board Statement
Not applicable.
Informed Consent Statement
Not applicable.
Data Availability Statement
The data presented in this study are available on request from the first author.
Acknowledgments
The authors express their gratitude to the partners of the Multitraces project.
Conflicts of Interest
The authors declare no conflict of interest.
References
- Lacy, P.; Rutqvist, J. The Roots of the Circular Economy. In Waste to Wealth; Palgrave Macmillan: London, UK, 2015; pp. 19–23. [Google Scholar]
- Ellen MacArthur Foundation. What Is a Circular Economy? Available online: www.ellenmacarthurfoundation.org/circular-economy/concept/schools-of-thought (accessed on 29 August 2022).
- Erkman, S. Industrial ecology: An historical view. J. Clean. Prod. 1997, 5, 1–10. [Google Scholar] [CrossRef]
- ADEME. Methodological Guide to the Development of Regional Circular Economy Strategies in France. French Environment & Energy Management Agency. Available online: https://www.ademe.fr (accessed on 1 September 2022).
- Erkman, S. Industrial ecology: A new perspective on the future of the industrial system. Swiss Med. Wkly. 2001, 131, 531–538. [Google Scholar] [CrossRef] [PubMed]
- Stahel, W. The Performance Economy: Business Models for the Functional Service Economy. In Handbook of Performability Engineering; Palgrave Macmillan: New York, NY, USA, 2010; pp. 127–138. [Google Scholar]
- Mcgregor, S.L.T. Transdisciplinarity and Biomimicry. Transdiscipl. J. Eng. Sci. 2013, 4, 57–65. [Google Scholar] [CrossRef]
- Kirchherr, J.; Reike, D.; Hekkert, M. Conceptualizing the circular economy: An analysis of 114 definitions. Resour. Conserv. Recycl. 2017, 127, 221–232. [Google Scholar] [CrossRef]
- Winans, K.; Kendall, A.; Deng, H. The history and current applications of the circular economy concept. Renew. Sustain. Energy Rev. 2017, 68, 825–833. [Google Scholar] [CrossRef]
- Lah, O. Circular Economy Policies and Strategies of Germany. In Towards a Circular Economy: Corporate Management and Policy Pathways; Project Report 2014-44; Anbumozhi, V., Kim, J., Eds.; ERIA Research: Jakarta, Indonesia, 2016; pp. 59–74. [Google Scholar]
- Andrade, C.; Selosse, S.; Maïzi, N. Thirty years since the circular economy concept emerged: Has it reached a consensus. In Working Paper; Mines ParisTech, Université PSL, Centre de Mathématiques Appliquées, Sophia Antipolis: Valbonn, France, 2021; p. 27. [Google Scholar]
- European Commission. Communication No. 398, 2014. Towards a Circular Economy: A Zero Waste Programme for Europe; (COM No. 398, 2014); Commission of European Communities: Brussels, Belgium, 2014; Available online: https://ec.europa.eu/environment/circulareconomy/pdf/circular-economy-communication.pdf (accessed on 14 June 2022).
- European Commission. Closing the Loop—An EU Action Plan for the Circular Economy COM/2015/0614 Final. Available online: https://www.eea.europa.eu/policy-documents/com-2015-0614-final (accessed on 14 June 2022).
- European Commission. Measuring Progress towards Circular Economy in the European Union—Key Indicators for a Monitoring Framework. Available online: https://eur-lex.europa.eu/legal-content/EN/TXT/PDF/?uri=CELEX:52018SC0017&from=EN (accessed on 14 June 2022).
- European Commission. Critical Raw Materials Resilience: Charting a Path towards Greater Security and Sustainability, COM(2020) 474 Final. Available online: https://eur-lex.europa.eu/legal-content/EN/TXT/?uri=CELEX%3A52020DC0474 (accessed on 14 June 2022).
- Girtan, M.; Wittenberg, A.; Grilli, M.L.; De Oliveira, D.P.S.; Giosuè, C.; Ruello, M.L. The Critical Raw Materials Issue between Scarcity, Supply Risk, and Unique Properties. Materials 2021, 14, 1826. [Google Scholar] [CrossRef] [PubMed]
- European Commission. Green Public Procurement. Available online: https://ec.europa.eu/environment/gpp/what_en.htm (accessed on 14 June 2022).
- Blome, C.; Hollos, D.; Paulraj, A. Green procurement and green supplier development: Antecedents and effects on supplier performance. Int. J. Prod. Res. 2014, 52, 32–49. [Google Scholar] [CrossRef]
- Slastanova, N.; Palus, H.; Sulek, R.; Parobek, J.; Slastanova, K. The Benefits of Applying the Green Purchasing. In Proceedings of the 20th International Scientific Conference Globalization and its Socio-Economic Consequences 2020, SHS Web of Conference, Zilina, Slovakia, 21–22 October 2021; Volume 92. [Google Scholar] [CrossRef]
- Bocken, N.M.P.; De Pauw, I.; Van der Grinten, C.B. Product design and business model strategies for a circular economy. J. Ind. Prod. Eng. 2016, 33, 308–320. [Google Scholar] [CrossRef]
- Environmental European Bureau. Unpacking the Circular Economy Package. Available online: https://eeb.org/library/unpacking-the-circular-economy-package (accessed on 14 June 2022).
- Silpa, K.; Yao, L.C.; Bhada-Tata, P.; Van Woerden, F. What a Waste 2.0: A Global Snapshot of Solid Waste Management to 2050; Urban Development Series; World Bank: Washington, DC, USA, 2018; Available online: https://openknowledge.worldbank.org/handle/10986/30317 (accessed on 14 June 2022).
- Eurostat. Statistics Explained, Municipal Waste Statistic. Available online: https://ec.europa.eu/eurostat/statistics-explained/index.php?title=Municipal_waste_statistics#Municipal_waste_generation (accessed on 14 June 2022).
- European Commission. Commission of European Communities. Communication No. 98, 2020. A New Circular Economy Action Plan for a Cleaner and More Competitive Europe; COM No. 98; European Commission: Brussels, Belgium, 2020. [Google Scholar]
- Smol, M.; Duda, J.; Czaplicka-Kotas, A.; Szołdrowska, D. Transformation towards Circular Economy (CE) in Municipal Waste Management System: Model Solutions for Poland. Sustainability 2020, 12, 4561. [Google Scholar] [CrossRef]
- Directive (EU) 2018/851 of the European Parliament and of the Council of 30 May 2018 amending Directive 2008/98/EC on Waste. Available online: http://data.europa.eu/eli/dir/2018/851/oj (accessed on 14 June 2022).
- FAO; IFAD; UNICEF; WFP; WHO. The State of Food Security and Nutrition in the World. Transforming Food Systems for Food Security, Improved Nutrition and Affordable Healthy Diets for All; FAO: Rome, Italy, 2021. [Google Scholar]
- Food and Agriculture Organization of the United Nations. Sustainable Development Goals. Available online: https://www.fao.org/sustainable-development-goals/indicators/1231/en (accessed on 16 June 2022).
- Teigiserova, D.A.; Hamelin, L.; Thomsen, M. Towards transparent valorization of food surplus, waste and loss: Clarifying definitions, food waste hierarchy, and role in the circular economy. Sci. Total Environ. 2020, 706, 140396. [Google Scholar] [CrossRef]
- Statista. Annual Household Food Waste Produced per Capita in Selected Countries in Europe as of 2020. Available online: https://www.statista.com/statistics/1219830/per-capita-food-waste-of-selected-countries-in-europe/ (accessed on 16 June 2022).
- EUR-lex. Decision 2011/753—2011/753/EU: Commission Decision of 18 November 2011 Establishing Rules and Calculation Methods for Verifying Compliance with the Targets Set in Article 11(2) of Directive 2008/98/EC (Notified under Document C(2011) 8165). Available online: https://www.eumonitor.eu/9353000/1/j9vvik7m1c3gyxp/viv26bka78zv (accessed on 16 June 2022).
- European Environment Agency. Mineral Waste from Construction and Demolition, Waste Treatment. Available online: https://www.eea.europa.eu/data-and-maps/daviz/mineral-waste-from-construction-and#tab-googlechartidchart13 (accessed on 16 June 2022).
- Eurostat. Waste Management Indicators. Available online: https://ec.europa.eu/eurostat/statistics-explained/index.php?title=Waste_management_indicators&oldid=548999 (accessed on 16 June 2022).
- Eurostat. Reaching 2030’s Residual Municipal Waste Target—Why Recycling Is Not Enough. Available online: https://www.eea.europa.eu/publications/reaching-2030s-residual-municipal-waste (accessed on 16 June 2022).
- EUR-lex. Directive (EU) 2018/851 of the European Parliament and of the Council of 30 May 2018 amending Directive 2008/98/EC on Waste (Text with EEA Relevance). Available online: https://eur-lex.europa.eu/legal-content/EN/TXT/?uri=celex%3A32018L0851 (accessed on 16 June 2022).
- European Commission. European Parliament and Council Directive 94/62/EC of 20 December 1994 on Packaging and Packaging Waste. Available online: https://eur-lex.europa.eu/legal-content/EN/TXT/?uri=celex%3A31994L0062 (accessed on 16 June 2022).
- EUR-lex. Directive 2012/19/EU of the European Parliament and of the Council of 4 July 2012 on Waste Electrical and Electronic Equipment (WEEE) (Recast) Text with EEA Relevance. Available online: https://eur-lex.europa.eu/legal-content/EN/TXT/?uri=celex%3A32012L0019 (accessed on 16 June 2022).
- European Environment Agency. Bio-Waste in Europe—Turning Challenges into Opportunities. Available online: https://www.eea.europa.eu/publications/bio-waste-in-europe (accessed on 16 June 2022).
- Eurostat. Contribution of Recycled Materials to Raw Materials Demand—End-of-Life Recycling Input Rates (EOL-RIR). Available online: https://ec.europa.eu/eurostat/databrowser/view/cei_srm010/default/table?lang=en (accessed on 16 June 2022).
- Eurostat. Trade in Recyclable Raw Materials. Available online: https://ec.europa.eu/eurostat/databrowser/view/cei_srm020/default/table?lang=en (accessed on 16 June 2022).
- Smol, M.; Marcinek, P.; Duda, J.; Szołdrowska, D. Importance of Sustainable Mineral Resource Management in Implementing the Circular Economy (CE) Model and the European Green Deal Strategy. Resources 2020, 9, 55. [Google Scholar] [CrossRef]
- Eurostat. Patents Related to Recycling and Secondary Raw Materials. Available online: https://ec.europa.eu/eurostat/databrowser/view/cei_cie020/default/table?lang=en (accessed on 16 June 2022).
- European Commission. Communication from the Commission to the European Parliament, the Council, the European Economic and Social Committee and the Committee of the Regions Critical Raw Materials Resilience: Charting a Path towards Greater Security and Sustainability. Available online: https://ec.europa.eu/docsroom/documents/42849/attachments/2/translations/en/renditions/native (accessed on 16 June 2022).
- Jurnalul.ro. The Hidden Treasure of Romania—The Strategic Materials. Available online: https://jurnalul.ro/bani-afaceri/economia/comoara-ascunsa-a-romaniei-materialele-strategice-869293.html (accessed on 16 June 2022).
- Giucristglobal. The Riches from the Underground of Romania and the Republic of Moldova. Available online: https://giucristglobal.ro/bogatiile-din-subsolul-romaniei-si-al-republicii-moldova/ (accessed on 16 June 2022).
- Gov.ro. Available online: http://www.economie.gov.ro/images/resurseinerale/Prezentare%20GAVRIL%20BAICAN%2016%20oct%202018.pdf (accessed on 16 June 2022).
- Annastasiu, N. Mineral Resources—A Forgotten Potential! Available online: https://www.researchgate.net/publication/280947245_Resursele_minerale_-_un_potential_uitat (accessed on 16 June 2022).
- Ministry of the Environment. The Green Public Procurement Guide, which Contains the Minimum Environmental Protection Requirements for Certain Groups of Products and Services that Are Required in the Specifications; Official Monitor; Ministry of the Environment: Bucharest, Romania, 2018; Part I, No. 954.
- Romanian Parliament. Law No. 69/2016 regarding Green Public Procurement. Available online: https://lege5.ro/Gratuit/geydmmzygmzq/legea-nr-69-2016-privind-achizitiile-publiceverzi (accessed on 16 June 2022).
- ARDLD-Asociatia Română pentru Dezvoltare Locală Durabilă. First National Study on the Use of Green Public Procurement in Romania. Available online: https://www.onvlaw.ro/the-1st-national-study-on-green-public-procurement-in-romania-2 (accessed on 16 June 2022).
- Ciumara, T.; Lupu, I. Green Procurement Practices in Romania: Evidence from a Survey at the Level of Local Authorities. Sustainability 2020, 12, 10169. [Google Scholar] [CrossRef]
- Eurostat. Statistical Indicator, in Generation of Waste excluding Major Mineral Wastes per GDP Unit (cei_pc032). Available online: ec.europa.eu/eurostat/cache/metadata/en/cei_pc032_esmsip2.htm#meta_update1658230385456 (accessed on 16 June 2022).
- Eurostat. Generation of Waste excluding Major Mineral Wastes per GDP Unit. Available online: https://ec.europa.eu/eurostat/databrowser/view/cei_pc032/default/table?lang=en (accessed on 16 June 2022).
- UNEP. UNEP Food Waste Index Report 2021. Available online: https://www.unep.org/resources/report/unep-food-waste-index-report-2021 (accessed on 16 June 2022).
- Consiliul Economic și Social. LAW for the Amendment and Completion of Law No. 217/2016 on reducing Food Waste. Available online: https://www.ces.ro/newlib/PDF/proiecte/2022/b334.pdf (accessed on 16 June 2022).
- European Commission. Food Waste. Available online: https://food.ec.europa.eu/safety/food-waste_en (accessed on 16 June 2022).
- Guvernul României. Ordinance No. 1/2021 for the Amendment and Completion of Law No. 249/2015 Regarding the Management of Packaging and Packaging Waste. Available online: https://lege5.ro/Gratuit/ha3tonrsgaya/ordonanta-nr-1-2021-pentru-modificarea-si-completarea-legii-nr-249-2015-privind-modalitatea-de-gestionare-a-ambalajelor-si-a-deseurilor-de-ambalaje (accessed on 16 June 2022).
- European Parliament. E-Waste in the EU: Facts and Figures (Infographic). Available online: https://www.europarl.europa.eu/news/ro/headlines/society/20201208STO93325/deseurile-electronice-in-ue-date-si-cifre-infografic (accessed on 16 June 2022).
- Institutul European din România. The Transition to a Circular Economy. From Waste Management to a Green Economy in Romania. Available online: http://ier.gov.ro/wp-content/uploads/2019/03/Final_Studiul-3_Spos-2018_Economie-circular%C4%83-1.pdf (accessed on 16 June 2022).
- Dobre-Baron, O.; Nițescu, A.; Niță, D.; Mitran, C. Romania’s Perspectives on the Transition to the Circular Economy in an EU Context. Sustainability 2022, 14, 5324. [Google Scholar] [CrossRef]
- Ministerul Investitiilor si Proiectelor Europene. Proposal for the Council’s Implementing Decision Approving the Evaluation of Romania’s Recovery and Resilience Plan. Available online: https://mfe.gov.ro/wp-content/uploads/2021/09/e6f28710212d5a2d963ba440ce587a99.pdf (accessed on 16 June 2022).
- Guvernul României. Ordinance No. 6/2021 on Reducing the Impact of Certain Plastic Products on the Environment. Available online: http://www.ecoteca.ro/wp-content/uploads/2022/01/6_O_2021_12ian2022.pdf (accessed on 16 June 2022).
- Eurostat. Recycling Rate of Packaging Waste by Type of Packaging. Available online: https://ec.europa.eu/eurostat/databrowser/view/cei_wm020/default/table?lang=en (accessed on 16 June 2022).
- Ziarul Financiar. Romania on the Recycling Map. How Do We Close the Loop? Available online: https://www.zf.ro/supliment-zf-green-economy/romania-pe-harta-reciclarii-cum-inchidem-circuitul-20042698 (accessed on 16 June 2022).
- Eurostat. Available online: http://appsso.eurostat.ec.europa.eu/nui/show.do?dataset=env_ac_curm&lang=en (accessed on 16 June 2022).
- Eurostat. Private Investments, Jobs and Gross Value Added Related to Circular Economy Sectors. Available online: https://ec.europa.eu/eurostat/databrowser/view/cei_cie010/default/table?lang=en (accessed on 16 June 2022).
- Eurostat. GDP per Capita, Consumption per Capita and Price Level Indices. Available online: https://ec.europa.eu/eurostat/statistics-explained/index.php?title=GDP_per_capita,_consumption_per_capita_and_price_level_indices (accessed on 16 June 2022).


Disclaimer/Publisher’s Note: The statements, opinions and data contained in all publications are solely those of the individual author(s) and contributor(s) and not of MDPI and/or the editor(s). MDPI and/or the editor(s) disclaim responsibility for any injury to people or property resulting from any ideas, methods, instructions or products referred to in the content. |
© 2022 by the authors. Licensee MDPI, Basel, Switzerland. This article is an open access article distributed under the terms and conditions of the Creative Commons Attribution (CC BY) license (https://creativecommons.org/licenses/by/4.0/).