
Stock Assessment of Chub Mackerel (Scomber japonicus) in the Northwest Pacific Ocean Based on Catch and Resilience Data


Abstract
:1. Introduction
2. Materials and Methods
2.1. Analysis Method
2.2. Data Used for the Analysis
3. Results
4. Discussion and Conclusions
Author Contributions
Funding
Institutional Review Board Statement
Informed Consent Statement
Data Availability Statement
Conflicts of Interest
References
- National Institute of Fisheries Science. Fishery Resource Information Center. Available online: https://www.nifs.go.kr/ (accessed on 5 September 2022).
- Froese, R.; Pauly, D. FishBase. World Wide Web Electronic Publication. Version. Vols. 06/2022. Available online: www.fishbase.org (accessed on 16 August 2022).
- Pacific F.A.O. NORTHWEST (Major Fishing Area 61); Fisheries and Aquaculture Division: Rome, Italy, 2022; Available online: https://www.fao.org/ (accessed on 7 September 2022).
- FAO. Fishery and Aquaculture Statistics. Global Capture Production; FAO Fisheries and Aquaculture Division: Rome, Italy, 2022. [Google Scholar]
- Ministry of Government Legislation. Enforcement Decree of the Fishery Resources Management Act. Available online: www.law.go.kr (accessed on 6 September 2022).
- Ministry of Government Legislation. Fishery Resources Management Act. Available online: www.law.go.kr (accessed on 6 September 2022).
- Ministry of Oceans and Fisheries. June 2023 Fishing Season Total Allowable Catch as 450,659 Tons—Application of Total Allowable Catch (TAC) for Redlip Croaker, Hairtail, and Japanese Spanish Mackerel from July 1st; Ministry of Oceans and Fisheries: Sejong City, Republic of Korea, 2020.
- Hiyama, Y.; Yoda, M.; Ohshimo, S. Stock size fluctuations in chub mackerel (Scomber japonicus) in the East China Sea and the Japan/East Sea. Fish. Oceanogr. 2002, 11, 347–353. [Google Scholar] [CrossRef]
- Tanoue, W. Japan’s Total Allowable Catch Systems in Fishery Resource Management. Ph.D. Thesis, University of Washington, Washington, DC, USA, 2015. [Google Scholar]
- Ministry of Oceans and Fisheries. The 3rd Basic Fisheries Resource Management Plan 2021–2025; Ministry of Oceans and Fisheries: Sejong City, Republic of Korea, 2021.
- Liang, C.; Xian, W.; Pauly, D. Assessments of 15 exploited fish stocks in Chinese, South Korean and Japanese waters using the CMSY and BSM methods. Front. Mar. Sci. 2020, 7, 623. [Google Scholar] [CrossRef]
- Hong, J.; Kim, D. Study on stock assessment of chub mackerel (Scomber japonicus) in South Korea using CMSY and BSS models. J. Fish. Mar. Stud. Educ. 2021, 33, 1272–1283. [Google Scholar]
- Schaefer, M.B. Some aspects of the dynamics of populations important to the management of the commercial marine fisheries. Bull. Inter-Am. Trop. Tuna Commiss. 1954, 1, 27–56. [Google Scholar] [CrossRef]
- Froese, R.; Demirel, N.; Coro, G.; Kleisner, K.M.; Winker, H. Estimating fisheries reference points from catch and resilience. Fish Fish. 2017, 18, 506–526. [Google Scholar] [CrossRef] [Green Version]
- Choi, M.J.; Kim, D.H.; Choi, J.H. Comparative analysis of stock assessment models for analyzing potential yield of fishery resources in the West Sea, Korea. J. Korean Soc. Fish. Technol. 2019, 55, 206–216. [Google Scholar] [CrossRef]
- Ren, Q.Q.; Liu, M. Assessing northwest pacific fishery stocks using two new methods: The Monte Carlo catch-MSY (CMSY) and the Bayesian Schaefer model (BSM). Front. Mar. Sci. 2020, 7, 430. [Google Scholar] [CrossRef]
- Bouch, P.; Minto, C.; Reid, D.G. Comparative performance of data-poor CMSY and data-moderate SPiCT stock assessment methods when applied to data-rich, real-world stocks. ICES J. Mar. Sci. 2021, 78, 264–276. [Google Scholar] [CrossRef]
- Schaefer, M.B. A study of the dynamics of the fishery for yellow fin tuna in the eastern tropical Pacific Ocean. Boll. Inter-Am. Trop. Tuna Comm. 1957, 2, 247–285. [Google Scholar]
- Liao, B.; Xu, Y.; Sun, M.; Zhang, K.; Liu, Q. Performance comparison of three data-poor methods with various types of data on assessing southern Atlantic albacore fishery. Front. Mar. Sci. 2022, 9, 825461. [Google Scholar] [CrossRef]
- Hong, J. An Optimal Production Analysis of Offshore Fisheries Considering Reduction of Greenhouse Gas (GHG) Emissions in Korea: Focusing on Large Purse Seine Fishery. Domestic. Ph.D. Thesis, Bukyong National University, Busan, Republic of Korea, 2022. [Google Scholar]
- Palomares, M.L.; Froese, R.; Derrick, B.; Nöel, S.L.; Tsui, G.; Woroniak, J.; Pauly, D. A Preliminary Global Assessment of the Status of Exploited Marine Fish and Invertebrate Populations; A Report Prepared by the Sea Around Us for OCEANA; Ozeana: Kiel, Germany, 2018; p. 60. [Google Scholar]
- Sultana, R.; Liu, Q.; Schneider, P.; Al-Mamun, M.A.; Mamun, A.; Tazim, M.F.; Mozumder, M.M.H.; Parvej, M.R.; Shamsuzzaman, M.M. Stock assessment of six Sciaenidae species in the Bay of Bengal, Bangladesh water using a length-based Bayesian biomass (LBB) method. Fishes 2022, 7, 214. [Google Scholar] [CrossRef]
- Carvalho, F.; Lee, H.H.; Piner, K.R.; Kapur, M.; Clarke, S.C. Can the status of pelagic shark populations be determined using simple fishery indicators? Biol. Conserv. 2018, 228, 195–204. [Google Scholar] [CrossRef]
- Hasegawa, S.; Nagasawa, T.; Watanabe, M. Investigation of the migration and distribution patterns of common mackerel, Scomber japonicus, as viewed from tagging experiments. Bull. Jpn. Sea Nat. Fish. Res. Inst. 1991, 41, 1–10. [Google Scholar]
- Ohshimo, S.; Hiraoka, Y.; Suyama, S.; Tsuji, T.; Yukami, R.; Yasuda, T.; Ando, Y. Geographical differences in stable isotope ratios and fatty acid and lipid signatures of chub mackerel, Scomber japonicus, in waters around Japan. Bull. Mar. Sci. 2022, 98, 247–270. [Google Scholar] [CrossRef]
- Kamimura, Y.; Taga, M.; Yukami, R.; Watanabe, C.; Furuichi, S. Intra-and inter-specific density dependence of body condition, growth, and habitat temperature in chub mackerel (Scomber japonicus). ICES J. Mar. Sci. 2021, 78, 3254–3264. [Google Scholar] [CrossRef]
- Nishijima, S.; Yukami, R.; Oshima, K.; Ichinokawa, M. Re-analysis of Virtual Population Analysis and State-Space Assessment Model for Operating Models of Chub Mackerel Stock Assessment in NPFC. In Proceedings of the 4th Meeting of Technical Working Group on Chub Mackerel Stock Assessment, Tokyo, Japan, 22–25 June 2021. [Google Scholar]
- Miyagawa, M.; Ichinokawa, M.; Yoda, M.; Kurota, H.; Ohshimo, S.; Nishida, H. Commentary: Stock status assessments for 12 exploited fishery species in the Tsushima Warm Current Region, Southwest Japan and East China, using the CMSY and BSM methods. Front. Mar. Sci. 2021, 8, 703039. [Google Scholar] [CrossRef]
- National Research Institute of Fisheries Science (NRIFS). Stock Assessment of Chub Mackerel Pacific Stock. 2019. Available online: http://www.fra.affrc.go.jp/shigen_hyoka/peer_review/2019/assess_masaba_P.pdf (accessed on 27 November 2022).
- Jung, Y. A Bayesian state-space production model for Korean chub mackerel (Scomber japonicus) stock. Master’s Thesis, PukyongNational University, Busan, Republic of Korea, 2019. [Google Scholar]
- Wang, Y.; Liang, C.; Wang, Y.; Xian, W.; Palomares, M.L. Stock status assessments for 12 exploited fishery species in the Tsushima Warm Current Region, Southwest Japan and East China, using the CMSY and BSM methods. Front. Mar. Sci. 2020, 7, 640. [Google Scholar] [CrossRef]
- Park, Y.; Kwon, O. Optimal management of mackerel in Korea: A maximum entropy approach. Environ. Resour. Econ. Rev. 2019, 28, 277–306. [Google Scholar]
- North Pacific Fisheries Commission (NPFC). Sustainable Use and Conservation Handbook (Updated: 5 March 2021 and Coming into Force on 10 July 2021 Except Where Stipulated in the CMM). 2021. Available online: https://www.npfc.int/sustainable-use-and-conservation-handbook-0 (accessed on 28 November 2022).
- European Union (EU). Regulation (EU) 2017/2403 of the European Parliament and of the Council of 12 December 2017 on the Sustainable Management of External Fishing Fleets, and Repealing Council Regulation (EC) No 1006/2008. 2017. Available online: https://eur-lex.europa.eu/eli/reg/2017/2403/oj (accessed on 28 November 2022).
- Ministry of Government Legislation. Implementation Plan for the Establishment and Management of Total Allowable Catch from July 2022 to June 2023. Available online: www.law.go.kr (accessed on 28 November 2022).
- Free, C.M.; Jensen, O.P.; Anderson, S.C.; Gutierrez, N.L.; Kleisner, K.M.; Longo, C.; Minto, C.; Osio, G.C.; Walsh, J.C. Blood from a stone: Performance of catch-only methods in estimating stock biomass status. Fish. Res. 2020, 223, 105452. [Google Scholar] [CrossRef]
- Smith, D.C.; Haddon, M.; Punt, A.E.; Gardner, C.; Little, L.R.; Mayfield, S.; O’Neill, M.F.; Saunders, T.; Stewart, J.; Wise, B.; et al. Evaluating the potential for an increased and sustainable commercial fisheries production across multiple jurisdictions and diverse fisheries. Mar. Policy 2021, 124, 104353. [Google Scholar] [CrossRef]


| Resilience | -Range |
|---|---|
| High | 0.6–1.5 |
| Medium | 0.2–0.8 |
| Low | 0.05–0.5 |
| Very low | 0.015–0.1 |
| Stock Status | |
|---|---|
| Healthy | ≥1 |
| Slightly overfished | 0.8–1.0 |
| Overfished | 0.5–0.8 |
| Grossly overfished | 0.2–0.5 |
| Collapsed | <0.2 |
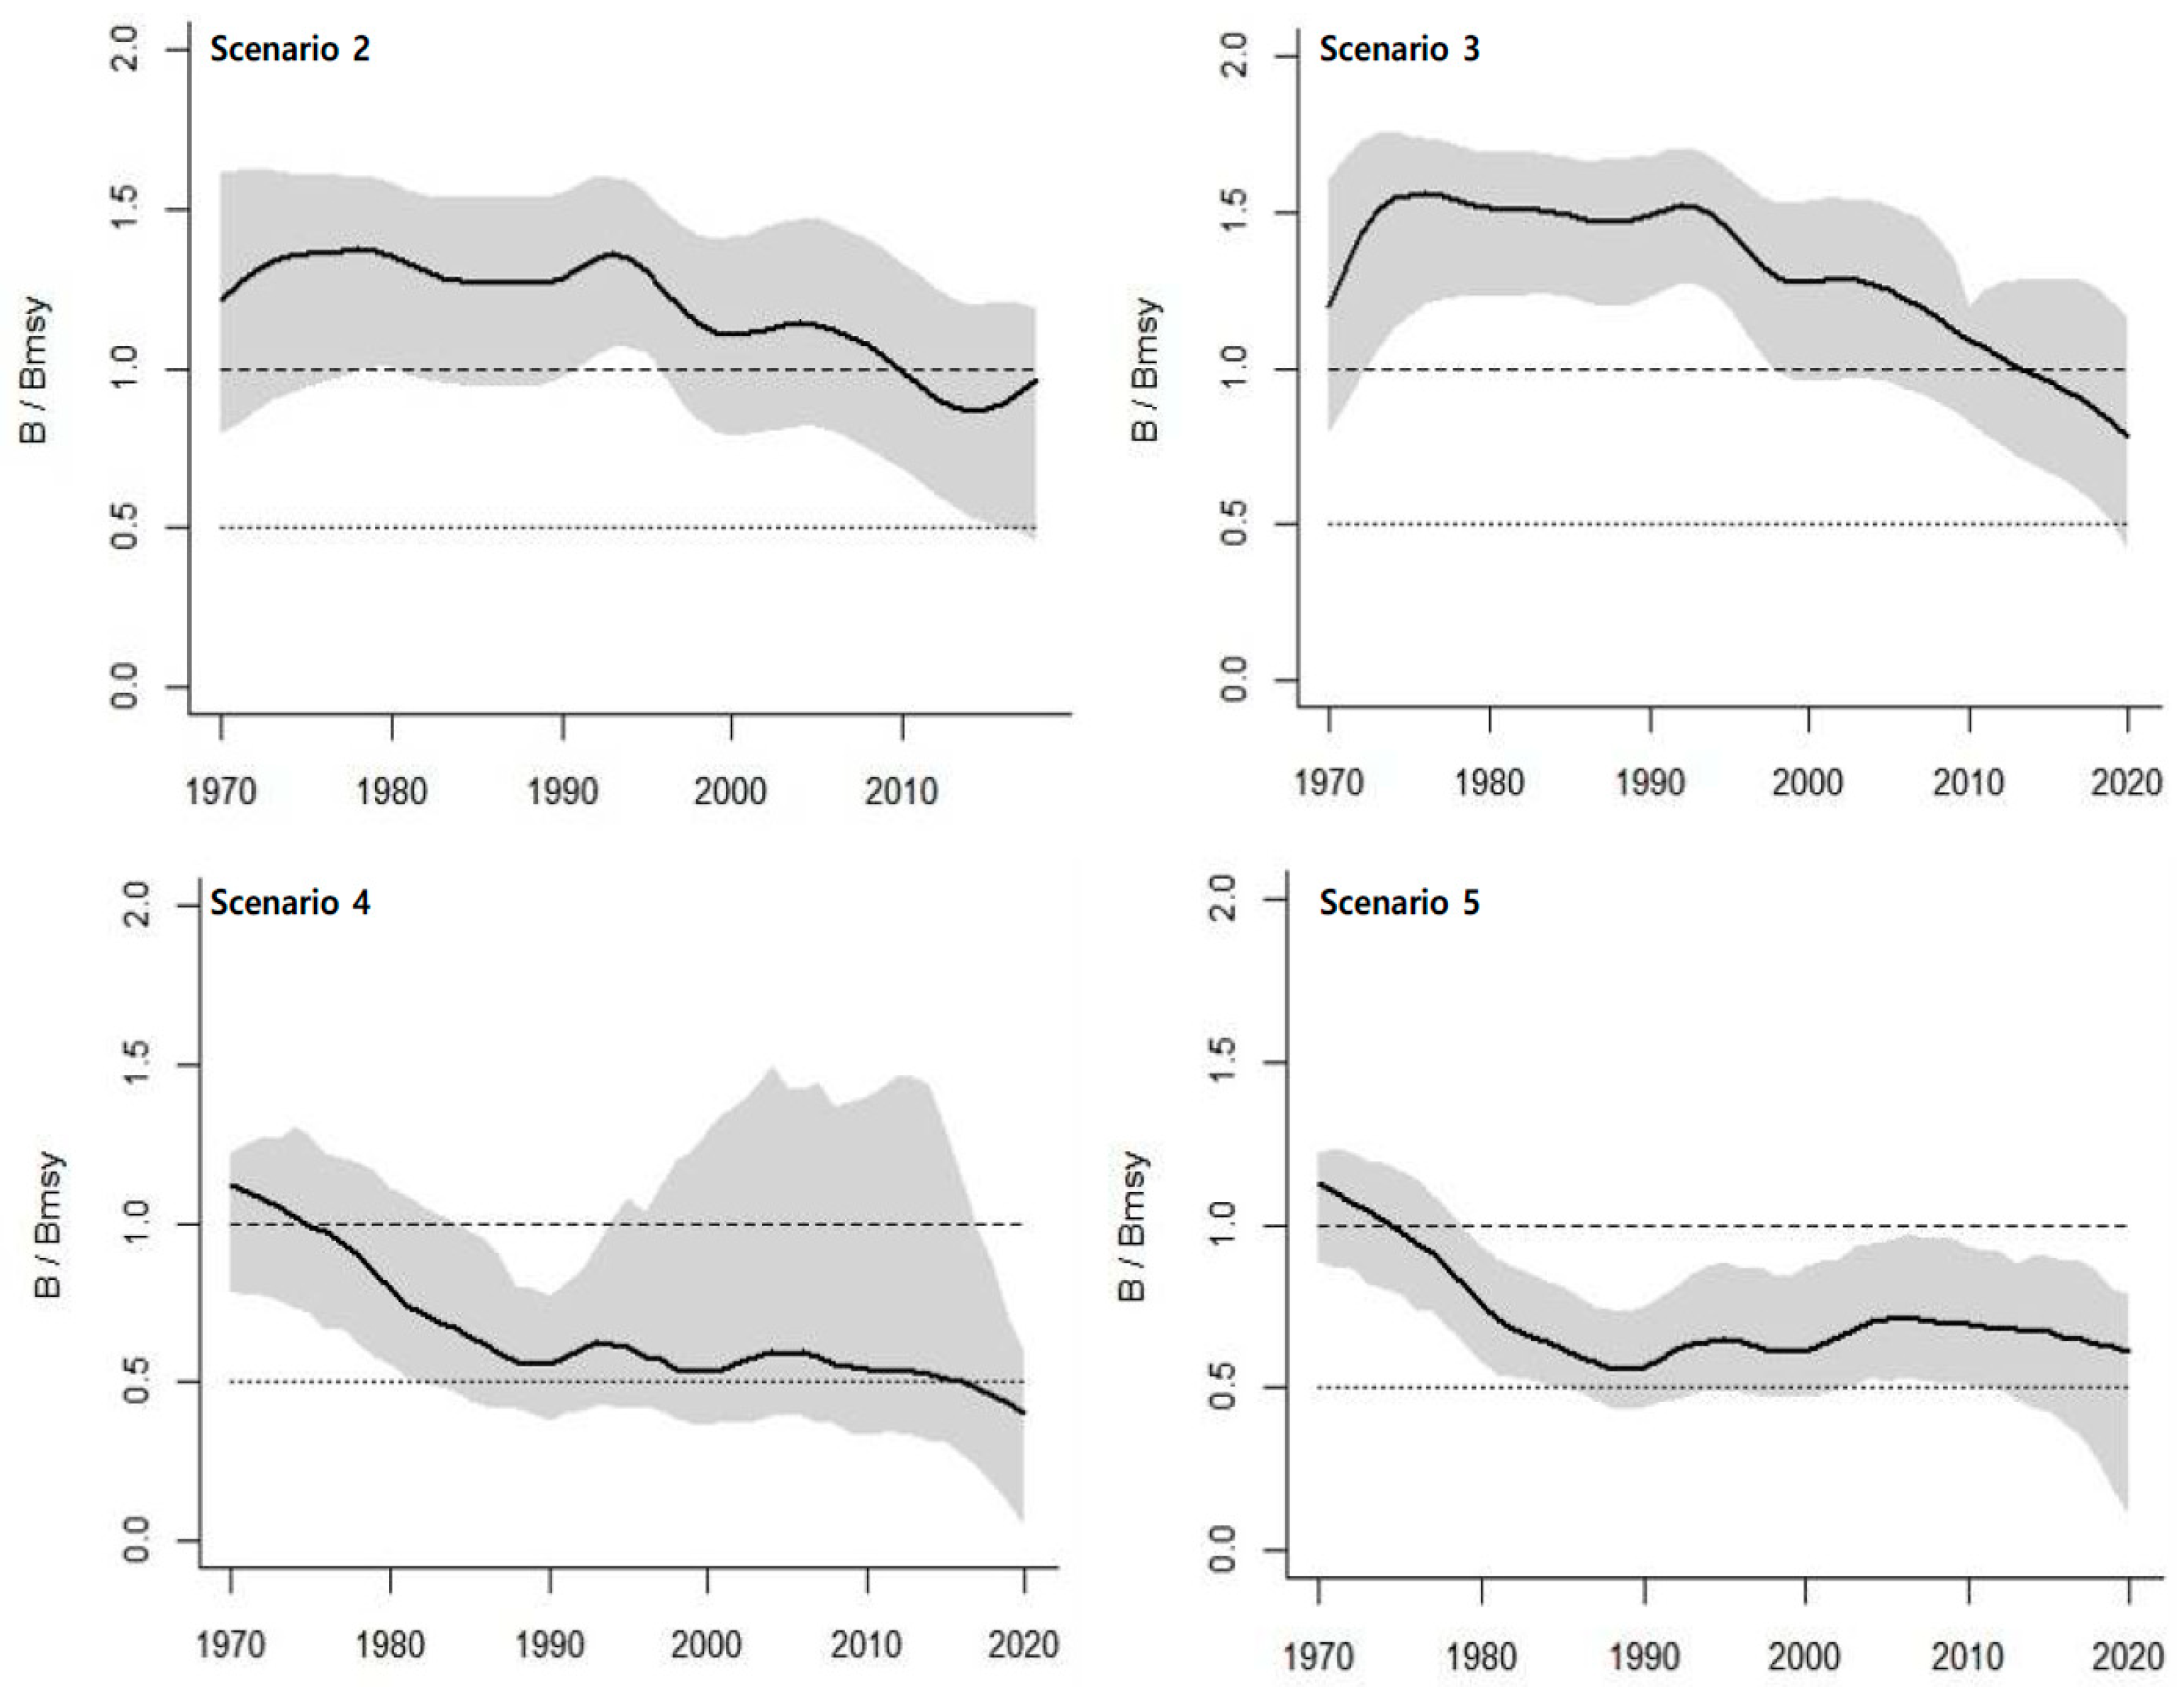
| Scenario | Summary |
|---|---|
| Scenario 1 | Base case |
| Scenario 2 | Base case minus catches in the Pacific region |
| Scenario 3 | Base case minus Japan catches |
| Scenario 4 | Base case minus China catches |
| Scenario 5 | Base case minus South Korea catches |
| Nation | Data Period | Maximum and Minimum Catches | Five-Year Average Catches (2016–2020) |
|---|---|---|---|
| Japan | 1970–2020 | Maximum: 1,625,753 tons (1978) Minimum: 253,991 tons (1991) | 477,854 tons (41.1%) |
| China | 1970–2020 | Maximum: 592,637 tons (2008) Minimum: 36,600 tons (1971) | 439,532 tons (37.8%) |
| South Korea | 1970–2020 | Maximum: 415,003 tons (1996) Minimum: 38,300 tons (1970) | 111,424 tons (9.5%) |
| Taiwan | 1970–2020 | Maximum: 98,604 tons (2018) Minimum: 3137 tons (1974) | 69,747 tons (6.0%) |
| Russia * | 1970–1990, 2001, 2003, 2005, 2012, 2014–2020 | Maximum: 266,290 tons (1986) Minimum: 1 ton (2001) | 65,004 tons (5.6%) |
| Total | Maximum: 2,238,781 tons (1978) Minimum: 611,744 tons (1990) | 1,163,561 tons (100.0%) | |
| Scenario | Data |
|---|---|
| Scenario 1 | Northwest Pacific (1970–2020) |
| Scenario 2 | Northwest Pacific without Pacific (1970–2018) |
| Scenario 3 | Northwest Pacific without Japan (1970–2020) |
| Scenario 4 | Northwest Pacific without China (1970–2020) |
| Scenario 5 | Northwest Pacific without South Korea (1970–2020) |
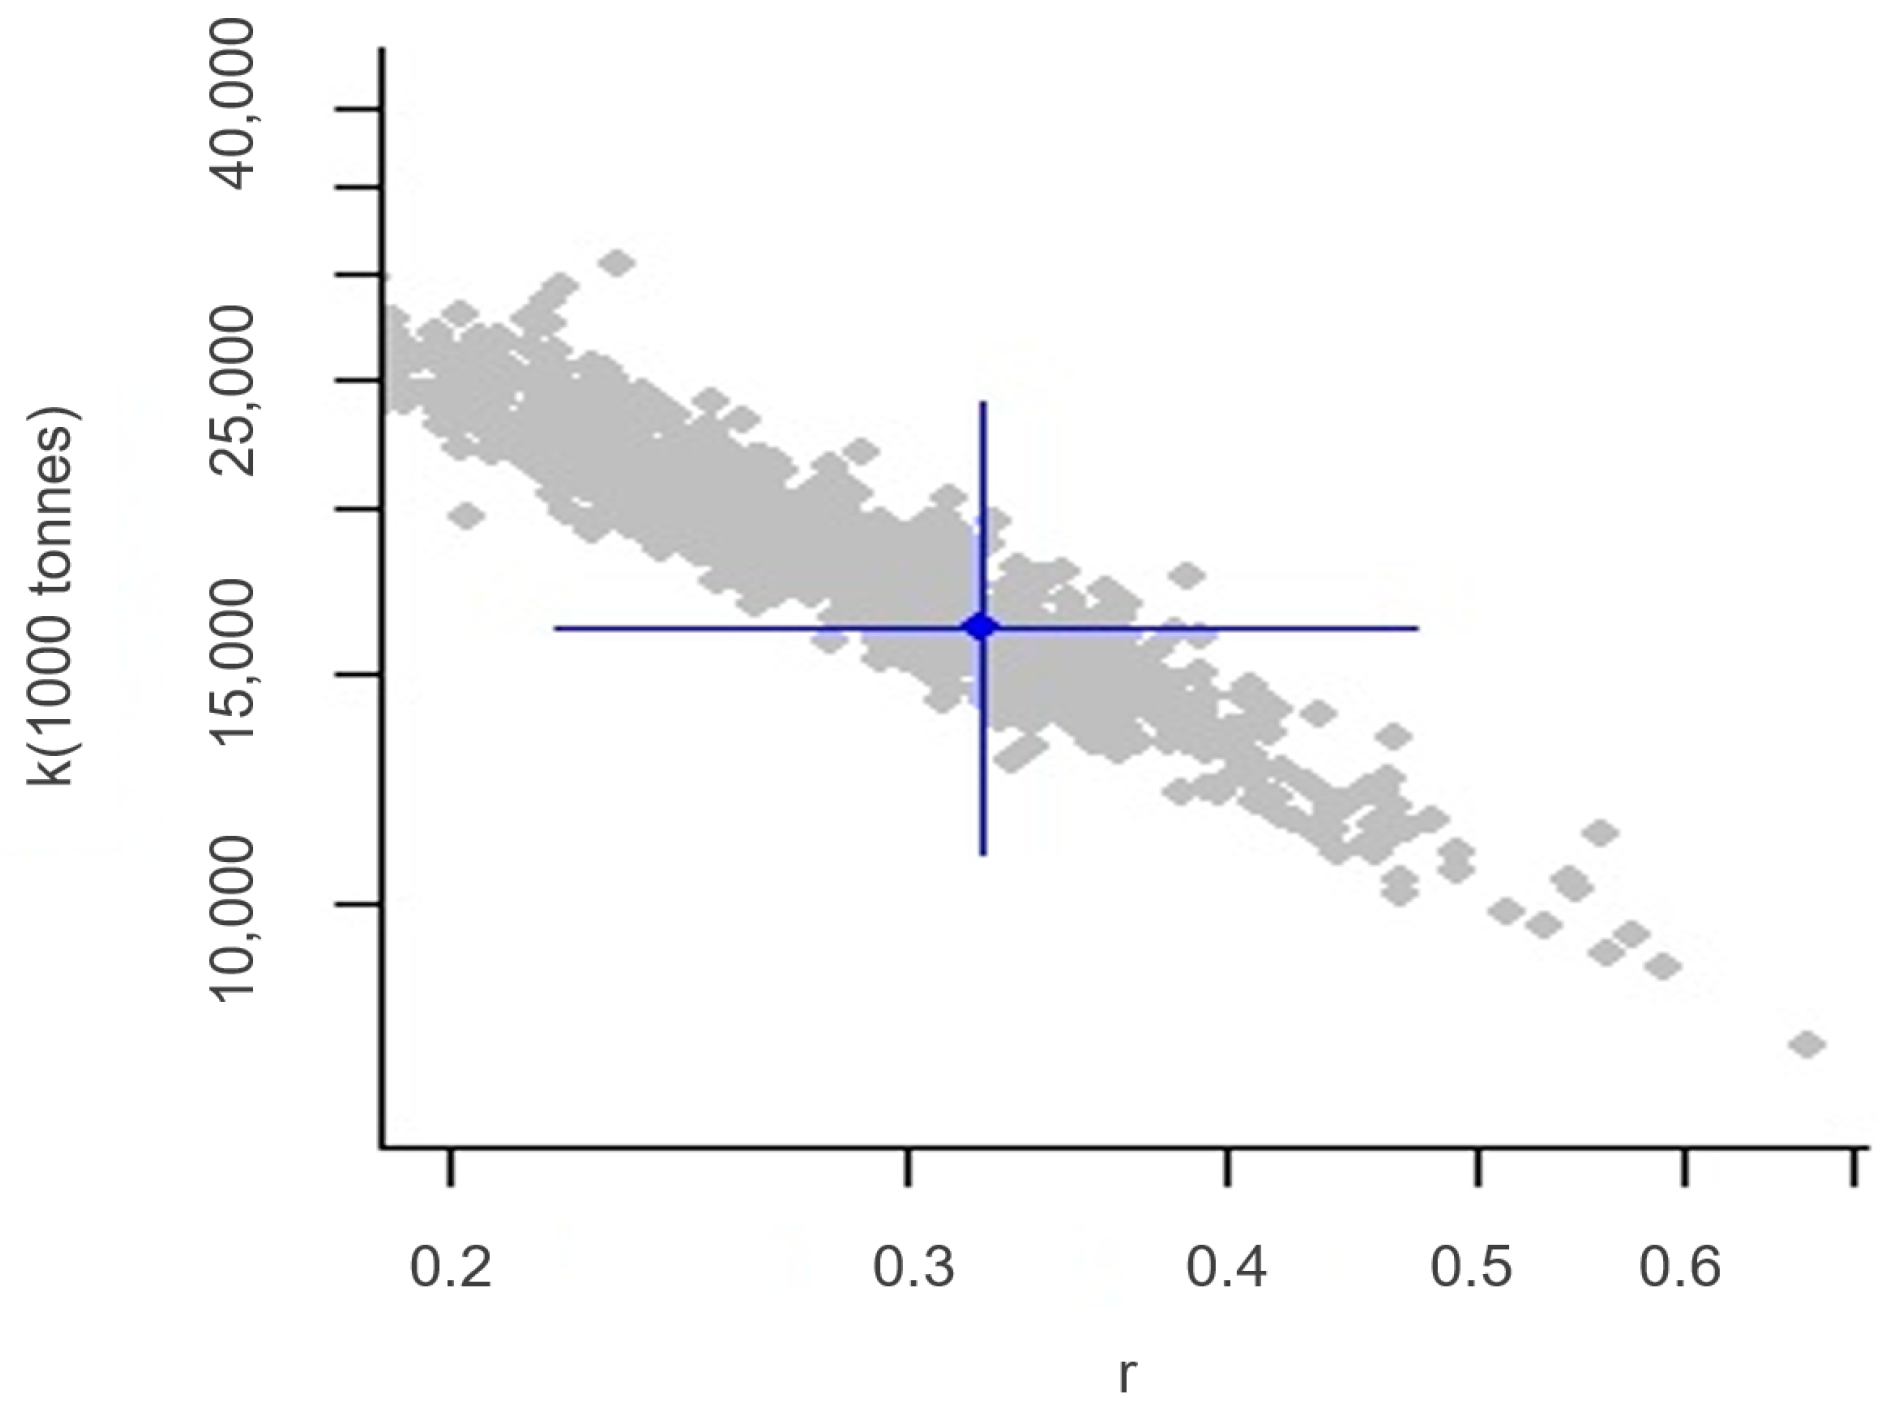
| Classification | Median | 95% Confidence Intervals |
|---|---|---|
| 0.32 | 0.22–0.47 | |
| 16,264,802 tons | 10,983,651–24,085,231 tons | |
| 1,294,320 tons | 1,144,003–1,499,941 tons |
| Classification | Median | Range of 95% Confidence Interval |
|---|---|---|
| 4,871,919 tons | 601,037–6,446,315 tons | |
| 8,132,401 tons | 5,491,825–12,042,616 tons | |
| 0.60 | 0.07–0.79 | |
| Stock State | (Overfished) | (Collapsed–Overfished) |
Disclaimer/Publisher’s Note: The statements, opinions and data contained in all publications are solely those of the individual author(s) and contributor(s) and not of MDPI and/or the editor(s). MDPI and/or the editor(s) disclaim responsibility for any injury to people or property resulting from any ideas, methods, instructions or products referred to in the content. |
© 2022 by the authors. Licensee MDPI, Basel, Switzerland. This article is an open access article distributed under the terms and conditions of the Creative Commons Attribution (CC BY) license (https://creativecommons.org/licenses/by/4.0/).
Share and Cite
Hong, J.-B.; Kim, D.-Y.; Kim, D.-H. Stock Assessment of Chub Mackerel (Scomber japonicus) in the Northwest Pacific Ocean Based on Catch and Resilience Data. Sustainability 2023, 15, 358. https://doi.org/10.3390/su15010358
Hong J-B, Kim D-Y, Kim D-H. Stock Assessment of Chub Mackerel (Scomber japonicus) in the Northwest Pacific Ocean Based on Catch and Resilience Data. Sustainability. 2023; 15(1):358. https://doi.org/10.3390/su15010358
Chicago/Turabian StyleHong, Jae-Beum, Dae-Young Kim, and Do-Hoon Kim. 2023. "Stock Assessment of Chub Mackerel (Scomber japonicus) in the Northwest Pacific Ocean Based on Catch and Resilience Data" Sustainability 15, no. 1: 358. https://doi.org/10.3390/su15010358