Article

Identifying a Period of Spatial Land Use Conflicts and Their Driving Forces in the Pearl River Delta

1
Academy of Land Resource and Environment, Jiangxi Agricultural University, Nanchang 330045, China
2
Key Laboratory of Poyang Lake Watershed Agricultural Resources and Ecology of Jiangxi Province, Nanchang 330045, China
*
Author to whom correspondence should be addressed.
Sustainability 2023, 15(1), 392; https://doi.org/10.3390/su15010392
Submission received: 31 October 2022 / Revised: 22 December 2022 / Accepted: 23 December 2022 / Published: 26 December 2022

Abstract

:
Spatial land use conflicts (SLUCs) are a critical issue worldwide due to the scarcity of land resources and diversified human demand. Despite many time-series studies of SLUCs, comprehensive research on SLUCs and their driving factors over a long period remain limited. This study was conducted in the Pearl River Delta urban agglomeration, Guangdong Province, China. We constructed a landscape ecological risk assessment model to calculate annual SLUC values and analyze their spatiotemporal distribution over 30 years. K-means clustering analysis was used to cluster SLUC values for 1990–2005 and 2006–2020, yielding comprehensive conflict intensity data for each period. The major factors driving the spatial differentiation of SLUCs and their interactions in each period were identified using an optimal parameter-based geographical detector model. The results show that SLUCs varied significantly over time, with an overall decreasing trend and distinct spatial heterogeneity. Comprehensive conflict intensity for each period was characterized by low values in the peripheral regions and high values in central parts of the study area, which tended to decrease from 1990–2005 to 2006–2020. SLUCs were heavily dependent on topographical (slope and elevation) and environmental (normalized difference vegetation index) factors. Socio-economic factors (gross domestic product and population density) were also major contributors to the spatial differentiation of SLUCs. The explanatory power of multiple interacting factors on SLUCs was enhanced compared with that of individual factors. The explanatory power of the driving factors varied, and their interactions decreased over time. The results may facilitate the rational government planning of regional land use and thus effectively mitigate SLUC intensity at the macro level.

1. Introduction

Rapid economic development and increasing urbanization levels improve human wellbeing, albeit at the cost of disorderly urban expansion and reduced ecological land use. In particular, urban sprawl and diversified human demand for land resources increase the tension of scarce land resources and cause an imbalance in the land use structure [1,2]. This imbalance is manifested in spatial land use conflicts (SLUCs) caused by competition between land users for the use rights and ownership of limited land resources for their own purposes. The consequences caused by SLUCs include the inhibition of regional economic and industrial development, increasing ecological problems (e.g., biodiversity decline, environmental pollution, and soil degradation), and negative impacts on social stability [3,4]. Therefore, exploring the spatiotemporal dynamics, levels, and drivers of SLUCs is crucial for optimizing the allocation of land resources and balancing the pressure of spatial conflicts at the regional scale.
SLUCs are a global phenomenon with profound impacts on economic, ecological, and social benefits [5]. Research conducted from different perspectives of SLUCs has developed rapidly and yielded fruitful results. Available studies include theoretical analysis [6,7], conflict identification and characterization [8,9], conflict evolution and driving mechanisms [10,11], and conflict trade-offs [12,13]. Considerable effort has been expended on identifying SLUCs, with most methods based on qualitative and quantitative analyses. There are three main qualitative analysis methods: participatory rural appraisal [14,15], logical framework analysis [16], and game theory analysis [17,18]. Quantitative analysis methods mainly include landscape pattern analysis [1,19], pressure–state–response conflict models [20], multi-criteria evaluation [14,21], suitability evaluation models [22,23], and regression analysis [24].
Among quantitative analysis methods, landscape pattern analysis models mainly use landscape indicators (area-weighted mean patch fractal dimension (AWMPFD) and patch density (PD)), which are effective tools to understand and analyze the pattern–process relationship [25,26] to measure SLUCs. Such models have been widely used because they can identify conflict locations. Previous studies [1,19,27] indicate that landscape pattern analysis models can effectively describe interactions and reciprocal feedback mechanisms among landscape pattern elements. They can also reveal regional ecological risks (ecological process changes and biodiversity loss) caused by unreasonable land use activities. Consequently, these models can effectively assess various ecological impacts and their cumulative consequences, including systematic and holistic characteristics. Many previous studies have focused on the macro scale within countries [8,28], urban agglomerations [29], and cities [30], but there have been few studies on the micro scale within regions. Research objects mainly include urban land use, ecological land use, land ownership, man–land relationships, and land use functions.
Despite substantial progress, there remain limitations regarding SLUC identification. Different land use patterns and intensity changes inevitably cause variation in landscape spatial patterns. This is believed to be the result of land use conflicts in spatial structures and is further manifested by dramatic spatiotemporal differentiation in land use conflicts [1,31,32]. When exploring land use conflict evolution, many studies have analyzed data from consecutive or intermittent years. Although such results can partly reflect the conflict evolution process, subtle changes in land use conflicts at adjacent timepoints cannot comprehensively represent conflict changes over a long period. Therefore, it is necessary to synthesize information from SLUCs over a long period in order to better understand their spatiotemporal dynamics.
SLUCs are not static processes but rather function at temporal and spatial scales. In the face of land use type changes, consequences such as ecological degradation, habitat fragmentation, and land use structure imbalance cannot be manifested over a short time, but these impacts can be measured in subsequent years [33,34]. Clustering analysis is a statistical method for comprehensive classification according to the similarity of objects. K-means clustering is a mature algorithm that can effectively support the synthesis of SLUC information over a long period [35]. Therefore, this method can be used to evaluate the impact of human–land incoordination on the surrounding environment.
Deciphering the intrinsic mechanisms driving SLUCs is a prerequisite for addressing the conflicts. The quantitative methods used for identifying the factors driving land use conflicts mainly include spatial econometric models, spatial regression (multiple linear regression, spatial autoregression, and geographically weighted regression), and gray correlation analysis [28,36,37]. However, SLUCs are a complex geographical and social phenomenon driven by diverse factors with mutual interactions. The traditional quantitative methods are either inadequate for measuring the spatial heterogeneity of factors driving SLUCs or unable to quantify the interactions of the influencing factors. To address both limitations, an appropriate quantitative method must be employed.
Geographical detectors are widely used to measure spatial heterogeneity and identify its major driving factors. They can effectively quantify interactions of influencing factors and are compatible for both qualitative and quantitative data [38]. It should be noted that geographical detectors have strong subjectivity for determining spatial data discretization and spatial scale effects. To implement more efficient, accurate, and flexible spatial analysis, optimal parameter-based detection of spatial data discretization, spatial correlation, and spatial scale parameters is integrated into geographical detectors [39]. Moreover, the growing body of research on SLUCs facilitates the study of comprehensive conflicts over a long period.
China is undergoing rapid urbanization and economic development, while simultaneously attempting to promote coordinated social and environmental development [32,40]. Urban agglomerations are an essential source of growth for the Chinese economy, and SLUCs are a great concern in different fields [31,40,41]. The Pearl River Delta (PRD) urban agglomeration is one of the regions with the fastest economic growth and the greatest vitality in China. In the near future, this region will experience tremendous pressure from both intensified land use competition and an imbalance in land use types.
The aim of the present study was to identify SLUCs in the PRD urban agglomeration, analyze their spatial distribution, quantify the conflict levels, and explore the driving factors. A landscape ecological risk assessment model was applied to identify land use conflicts in the study area and analyze their spatial distribution patterns. The comprehensive conflict intensity in 1990–2005 and 2006–2020 was analyzed using K-means clustering. Based on an optimal parameter-based geographical detector (OPGD) model, the factors influencing land use conflicts and their interactions were determined from five perspectives (topography, climate, socio-economics, environment, and location). The findings illuminate the current status of SLUCs and could help to regulate conflicts, attenuate human–land incoordination, and thereby build a more environmentally friendly and resource-efficient society.

2. Materials and Methods
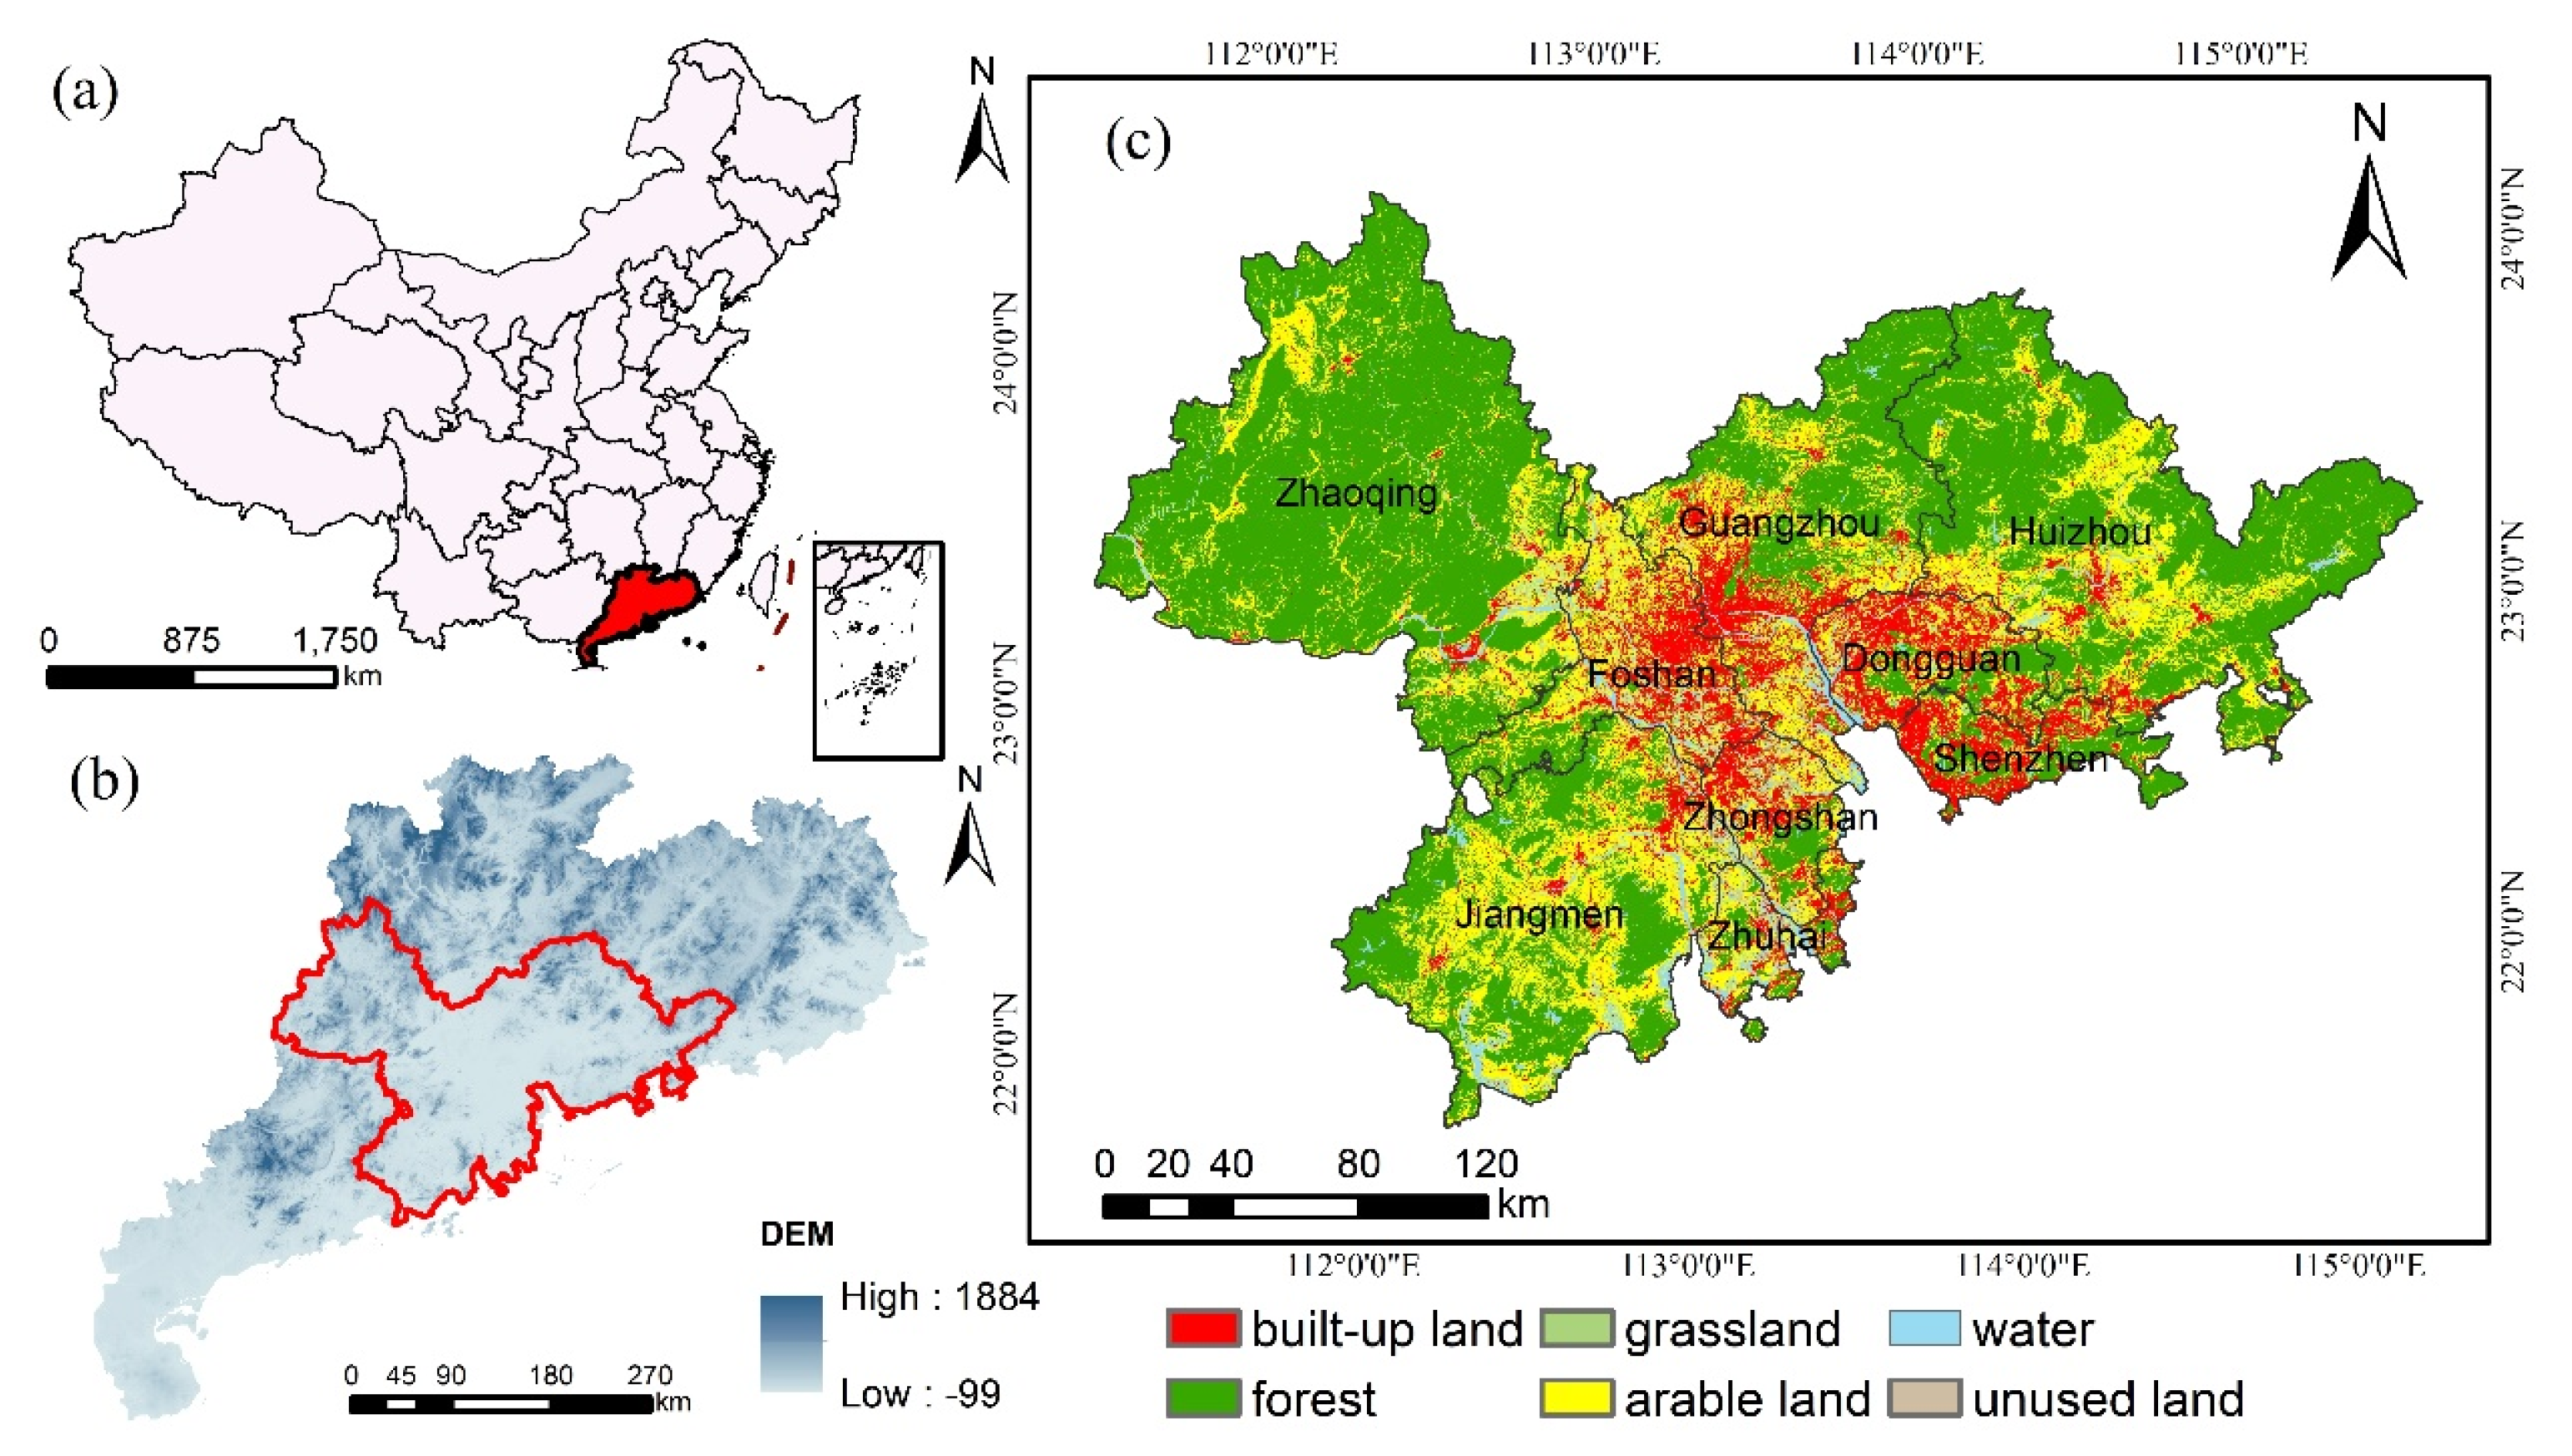
2.1. Study Area

The PRD (21°31–23°10′ N, 112°45′–113°50′ E) is located in the central southern part of Guangdong Province, China. This region borders the South China Sea and is adjacent to Hong Kong and Macao (Figure 1). It includes nine cities, with Guangzhou and Shenzhen known as the “Southern Gate” of China. Islands in the study area were not considered.
The PRD was a famous fish and rice town dominated by agriculture and aquaculture. However, since reform and opening up, this region has experienced rapid socio-economic development, with industrialization and urban–rural integration progressing far ahead of the rest of the country. Its total gross domestic product (GDP) was 8.95 trillion in 2020, accounting for ~80% of GDP for Guangdong and 8.81% of the national total.
Urban agglomeration in the PRD has played a pivotal role in China’s socio-economic development in recent decades. However, this rapid economic development has inevitably caused over-expansion of urban built-up land and fierce competition between various land use types. These problems further aggravate land use conflicts at both temporal and spatial scales.

2.2. Data Sources and Processing
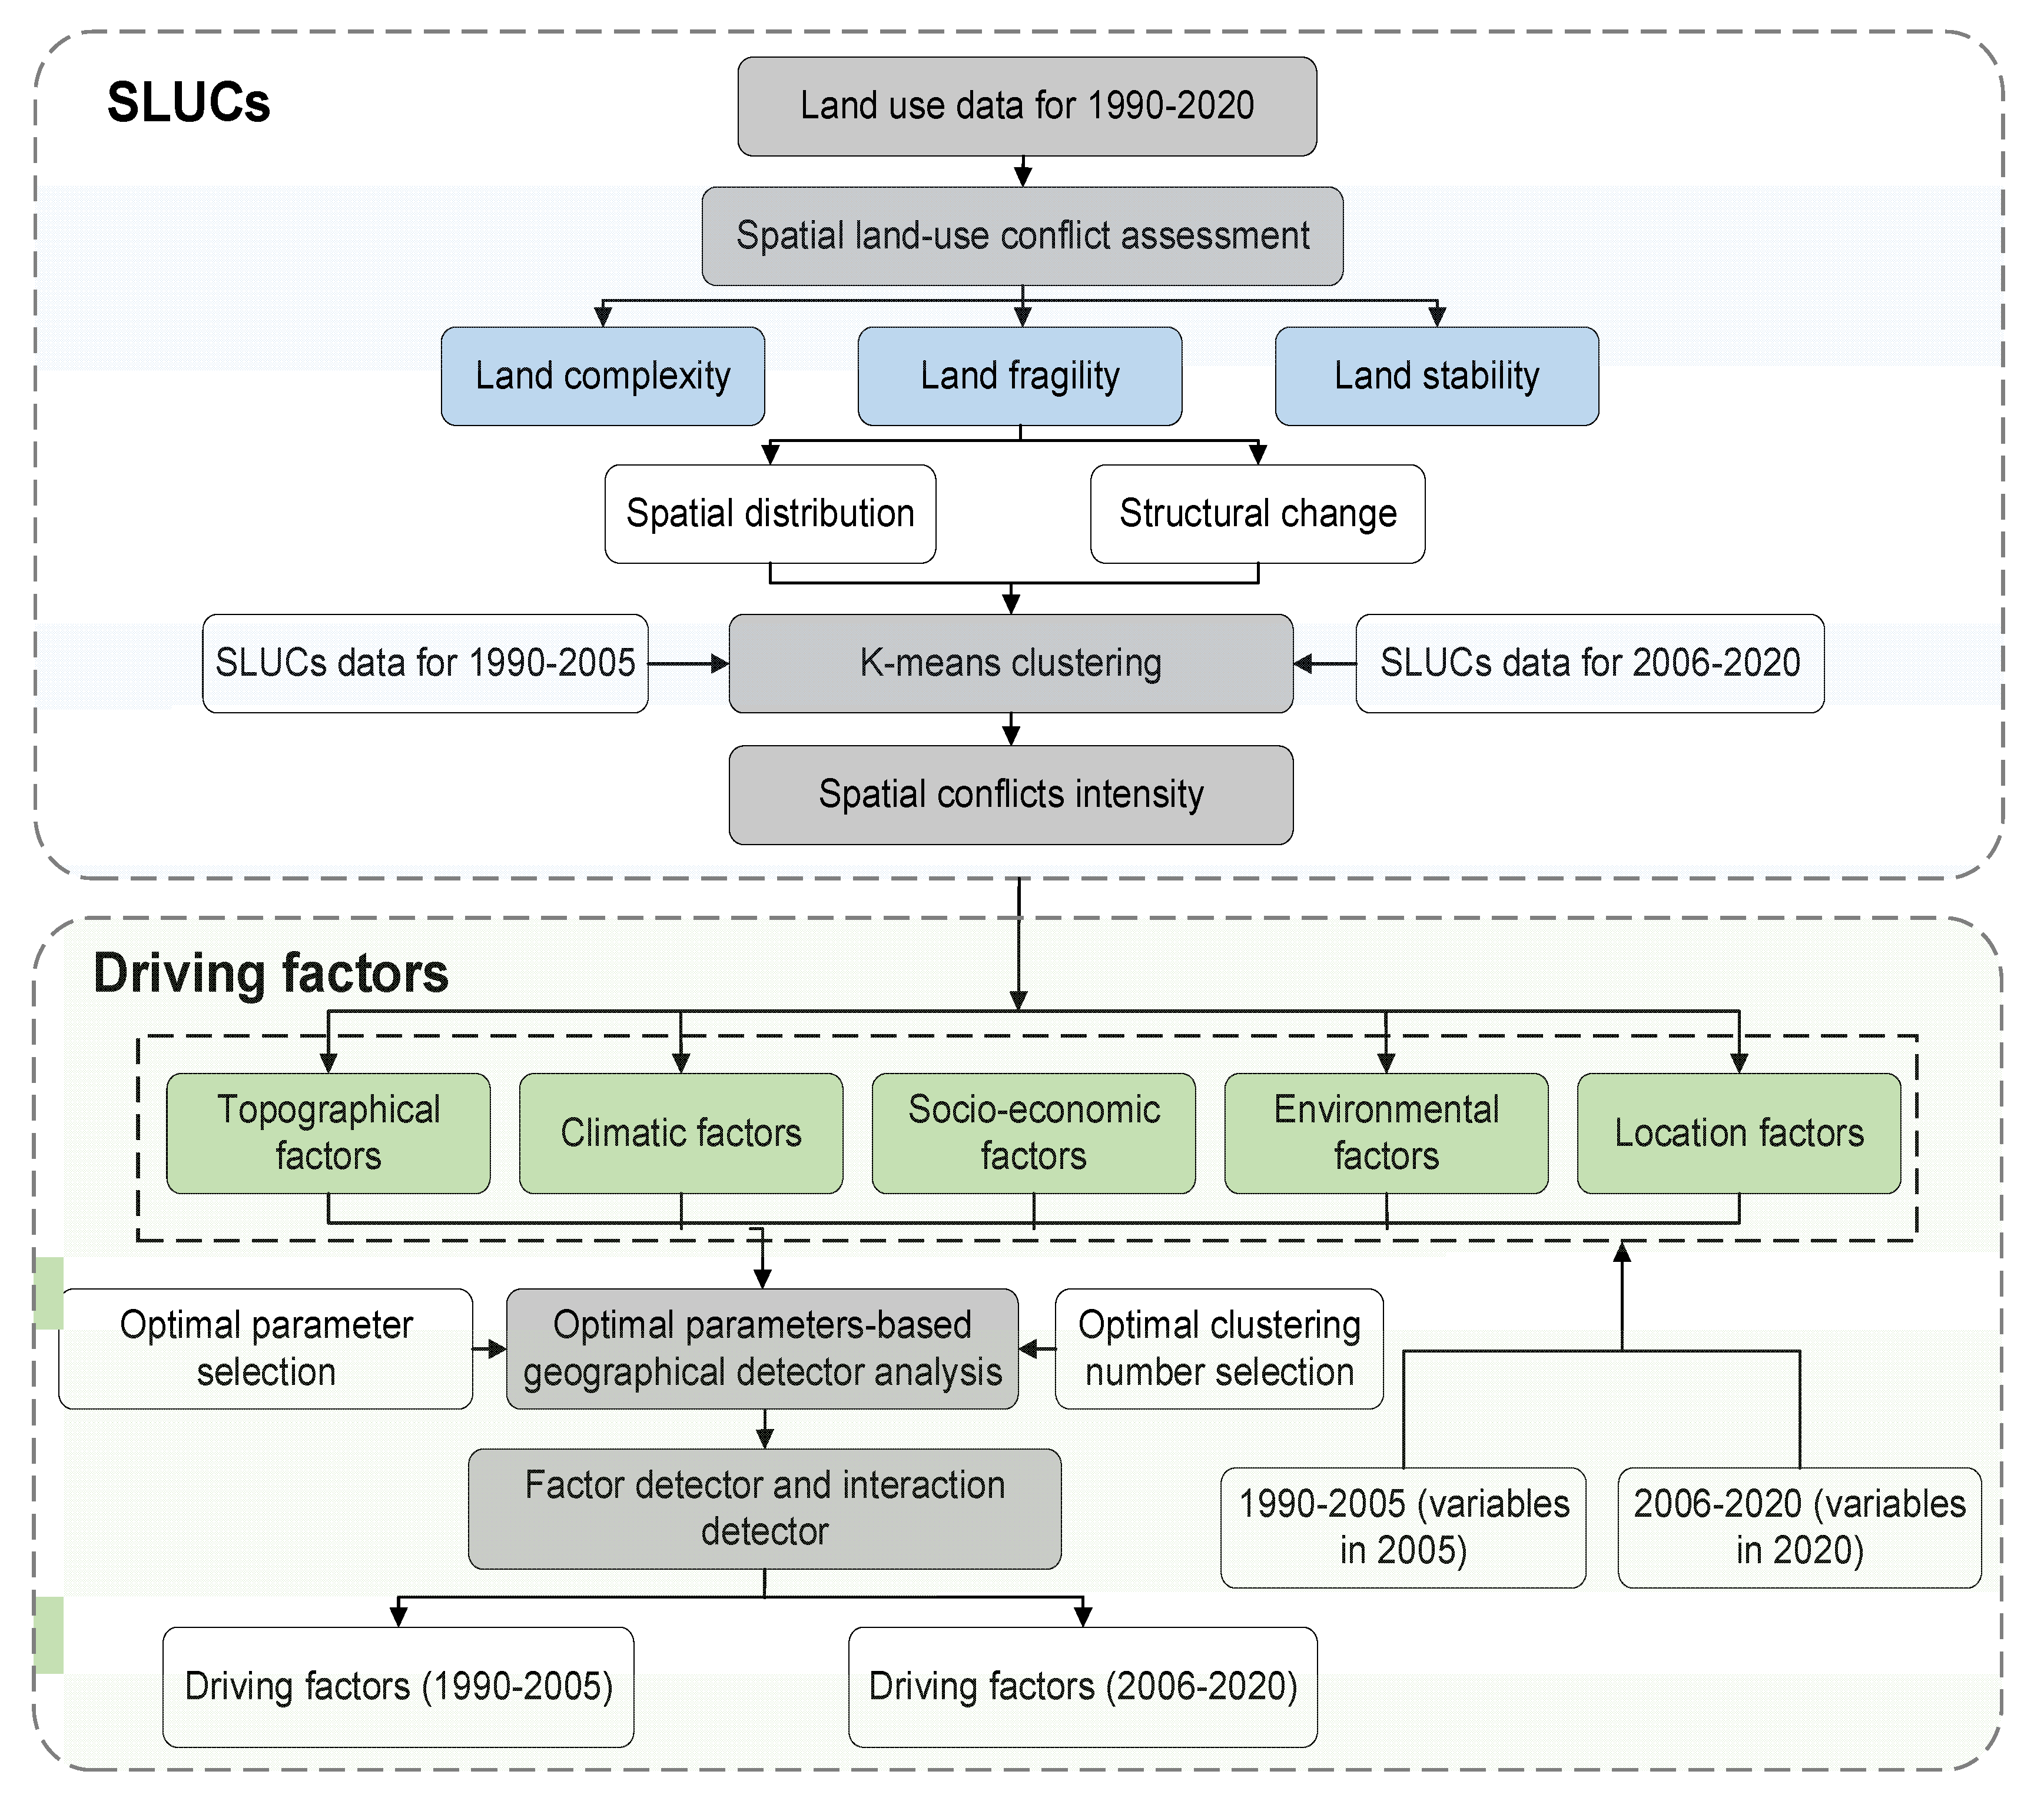
Land use data (1990–2020) were derived from the annual China Land Cover Dataset (http://doi.org/10.5281/zenodo.4417809) (accessed on 15 May 2022) [21]. Land use types were classified into six categories: arable land, forest, grassland, water, built-up land, and unused land (Figure 1), with a spatial resolution of 30 m × 30 m.
A total of 12 factors driving spatial differentiation of SLUCs were selected based on the actual study area combined with previous studies [13,19,27,42,43]. These factors were classified into five categories (Table 1). (1) Topographical factors: slope and elevation were extracted from NASADEM data released by the National Aeronautics and Space Administration (NASA, Washington, DC, USA). (2) Climatic factors: average annual temperature and precipitation were calculated using ArcGIS v10.2 (ESRI Inc., Redlands, CA, USA), and mask extraction was performed to obtain climatic data for the study area. (3) Socio-economic factors: GDP and population density data were retrieved from the Resource and Environmental Science Data Center, Chinese Academy of Sciences (Beijing, China). (4) Environmental factors: normalized difference vegetation index (NDVI) data were obtained using mask extraction with ArcGIS v10.2. (5) Location factors: distance to rivers, urban centers, major roads, railroads, and nature reserves were calculated based on Euclidean distance using ArcGIS v10.2 (5).

2.3. Methods

Taking the PRD urban agglomeration as an example, we explored SLUCs and their driving mechanisms at the regional scale. Firstly, a landscape ecological risk assessment model was used to identify land use conflicts and analyze their spatial distribution and changes; secondly, we divided the study period into two phases, 1990–2005 and 2006–2020, and K-means clustering analysis was performed to explore the comprehensive conflict intensity in each phase; finally, the major driving factors and their interactions underpinning the spatial differentiation of SLUCs in each phase were determined using an OPGD model. The research framework is shown in Figure 2.

2.3.1. Land Use Conflict Model

Human activities and natural geographical processes lead to imbalance of land use structure and changes in regional spatial structure. These problems manifest as SLUCs caused by competition for land, a core resource element, among land users. In general, in areas with a high level of SLUCs, land resources bear low pressure from conflicts and high pressure from human demands, while land use patterns strongly influence the attributes of land resources. Therefore, according to previous studies and ecological risk assessments, we selected land complexity index (risk sources), land fragility index (risk receptors), and land stability index (risk effects) to quantify land use conflicts [8,45,46]. The mathematical expression of the land use conflict model is as follows:
S L U C I c o m = L U C I + L U F I L U S I
where S L U C I c o m is the comprehensive SLUC index; and L U C I , L U F I , and L U S I are land complexity, fragility, and stability indices, respectively.
(1)
Land use complexity index ( L U C I )
AWMPFD was selected as L U C I to represent the external pressure, describe the complexity of landscape patches, and characterize the influence of spatial neighborhood patches on current land use. L U C I is expressed as follows:
L U C I = A W M P F D = i = 1 m j = 1 n [ 2 ln ( 0.25 P i j ) ln a i j ( a i j A ) ]
where P i j is the patch perimeter (km); a i j is the landscape patch area (km2); m is the number of spatial types; n is the number of landscape patches; and A is the total area of landscape (km2). In general, A W M P F D indicates the impact of human activities on the spatial pattern of the landscape; a lower A W M P F D value implies a higher intensity of human activities.
(2)
Land use fragility index ( L U F I )
L U F I primarily reflects the ability of landscape patches to withstand external disturbances; a lower value indicates a greater ability to endure external disturbances, and, consequently, lower intensity of land use conflicts. L U F I is expressed as follows:
L U F I = i = 1 n F i × a i A
where F i is the landscape fragility index of land use type i ; A is the area of the moving window (km2); n is the number of landscape patches; and a i is the area of landscape type i (km2). Based on land use changes in the study area combined with previous studies [1,19,27,41], the fragility indices of built-up land, forest, grassland, arable land, water, and unused land were assigned as 1, 2, 3, 4, 5, and 6, respectively.
(3)
Land use stability index ( L U S I )
L U S I characterizes the stability of each landscape, which is embodied in the evolution of landscape patches during human activities and natural geographic processes. PD indicates the level of landscape fragmentation in a region; a larger PD value reflects a more fragmented landscape and more intense land use conflicts. L U S I is expressed as follows:
L U S I = 1 P D = 1 n i A
where n i is the number of landscape patches in land use type i , and A is the area of the moving window (km2). A greater PD value signifies lower landscape stability in a region.
The landscape pattern is highly sensitive to landscape scale [28]. Considering the study scale, amount of data, scale effect, and analysis accuracy, we selected a 30 m × 30 m grid as the cell size for all raster data and set 2.5 km × 2.5 km as the moving window. To facilitate cross-sectional comparison of conflict values over time, we used a global normalization method to normalize S L U C I c o m values with the range of 0–1. Land use conflicts were then classified into four levels: stably controllable (0,0.25], relatively controllable (0.25,0.5], relatively uncontrollable (0.5,0.75], and severely uncontrollable (0.75,1.0], according to equal-interval classification.

2.3.2. K-Means Clustering Analysis

The comprehensive SLUC index results were used for clustering analysis. K-means clustering analysis is widely used for data classification, which determines the similarity of data objects mainly based on Euclidean distance. A closer distance between two objects indicates a greater similarity between objects, which are more likely to be grouped into one cluster [35]. As different K-values lead to varied clustering effects, it is necessary to determine appropriate K-values before clustering analysis.
We set 6, 8, and 10 clusters according to research needs. Specifically, 16 conflicting grids from 1990–2005 and 15 conflicting grids from 2006–2020 were each submitted as a stack to a migrating mean clustering algorithm [47], generating statistical data for 6, 8, and 10 clusters. Cluster statistical data were generated from a 10% sample of 84,717,327 pixels through 300 iterations. A maximum likelihood classifier [48] was used to classify the conflicting grids, and grids containing 6, 8, and 10 clusters were obtained, respectively.

2.3.3. OPGD Model

Geographical detector is a spatial analysis model that probes the relationship between dependent and independent variables based on spatial heterogeneity [39,49,50]. However, geographical detector is influenced by human factors, leading to strong subjectivity in the results. Therefore, we selected an OPGD model [38] to analyze the driving factors of land use conflicts in the study area.
(1) Optimal parameter selection: When using a geographical detector, a key step is to determine the optimal parameters for spatial discretization and spatial scale. A greater q-value for geographical detector reflects better classification performance, stronger spatial differentiation of land use conflicts, and greater explanatory power of the driving factor. The discretization method was determined by equal breaks, natural breaks, quantile breaks, and geometric breaks, and the number of clusters was set from 3 to 8. The OPGD model was spatially discretized according to the parameter combination with the highest q-values to explore the spatial heterogeneity of land use conflicts and the explanatory power of the driving factors.
(2) Factor detector: Factor detectors can predict the influence of independent variables on dependent variables [51]. The degree of influence is measured by q, which can be calculated as follows:
q S L U C s = 1 h = 1 L N h σ h 2 N σ 2
where q S L U C s is the influence of a driving factor on the spatial heterogeneity of SLUCs; q = (0,1); h is the cluster of the driving factor; N h and N are the number of cells in cluster h and the whole region, respectively; and σ h 2 and σ 2 are the variance of SLUCs in cluster h and the region, respectively.
(3) Interactive detector: This detector was used to probe the interactions of driving factors, including nonlinear-weaken, uni-weaken, bi-enhance, independent, and nonlinear-enhance [51]. Specifically, the q-value of post-clustering of comprehensive SLUCs was calculated for a single driving factor, and the q-value of superimposed comprehensive SLUCs was calculated for two driving factors. The two q-values were then compared to determine the interaction between the two factors in order to explain whether this interaction exacerbates or diminishes the explanatory power for SLUCs. This method has been described previously [52].

3. Results

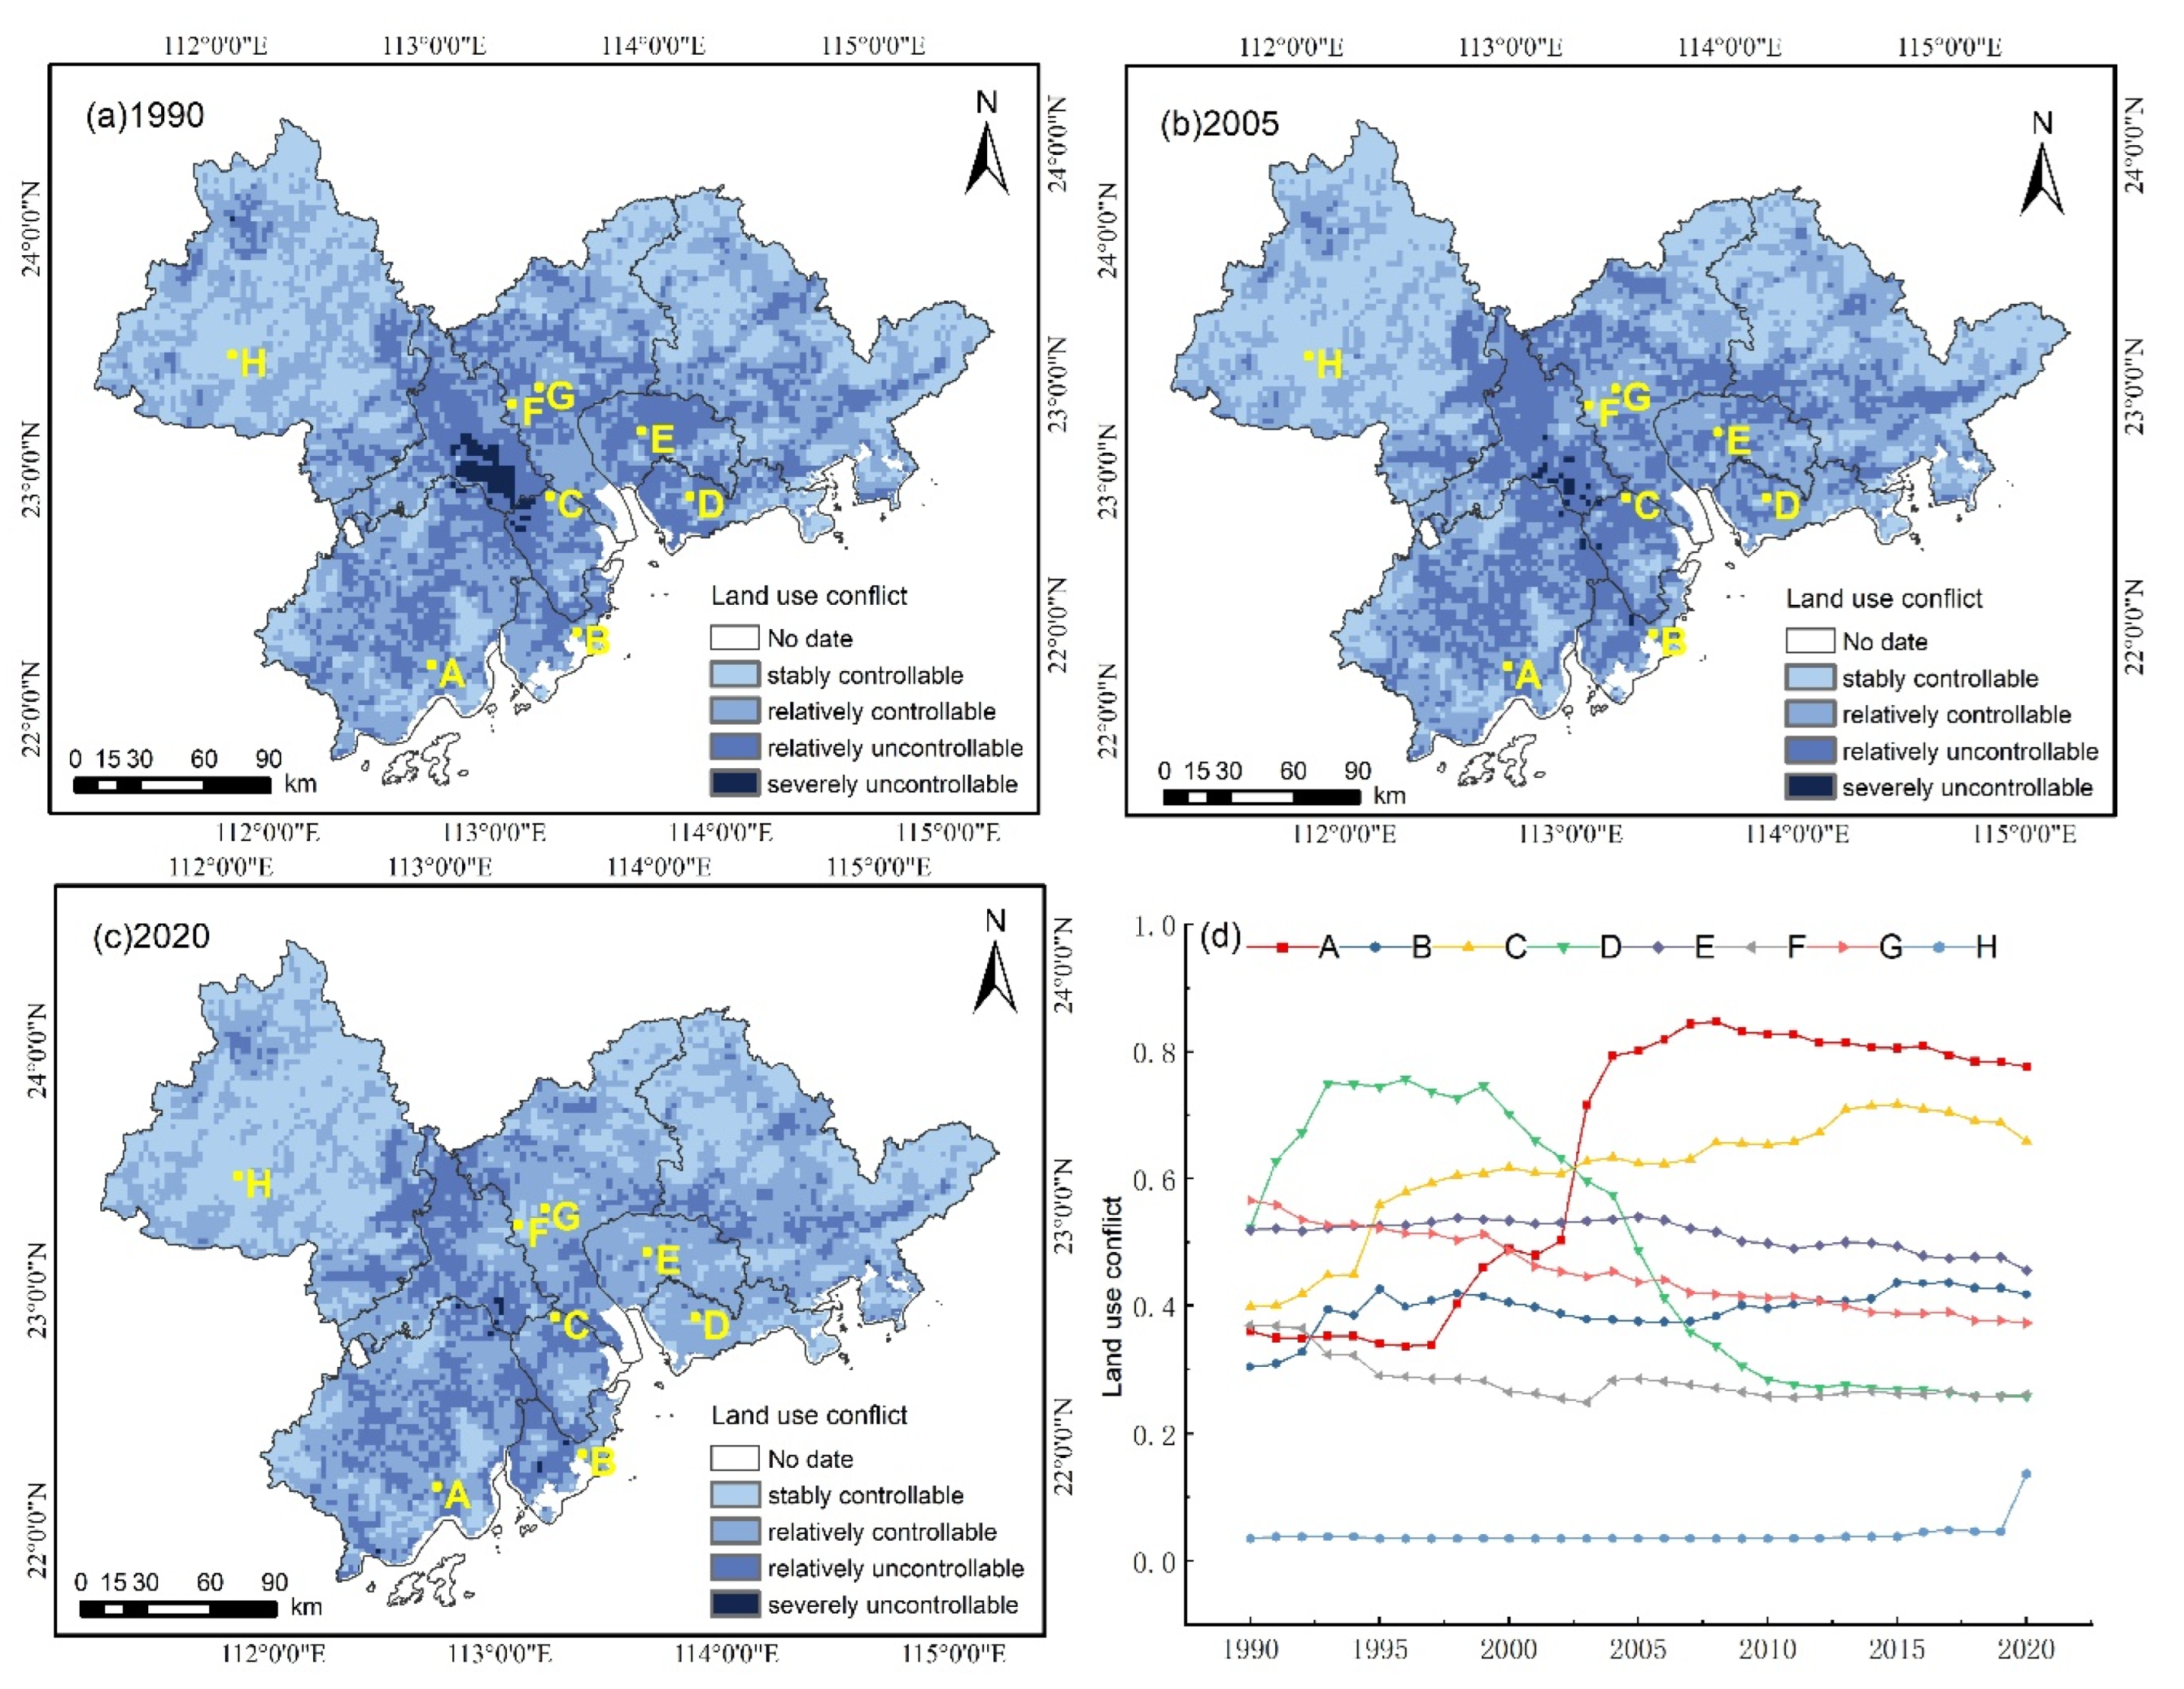
3.1. Spatiotemporal Evolution of SLUCs

3.1.1. Spatial Distribution of SLUCs

To better depict changes in SLUC patterns, we classified the conflict results into four groups (Figure 3): spatial patterns of stably controllable, relatively controllable, relatively uncontrollable, and severely uncontrollable cells in 1990, 2005, and 2020. In 1990, stably and relatively controllable cells were widely distributed, mainly in Zhaoqing, Huizhou, and northern Guangzhou, while relatively uncontrollable cells were mainly concentrated in Foshan, Dongguan, and Shenzhen. Areas with severely uncontrollable cells were mainly found in Foshan and its border with Zhongshan. In 2005, the conflicts were decreased overall. Some severely and relatively uncontrollable cells were shifted to stably and relatively controllable cells; these changes were particularly marked for Dongguan, Shenzhen, and Foshan, whereas Jiangmen, Zhongshan, and Guangzhou showed the opposite trend. In 2020, severely uncontrollable cells were sporadically distributed in Foshan and Zhuhai. The distribution of relatively uncontrollable cells further narrowed, whereas the distribution of stably and relatively controllable cells increasingly expanded. From 1990 to 2020, the level of SLUCs in the study area tended to decrease. Relatively controllable cells were distributed most widely, followed by stably controllable cells. Severely uncontrollable cells showed the narrowest distribution. Overall, conflicts were mostly within the controllable range.
Furthermore, eight cells (A–H) were selected to characterize the 30-year changes in SLUCs across the study area (Figure 3). Among them, cells A, C, and D showed dramatic conflict changes. Specifically, cell A presented a sharp increase in conflict values from 1998 and a slow decrease after 2008. Cell D displayed more complex changes, with an initial increase in conflict values, a leveling off for several years, a rapid decrease, and finally, stabilization. Cell C showed a gradual increase throughout the study period. In cells B, E, F, and G, conflict values changed moderately over time. The conflict values for cell H were relatively low and barely changed throughout the study period. The variation in conflict changes among cells and the marked differences in trends of conflicts over time indicate significant spatial heterogeneity in land use conflicts. The drastic changes in conflicts over time and space also demonstrate the necessity to comprehensively investigate conflicts over a long period. In terms of cell spatial distribution, there were dramatic conflict changes over time for grids with considerable land use changes within and around them in cells A, C, and D. In contrast, grids with a single land use type and mild land use changes around them in cells F and H showed less pronounced conflict changes over time.

3.1.2. Temporal Dynamics of SLUCs

The distribution pattern of SLUC values over the 30-year period (Figure 4) was relatively uniform. The upper and lower quartiles were close to 0.5 and 0.2, respectively, indicating that conflicts in the study area were mainly manageable. From 1990 to 2020, the upper and lower quartiles and the means showed a slow decreasing trend, and the box length gradually converged. This indicates that SLUCs in the study area were mitigated, and their distribution was concentrated throughout the study period.
Based on the structure of the number of cells with different conflict levels (Table 2), SLUCs in the study area were mainly stably and relatively controllable. There was only a small number of severely uncontrollable cells, and conflicts in the whole region were relatively mild. The number of stably controllable cells tended to increase with time, with the area proportion increasing from 30.23 to 34.50% over the 30-year period. This shift prominently mitigated the overall conflict level in the PRD region and was of great significance to coordinated regional development.
Among the four conflict levels, the number of relatively controllable cells accounted for the largest proportion of the study area, which slightly decreased from 1990 to 2005 (by 3.24%), then increased from 2005 to 2020 (by 6.44%; Table 2). Meanwhile, relatively uncontrollable cells showed an overall decreasing trend, especially from 2005 to 2020 (by 8.06%), and most of the relatively uncontrollable cells were transformed into relatively controllable cells. The proportion of severely uncontrollable cells was the least in the whole region (<2%) and decreased over time, especially from 1990 to 2005 (by 0.70%). Overall, the proportion of controllable cells increased from 73.68 to 81.15% from 1990 to 2020, and the proportion of uncontrollable cells decreased by 7.47%, indicating diminished conflicts.

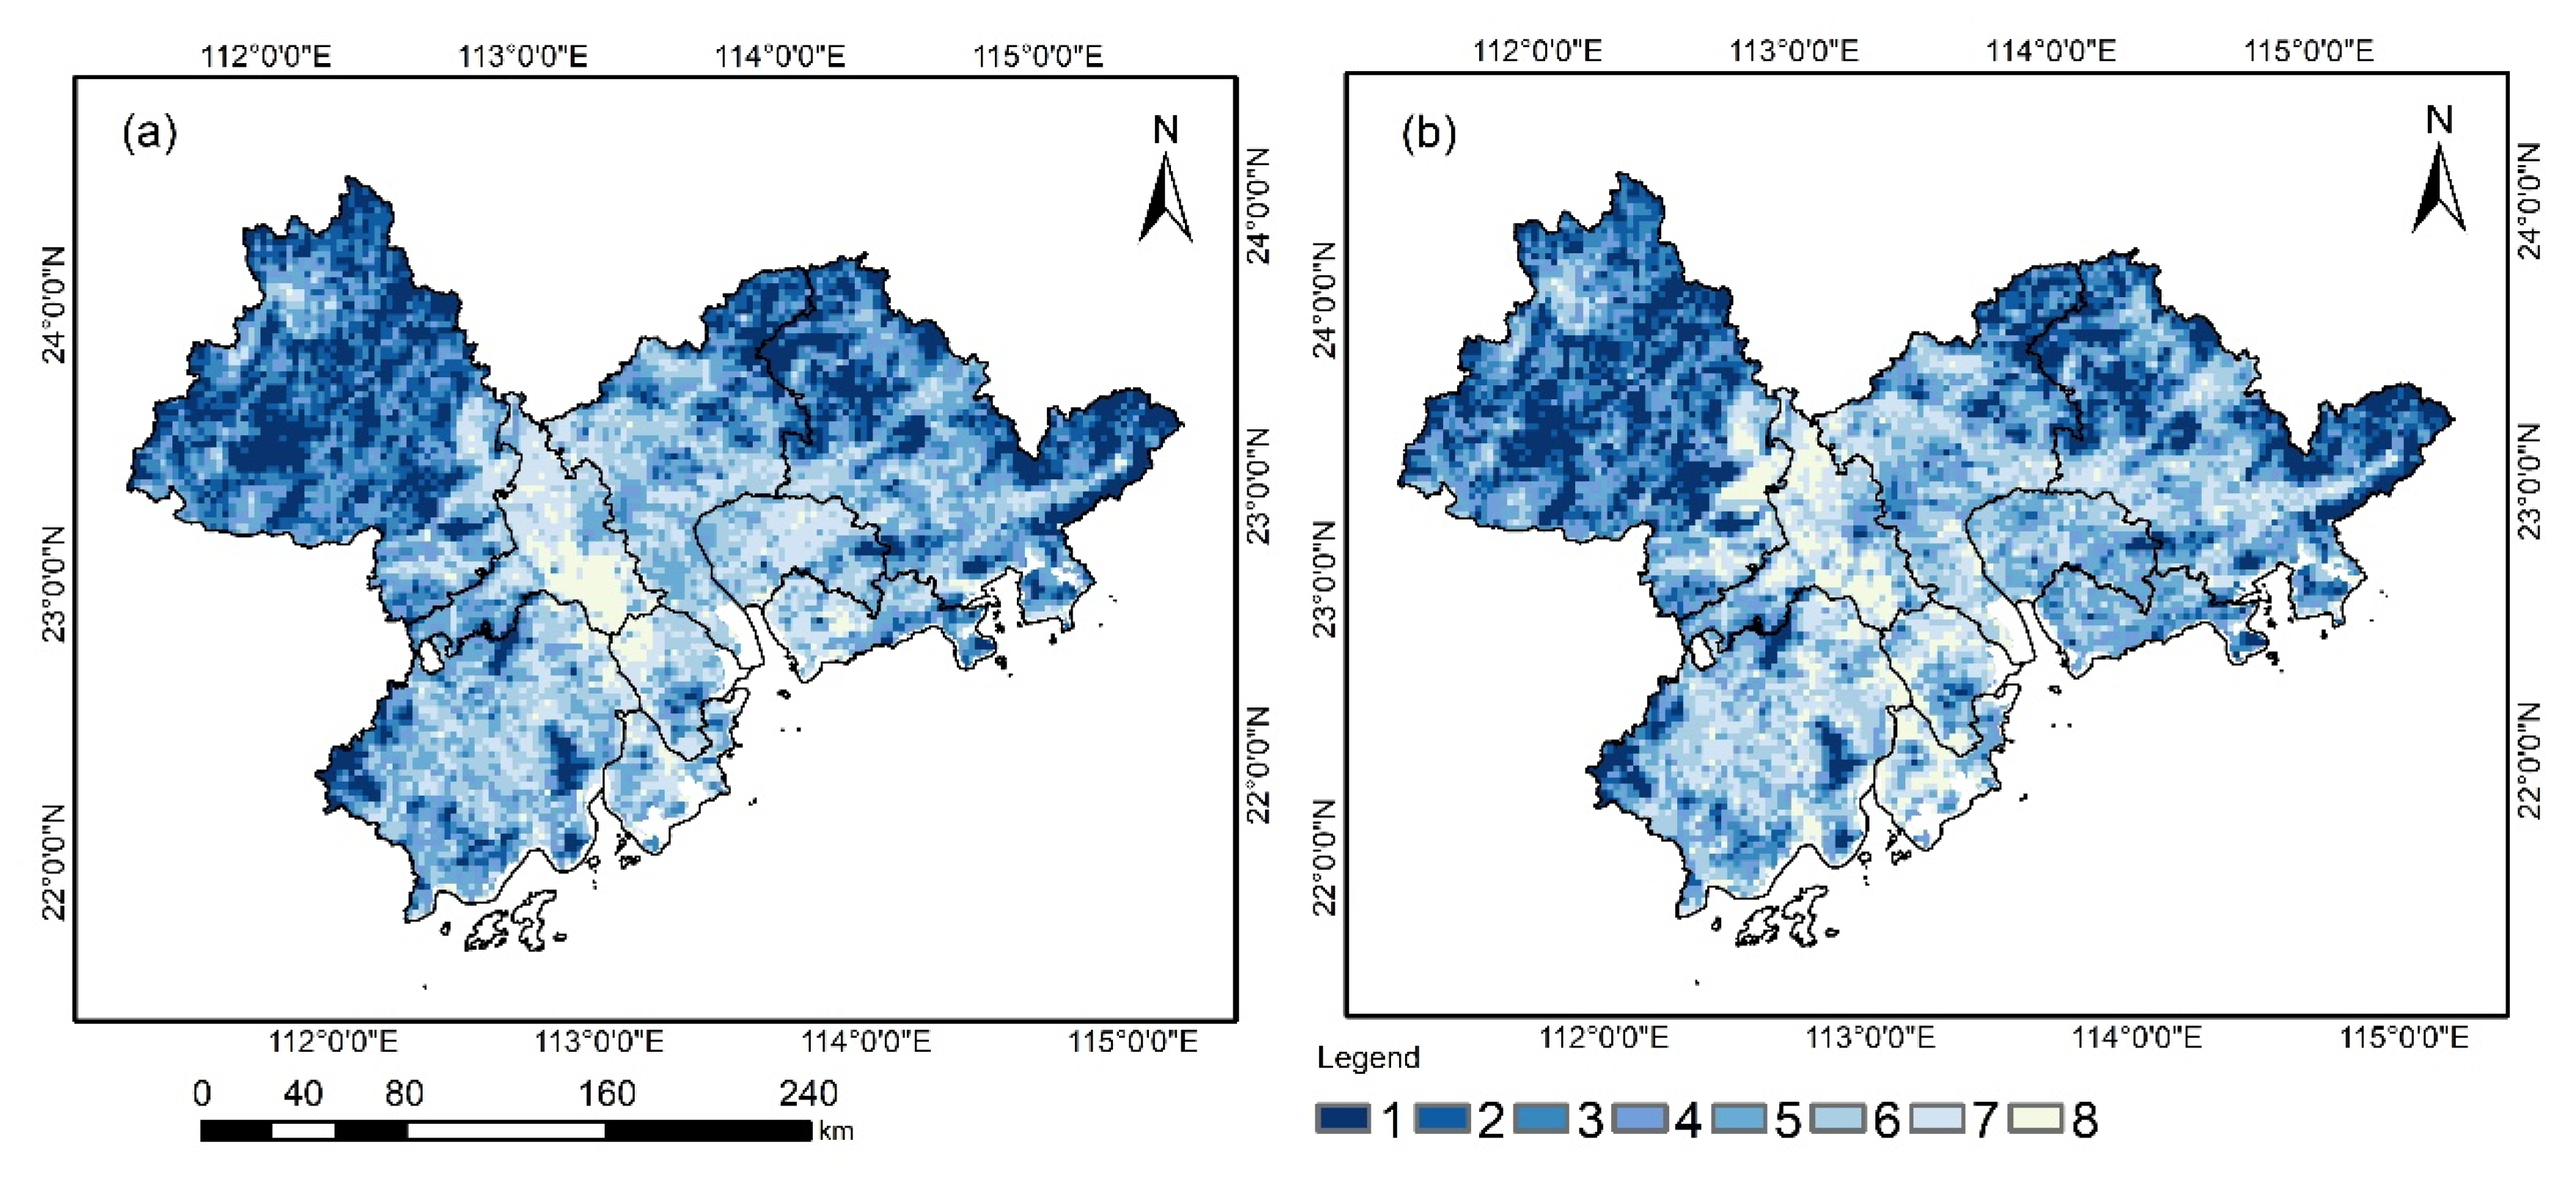
3.2. SLUC Intensity Based on Clustering Analysis

SLUCs in the two phases (1990–2005 and 2006–2020) were classified into 6, 8, and 10 clusters by K-means clustering analysis. Eight clusters were chosen according to changes in the q-value of the geographic detector. We observed the highest comprehensive conflict intensity in the eighth cluster, followed by the seventh cluster, and the lowest comprehensive conflict intensity was found in the first cluster (Figure 5).
Between 1990 and 2005, the areas of moderate conflicts were mainly distributed in Zhaoqing, Huizhou, Jiangmen, and northern Guangzhou. Foshan had the highest comprehensive conflict intensity, and Zhongshan, Zhuhai, Dongguan, and Shenzhen exhibited milder conflict intensity. In 2006–2020, the spatial distribution of the conflict clustering results was highly consistent with that observed in the previous phase. Foshan, Dongguan, and Shenzhen showed a marked attenuation in conflict intensity. However, Foshan still displayed the highest comprehensive conflict intensity, and Zhaoqing ranked the lowest across the study area.
The spatial distribution of comprehensive SLUC intensity in both phases indicates that land use conflicts were characterized by high intensity in the central part of the region and low intensity in the surrounding areas. Considering land use types in past years, Zhaoqing, Huizhou, and Jiangmen, with low conflict intensity, were mainly dominated by concentrated and continuous forest and arable land. In contrast, complex land use types such as built-up land, arable land, and water areas were intertwined in areas with higher conflict intensity. Areas of built-up land expanded considerably from 1990 to 2020, especially in Foshan, Dongguan, and Shenzhen, but the SLUC intensity decreased over time.

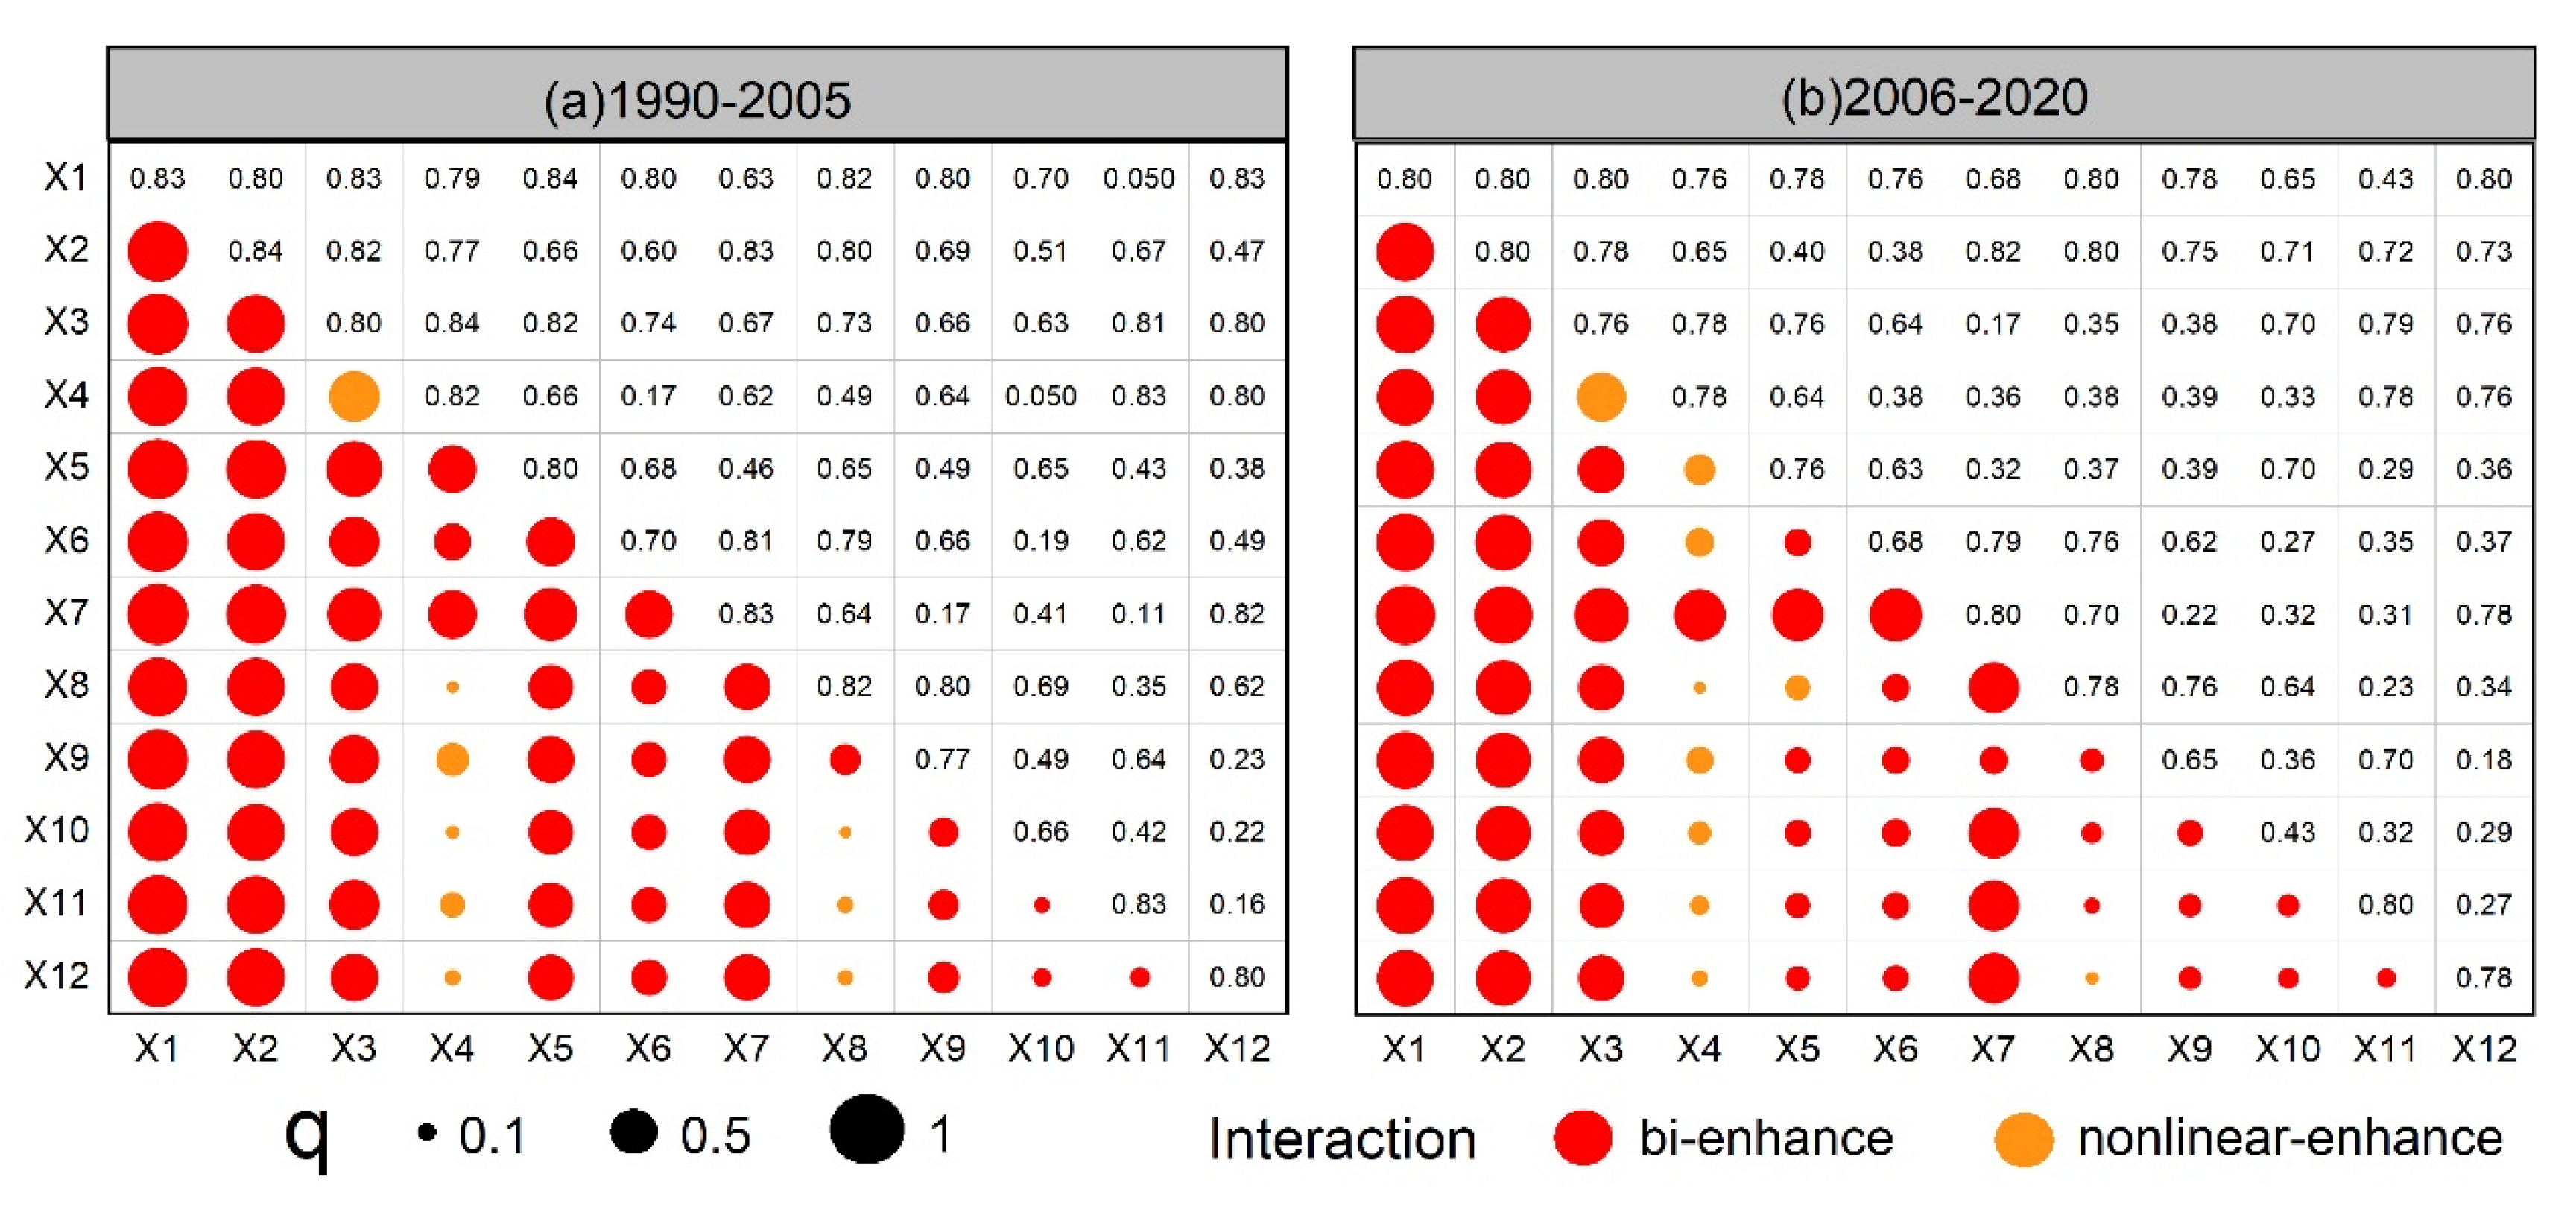
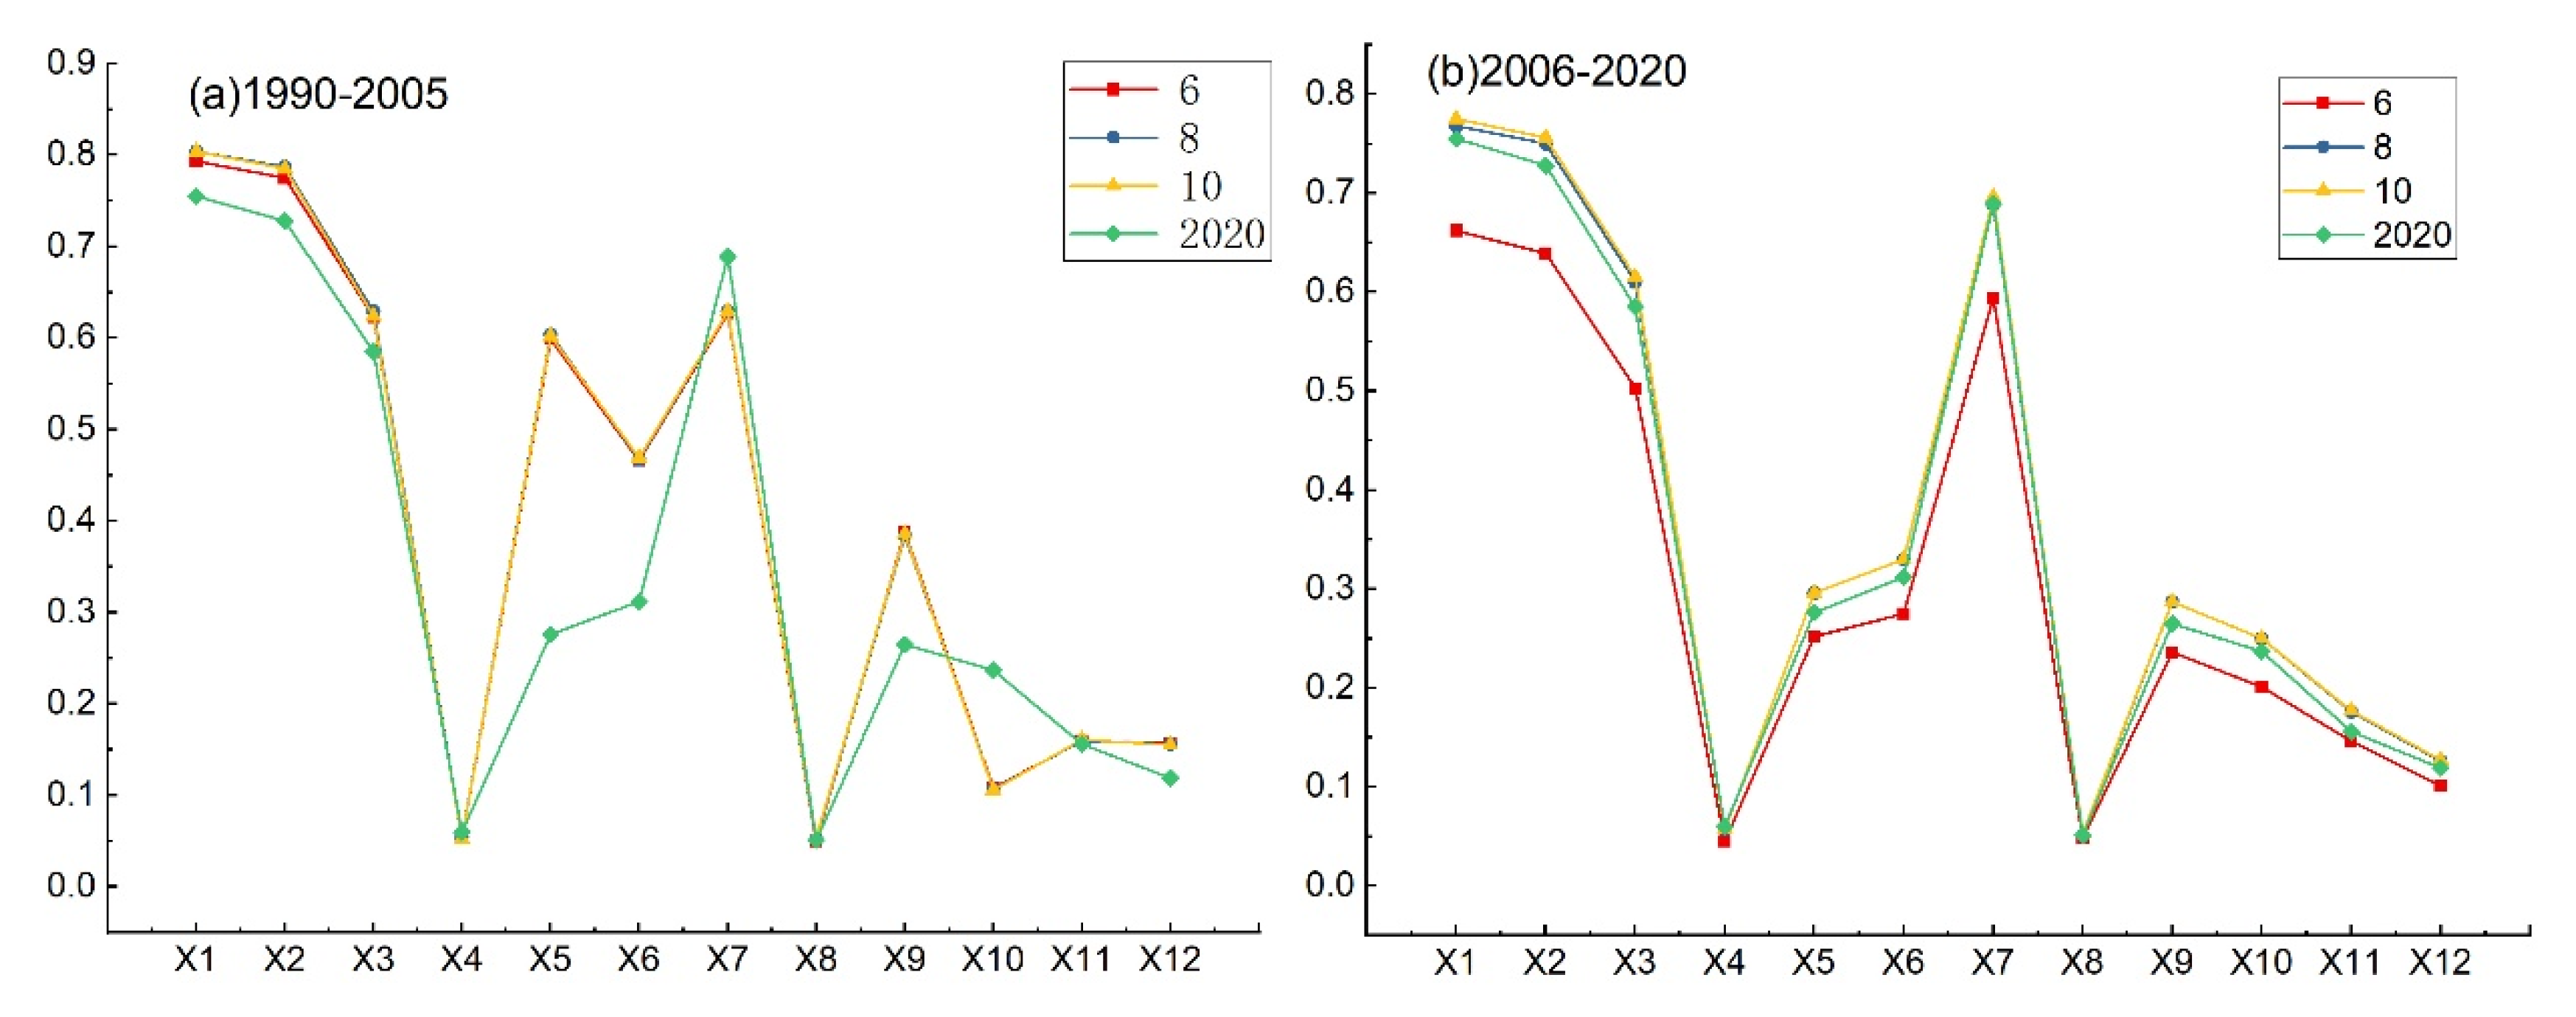
3.3. Factors Driving Spatial Differentiation of SLUCs

The factors influencing SLUCs in 1990–2005 and 2006–2020 were studied using factor detection with the OPGD model. The results show that the influence of different factors on land use conflicts varied significantly (Table 3). In 1990–2005, the major influencing factors were slope (X1), elevation (X2), average annual temperature (X3), GDP (X5), and NDVI (X7), all with q-values >0.6. The explanatory power of other factors was ranked population density (X6), the distance to urban centers (X9), the distance to railways (X11), the distance to nature reserves (X12), the distance to major roads (X10), average annual precipitation (X4), and the distance to rivers (X8) in descending order. Among these, X4 and X8 had q-values < 0.1, indicating the lowest explanatory power for land use conflicts.
During 2006–2020, the major factors driving differentiation in land use conflicts remained consistent with those in 1990–2005, except for GDP (X5; Table 2). Average annual precipitation (X4) and the distance to rivers (X8) still had the lowest explanatory power. Compared with the previous period, the explanatory power of average annual precipitation (X4), NDVI (X7), the distance to major roads (X10), and the distance to railways (X11) increased in 2006–2020. In contrast, the explanatory power of other influencing factors decreased to different degrees, and this trend was especially evident for GDP (X5).
Interaction detection can identify the interactions of different factors that drive the spatial distribution of SLUCs. Both bi-enhance and nonlinear-enhance were observed after interaction detection for all 12 factors, with bi-enhance predominant. Among the 66 pairs of interactions between the 2 factors, 9 pairs were nonlinear-enhance, and the rest were bi-enhance in 1990–2005; meanwhile, 10 pairs were nonlinear-enhance, and the rest were bi-enhance in 2006–2020 (Figure 6). The influence of each factor on land use conflicts was not independent; rather, the factors interacted with each other. This indicates that the interaction of any 2 of the 12 factors could exacerbate the conflict level.
During 1990–2005, slope (X1) and elevation (X2) interacted most strongly with the highest q-value of 0.834 (Figure 6). Average annual precipitation (X4) and the distance to rivers (X8) had the weakest interaction with the lowest q-value of 0.174. Accordingly, slope and elevation had the most significant influence on land use conflicts, whereas annual precipitation and the distance to rivers had the lowest explanatory power on conflicts. During 2006–2020, elevation (X2) and NDVI (X7) had the strongest interaction with the highest q-value of 0.804. Average annual precipitation (X4) and the distance to rivers (X8) still had the weakest interaction with a q-value of 0.168. As time advanced, the factors that had the greatest influence on land use conflicts changed to elevation and NDVI, while annual precipitation and the distance to rivers maintained a minor influence on conflicts.
Across the two phases, the q-values for the interactions of X1, X2, X3, and X7 with other factors were all >0.6 (Figure 6). This highlights the prominent influence of slope, elevation, average annual temperature, and NDVI on land use conflicts. The interactions of various factors generally decreased over time.

4. Discussion

4.1. Spatiotemporal Patterns of SLUCs and Their Major Driving Factors

SLUCs have been recognized as a widespread and unavoidable phenomenon. This is mainly because the sustainability of land resources is sacrificed to meet growing human demands and economic development, which has accentuated the already tense human–land conflicts [53,54]. SLUCs are dynamic processes, and conflicts in the PRD region varied significantly in terms of spatial patterns and quantitative structures across the two different periods. Overall, the conflict level in the peripheral cities was mild, whereas more intense conflicts occurred in the central area.
In Zhaoqing, Jiangmen, and Huizhou located in the peripheral areas, forest and arable land were the major land use types. Spatial cells with stably and relatively controllable conflicts were predominant in these cities, showing high continuity. In contrast, the overall conflict intensity of Foshan, Zhongshan, Shenzhen, and Dongguan was markedly weakened. In these cities, the major land use type was built-up land, which gradually expanded over time. The expansion of built-up land can cause serious fragmentation in the surrounding landscape and increasingly complex patch boundaries. As a result, conflict intensity might be enhanced compared with that of forests, which experienced minor changes in spatial distribution over the years. However, our results indicate that the increase in built-up land area did not necessarily increase the conflict intensity. At a certain level of expansion, the originally complicated and fragmented built-up land patches with complex boundaries may be clustered into large core areas, which can attenuate conflicts. Changes in conflict intensity during 1990–2005 and 2006–2020 indicate that the overall SLUCs in the PRD have been mitigated in recent decades. This may be attributed to the implementation of the Integrated Plan for Environmental Protection in the Pearl River Delta (2009–2020), which plays an essential role in improving regional environmental quality and maintaining regional environmental security.
Various driving factors had different explanatory power for SLUCs. In the PRD, SLUCs were mainly influenced by topographical (slope and elevation) and environmental (NDVI) factors. Socio-economic factors (GDP and population density) were also important for driving the spatial differentiation of SLUCs. These results are consistent with previous findings showing that elevation, economic levels, and population density are major contributors to SLUCs [28,37]. The influence of topographic factors on land use conflicts was distinct, with q-values around 0.8 in both 1990–2005 and 2006–2020. Among the 12 factors analyzed, topographic factors also had the strongest interactions with other factors. Specifically, SLUCs in the PRD tended to occur in areas with gentle topography, a short distance to urban centers, rapid economic development, and high population density. On the other hand, SLUCs were less influenced by average annual precipitation and the distance to rivers. Conflicts were also less likely to occur in nature reserves and along railroad lines. Overall, the explanatory power of the 12 factors on SLUCs decreased from 2006 to 2020 in the study area. This suggests that the influence of other unselected factors (e.g., policies, resources, and soil physicochemical properties) on SLUCs have increased in recent years.

4.2. Implications for Regional Land Use Planning

It has been recognized that the management of SLUCs should focus on conflict mitigation, rather than elimination [9,55]. Similarly, the ultimate goal of our research on SLUCs is conflict reconciliation. Taking into account the regional and phased nature of land use conflicts, decision-makers should formulate conflict mitigation plans according to local conditions. For example, in conflict-controllable areas with the landscape dominated by forest and grassland, we should respect the status quo and focus on efficient development based on the current situation of land use.
In conflict-uncontrollable areas, we should “develop in the protection” and “protect in the development”. Territorial spatial planning must be followed strictly to prevent economic development crossing the “three lines”, namely, the ecological protection red line, the permanent basic arable land boundary, and the urban development boundary. It is recommended to limit the reasonable extension and development of urban built-up land, strictly control the ecological land occupied by urban development, and reduce the negative ecological impact. A compensation mechanism should be strictly implemented for built-up land that must occupy arable land. Additionally, it is crucial to give greater autonomy to regional development, modify the traditional development model, upgrade the industrial structure, and expand research into the multi-functionality of land use. Studying SLUCs can provide information for decision-makers to achieve the “triple win” of economic development, human prosperity, and a sound ecological environment.

4.3. Limitations and Improvements

SLUCs are contradictions arising from competition between land use stakeholders for scarce land resources. Such contradictions are not immediately manifested but emerge in subsequent periods. The use of K-means clustering to synthesize SLUCs in different periods is helpful to more accurately reflect the comprehensive SLUC index aggregated in the same spatial grid. This method also takes into account the lagged impact of SLUCs on the surrounding landscape and better reveals the evolutionary characteristics of the SLUC index in time and space [35]. The results of K-means clustering analysis are influenced by the number of clusters. To improve the accuracy of clustering results, we classified SLUCs into 6, 8, and 10 clusters (Figure 7). The explanatory power of the factors driving SLUCs with 8 clusters was overall higher than that with 6 clusters, and its q-value differed slightly from that with 10 clusters. Thus, we chose eight clusters for subsequent analysis. In addition, we found that the factor detection of SLUCs in 2020 yielded a lower q-value than that of post-clustering SLUCs with 8 or 10 clusters. This result further indicates that it is necessary to perform a temporal integration of land use conflicts. Furthermore, we used the OPGD model to estimate the explanatory power of the factors driving SLUCs. This model is a useful tool to objectively determine the contribution of each factor to SLUCs and accurately identify their interaction processes and modes. The results could precisely and effectively reveal the mechanisms by which human and natural factors influence land use conflicts.
There remain some limitations in this study. For example, the landscape ecological risk evaluation model did not take into account human factors and thus could not effectively measure the incompatibility of human–land relationships in SLUCs. Although the integration of the study period allows better capture of the comprehensive characteristics of SLUCs over time, subtle internal information for each timepoint might be ignored. Future studies should pay attention to conflict identification methods and improve the models by combining the advantages of other models, which will enhance the accuracy of the results. Moreover, there are multitudinous methods to determine the reasonable number of clusters, such as Calinski–Harabasz criterion (CH), Davies–Bouldin criterion (DB), etc. In this paper, only 6, 8, and 10 classes were selected according to the research needs, and the influence of the optimal number of clusters on the results should be further explored in the future. In addition, we chose a 2.5 km × 2.5 km grid as the measurement cell of the model to identify SLUCs based on previous studies. This grid size still needs to be verified, and more experiments should be conducted according to the scope and scale of research to optimize the grid cell scale. Furthermore, policy factors that influence SLUCs were not considered in the present study due to difficulties in quantifying them. As policy bias plays a pivotal role in regional land use change, comprehensive consideration of additional influencing factors is required in subsequent studies.

5. Conclusions

Spatial land use conflicts (SLUCs) must be addressed when balancing land use and coordinated regional socio-economic development. In this study, we used a landscape ecological risk assessment model combined with K-means clustering analysis to characterized SLUCs in the Pearl River Delta (PRD) urban agglomeration. The spatiotemporal evolution of SLUCs was explored, and comprehensive conflict intensity was determined. Furthermore, the explanatory power of individual driving factors and their interactions were identified using an optimal parameter-based geographical detector (OPGD) model. The findings provide a reference for decision-makers to explore the next stage in territorial spatial and economic development planning.
From 1990 to 2020, the level of SLUCs decreased overall in the study area. There was a wide distribution of stably and relatively controllable areas, with the total controllable area accounting for 70% of the study area. However, the spatial distribution of SLUCs showed considerable regional differences. Comprehensive clustering of the SLUC index for the two periods (1990–2005 and 2006–2020) revealed that land use conflicts were distinctly mitigated over time. The overall spatial trend of conflicts was characterized by low intensity in peripheral areas and high intensity in the central part of the study area. The areas with low conflict intensity were mainly forests and arable land that showed small changes in spatial distribution. The central area was dominated by expanding built-up land with constantly changing SLUCs. The results of the OPGD model indicate that the influence of all 12 driving factors on SLUCs varied in space and time. Topographic factors had the greatest influence on land use conflicts, whereas location factors had the least explanatory power. The findings emphasize the importance of exploring comprehensive SLUCs over a long period, which opens up a new research perspective. Our research also provides reliable information for realizing the coordinated development of regional space, easing conflicts between humans and land, and optimizing the allocation of land resources.

Author Contributions

Conceptualization, Y.Z. and X.Z.; methodology, Y.Z., G.C. and J.G.; formal analysis, Y.Z., G.C. and J.G.; writing–original draft preparation, X.Z. and X.H.; writing—review and editing, Y.Z. and X.Z. All authors have read and agreed to the published version of the manuscript.

Funding

This work was supported by the National Key R&D Program of China (Grant No. 2020YFD1100603-02).

Institutional Review Board Statement

Not applicable.

Informed Consent Statement

Informed consent was obtained from all subjects involved in the study.

Data Availability Statement

Not applicable.

Acknowledgments

Not applicable.

Conflicts of Interest

The authors declare no conflict of interest.

References

  1. Zhang, J.; Chen, Y.; Zhu, C.M.; Huang, B.B.; Gan, M.Y. Identification of potential land-use conflicts between agricultural and ecological space in an ecologically fragile area of southeastern China. Land 2021, 10, 1011. [Google Scholar] [CrossRef]
  2. Zong, S.S.; Hu, Y.C.; Zhang, Y.L.; Wang, W. Identification of land use conflicts in China’s coastal zones: From the perspective of ecological security. Ocean. Coast. Manag. 2021, 213, 105841. [Google Scholar] [CrossRef]
  3. Peters, P.E. Bewitching Land: The role of land disputes in converting kin to strangers and in class formation in Malawi. J. South. Afr. Stud. 2002, 28, 155–178. [Google Scholar] [CrossRef]
  4. Pielke, R.A. Land use and climate change. Science 2005, 310, 1625. [Google Scholar] [CrossRef] [Green Version]
  5. Yu, B.H.; Lv, C.H. The progress and prospect of land use conflicts. Prog. Geogr. 2006, 25, 106–115. [Google Scholar]
  6. Hersperger, A.M.; Ioja, C.; Steiner, F.; Tudor, C.A. Comprehensive consideration of conflicts in the land-use planning process: A conceptual contribution. Carpathian J. Earth Environ. Ences 2015, 10, 5–13. [Google Scholar]
  7. Reuber, P. Conflict studies and critical geopolitics—Theoretical concepts and recent research in political geography. Geojournal 2000, 50, 37–43. [Google Scholar] [CrossRef]
  8. Zhou, D.; Lin, Z.; Lim, S.H. Spatial characteristics and risk factor identification for land use spatial conflicts in a rapid urbanization region in China. Env. Monit Assess 2019, 191, 677. [Google Scholar]
  9. Zou, L.L.; Liu, Y.S.; Wang, J.Y.; Yang, Y.Y. An analysis of land use conflict potentials based on ecological-production-living function in the southeast coastal area of China. Ecol. Indic. 2021, 122, 107297. [Google Scholar] [CrossRef]
  10. Adam, Y.O.; Pretzsch, J.; Darr, D. Land use conflicts in central Sudan: Perception and local coping mechanisms. Land Use Policy 2015, 42, 1–6. [Google Scholar]
  11. Reyes-García, V.; Orta-Martínez, M.; Gueze, M.; Luz, A.C.; Paneque-Gálvez, J.; Macía, M.J.; Pino, J.; TAPS Bolivian Study Team. Does participatory mapping increase conflicts? A randomized evaluation in the Bolivian Amazon. Appl. Geogr. 2012, 34, 650–658. [Google Scholar]
  12. Stark, A. Analysis of planning data concerning land consolidation using a geographical information system. Z. Fuer Kult. Landentwickl. 1993, 34, 37–42. [Google Scholar]
  13. Zhang, Y.N.; Long, H.L.; Tu, S.S.; Ge, D.Z.; Ma, L.; Wang, L.Z. Spatial identification of land use functions and their tradeoffs/synergies in China: Implications for sustainable land management. Ecol. Indic. 2019, 107, 105550. [Google Scholar] [CrossRef]
  14. Brown, G.; Raymond, C.M. Methods for identifying land use conflict potential using participatory mapping. Landsc. Urban Plan. 2014, 122, 196–208. [Google Scholar] [CrossRef]
  15. Henderson, S.R. Managing land-use conflict around urban centres: Australian poultry farmer attitudes towards relocation. Appl. Geogr. Sevenoaks 2005, 25, 97–119. [Google Scholar] [CrossRef]
  16. Shao, X.; Hu, Y. Conflict and balance between farmland ownership and income rights: A theoretical analysis framework for realizing farmers’ land property rights. Macroecon 2016, 12, 3–13. (In Chinese) [Google Scholar]
  17. Dunk, A.; Grêt-Regamey, A.; Dalang, T.; Hersperger, A.M. Defining a typology of peri-urban land-use conflicts—A case study from Switzerland. Landsc. Urban Plan. 2011, 101, 149–156. [Google Scholar] [CrossRef]
  18. Hui, E.; Bao, H. The logic behind conflicts in land acquisitions in contemporary China: A framework based upon game theory. Land Use Policy 2013, 30, 373–380. [Google Scholar] [CrossRef]
  19. Zuo, Q.; Zhou, Y.; Wang, L.; Li, Q.; Liu, J.Y. Impacts of future land use changes on land use conflicts based on multiple scenarios in the central mountain region, China. Ecol. Indic. 2022, 137, 108743. [Google Scholar]
  20. Amman, H.M.; Duraiappah, A.K. Modeling instrumental rationality, land tenure and conflict resolution. Comput. Econ. 2001, 18, 251–257. [Google Scholar] [CrossRef]
  21. Yang, J.; Huang, X. The 30 m annual land cover dataset and its dynamics in China from 1990 to 2019. Earth Syst. Sci. Data 2021, 13, 3907–3925. [Google Scholar] [CrossRef]
  22. Kang, Z.Q.; Wang, S.; Xu, L.; Yang, F.L.; Zhang, S.S. Suitability assessment of urban land use in Dalian, China using PNN and GIS. Nat. Hazards 2021, 106, 913–936. [Google Scholar] [CrossRef]
  23. Kim, L.; Arnhold, S. Mapping environmental land use conflict potentials and ecosystem services in agricultural watersheds. Sci. Total Environ. 2018, 630, 827–838. [Google Scholar] [CrossRef] [PubMed]
  24. Deininger, K.; Castagnini, R. Incidence and impact of land conflict in Uganda. J. Econ. Behav. Organ. 2006, 60, 321–345. [Google Scholar] [CrossRef] [Green Version]
  25. Ji, W.; Ma, J.; Twibell, R.W.; Underhill, K. Characterizing urban sprawl using multi-stage remote sensing images and landscape metrics. Comput. Environ. Urban Syst. 2006, 30, 861–879. [Google Scholar] [CrossRef]
  26. Tagil, S.; Gormus, S.; Cengiz, S. The Relationship of Urban Expansion, Landscape Patterns and Ecological Processes in Denizli, Turkey. J. Indian Soc. Remote Sens. 2018, 46, 1285–1296. [Google Scholar] [CrossRef]
  27. Liu, X.; Zhang, Z.; Li, M.; Fu, Y.; Hui, Y. Spatial conflict simulation of land-use based on human-land-landscape elements intercoordination: A case study in Tianjin, China. Environ. Monit. Assess. 2022, 194, 317. [Google Scholar] [CrossRef]
  28. Jiang, S.; Meng, J.; Zhu, L.; Cheng, H. Spatial-temporal pattern of land use conflict in China and its multilevel driving mechanisms. Sci. Total Environ. 2021, 801, 149697. [Google Scholar] [CrossRef]
  29. Peng, W.T.; Zhang, Z.D.; He, G.; Liu, X.Y.; Wang, W.; Cai, Y.L.; López-Carr, D. Integrating potential land use conflict into ecological security pattern in response to land use/cover changes at a county scale in Yangtze River Delta, China. Front. Earth Sci. 2022, 10, 875433. [Google Scholar] [CrossRef]
  30. Jing, W.L.; Yu, K.H.; Wu, L.; Luo, P.P. Potential land use conflict identification based on improved multi-objective suitability evaluation. Remote Sens. 2021, 13, 2416. [Google Scholar] [CrossRef]
  31. Cui, J.X.; Kong, X.S.; Chen, J.; Sun, J.W.; Zhu, Y.Y. Spatially explicit evaluation and driving factor identification of land use conflict in Yangtze River Economic Belt. Land 2021, 10, 43. [Google Scholar] [CrossRef]
  32. Jiang, S.; Meng, J.J.; Zhu, L.K. Spatial and temporal analyses of potential land use conflict under the constraints of water resources in the middle reaches of the Heihe River. Land Use Policy 2020, 97, 104773. [Google Scholar] [CrossRef]
  33. Gustafson, E.J. Quantifying landscape spatial pattern: What is the state of the art? Ecosystems 1998, 1, 143–156. [Google Scholar] [CrossRef]
  34. Kent, M.; Gill, W.J.; Weaver, R.E.; Armitage, R.P. Landscape and plant community boundaries in biogeography. Prog. Phys. Geogr. 1997, 21, 315–353. [Google Scholar] [CrossRef]
  35. Wade, T.G.; Wickham, J.D.; Zacarelli, N.; Riitters, K.H. A multi-scale method of mapping urban influence. Environ. Model. Softw. 2009, 24, 1252–1256. [Google Scholar] [CrossRef]
  36. Zhang, Y.; Liu, Y.F.; Zhang, Y.; Kong, X.S.; Jing, Y.; Cai, E.X.; Zhang, L.Y.; Liu, Y.; Wang, Z.Y.; Liu, Y.L. Spatial patterns and driving forces of conflicts among the three land management red Lines in China: A case study of the Wuhan urban development area. Sustainability 2019, 11, 2025. [Google Scholar]
  37. Zong, S.S.; Hu, Y.C.; Bai, Y.P.; Guo, Z.L.; Wang, J.Y. Analysis of the distribution characteristics and driving factors of land use conflict potentials in the Bohai Rim coastal zone. Ocean. Coast. Manag. 2022, 226, 106260. [Google Scholar] [CrossRef]
  38. Song, Y.Z.; Wang, J.F.; Ge, Y.; Xu, C.D. An optimal parameters-based geographical detector model enhances geographic characteristics of explanatory variables for spatial heterogeneity analysis: Cases with different types of spatial data. GISci. Remote Sens. 2020, 57, 593–610. [Google Scholar]
  39. Song, Y.Z.; Wu, P. An interactive detector for spatial associations. Int. J. Geogr. Inf. Sci. 2021, 35, 1676–1701. [Google Scholar]
  40. Yu, Z.X.; Xu, E.Q.; Zhang, H.Q.; Shang, E.P. Spatio-temporal coordination and conflict of production-living-ecology land functions in the Beijing-Tianjin-Hebei region, China. Land 2020, 9, 170. [Google Scholar] [CrossRef]
  41. Qiu, G.Q.; Wang, Y.H.; Guo, S.S.; Niu, Q.; Qin, L.; Zhu, D.; Gong, Y.L. Assessment and spatial-temporal evolution analysis of land use conflict within urban spatial zoning: Case of the Su-Xi-Chang region. Sustainability 2022, 14, 2286. [Google Scholar] [CrossRef]
  42. Huang, C.; Huang, X.; Peng, C.; Zhou, Z.; Teng, M.; Wang, P. Land use/cover change in the Three Gorges Reservoir area, China: Reconciling the land use conflicts between development and protection. Catena 2019, 175, 388–399. [Google Scholar] [CrossRef]
  43. Jin, G.; Chen, K.; Wang, P.; Guo, B.; Dong, Y.; Yang, J. Trade-offs in land-use competition and sustainable land development in the North China Plain. Technol. Forecast. Soc. Change 2019, 141, 36–46. [Google Scholar] [CrossRef]
  44. Qu, L.S.; Zhu, Q.A.; Zhu, C.F.; Zhang, J. Monthly Precipitation Data Set with 1 km Resolution in China from 1960 to 2020. Available online: http://www.scidb.cn/cstr/31253.11.sciencedb.01607 (accessed on 12 April 2022).
  45. Kong, W.; Liu, H.; Fan, J. The features and causes of spatial planning conflicts in China: Taking urban planning and land-use planning as examples. Chin. J. Urban Environ. Stud. 2019, 07, 19500039. [Google Scholar] [CrossRef]
  46. Peng, J.J.; Zhou, G.H.; Tang, C.L.; Yan-Hua, H.E. The analysis of spatial conflict measurement in fast urbanization region based on ecological security—A case study of Changsha-Zhuzhou-Xiangtan urban agglomeration. J. Nat. Resour. 2012, 27, 1507–1519. (In Chinese) [Google Scholar]
  47. ESRI. ArcGIS Help 9.3—Iso Cluster. Available online: http://webhelp.esri.com/arcgisdesktop/9.3/index.cfm?id¼5733&pid¼5723&topicname¼Iso_Cluster (accessed on 20 April 2021).
  48. ESRI. ArcGIS Help 9.3—MLClassify. Available online: http://webhelp.esri.com/arcgisdesktop/9.3/index.cfm?id¼5735&pid¼5723&topicname¼MLClassify (accessed on 20 April 2021).
  49. He, J.H.; Pan, Z.Z.; Liu, D.F.; Guo, X.N. Exploring the regional differences of ecosystem health and its driving factors in China. Sci. Total Environ. 2019, 673, 553–564. [Google Scholar] [CrossRef]
  50. Liu, C.L.; Li, W.L.; Zhu, G.F.; Zhou, H.K.; Yan, H.P.; Xue, P.F. Land use/Land cover changes and their driving factors in the northeastern Tibetan Plateau based on geographical detectors and Google Earth Engine: A case study in Gannan Prefecture. Remote Sens. 2020, 12, 3139. [Google Scholar] [CrossRef]
  51. Wang, J.F.; Zhang, T.L.; Fu, B.J. A measure of spatial stratified heterogeneity. Ecol. Indic. 2016, 67, 250–256. [Google Scholar] [CrossRef]
  52. Ma, T.; Jiang, D.; Hao, M.; Fan, P.; Zhang, S.; Quzhen, G.; Xue, C.; Han, S.; Wu, W.; Zheng, C.; et al. Geographical detector-based influence factors analysis for echinococcosis prevalence in Tibet, China. PLoS Negl. Trophical Dis. 2021, 15, 16. [Google Scholar] [CrossRef]
  53. Ma, W.; Jiang, G.; Chen, Y.; Qu, Y.; Zhou, T.; Li, W. How feasible is regional integration for reconciling land use conflicts across the urban–rural interface? Evidence from Beijing–Tianjin–Hebei metropolitan region in China. Land Use Policy 2020, 92, 104433. [Google Scholar] [CrossRef]
  54. Saarikoski, H.; Raitio, K.; Janice, B. Understanding ‘successful’ conflict resolution: Policy regime changes and new interactive arenas in the Great Bear Rainforest. Land Use Policy 2013, 32, 271–280. [Google Scholar] [CrossRef]
  55. Bircol, G.A.C.; Souza, M.P.D.; Fontes, A.T.; Chiarello, A.G.; Ranieri, V.E.L. Planning by the rules: A fair chance for the environment in a land-use conflict area. Land Use Policy 2018, 103–112. [Google Scholar] [CrossRef]
Figure 1. Maps of the study area. (a) Administrative division of China. (b) Digital elevation model (DEM) of Guangdong Province. (c) Land use/land cover change in the Pearl River Delta (PRD) urban agglomeration in 2020.
Sustainability 15 00392 g001
Figure 2. Framework for identification of spatial land use conflicts (SLUCs) and their driving factors.
Sustainability 15 00392 g002
Figure 3. Spatial distribution of SLUCs in the Pearl River Delta for (a) 1990, (b) 2005, (c) 2020. (d) A–H represent eight spatial cells selected to characterize changes in SLUCs over a 30-year period.
Sustainability 15 00392 g003
Figure 4. Box plot of SLUCs in the study area for the 1990–2020 period.
Sustainability 15 00392 g004
Figure 5. Spatial distribution of comprehensive SLUC intensity. (a) 1990–2005. (b) 2006–2020.
Sustainability 15 00392 g005
Figure 6. Interactions of different factors influencing SLUCs for (a) 1990–2005 and (b) 2006–2020.
Sustainability 15 00392 g006
Figure 7. Distribution of q-values for SLUCs in 2020 and comprehensive post-clustering of SLUCs with different numbers of clusters in (a) 1990–2005 and (b) 2006–2020.
Sustainability 15 00392 g007
Table 1. Factors driving differentiation in spatial land use conflicts (SLUCs).
Factor CategoryIndexCodeUnitSource
Topographical factorsSlopeX1degreeNASA (https://earthdata.nasa.gov/esds/competitive-programs/measures/nasadem) (accessed on 5 January 2022)
ElevationX2m
Climatic factorsAverage annual temperatureX3°CData Center for Resources and Environmental Sciences, Chinese Academy of Sciences (https://www.resdc.cn) (accessed on 12 January 2022)
Average annual precipitationX4mmScience Data Bank [44] (https://www.scidb.cn/cstr/31253.11.sciencedb.01607) (accessed on 12 April 2022)
Socio-economic factorsGross domestic product (GDP)X5yuanData Center for Resources and Environmental Sciences, Chinese Academy of Sciences (https://www.resdc.cn) (accessed on 23 January 2022)
Population densityX6people/km2
Environmental factorsNormalized difference vegetation index (NDVI)X7/Data Center for Resources and Environmental Sciences, Chinese Academy of Sciences (https://www.resdc.cn) (accessed on 28 April 2022)
Location factorsDistance to riverX8kmOpenStreetMap (https://www.opens-treet-map.org/) (accessed on 20 May 2022) and National Basic Database in 2005
Distance to urban centerX9km
Distance to major roadX10km
Distance to railwayX11km
Distance to nature reserveX12km
Table 2. Changes in the level of SLUCs from 1990 to 2020.
Conflict LevelCell NumberArea Proportion (%)Change Rate (%)
1990200520201990200520201990–20052005–2020
Stably controllable27662992315630.2332.7034.502.471.79
Relatively controllable39753679426843.4540.2146.65−3.246.44
Relatively uncontrollable22952429169225.0826.5518.491.46−8.06
Severely uncontrollable11349331.240.540.36−0.70−0.17
Table 3. Univariable factorial explanatory power (q-value) of different factors driving spatial differentiation of SLUCs.
Driving FactorX1X2X3X4X5X6X7X8X9X10X11X12
1990–20050.8040.7870.6290.0540.6040.4670.6290.0520.3840.1070.160.156
2006–20200.7680.750.610.0570.2960.330.6880.0510.2870.250.1760.126
All q-values passed the significance test of 0.001.
Disclaimer/Publisher’s Note: The statements, opinions and data contained in all publications are solely those of the individual author(s) and contributor(s) and not of MDPI and/or the editor(s). MDPI and/or the editor(s) disclaim responsibility for any injury to people or property resulting from any ideas, methods, instructions or products referred to in the content.

