Article

Research on Spatial Difference, Distribution Dynamics and Influencing Factors of Urban Water-Use Efficiency in the Yellow River Basin

Business Administration School, Shandong University of Finance and Economics, Jinan 250014, China
*
Author to whom correspondence should be addressed.
Sustainability 2023, 15(1), 405; https://doi.org/10.3390/su15010405
Submission received: 4 November 2022 / Revised: 13 December 2022 / Accepted: 20 December 2022 / Published: 26 December 2022
(This article belongs to the Section Sustainable Water Management)

Abstract

:
This study creatively uses the Dagum Gini coefficient, Kernel density estimation, and Markov chain to measure the spatial difference and distribution dynamics of urban water-use efficiency in the Yellow River Basin from 2008 to 2018 accurately and also analyzes its formation mechanism by using the Spatial Durbin Model. The results show that the hypervariable density and the intraregional differences constitute the main source of regional differences in the whole basin; the dynamic evolution characteristics of the urban water-use efficiency distribution in different reaches are different. The spatial factors have a non-negligible impact; the urbanization process and population density spatial spillover effects are negative in the state of spatial interaction; the spillover effect of upgrading the industrial structure is positive; the direct and spillover effects of openness are both positive; and the direct effect of the water-use structure is positive. In order to improve the urban water-use efficiency in the Yellow River Basin, it is necessary to comprehensively promote new urbanization, upgrade industrial structures, promote energy conservation and emission reduction, construct business environments, and establish an inter-regional coordination mechanism.

1. Introduction

Water is the source of life, essential to production, and the foundation of ecology. China’s per capita freshwater resources are only 1/4 of the world average, while the Yellow River Basin per capita is only 27% of the national average in China. With the rapid advancement of urbanization in the Yellow River Basin, urban water demand continues to rise, making the contradiction between the supply and demand of water resources in the cities located near the basin increasingly prominent. On the other hand, traditional extensive development has led to low water-use efficiency in river basin cities, which is prominently manifested in the high intensity of urban water consumption and the increased pressure on water ecology. Since 2006, the rate of water resource development and utilization in the Yellow River Basin has remained above 70%, far exceeding the internationally recognized warning line of 40%, while urban water pollution has a tendency to spread from dots to bands and areas [1]. Facing a severe supply and demand situation relating to water resources and the current situation of water use in the Yellow River Basin, and taking into account the resource aggregation and the development of the highland functions of the river basin cities in the development of the whole region, new approaches must be considered in relation to the Yellow River Basin urban water resources that can achieve the harmonious development of the economy, resources, environment, and ecological and green intensive use; that is, improving the efficiency of urban water use in the Yellow River Basin under the constraints of both resources and the environment, has become an important issue facing urban development and river basin development.
Urban water-use efficiency is a comprehensive reflection of the degree of material circulation and the energy exchange between the various elements within the urban water-use system, and it is a direct manifestation of the degree of realization of the value of water resources in the process of urban economic development. Improving urban water-use efficiency is an inevitable requirement for the implementation of innovation and green development, as well as the concept and approach of promoting the development of the urban economy and the entire national economy.
Existing studies have explored the measurement of urban water-use efficiency, spatiotemporal characteristics, and influencing factors. In the measurement of urban water-use efficiency, scholars have gradually transitioned from a single indicator to a comprehensive measurement of multiple input factors and outputs; that is, the evaluation has evolved from single-factor water-use efficiency to full-factor water-use efficiency, which is more in line with the water-resource economy. In accordance with the actual operation of the urban economy, Data Envelopment Analysis (DEA) in the frontier production function method has gradually become the mainstream method. In addition, scholars also include the pollutant emissions generated during the utilization of urban water resources in the context of green development in their investigations. Since the DEA-U-SBM model has overcome the traditional DEA model, which does not consider slack variables and “undesirable” output problems, the model has been widely introduced as a measure of efficiency. For example, based on a provincial-scale study, Ding Xuhui et al. showed that when considering pollution discharge from 2003 to 2015, the water-use efficiency showed a U-shaped change characteristic, and the efficiency of the provinces of the northwest was relatively low in China [2]. Studies by Sun Dongying et al. have shown that the industrial water-use efficiency of cities in the Yangtze River Delta, while also considering undesirable outputs, has decreased significantly between 2005–2014 than without considering the undesirable outputs [3]. Research on the spatiotemporal characteristics of urban water-use efficiency shows that the overall urban water-use efficiency in China is low, the water-resource-use system has overcome the extensive mode, and input redundancy and output shortages are obvious [4,5,6]; the difference between the water-use efficiency among cities is relatively large and shows a decreasing pattern among eastern, western, and central regions in China, and the comprehensive urban water-use efficiency at different administrative levels shows a decreasing pattern among municipalities, prefecture-level cities, and provincial capital cities [7]; there are significant differences in water-use efficiency among economically specialized cities, heavy industry cities, and comprehensive function cities [8]. In particular, after considering the carrying capacity of water resources, the middle reaches of the Yellow River Basin have a lower water-use efficiency among the eight economic zones in China due to the influence of developmental foundations and industrial structures [9]. In addition to the environmental attribute factors, such as natural geography and basic regional hydrological conditions, factors such as urbanization, industrial infrastructure upgrades, regional openness, population density, technological progress, and environmental regulation are also included in the empirical analysis. Among them, the development of urbanization has a significant impact on the water cycle of the river basin in China [10], and the impact of the process and quality of urbanization on urban water-use efficiency is different between urban locations and administrative levels [11]. Optimizing the water-use structure, upgrading the industrial structure, and actively developing water-saving and sewage treatment technologies are effective means to improve urban water-use efficiency in China [12,13,14,15]. Moreover, economic openness has a positive role in promoting water-use efficiency in large and medium-sized cities in China [16,17]. Furthermore, the economic development level and industrial structure upgrades exert a large positive impact on urban water-use efficiency in China [18].
There have still been breakthroughs in the research relating to the spatial scale, measurement methods, spatial difference characteristics, the dynamic evolution of distribution, and influencing factors, such as a lack of in-depth attention to urban water-use efficiency in the Yellow River Basin. Furthermore, the fact that the traditional DEA-U-SBM model ignores the reordering of effective decision-making units means that it is necessary to describe the spatiotemporal differences in urban water-use efficiency from the perspective of the dynamic evolution of distribution. Moreover, the mechanism of influencing factors needs to include the spatial interaction effects in the research. These are the prerequisites for clarifying the current situation of urban water-use efficiency in the Yellow River Basin and proposing targeted improvement measures.
Therefore, this study takes cities at the prefectural level and above in the Yellow River Basin as the research object. Based on the measurement of urban water-use efficiency, the Dagum Gini coefficient and its decomposition are used to analyze the characteristics of the spatiotemporal differences, and Kernel density estimation is used to explore the dynamic evolution of urban water-use efficiency in the Yellow River Basin. The Spatial Durbin Model was used to examine the mechanisms of the related influencing factors and to propose relevant countermeasures and suggestions with a view to providing references for improving the urban water-use efficiency in the basin and promoting the overall high-quality development of the basin. Marginal innovations of this research are as follows: the first is to measure Yellow River Basin urban water-use efficiency accurately and exhibit its distribution dynamic evolution characteristics, and the second is to measure the direct and indirect effects of the factors affecting urban water-use efficiency in the Yellow River Basin, and further clarify the formation mechanism of urban water-use efficiency in the Yellow River Basin.

2. Research Methods, Index Selection and Data Sources

2.1. Urban Water-Use Efficiency Measurement Methods and Indicators

In this study, the SE-U-SBM method based on serial DEA was used to measure the urban water efficiency of the Yellow River Basin. The best frontier of the SE-U-SBM based on serial DEA is determined by using the input–output data of the current period and all of the previous periods. This method conforms to the assumption that “technology will not be forgotten” and comprehensively overcomes the shortcomings of traditional DEAs that do not consider the undesirable output and slack variables and cannot distinguish between effective decision-making units [19,20]. According to the concept of urban green intensive development under the constraint of water resources and the concept of total factor efficiency, the input variables for measuring urban water-use efficiency are fixed asset input, population, urban land area, and the total water supply of the city. These input variables refer to, respectively, investment in capital, population, land, and water resources in urban development; the desirable output is urban GDP and green area, and the “undesirable” output is industrial wastewater discharge. The fixed asset investment in the municipal district adopts the stock indicators calculated using the perpetual inventory method, and the depreciation rate is 9.6% [21]. Due to the lack of data on the urban caliber, industrial wastewater is approximately replaced by the municipal administrative district. The relevant economic data have been processed to eliminate inflation. Considering the availability of parallel data, this study selects a sample of 82 cities across the Yellow River at the prefecture level and above administrative level provided by the “China Urban Statistical Yearbook” and “China Urban Construction Statistical Yearbook”.

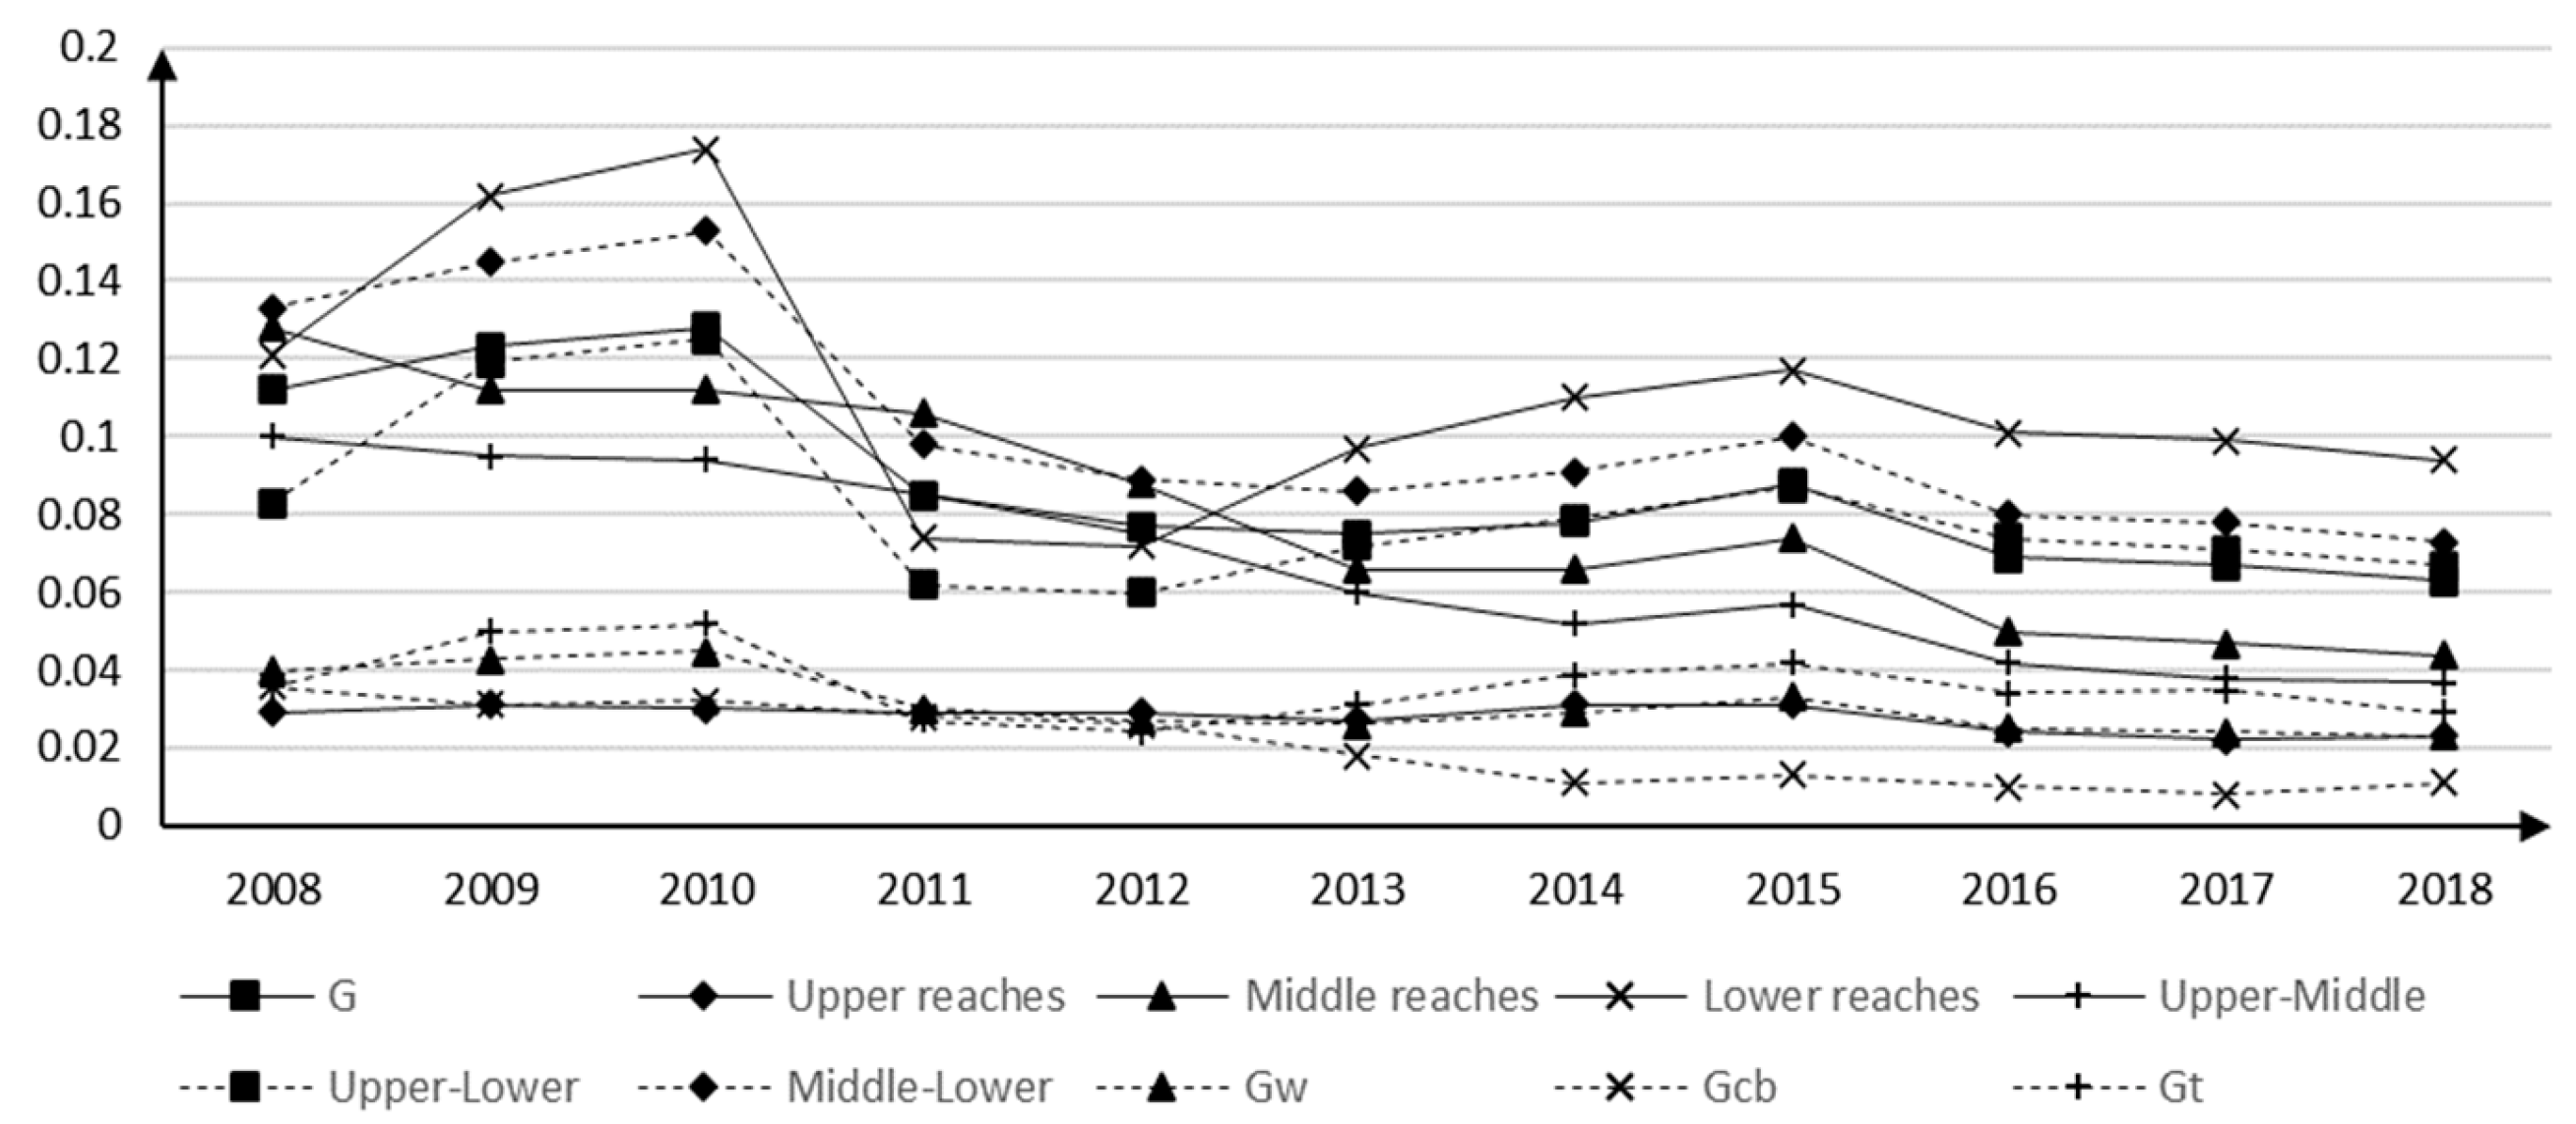
2.2. Dagum Gini Coefficient and Its Decomposition

Based on the Dagum Gini coefficient and its decomposition, this study reveals the composition and the source of the spatial differences in urban water-use efficiency in the Yellow River Basin. The calculation method of the Dagum Gini coefficient is shown in Formula (1):
G = j = 1 k h = 1 k i = 1 c j r = 1 c h | y j i y h r | / 2 c 2 y ¯
where y ji (yhr) represents the urban water-use efficiency in area j ( h), c is the number of research cities, y is the weighted average value of the research into a city’s water-use efficiency (the weight is based on the population of the municipal district), k is the number of regions, and c j ( ch) is the number of cities in the j(h) region. The Dagum Gini coefficient can be decomposed into the intra-regional difference contribution (G), the inter-regional net value difference contribution ( Gcb), and the hypervariable density contribution ( Gt) according to the subgroup decomposition method; the calculation method used for each part is omitted. Compared with traditional Theil index decomposition, Dagum Gini coefficient decomposition fully takes into account the distribution of the subgroup samples and the overlap between the groups, improving the accuracy [22]. This study groups the cities according to the upper reaches, middle reaches, and lower reaches of the Yellow River Basin. The spatial node cities are Hohhot, where Hekou Town is located, and Zhengzhou, where Taohuayu is located. The study area is shown in Figure 1.

2.3. Kernel Density Estimation

As an important non-parametric estimation method widely used in spatial disequilibrium analysis, Kernel density estimation can reveal the dynamic evolution trend and law of sample distribution by comparing the sample distribution characteristics at different time points. Set the density function of random variable X as f (x), and the density function of point x is estimated using Formula (2). In this study, the Gaussian kernel function was selected to estimate the spatial distribution and evolution of urban water-use efficiency in the Yellow River Basin, as shown in Formula (3), where N, Xi, h, and K (x) are the number of observations, independent and identically distributed observations, bandwidth, and kernel function, respectively. The dynamic evolution characteristics of the distribution of urban water-use efficiency in the Yellow River Basin can be described in detail through the changes in the Kernel density estimation curve. In this paper, the distribution position reflects the urban water-use efficiency. The distribution form is used to analyze the spatial difference size and polarization degree of urban water-use efficiency. The height and width of the curve reflect the difference size, and the number of wave crests reflects the polarization degree. Distribution extensibility is used to describe the spatial difference between the cities with the highest water-use efficiency and others.
f ( x ) = ( 1 / N h ) i = 1 N K [ ( X i x ) / h ]
K ( x ) = ( 1 / 2 π ) exp ( x 2 / 2 )

2.4. Markov Chain and Space Markov Chain

Kernel density estimation can describe the overall shape and change trend of the sample distribution, and the Markov chain method reflects the dynamic changes in the relative position of the variables and the probability of state transition. The combination of the two can deeply describe the dynamic evolution of the distribution of specific variables. As the state space of the random process {X(t), tT}, for any ν values of time t, the Markov chain as the random process satisfies the following[M1] :
P { X ( t ν ) x ν   |   X ( t 1 ) = x 1 , , X ( t ν 1 ) = x ν 1 } = P { X ( t ν ) x ν   |   X ( t ν 1 ) = x ν 1 } , x ν R
where X(tν) is the conditional distribution function under condition X(ti) = xi. If the urban water-use efficiency of the Yellow River Basin is divided into N types, the dynamic evolution of the state transition probability matrix of the urban water-use efficiency of the Yellow River Basin can be further judged by constructing the N × N dimensional Yellow River Basin urban water-use efficiency state transition probability matrix using the Markov chain. Existing studies have shown that urban water-use efficiency has similar clustering characteristics [23], which means that it is necessary to include spatial factors when measuring the probability of a specific urban water-use efficiency state transition. The spatial Markov chain combines the traditional Markov method with the concept of spatial lag and includes the influence of the surrounding areas and spatial interaction factors in the investigation. It takes the spatial lag type k of area i at time t as the condition and decomposes the traditional N × N Markov matrix into N × N × N conditional transition probability matrices, where the matrix elements specifically represent the probability of transition from type i to type j in year t +1.
The spatial lag value in the spatial Markov chain is mostly obtained by multiplying the observed value of each unit by the spatial weight matrix. The spatial weight matrix used in this study is formed by taking the reciprocal of the linear distance between the cities in a dimensionless process, and the calculation basis is the latitude and longitude coordinates of the city center.

2.5. Spatial Durbin Model

This study constructs the Spatial Durbin Model (SDM) shown in Formula (5) to examine the mechanism of the influencing factors affecting urban water-use efficiency in the Yellow River Basin under the spatial interaction state and the explained variable on the left side of the equation is urban water-use efficiency (WUE). The Wald test and LR test can be used to check whether the spatial Durbin model can be simplified into the spatial lag model and the spatial error model. From the perspective of all factors, the use of urban water resources is embedded in the process of urban economic and social operations, and water-use efficiency is the result of the comprehensive ecological effects of urban development. Drawing on previous scholars’ research, the explanatory variables on the right side of the equation include urbanization (URB), industrial structure upgrade (IND), openness (OPE), population density (PDE), regional environmental regulations (REG), and water structure (WST). These variables are described in turn by the following numerical values: the proportion of the population of the municipal district in the urban population, the proportion of the added value of the secondary and tertiary industries in the municipal district’s GDP, the actual urban utilization of foreign capital (average annual exchange rate) and GDP ratio, the population density of the municipal district (In logarithmic form), the ratio of the urban industrial wastewater discharge to the production and operation water consumption, and the proportion of urban production and operation water consumption to the total water supply. The original data of this study were taken from the “China Statistical Yearbook”, “China City Statistical Yearbook”, “China City Construction Statistical Yearbook”, and related provincial statistical yearbooks; the time span is 2008–2018. Individual missing values were filled using the linear trend value method.
W U E i t = δ j = 1 n W i j W U E j t + β 1 U R B i t + β 2 I N D i t + β 3 O P E i t + β 4 P D E i t + β 5 R E G i t + β 6 W S T i t + θ 1 j = 1 n W i j U R B j t + θ 2 j = 1 n W i j I N D j t + θ 3 j = 1 n W i j O P E j t + θ 4 j = 1 n W i j P D E j t + θ 5 j = 1 n W i j R E G j t + θ 6 j = 1 n W i j W S T j t + μ i + λ t + ε i t

3. Empirical Results and Analysis

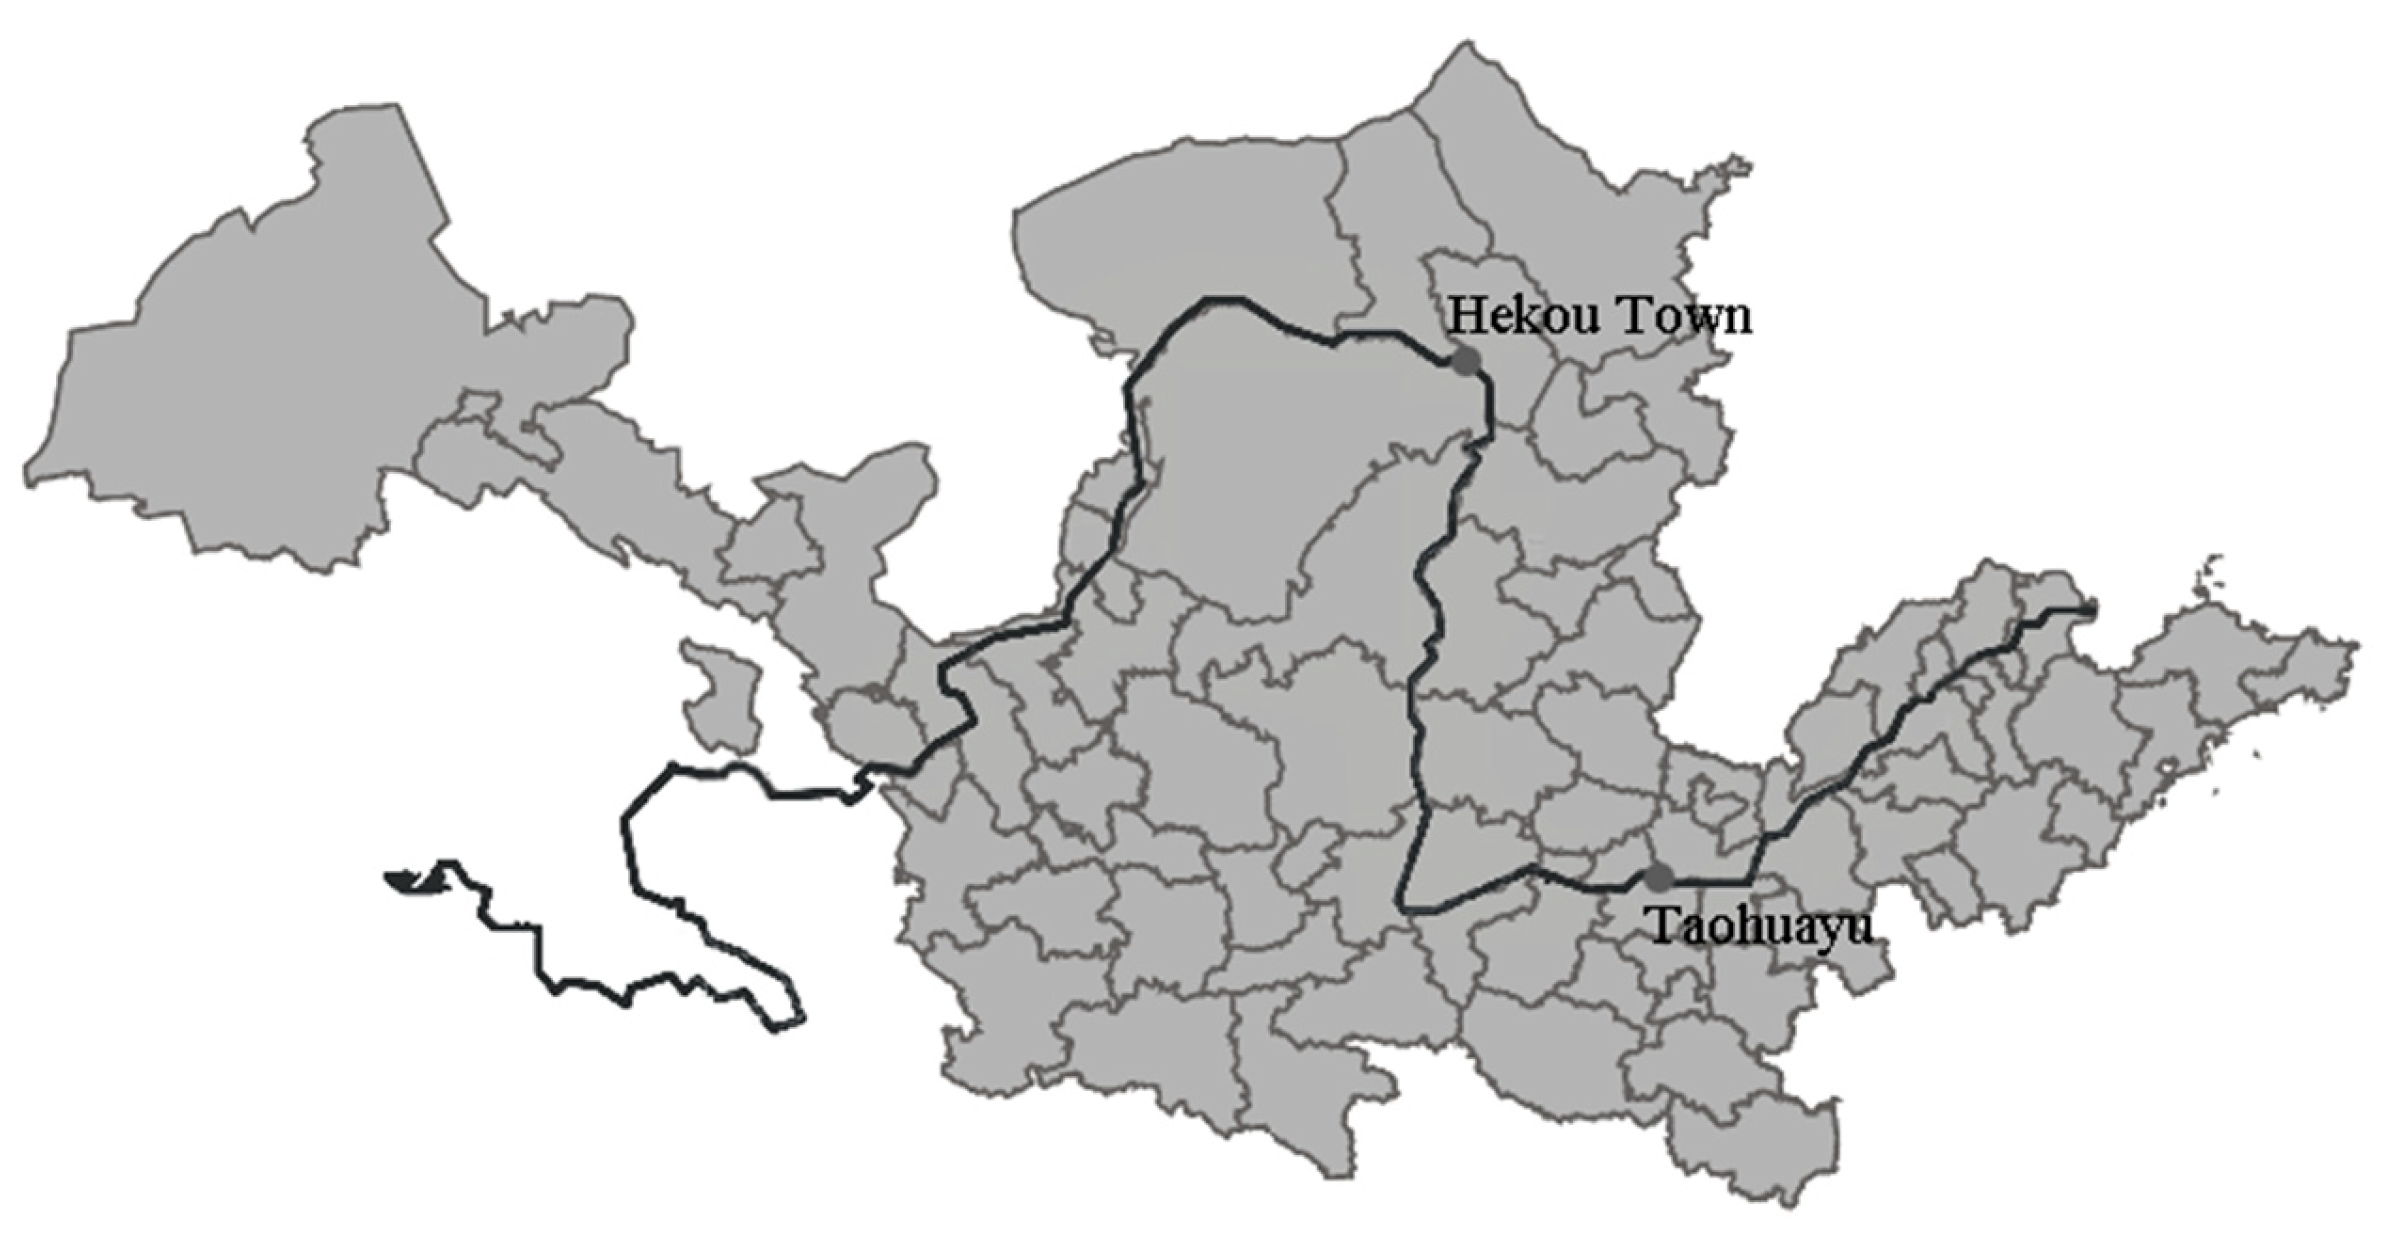
3.1. Spatiotemporal Characteristics and Evolution Trend of Urban Water Efficiency in the Yellow River Basin

The results of the SE-U-SBM method based on the sequence DEA show that the overall urban water-use efficiency of the Yellow River Basin had a fluctuating upward trend during the investigation period, and the urban water-use efficiency within the basin presents the characteristics of U-shaped changes in the upper reaches, wavelike rises in the middle reaches, and alternations of descending and ascending in the lower reaches (the annual data for each city are available upon request). In addition, the urban water-use efficiency of the Yellow River Basin has the characteristics of spatial imbalance, and the water-use efficiency values are staggered in the cities that are at different levels. High-value and medium-high-value regions are concentrated in central and western Gansu, central Shaanxi, Ningxia, central Inner Mongolia, central and northern Shanxi, southern Henan, Shandong provincial metropolitan area and Jiaodong region, while low-value regions are located in central Henan and western Shandong.
Figure 2 and Table 1 further report the overall difference in the urban water-use efficiency in the Yellow River Basin from 2008 to 2018, and the subgroup decomposition results were calculated based on the Dagum Gini coefficient and the decomposition method. During the inspection period, the urban water-use efficiency of the Yellow River Basin had obvious differences, but there was a trend of fluctuating shrinking. At the end of the inspection period, the Gini coefficient of urban water-use efficiency in the Yellow River Basin in 2018 decreased by 43.75% compared with 2008. According to the interior of the basin, the difference in the urban water-use efficiency of the upper reaches was relatively stable in 2015 and before, and the difference decreased significantly after 2015. Cities with inefficient water use had a catch-up effect on the leading cities, and the Gini coefficient at the end of the period dropped by 20.69% from the beginning of the period; the difference in urban water-use efficiency in the middle reaches shows a fluctuating downward trend, and the final Gini coefficient dropped by 65.62% compared with the beginning of the period. The difference in the urban water-use efficiency of the lower reaches shows an “M” trend of alternating ups and downs, and the final Gini coefficient dropped by 22.31% compared with the beginning of the period. The average value of the Gini coefficient of the urban water-use efficiencies in the inner of the upper, middle, and lower reaches are 0.028, 0.081, and 0.111. The difference in the urban water-use efficiency between the middle and lower reaches is more significant, which is related to the urbanization process of the middle and lower reaches and the difference in the economic foundation of the city. The inter-regional Gini coefficient shows that the difference in the urban water-use efficiency between the upper reaches and middle reaches shows a steady downward trend. The difference between the upper reaches and lower reaches shows a characteristic of first increasing and then decreasing when using 2010 as the boundary. The difference between the middle reaches and lower reaches shows an alternating pattern of rising and falling; the Gini coefficient between the regions during the survey year showed a downward trend. The final value of the Gini coefficient of urban water-use efficiency among the upper-middle reaches, upper-lower reaches, and middle-lower reaches decreased by 63.00%, 19.28%, and 45.11%, respectively, from the initial value. During the inspection period, the average Gini coefficients of the urban water-use efficiencies among the upper-middle reaches, upper-lower reaches, and middle-lower reaches were 0.067, 0.082, and 0.102, respectively, with the most obvious difference being in the middle reaches and lower reaches. During the inspection period, the hypervariable density constitutes the main source of the internal difference between the urban water-use efficiency in the Yellow River Basin, the average difference of it during the inspection period is 0.036, and the average contribution rate is 41.99%; the second is the differences within the region, the mean difference, and the mean contribution rate of it, which are 0.031 and 35.97%, respectively; the last is the differences between the regions, the mean difference and the mean contribution rate of it are 0.020 and 22.04%, respectively.

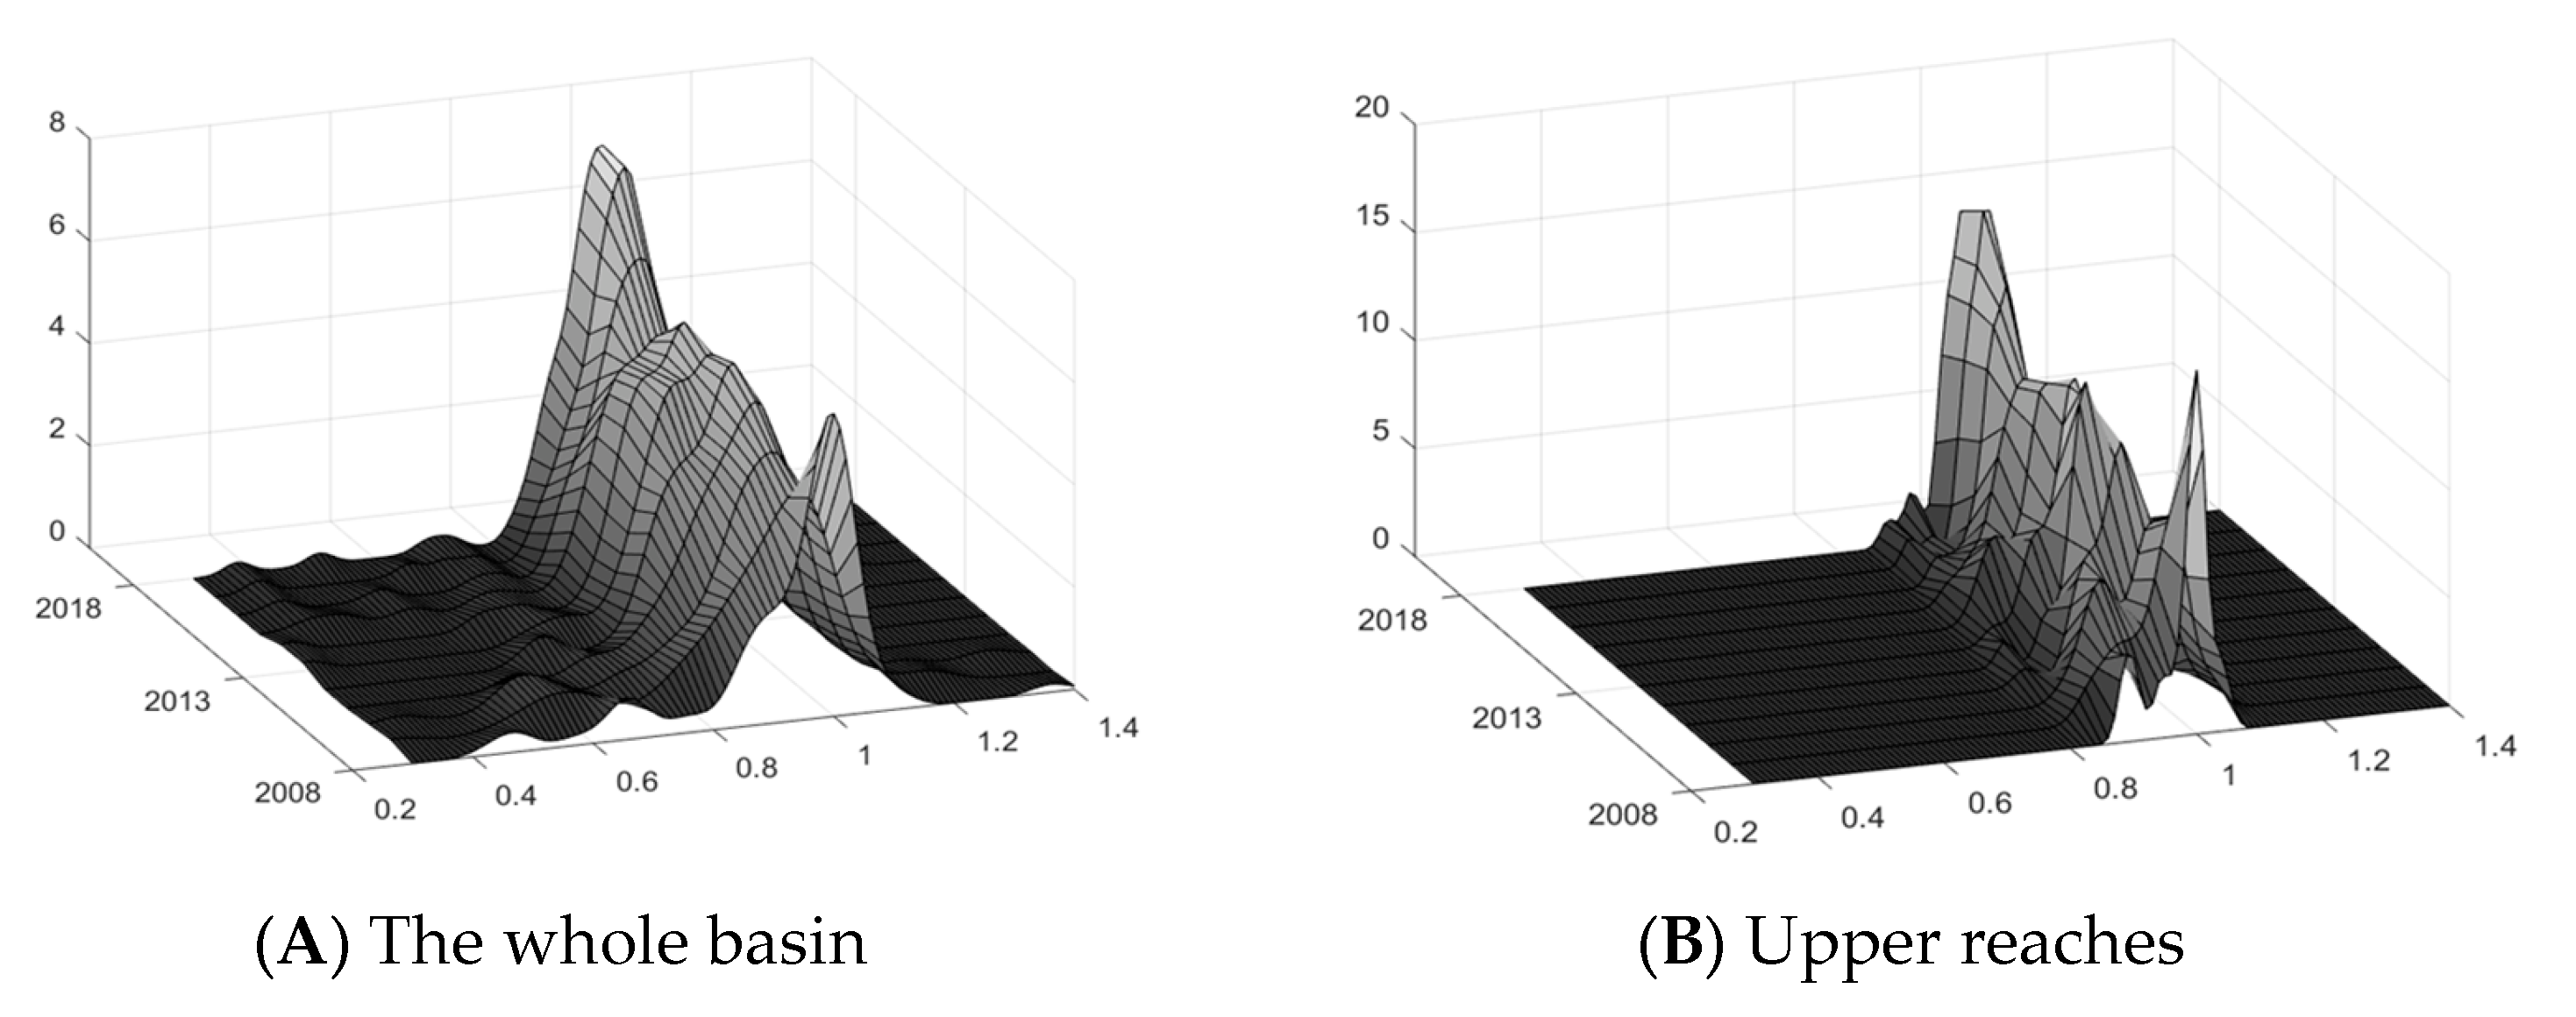
3.2. Dynamic Evolution of Urban Water-Use Efficiency Distribution in the Yellow River Basin Based on Kernel Density Estimation

Figure 3 reports the Kernel density estimation results of urban water-use efficiency in the whole river basin and the upper reaches, middle reaches, and lower reaches. From the perspective of the distribution position, the overall distribution curve of urban water-use efficiency for the entire river basin and the lower reaches during the investigation period showed a slight right trend over time, indicating that the urban water-use efficiency of the entire Yellow River Basin and the lower reaches improved. The overall distribution curve of the upper reaches and middle reaches did not move significantly over time. The efficiency of urban water use still needs to be improved, especially with the tightening of resource and environmental constraints and the acceleration of urbanization, and it is more important to expand development space by saving water. The distribution pattern shows that the overall distribution curve of urban water-use efficiency for the whole basin, middle reaches, and lower reaches shows that the main peak height rises and the width decreases, and the internal dispersion of water-use efficiency for the whole basin sample and the cities of the middle reaches and lower reaches are gradually decreasing. The height of the main peak in the upper reaches alternates between high and low while the width decreases, and the absolute difference in the urban water-use efficiency of the upper reaches also has a certain narrowing trend. The characteristics of distribution ductility show that the distribution curves of the whole basin, middle reaches, and lower reaches have different degrees of left-tailing phenomenon, and the water-use efficiency of some cities is obviously low. Among them, the extension of the distribution curve of the whole basin and lower reaches are not obvious, and the distance between the cities with higher water-use efficiency and other cities is relatively stable. The distribution curve of the middle reaches has the characteristics of extended convergence, and the distance between the cities with higher water-use efficiency and the cities with the average level has been reduced. The tailing phenomenon of the upper reaches distribution curve is not obvious and has the characteristic of extension convergence. There are no cities with significantly higher or lower water-use efficiency in the upper reaches, and the distance between the leading cities in water-use efficiency and the average level has narrowed. From the perspective of the polarization characteristics, the distribution curves of the whole river basin during the survey year showed a bimodal or multi-peak phenomenon. The urban water-use efficiency has a certain degree of multi-polarization characteristics, and the gap between the main peak and the side peaks is relatively large. The middle reaches and the lower reaches distribution curves have a single peak at the beginning of the period, and there is no obvious polarization at this time, but at the end of the period, the distribution curve has a multi-peak pattern, and the difference between the main peak and the side peak is relatively large, and there is a specific city leading pattern inside. The upper reaches distribution curve shows a single peak characteristic as a whole, and the internal difference in water-use efficiency of upper reaches is relatively small.

3.3. Dynamic Evolution of Urban Water-Use Efficiency Distribution in the Yellow River Basin Based on Markov Chain and Spatial Markov Chain Estimation

The quartiles are used to classify the urban water-use efficiency of the Yellow River Basin into four categories: low, medium–low, medium–high, and high, which are marked as four types of spatial lags: Ⅰ, Ⅱ, Ⅲ, and Ⅳ. Table 2 reports the traditional Markov chain (without Space lag) and the maximum likelihood estimation results of the transition probability of the spatial Markov chain. The calculation results of the traditional Markov transition matrix show that the probability of a smooth transition (maintaining its own level) and an upward transition of type Ⅰ during the observation period are 86.2% and 13.9%; the probability of a smooth transition of type Ⅱ is 73.5%, and the probability of a downward transition is 12.0 %, the probability of upward transition is 14.5%; the probability of type III smooth transition is 72.0%, the probability of downward transition is 13.0%, and the probability of upward transition is 15.0%; the probability of type IV smooth transition and downward transition are 82.4% and 17.6%, respectively. The diagonal value is significantly higher than other values in the same line, indicating that the degree of the mobility of urban water-use efficiency in the Yellow River Basin is generally not high, but there is the possibility of transition to neighboring states and even small opportunities for cross-level changes.
The calculation results of the spatial Markov transition matrix show that the values on the diagonal are still significantly higher than other values in the same row. In other words, the probability of each type remaining in the original state after considering the space factor is also higher than its up/down transition probability. Under the state of spatial interaction, urban water-use efficiency in the Yellow River Basin has a stable state and a phenomenon of “club convergence”. Compared with the numerical value of the traditional Markov transition matrix, the calculation results of the spatial Markov transition matrix have changed. For example, in the traditional Markov transition matrix, the probability of type I maintaining its own low-level state during the observation period is 86.2%. After considering different spatial lag factors, the probability of maintaining one’s own state in type I are 87.8%, 85.5%, 79.3%, and 78.9%, respectively, which shows that the water-use efficiency of neighboring cities can have an impact on the local area, and different state fields will lead to different intensity of influence.
In general, this spatial influence has the following characteristics: (1) Affected by the accelerated flow of factors between the regions, being neighbors with high-level cities will increase the probability of the upward transfer of local cities’ water-use efficiency. On the contrary, being adjacent to a low-level city will increase the probability of a downward shift in the water-use efficiency of the local city. With the increase in the spatial lag type, the probability of the lowest grade type I transferring upward is 12.2%, 14.5%, 20.6%, and 21.1%, showing a gradual increase, and the probability of type III transferring downward is 31.8%, 12.9%, 4.5%, and 3.8%, showing a gradual shrinking trend. (2) The positive and negative effects brought about by the observation type above and below the level are asymmetric, and there are differences between cities of different types. For type II, when the spatial lag type is I, the probability of downward transition is 15.1%, and when the spatial lag type is III and IV, the probability of upward transition is 16.0% and 20.7%, respectively, which shows that the upward transition probability of neighboring high-level cities is greater than the downward transition probability of neighboring low-level cities. However, the opposite is true for type III. When the spatial lag type is I and II, its downward transition probability is 31.8% and 12.9%, respectively, and when the spatial lag type is Ⅳ, its upward transition probability is 8.8%, which shows that the upward transition probability of neighboring high-level cities is less than the downward transition probability of neighboring low-level cities. This means that it is necessary to adapt measures according to the local conditions to encourage the positive spillover effect of leading efficiency cities, strengthen the acceptance capacity of relatively backward cities, and promote the intensive and efficient use of urban water resources in the Yellow River Basin in a larger space.

3.4. Analysis of Influencing Factors of Urban Water-Use Efficiency in the Yellow River Basin Based on the Spatial Durbin Model

The spatial Markov chain estimation results show that the urban water-use efficiency of the Yellow River Basin has spatial interaction characteristics; that is, the urban water-use efficiency is not spatially independent, and the analysis of its driving mechanism needs to include spatial factors. Table 3 reports the estimation results of the Spatial Durbin Model with urban water-use efficiency as the explained variable. Among them, the Wald test and LR test, which the Spatial Durbin Model simplified to the spatial lag model and the spatial error model, reject the null hypothesis at a 1 % significance level, indicating that the Spatial Durbin Model is more suitable for the data, and the Hausman test results support the time fixed effects model. The results of the correction based on the conversion estimation method of Lee and Yu [24] show that the water-use efficiency of a particular city is not only affected by the local, related explanatory variables but also by the explanatory variables of neighboring cities. In this case, the direct effect and indirect effect of the explanatory variable need to be described by the method used for solving the partial differential, and the specific results are shown in Table 4. The direct effect here refers to the influence of any given explanatory variable in a region on the explained variable in this region, while the indirect effect (spatial spillover effect) refers to the influence of explanatory variables on the explained variable in other regions through spatial interaction.
Table 4 shows that the direct effect of urbanization on urban water-use efficiency in the Yellow River Basin is positive but has not passed the significance test (p > 0.10). The urbanization process promotes the spatial agglomeration of factors and regional innovation capabilities, but it will also increase the loss of water resources and the discharge of pollution, which will exert downward pressure on the efficiency of urban water use. Based on the basic conditions of the water resources of the Yellow River Basin, it is of urgent importance to implement water-based urbanization and water-based production to improve urban water-saving and pollution-control capabilities. The spillover effect of urbanization is significantly negative (p < 0.05), partly because the development of a particular city will cause resource absorption and pollution externalities to the surrounding cities to a certain extent. Therefore, starting from improving water-use efficiency, it is necessary to coordinate the urbanization development process of the river basin and reasonably determine the urban spatial layout. The direct impact of industrial structure upgrading on urban water-use efficiency is negative but not significant (p > 0.10). Constrained by the development basis of agricultural production and energy development, there are certain resistances to the upgrading of industrial structures in the Yellow River Basin, and the eco-friendly industrial system needs to be further established and improved. The spillover effect of upgrading industrial structures was significantly positive (p < 0.05). The upgrading of the industrial structure of specific cities will help to form innovative demonstrations and new kinetic energy spillovers in a larger space and promote the improvement of water-use efficiency in surrounding cities. Both the direct and indirect effects of openness are significantly positive (p < 0.05). Increased openness means that the regional business environment is optimized, and resources can be integrated into a larger space, thereby promoting the optimal allocation of innovation resources between cities. However, in the process of improving the regional business environment and openness, it is also necessary to pay attention to the possible congestion costs. At the same time, the concept of resource conservation and environmental friendliness should be established in the process of attracting investment to avoid negative impacts on urban water-use efficiency. The direct effect of population density on urban water-use efficiency in the Yellow River Basin is negative but not significant, while the indirect effect is significantly negative (p < 0.01). The increase in water demand and environmental pressure caused by population density growth is not conducive to improving urban water-use efficiency. In addition, population density growth in a specific area will also exert downward pressure on water-use efficiency in surrounding areas due to resource siphonage and pollution externalities. The direct and indirect effects of environmental regulations are not significant (p > 0.10). This requires strengthening the water pollution control of the Yellow River Basin and establishing a comprehensive pollution control mechanism for the entire production through regulation and technological innovation diffusion. The direct effect of the water-use structure is positive at a significant level of 10%, while the indirect effect is not significant. Optimizing the structure of urban water use through price systems on the basis of giving priority to ensuring residential water use will help improve urban water-use efficiency.

4. Conclusions and Discussion

4.1. Conclusions

To improve urban water-use efficiency in the Yellow River basin, it is necessary to describe its spatial difference characteristics and formation mechanism. This study accurately measures the urban water-use efficiency of the Yellow River Basin using the SE-U-SBM method based on serial DEA, and the Dagum Gini coefficient and its decomposition show that the differences in the middle reaches and lower reaches are more obvious from 2008 to 2018; hypervariable density and intra-regional differences constitute the main sources of the regional differences. The Kernel density estimation and Markov chain calculation results show that there is a clear “club” convergence phenomenon in urban water-use efficiency in the Yellow River Basin. There are certain differences in the dynamic evolution characteristics of urban water-use efficiency distribution across different regions, and spatial factors have a non-negligible impact on urban water-use efficiency in the Yellow River Basin. Neighboring high (low)-level cities will increase the probability that the water-use efficiency of the local cities will shift upwards (downwards). Asymmetric positive and negative effects of levels above and below current observation types differ among cities of different types. After considering the spatial interaction, the spatial spillover effect of the urbanization process and population density on urban water-use efficiency in the Yellow River Basin is negative; the spillover effect of upgrading industrial structures is significantly positive; the direct effects and spillover effects of openness are both significantly positive; the direct effects and spillover effects of environmental regulations are not significant; the direct effect of the water-use structure is significantly positive.

4.2. Discussion

Urban water-use efficiency focuses on the performance of urban development under the constraints of water resources and the environment. Improving urban water-use efficiency is a systematic project, including water saving, pollution control, and economic and social development. Based on the basic water conditions that there are more people and less water in the cities of the Yellow River basin, improving the water-use efficiency of cities must be guided by intensive conservation and green development, and deeply implement the most stringent water management system, strictly implement the “three red lines”, take water resources management double control actions from the total water consumption and intensity, and use water to determine production. Moreover, from the development of new urbanization, upgrading industrial structures, the promotion of energy saving and emission reduction, and the construction of business environments as well as building and improving social-ecological systems for improving water resource performance in the river basin cities.
First, give play to the guiding and agglomeration effects of urbanization and encourage the tapping of the existing urban water resources. Moreover, further strengthen water resource constraints in the construction of urbanization, promote the creation of water-saving carriers such as urban communities and parks, and optimize the inherent urban carrying capacity and endogenous development momentum [25]; further improve the urban spatial layout and promote the reasonable distribution of population in different cities and towns in the basin; improve the water resources and water ecological early warning system for urban development; and reasonably control the scale to avoid the environmental and social congestion effects caused by the excessive concentration of population.
Secondly, according to local conditions, promote the upgrading of the industrial structure of cities, develop a circular economy within the river basin, and comprehensively promote water conservation and pollution control [26]. Strictly implement the relevant national industrial policies and environmental policies, combine the actual conditions of the city to effectively promote the integration of informatization and industrialization, increase the effective embedding of advanced production factors into the local industrial base, and vigorously develop resource-saving and environmentally friendly modern manufacturing and service industries, establish and improve a modern industrial system guided by green ecology, and increase the output contribution rate of human resources and intellectual capital; vigorously promote ecological treatment and restoration technologies according to the actual conditions of regional cities, and improve the circular economy in the basin, in the process of urban development and industrial upgrading, establish the idea of focusing on the process of water pollution prevention and combine it with terminal treatment, and encourage enterprises to implement cleaner production and water recycling; improve urban pipe network transformation and promotion of water-saving appliances, meanwhile, speed up the construction of urban domestic sewage treatment and reclaim water utilization facilities, and promote the recycling of sewage.
Thirdly, strengthen the concept of green development in the construction of the business environment, restrict and eliminate projects with high water consumption and high pollution, and guide the flow of foreign capital and innovation capital to high-tech and energy-saving environmental protection industries; further eliminate outdated production capacity, and improve the water-saving and consumption-reduction mechanism of enterprises and other business entities throughout the process; explore the pace of market-oriented reform of water resources, promote water rights transactions from regions, industries and water users, and at the same time integrate government and market functions to improve water-use efficiency in cities in the Yellow River Basin.
Finally, establish an inter-regional coordination and linkage mechanism for improving water-use efficiency in the Yellow River Basin. Relying on the natural ecological background to coordinate the utilization of water resources in the entire river basin and promote a more reasonable distribution of water resources among cities [27]; improve the ecological compensation mechanism in the water extract area and the water-use area, and improve multiple compensation methods; with the advantage of dense intellectual capital in central cities, demonstrate the effects of promoting the emergence and diffusion of new water-saving and pollution-control technologies, and form a benign regional coordination mechanism; for cities with relatively low water-use efficiency, they need to clarify their own key directions and areas for water conservation and pollution control, so as to establish a correction and withdrawal mechanism for inefficient water use, and ultimately optimize the local water-use structure and efficiency according to local conditions.

Author Contributions

Conceptualization, Z.J. and W.Y.; methodology, W.Y.; software, W.Y.; validation, Z.J.; formal analysis, Z.J.; investigation, Z.J.; resources, Z.J.; data curation, Z.J.; writing—original draft preparation, Z.J. and W.Y.; writing—review and editing, Z.J. and W.Y.; visualization, Z.J.; supervision, Z.J.; project administration, Z.J.; funding acquisition, Z.J. All authors have read and agreed to the published version of the manuscript.

Funding

This research was funded by the Natural Science Foundation of Shandong (No. ZR2021MG042).

Institutional Review Board Statement

Not applicable.

Informed Consent Statement

Not applicable.

Data Availability Statement

The data and estimation commands that support the findings of this paper are available upon request from the first and corresponding authors.

Conflicts of Interest

The authors declare no conflict of interest.

References

  1. Lin, L.Y.; Luo, H.Y.; Li, Q.; Zhang, F.Y.; Zhou, L.; Shi, Y.; Zhang, Y.J. Analysis on the pollution characteristics and causes of river basin. Environ. Monit. China 2015, 2, 57–63. [Google Scholar]
  2. Ding, X.H.; He, J.H.; Wang, L.Y. Inter-provincial water resources utilization efficiency and its driving factors considering undesirable outputs: Based on SE-SBM and Tobit model. China Popul. Resour. Environ. 2018, 1, 157–164. [Google Scholar]
  3. Sun, D.Y.; She, J.W.; Liu, L.Y.; Wang, H.M. Efficiency evaluation for industrial water use and analysis of the spatio-temporal differences in the Yangtze River Delta urban agglomeration. Resour. Environ. Yangtze Basin 2018, 9, 1901–1908. [Google Scholar]
  4. Wang, B.; Gong, M.L. A Study on the Efficiency of Urban Water Resource System in China—Based on the analysis of network BAM model. Ind. Econ. Rev. 2017, 5, 133–148. [Google Scholar]
  5. Wang, M.; Sun, C.; Wang, X. Analysis of the water-energy coupling efficiency in China: Based on the three-stage SBM-DEA model with undesirable outputs. Water 2019, 11, 632. [Google Scholar] [CrossRef] [Green Version]
  6. Ren, Y.F.; Fang, W.Y.; Wang, Y.Q.; Wang, X.K.; OuYang, Z.Y. Analysis of urban water resources use efficiency in China. Acta Sci. Circumstantiae 2020, 4, 1507–1516. [Google Scholar]
  7. Han, W.Y.; Chen, X.P.; Zhang, Z.L.; Wang, N.F.; Yu, Y.H. Analysis on spatiotemporal structure of water resources utilization efficiency of the prefecture level cities and beyond in China. Res. Soil Water Conserv. 2018, 2, 354–360. [Google Scholar]
  8. Shi, T.G.; Zhang, X.L.; Du, H.R.; Shi, H. Urban water resource utilization efficiency in China. Chinese Geogr. Sci. 2015, 6, 684–697. [Google Scholar] [CrossRef] [Green Version]
  9. Wang, X.F. Study of Water Resources Efficiency by Considering the Regional Water Carrying Capacity. Urban Environ. Stud. 2018, 2, 97–110. [Google Scholar]
  10. Chu, J.; Wang, J.; Wang, C. A structure–efficiency based performance evaluation of the urban water cycle in northern China and its policy implications. Resour. Conserv. Recycl. 2015, 11, 1–11. [Google Scholar] [CrossRef]
  11. Kan, D.X.; Lyu, L.J. Empirical study on influence of urbanization on water resources utilization. Urban Probl. 2018, 7, 4–12. [Google Scholar]
  12. Zhu, D.; Tang, L.; Xie, Q.W.; Ma, M.; Rao, K.F. Efficiency assessment of water resource utilization in the Chinese provincial capital cities based on data envelopment analysis. Acta Ecol. Sin. 2020, 6, 1–11. [Google Scholar]
  13. Wang, S.Y.; Xu, Y.P.; Wang, D.Q.; Gao, B.; Lu, M.; Wang, Q. Effects of industry structures on water quality in different urbanized regions using an improved entropy-weighted matter-element methodology. Environ Sci Pollut Res. 2020, 27, 7549–7558. [Google Scholar] [CrossRef]
  14. Yu, Y.G.; Liu, L.Y. Regional differences and influence factors of water resource efficiency in China: Based on super efficiency DEA-Tobit. Econ. Geogr. 2017, 7, 12–19. [Google Scholar]
  15. Yue, L.; Cao, Y.; Lyu, R. Influencing factors and improvement paths of green water use efficiency in the Yellow River Basin: A new perspective based on ecogeographical divisions. Environ. Sci. Pollut. Res. 2022, 9, 1–15. [Google Scholar] [CrossRef]
  16. Wang, J.T.; Zhao, L. The Research of resource intensive efficiency and influencing factors of cities in China. China Popul. Resour. Environ. 2009, 5, 45–52. [Google Scholar]
  17. Zhao, F.O.; Wu, Y.P.; Ma, S.; Lei, X.H.; Liao, W.H. Increased water use efficiency in China and its drivers during 2000–2016. Ecosystems 2022, 1, 1–17. [Google Scholar] [CrossRef]
  18. Ren, J.L.; Li, H.; Wu, X.M.; Li, X.S. Analysis of water use efficiency in the capital cities of the Yangtze River economic zone. China Popul. Resour. Environ. 2016, 5, 101–107. [Google Scholar]
  19. Huang, J.; Yang, X.; Cheng, G.; Wang, S. A comprehensive eco-efficiency model and dynamics of regional eco-efficiency in China. J. Clean. Prod. 2014, 3, 228–238. [Google Scholar] [CrossRef]
  20. Tulkens, H.; Eeckaut, P.V. Non-parametric efficiency, progress and regress measures for panel data: Methodological aspects. Eur. J. Oper. Res. 1995, 3, 474–499. [Google Scholar] [CrossRef] [Green Version]
  21. Zhang, J.; Wu, G.Y.; Zhang, J.P. The Estimation of China's provincial capital stock: 1952–2000. Econ. Res. J. 2004, 10, 35–44. [Google Scholar]
  22. Dagum, C. A new approach to the decomposition of the Gini income inequality ratio. Empir. Econ. 1997, 4, 515–531. [Google Scholar] [CrossRef]
  23. Hai, X.; Li, W.F.; Wang, Z.; Zhou, W.Q.; Han, L.J.; Qian, Y.G. Interactions between water use efficiency and urbanization level in the Beijing-Tianjin-Hebei megaregion, China. Acta Ecol. Sin. 2018, 12, 4245–4256. [Google Scholar]
  24. Lee, L.; Yu, J. Estimation of spatial autoregressive panel data models with fixed effects. J. Econom. 2010, 2, 165–185. [Google Scholar] [CrossRef]
  25. Ma, X.; Xue, X.B.; Gonzalez-Meija, A.; Garland, J.; Cashdollar, J. Sustainable water systems for the city of tomorrow-A conceptual framework. Sustainability 2015, 9, 12071–12105. [Google Scholar] [CrossRef] [Green Version]
  26. Zhuang, Y.; Zhang, L.A.; Chiu, Y.H.; Guo, Z.Q.; Chu, Y.; Du, X.Y. Evaluating the recycling efficiency of industrial water use systems in China. J. Environ. Manag. 2022, 316, 115313. [Google Scholar] [CrossRef]
  27. Guo, Z.Q.; Tang, S.N.; Wang, D.J.; Zhang, J.Q. Spatial distribution and factors influencing ecological efficiency of the yellow river basin in China. Front. Environ. Sci. 2022, 3, 235. [Google Scholar] [CrossRef]
Figure 1. The study area of Yellow River Basin.
Sustainability 15 00405 g001
Figure 2. the results of Gini coefficient and its decomposition.
Sustainability 15 00405 g002
Figure 3. The Kernel density curve of urban water-use efficiency in the Yellow River Basin.
Sustainability 15 00405 g003aSustainability 15 00405 g003b
Table 1. Spatial differences of urban water-use efficiency in the Yellow River Basin and its decomposition.
YearsGUpperMiddleLowerUpper-MiddleUpper-LowerMiddle-LowerGwGcbGtContribution Rate %
GwGcbGt
20080.1120.0290.1280.1210.1000.0830.1330.0400.0360.03635.631.832.5
20090.1230.0310.1120.1620.0950.1190.1450.0430.0310.05034.824.940.3
20100.1280.0300.1120.1740.0940.1250.1530.0450.0320.05235.024.740.3
20110.0850.0290.1060.0740.0850.0620.0980.0300.0280.02735.633.231.2
20120.0770.0290.0880.0720.0750.0600.0890.0270.0260.02435.333.930.9
20130.0750.0270.0660.0970.0600.0720.0860.0260.0180.03135.023.641.4
20140.0780.0310.0660.1100.0520.0790.0910.0290.0110.03936.713.649.7
20150.0880.0310.0740.1170.0570.0870.1000.0330.0130.04237.614.348.0
20160.0690.0240.0500.1010.0420.0740.0800.0250.0100.03436.514.149.4
20170.0670.0220.0470.0990.0380.0710.0780.0240.0080.03536.811.451.9
20180.0630.0230.0440.0940.0370.0670.0730.0230.0110.02936.816.946.3
average0.0880.0280.0810.1110.0670.0820.1020.0310.0200.03636.022.042.0
Table 2. Markov chain transition probability matrix of urban water-use efficiency in the Yellow River Basin.
Space Lagt/t + 1Type IType IIType ⅢType IV
No0.8620.1190.0100.010
0.1200.7350.1200.025
0.0100.1200.7200.150
0.0140.0190.1430.824
0.8780.1220.0000.000
0.1510.7550.0750.019
0.0450.2730.5450.136
0.0200.0400.1000.840
0.8550.1450.0000.000
0.0580.8550.0720.014
0.0320.0970.7100.161
0.0230.0230.1860.767
0.7930.1030.0000.103
0.0400.8000.1400.020
0.0000.0450.8330.121
0.0360.0890.2140.661
0.7890.2110.0000.000
0.0000.7930.2070.000
0.0000.0380.8750.088
0.0180.0000.1070.875
Table 3. Estimation results of Spatial Durbin Model.
No Fixed EffectTime and Space Dual FixationTime Fixed Effect
CoefficientStandard Errorp-ValueCoefficientStandard Errorp-ValueCoefficientStandard Errorp-Value
U R B 0.0884.6660.000−0.017−0.3580.7200.0381.0830.279
I N D −0.011−0.1540.8780.0420.2490.803−0.021−0.1650.869
O P E 0.0030.8090.4190.0102.6090.0090.0082.1720.030
P D E −0.030−6.4060.0000.0081.2500.211−0.005−0.8830.377
R E G 0.000−0.4030.6870.000−0.1390.8900.000−0.1830.855
W S T −0.042−1.4630.1440.0742.8250.0050.0501.9450.052
W × U R B −0.696−4.8870.000−0.586−1.9540.051−0.432−2.1020.036
W × I N D 1.3832.7240.0073.4633.0070.0031.9052.1810.029
W × O P E 0.0924.3970.0000.1405.5590.0000.0974.2940.000
W × P D E −0.227−7.1540.000−0.037−0.6720.502−0.217−6.1350.000
W × R E G 0.0010.3830.702−0.001−0.1930.847−0.002−0.6370.524
W × W S T −0.040−0.2780.7810.1260.6670.505−0.118−0.6710.502
δ −0.640−3.5710.000−0.069−0.4580.647−0.106−0.6950.487
teta0.1939.1920.000
R2 0.226 0.771 0.738
Spatial lag Wald test 45.384 (0.000)48.634 (0.000)
Spatial lag LR test 53.661 (0.000)
spatial error Wald test 46.190 (0.000)48.982 (0.000)
spatial error LR test 53.997 (0.000)
Note: The value in parentheses in Wald test and LR test is the p-value. Hausman test-statistic, degrees of freedom and probability = 5.881, 13, 0.950.
Table 4. Direct effect, indirect effect, and total effect.
VariableDirect EffectIndirect EffectTotal Effect
CoefficientT ValueCoefficientT ValueCoefficientT Value
U R B 0.0391.115−0.397−2.059−0.358−1.862
I N D −0.031−0.2561.7842.2341.7532.188
O P E 0.0072.0520.0903.7310.0974.101
P D E −0.005−0.807−0.198−5.138−0.203−5.273
R E G 0.000−0.125−0.002−0.612−0.002−0.624
W S T 0.0501.958−0.119−0.751−0.069−0.432
Disclaimer/Publisher’s Note: The statements, opinions and data contained in all publications are solely those of the individual author(s) and contributor(s) and not of MDPI and/or the editor(s). MDPI and/or the editor(s) disclaim responsibility for any injury to people or property resulting from any ideas, methods, instructions or products referred to in the content.

