Article

Comparison between MICP-Based Bio-Cementation Versus Traditional Portland Cementation for Oil-Contaminated Soil Stabilisation

1
Department of Civil Engineering, Faculty of Civil Engineering and Mechanics, Jiangsu University, Zhenjiang 212013, China
2
School of Civil and Mechanical Engineering, Curtin University, Perth, WA 6845, Australia
3
Institute of Environmental Health and Ecological Security, School of Environment and Safety Engineering, Jiangsu University, Zhenjiang 212013, China
*
Author to whom correspondence should be addressed.
Sustainability 2023, 15(1), 434; https://doi.org/10.3390/su15010434
Submission received: 13 November 2022 / Revised: 21 December 2022 / Accepted: 22 December 2022 / Published: 27 December 2022

Abstract

:
In recent years, oil spills and leakages have often occurred during oil exploration, transportation, handling, usage, and processing, causing serious global environmental problems. Microbially-induced carbonate precipitation (MICP) is an emerging green, environmentally friendly, and sustainable technology that has proven to be a promising alternative for soil stabilisation. This paper provides a comparison between the mechanical performance of oil-polluted sand treated with biocement and traditional Portland cement. A series of laboratory tests, including permeability, unconfined compressive strength (UCS), and triaxial consolidated undrained (CU) tests, was conducted. Even though oil contamination deteriorates the bonding strength of treated soil for both biocement and Portland cement soils, the biocement-treated oil-contaminated sand was found to achieve higher strength (up to four times) than cement-treated soil in the presence of similar content of cementing agent. After eight treatment cycles, the UCS value of oil-contaminated sand treated with biocement reached 1 MPa, demonstrating a high potential for oil-contaminated soil stabilisation in regions of oil spills and leakages.

1. Introduction

Recently, great progress has been made in renewable resources (i.e., solar energy, geothermal energy, hydropower, wind energy, and nuclear energy technologies). However, by 2030, the use of renewable resources will still not reach 10% of the world’s demand [1]. A conventional energy source such as oil is still one of the main energy sources, occupying a large market in the near future. In the process of exploration, processing, usage, and transportation of crude oil, the discharge and leakage of oil will inevitably cause serious environmental pollution such as soil contamination, sometimes negatively affecting the geotechnical properties of the contaminated land. Particularly, when the pores of the polluted soils are blocked by spilt oil, the construction of civil engineering infrastructure will be adversely affected [2]. Such detrimental impacts include the loss of soil strength, reduced permeability, low bearing capacity, excessive settlement, etc. [3]. Therefore, stabilisation is necessary for oil-polluted soils to improve the soil’s physical and mechanical properties [4,5,6,7].
Currently, the most commonly used soil stabilisation method is chemical treatment by the addition of Portland cement [8,9,10]. In such a method, the cementing agent (i.e., Portland cement) is evenly injected into the pores of the soil through a grouting pipe, or thoroughly mixed with the soil through a special mixing machine to achieve improved soil mechanical performance [11]. However, soil stabilisation by Portland cement greatly changes the pH value of treated soil, making it alkaline (about pH = 11, [12]), which is much higher than MICP-treated soil (pH less than 10, [12]). Also, the manufacturing of Portland cement also releases a large amount of CO2, thereby polluting the environment and contributing to carbon footprint and corresponding global warming [13,14]. There is thus an urgent need for an alternative sustainable soil stabilisation technology that can provide low energy consumption, less pollution, and more economic efficiency than the use of Portland cement.
In recent years, microbial-induced calcium carbonate precipitation (MICP) has been proposed as an emerging green, environmentally friendly, and sustainable technology for soil stabilisation [4,15,16,17,18,19,20,21,22]. The technology relies on producing calcium carbonate as a cementing agent that links soil particles together, leading to improved soil strength, stiffness, friction angle, cohesion, and resistance to the applied loads, liquefaction, and erosion [19,23,24,25,26,27,28,29,30,31,32,33]. Most published studies on MICP are on the treatment of pure sand (e.g., silica sand, calcareous sand), and very little work exists for the treatment of contaminated soil, especially oil-polluted soil. Cheng et al. [4] were the first to demonstrate that MICP biocement could be used for oil-contaminated soil stabilisation. However, how effectively the mechanical performance of treated soil can be improved by biocement over other common cementing agents (e.g., Portland cement) is unknown. In the current study, the biocement approach was carried out through a one-phase low-pH injection method [34,35], which can achieve relatively uniform treatment, and in turn, equal soil strength distribution throughout the soil mass. In real practice, oil wastewater associated with the production of oil and gas is one of the major sources of oil-contaminated sand [36,37]. Oil spill contamination would impact the properties of the surrounding sand and change its physical and chemical properties [36]. As an emerging ground improvement method, MICP-based bio-cementation technology is mostly used to treat granular materials, such as sandy soil, in order to clarify the influence of diesel pollution on the engineering properties of cement-treated soil and MICP-treated sand. Based on this concept, a comparison between the biocement- and Portland cement-solidified oil-contaminated sand was conducted, and the mechanical properties and micro-structures (i.e., SEM) of biocement and Portland cement soils are presented and discussed.

2. Materials and Methods

2.1. Testing Materials and Sample Preparation

In the present study, natural silica sand (SiO2 content = 99.4%) with a specific gravity (Gs = 2.65) was used. The sand was first washed with deionized water and then dried at 105 °C for at least 12 h to a constant weight. The grain size distribution test was conducted following the ASTM D6913/D6913M-17 [38], showing d50 = 0.326 mm, d10 = 0.267 mm, d30 = 0.315, and d60 = 0.333 (see Figure 1). Additionally, the sand has a coefficient of uniformity (Cu = 1.19) and a coefficient of curvature (Cc = 1.06). As per the Unified Soil Classification System (USCS) [39], the tested sand was classified as poorly graded (SP) sand.
In this work, four sets of sand samples were prepared as given in Table 1, including bio-cemented oil-contaminated sand (BOS), bio-cemented clean sand (BCS), Portland cement-treated oil-contaminated sand (PCOS), and Portland cement-treated sand (PCS). According to Cheng et al. [4], the oil-contaminated sand was prepared using 5% (w/w) diesel engine oil (Shell HELIX HX3 20W-50) mixed with sand, which was then kept for 1 week to ensure complete soil adsorption of the oil. The viscosity of the diesel engine oil used in the test can reach 20 W at −50 °C. It is a mixture of mineral base oil, synthetic base oil, and additives that has been widely used in automotive engines. The chemical composition of oil is mainly alkanes, cycloalkanes, and aromatic hydrocarbons.
For the bio-cemented sand columns (BOS and BCS), the clean or oil-contaminated sand was used and filled into a polyvinyl chloride (PVC) column (inner diameter = 2.9 cm and height = 8 cm) for the preliminary preparation of samples. To maintain experiment consistency, the sand was compacted into three consecutive layers, ensuring that each layer achieved 80–90% of the maximum density. The targeted height of each layer of the sample was 2.4 cm, and the scraping treatment was carried out between each layer to ensure integrity. The final height of the soil sample was 7.2 cm, and the final dry density was about 1.60 g/cm3. To retain the fine sand, a scouring pad and a layer of coarse sand were placed at the bottom of the sand column. The bio-cemented sand columns (BOS and BCS) were prepared following the treatment method described in Section 2.3. When the injection times of the cementation solution were between 4 and 8, the calcium carbonate content of the bio-cemented sand column was roughly between 9% and 15%, which favours the comparison of the MICP and cement-treated oil-contaminated soil. It should be noted that in the preparation of the BOS samples, it was inevitable that some oil would be washed out by the cementing solution.
For the Portland cement-treated sand columns (PCOS and PCS), defined amounts of cement (9%, 11%, 13%, and 15%) were added to the sand (either clean or oil-contaminated), followed by the immediate addition of water, and then the mixture was thoroughly mixed in the stirring machine. The quality of cement is determined by the mass ratio of Portland cement PC 32.5 to sand. The cementitious material of C-S-H gel of the Portland cement-treated soil is determined by the content of the initially added Portland cement. The amount of water added in the mixture for the preparation of PCOS or PCS samples is determined by the amount of cement added. The water-to-cement ratio was maintained at 0.5. Similar to the process mentioned above, three-layer compaction was also carried out to ensure constant initial dry density. Finally, the cement-treated sand columns were placed in a curing box at 20 °C and 95% humidity for 14 days. Previous studies have shown that the strength of cement-solidified soil at 14 d has reached the vast majority of 28 d strength. At the same time, the longest grouting treatment time of MICP-treated samples in this test is 9 days, which is closer to the curing time of the cement-treated sample (14 days); this is more suitable for comparison.

2.2. Bacterial Culture and Cementation Solution

Sporsacina pasteurii (DSM 33) bacteria culture was used in the current study. The microorganisms were cultivated in a sterile batch growth medium, consisting of 20 g/L yeast extract, 15 g/L NH4Cl, and 0.1 mM NiCl2, at a pH value between 9.2 and 9.3. The cultivated bacterial culture was collected at the stationary phase of the culture growth after 24 h of cultivation at 28 °C [40,41]. The optical density (OD600) of the collected bacterial culture was about 3.2, and the urease activity was approximately 16 U/mL (1 U = 1 μmol urea hydrolyzed per minute). The culture was stored at 4 °C in a refrigerator no longer than 2 days before use. The cementation solution used consisted of 2 M calcium chloride (222 g/L) and 2 M urea (120 g/L).

2.3. Treatment Method

It has been reported by Cheng and Shahin [4] that the conventional two-phase injection method does not apply to oil-contaminated soil due to the poor retention of biomass, low chemical conversion efficiency, and CaCO3 productivity. Consequently, the one-phase low-pH treatment method was conducted, as suggested by Cheng et al. [34]. The one-phase low-pH solution was prepared by mixing the aforementioned bacterial culture and cementation solution at a volume ratio of 1:1, followed by pH adjustment to 4 using 4 M hydrochloric acid, resulting in a stable mixture which contained urease activity of approximately 8 U/mL, 1 M CaCl2, and 1 M urea. During the process of biocement treatment, the sand columns (BOS and BCS) were loaded with the prepared one-phase low-pH solution from the bottom at a constant flow rate of 20 mL/min until the sand columns were fully saturated. Then, the columns were kept at room temperature (ranging from 20 °C to 25 °C) for 24 h. A repeated injection every 24 h was applied to reach various levels of cementation.

2.4. Testing Method

2.4.1. Unconfined Compressive Strength

The unconfined compressive strength (UCS) values for the treated samples were carried out and measured. However, before the UCS tests, the bio-cemented sand specimens were flushed with at least five void volumes of deionized water to wash away any excess soluble salts. Some oil from the sample was washed out during water cleaning. All samples including the BOS, BCS, PCOS, and PCS samples were air-dried to constant weight before testing and their water content could be ignored. Therefore, the BOS samples can be regarded as having the same water content as the PCOS samples. The UCS tests were conducted following the ASTM Standards D2166 [42] on samples of diameter-to-height ratios ranging between 1:2 and 1:2.5, with an applied axial load at a constant rate of 1.0 mm/min.

2.4.2. Consolidated Undrained Triaxial Test

According to previous published work [43], consolidated undrained (CU) triaxial compression tests were also conducted to evaluate the undrained shear behaviour of bio-cemented or Portland cement-treated oil-contaminated sand and clean sand. Triaxial testing procedures following ASTM 4767 [44] were adopted in this study. Samples were subjected isotropically to different confining pressures (i.e., 50 kPa, 100 kPa, and 200 kPa) and were then sheared. Samples were saturated using a vacuum saturator before the experiment. Each specimen was placed in the triaxial testing apparatus and backpressure was applied to saturate the sample until a B-value larger than 95% was attained. Each sample was sheared in undrained condition after the completion of the consolidation, and the shearing rate was set at 0.073 mm/min.

2.4.3. Calcium Carbonate Content

The calcium carbonate content of bio-cemented sand samples was determined by adding hydrochloric acid (HCl) solution into crushed samples, according to a previously published method [34]. For each bio-cemented sand sample, measurement of the CaCO3 of the upper, middle, and lower parts of the sample were carried out, and the average of the three values was considered as the CaCO3 content of the sand column.

2.4.4. Scanning Electron Microscopy (SEM) Analysis

To investigate the bonding behaviour between the sand particle and cementing agent, a microscopy analysis was conducted on dried treated samples. By knowing exactly where the cementing agents were formed in the clean and oil-contaminated samples, as suggested by many other researchers, it was possible to relate the effectiveness of the formed cementing agents to the corresponding mechanical properties obtained. Before conducting the microscopy investigation, all biocement-treated samples were flushed with tap water; this was to remove any excess soluble salts that might precipitate as crystals during the air-drying process, which would affect the SEM analysis.

2.4.5. Permeability Test

After the sample treatment, the permeability test was directly carried out on the sand columns using the constant head method. All samples were saturated with deionized water before the permeability test to remove the residual air. The constant head permeability coefficient k is calculated according to Darcy’s law, which can be expressed as follow:
k = QL A Δ ht
where k is the constant head permeability coefficient, Q is the seepage flow through the sample in time t, L is sample height, A is the cross-sectional area of the sample, ∆h is the constant head water level difference, and t is time.

3. Results and Discussion

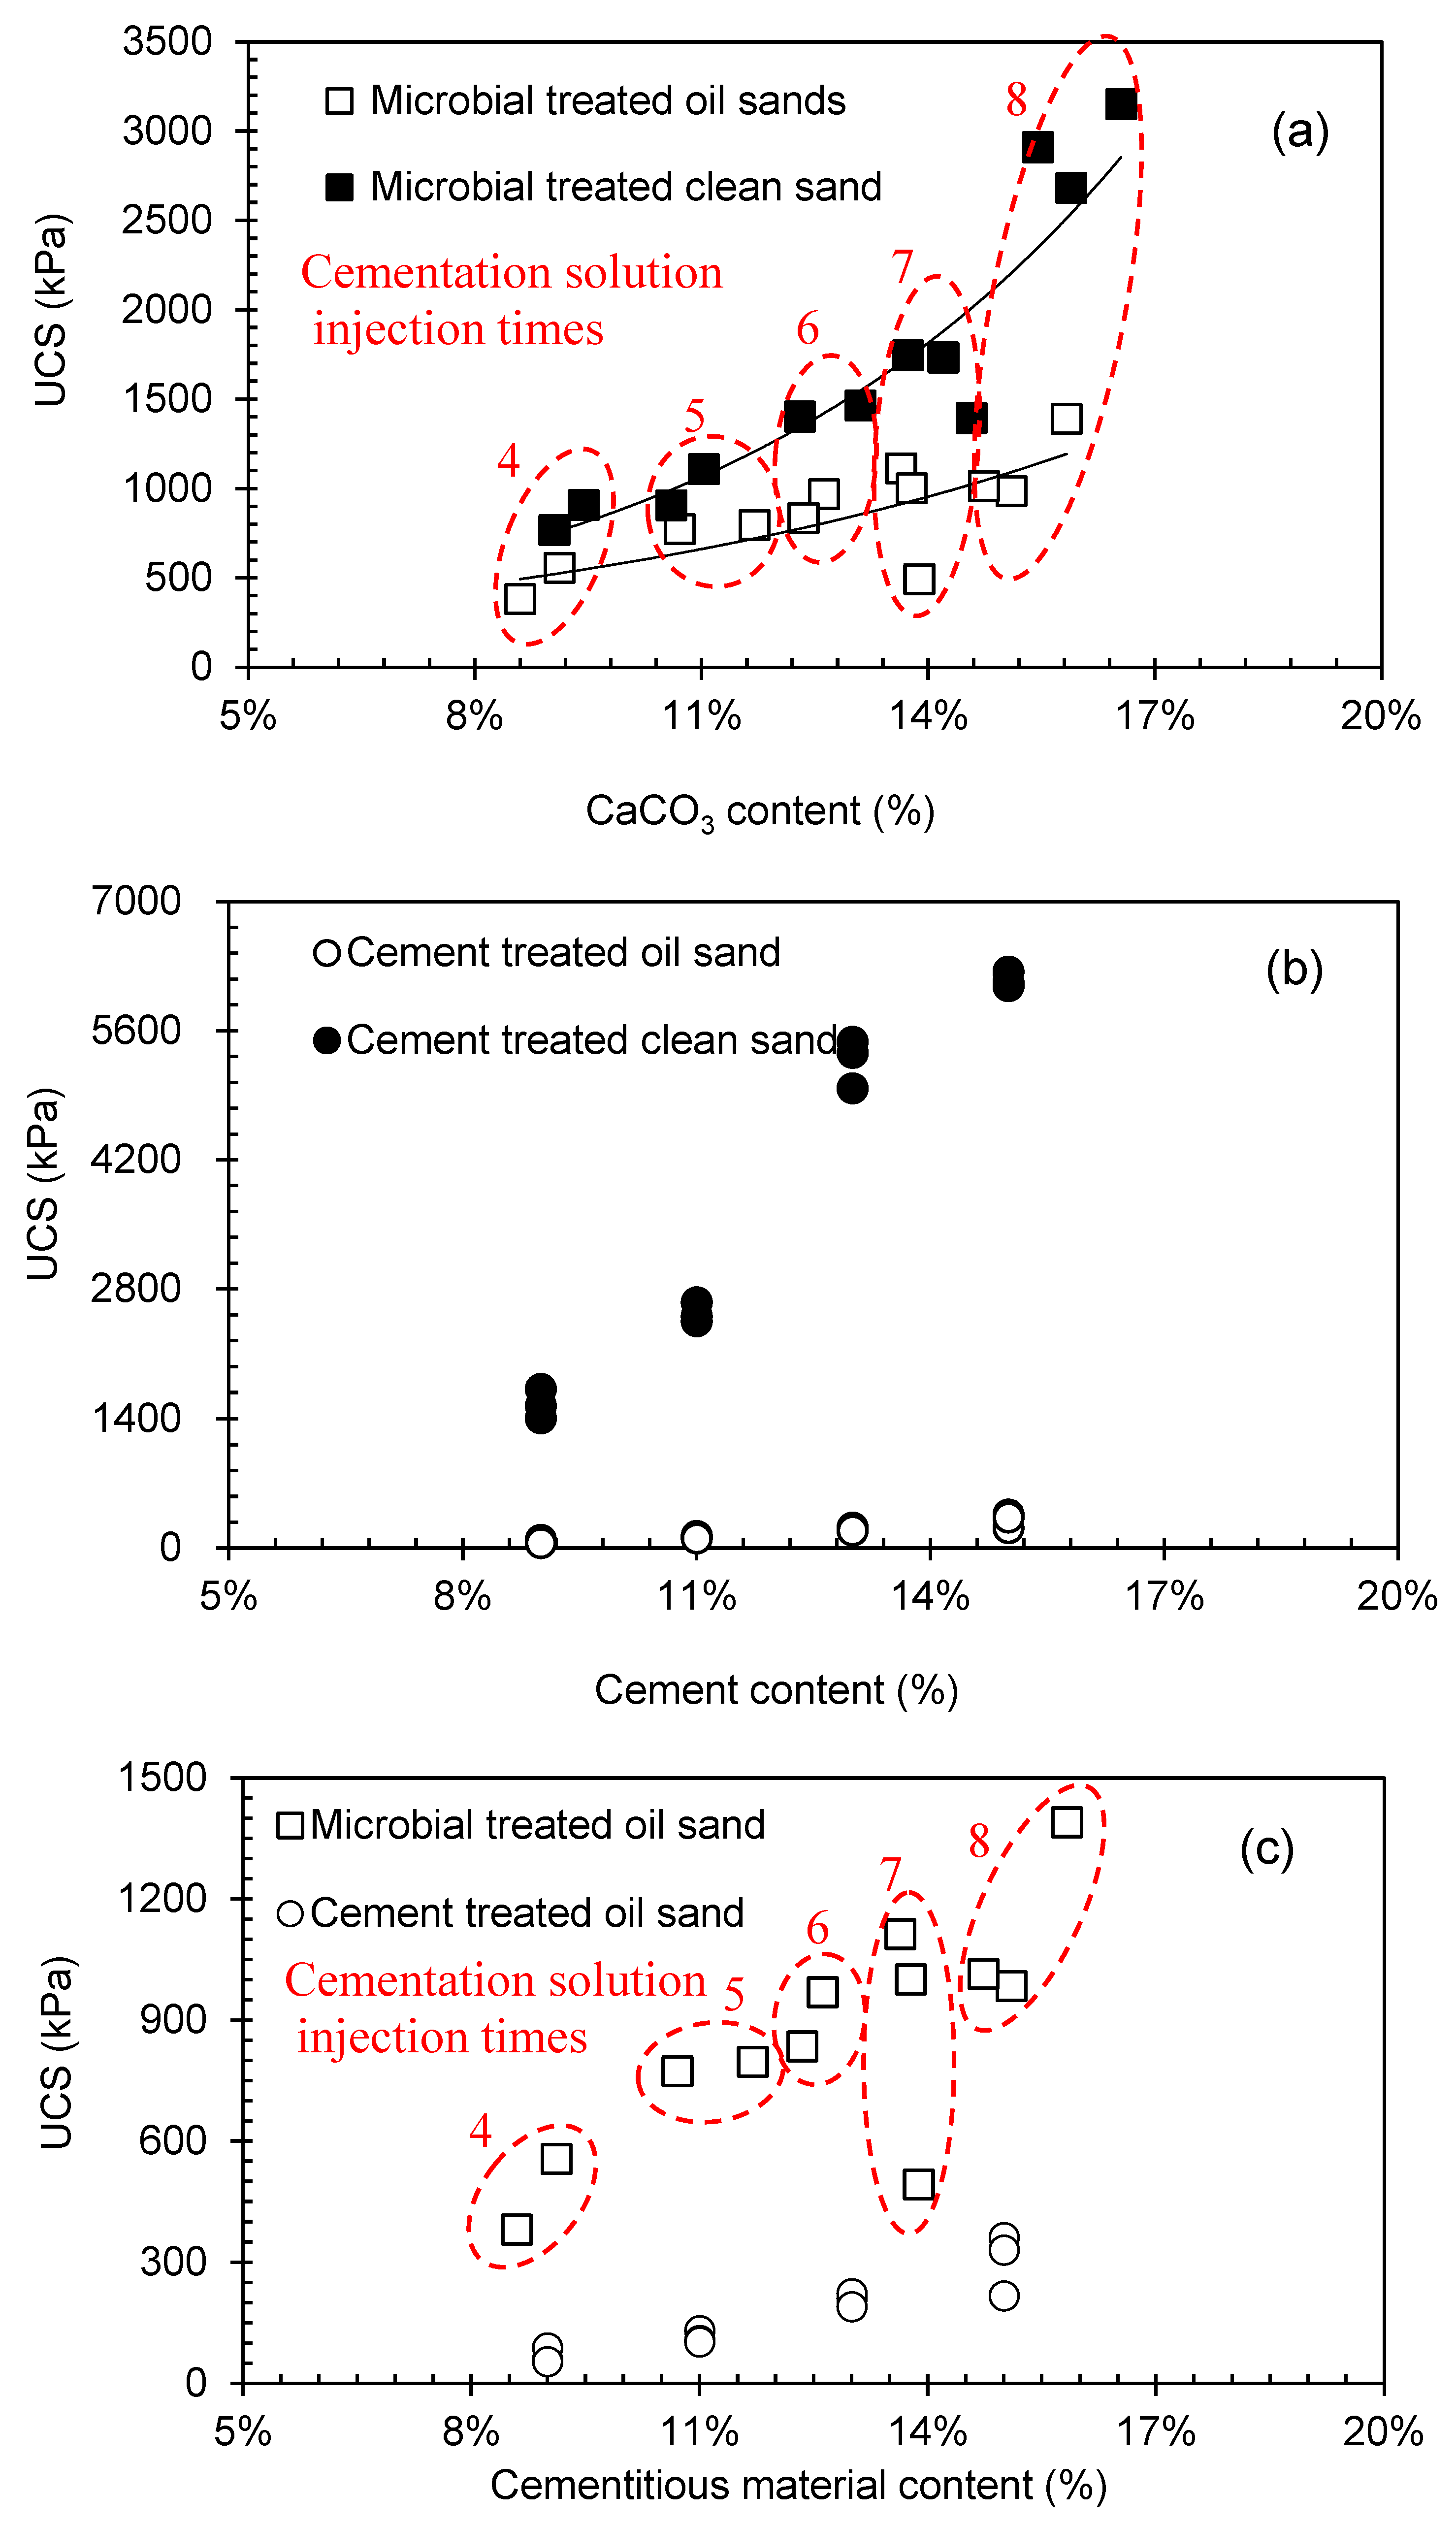
3.1. Effect of Oil Contamination on UCS of Treated Soil

As mentioned earlier, the newly developed low-pH one-phase treatment approach was applied to the oil-contaminated soil, which resulted in high chemical conversion efficiency (>90%) and high amount of CaCO3 production, i.e., more than 16% CaCO3 content was produced after eight treatments (Figure 2). According to the previous published work [34], the chemical conversion efficiency was defined as the percentage of injected urea that was converted during the reaction.
It can be seen from Figure 2 that the oil contamination negatively affects the UCS values for both bio-cemented and Portland cement-treated samples. It can also be seen from Figure 2a that the UCS values increase with the increase of CaCO3 content for all treated samples. However, even though high chemical conversation efficiency (>90%) was achieved for each bio-cemented soil for both oil-contaminated and clean sand, for the same amount of CaCO3 precipitation, the UCS values of oil-contaminated samples are much less than those of clean sand. When the grouting time is eight, the UCS value of BCS sample is about twice that of BOS sample. This suggests that the oil coating the sand surface might deteriorate the bonding between the sand particle and carbonate crystals. It can also be seen from Figure 2b that the UCS of Portland cement-treated clean sand samples greatly exceeds that of the oil-contaminated column, which, as suggested by Almabrok et al. [45], can be attributed to the deterioration of the alkaline Portland cement by the weak-acidic crude oil, negatively affecting the hydration of cement, and thus reducing the strength of the Portland cement-treated oil-contaminated sand column. Some complexes formed in the BOS samples, such as the calcium oleo–aluminate complex, could inhibit the calcium silicate hydrate (C-S-H) gel formation [46]. Additionally, the crude oil could cause dilation of the C-S-H gel, hence weakening the cohesive forces and resulting in low soil strength [47,48].
Figure 2c shows the UCS values of bio-cemented and Portland cement-treated oil sand samples as a function of cementing agent content. The results also indicate that the UCS values of bio-cemented oil sand are remarkably higher than that of Portland cement-treated oil sand at the same cementing agent content. When the cementing agent content is about 15%, the UCS value of bio-cemented oil sand is about 1129.6 kPa, while the UCS of Portland cement-treated oil sand is only 303.2 kPa. This suggests that biocement overperforms Portland cement in consolidating oil-contaminated soil. This is because the formation of biocement bonding material of CaCO3 was not notably affected by the presence of crude oil (proven by the high CaCO3 content), which contradicts the Portland cement-treated specimens, whereby the oil might significantly inhibit hydration of the cementitious material of calcium silicate hydrate (C-S-H) gel formation. Although it is guaranteed that the PCOS samples have the same initial oil content as the BOS samples, the final oil content of the BOS samples should be slightly lower than that of the PCOS samples due to the influence of the cementing solution. Therefore, it is agreed that it is one of the possible reasons that the strength of the BOS samples is higher than that of the PCOS samples. It should also be noted that in comparison with the previous proposed premixing approach using bio-flocs to achieve high biomass retention and chemical conversion efficiency, which could not be achieved by the conventional two-phase injection approach [4], the currently proposed one-phase low-pH treatment method also demonstrated great chemical conversion efficiency and CaCO3 productivity. In addition, the method allows multiple supplies of bacteria to maintain a long-term urease activity for repeated treatments.

3.2. Permeability

The permeability test was directly carried out on the sand columns using the constant head method. The results showed that there is a direct negative correlation between the permeability and content of cementing agents, as can be seen in Figure 3. It can also be seen that the permeability of poorly graded sand treated with biocement was lower under the oil contamination compared with the clean sand, which was suggested by Khamehchiyan et al. [49]. This was due to the reduction in the volume of soil porosity because of the presence of crude oil. The permeability of bio-cemented sand columns was significantly higher than that of Portland cement-treated specimens, which is in line with previous findings [24]. The significant loss of permeability in the Portland cement-treated samples is due to the cement hydration process, as suggested by Nakarai and Yoshida [50].

3.3. Microstructure Analysis

The link between the microstructural characteristics of cementitious material and the corresponding strength of solidified specimens was investigated using scanning electron microscopy (SEM) testing. The SEM images, presented in Figure 4, show a noticeable difference in the precipitation patterns between the specimens treated with biocement and Portland cement. For specimens treated using biocement, the precipitated carbonate crystals appear to be special clusters with crystal sizes ranging from about 20 to 60 µm [Figure 4a,b]. An observation of the microscale level of Portland cement-treated samples displayed that the product of cement hydration forms a continuous coating layer on the surface and the bonding “bridge” between adjacent sand particles [Figure 4c,d], and this is in line with previously published results by Mujah et al. [51]. The presence of crude oil significantly affects the hydration of cement, as indicated in Figure 4g,h, whereby clear particles deposited on the surface of sand particles, which were likely to be the un-hydrated cement particles, as suggested by Evangelista and Guedes [52]. This suggests that the oil contaminants would have prevented or delayed the cement particles from becoming fully hydrated, resulting in a dramatic decrease in the cementation and mechanical performance, which was also mentioned by Kostecki et al. [53]. In comparison, the bonding behaviour of bio-cemented crude oil-contaminated soil was similar to that of the clean sand, even though the individual spherical crystals that formed the large clusters were around 2-5 µm, smaller than those observed in the clean sand [Figure 4e,f]. It is interesting to note that in Figure 4b,e, the carbonate crystals of the BOS sample are smaller than those of the BCS sample. This is probably due to the presence of hydrophobic hydrocarbon (i.e., engine oil, n-dodecane), which has been reported to favour the stabilization of the thermodynamically less stable polymorphs of CaCO3 (aragonite, vaterite) [54]. Therefore, a clear difference in the morphology of the CaCO3 was observed between the BOS and BCS samples. The cementation driven by such large clusters made of individual small crystals might be the reason for the reduced strength as the failure is likely to occur along the interface between the individual crystals. In-depth research on this aspect is worthwhile to carry out in future. Most of the crystals in the cement-treated soil sample are located between the sand particles, which greatly reduces the permeability of the sample. However, many crystals in MICP-treated soil samples are deposited on the surface of sand particles and do not play a good role in reducing permeability. This is why the permeability of PCOS and PCS samples is much lower than that of BOS and BCS samples.

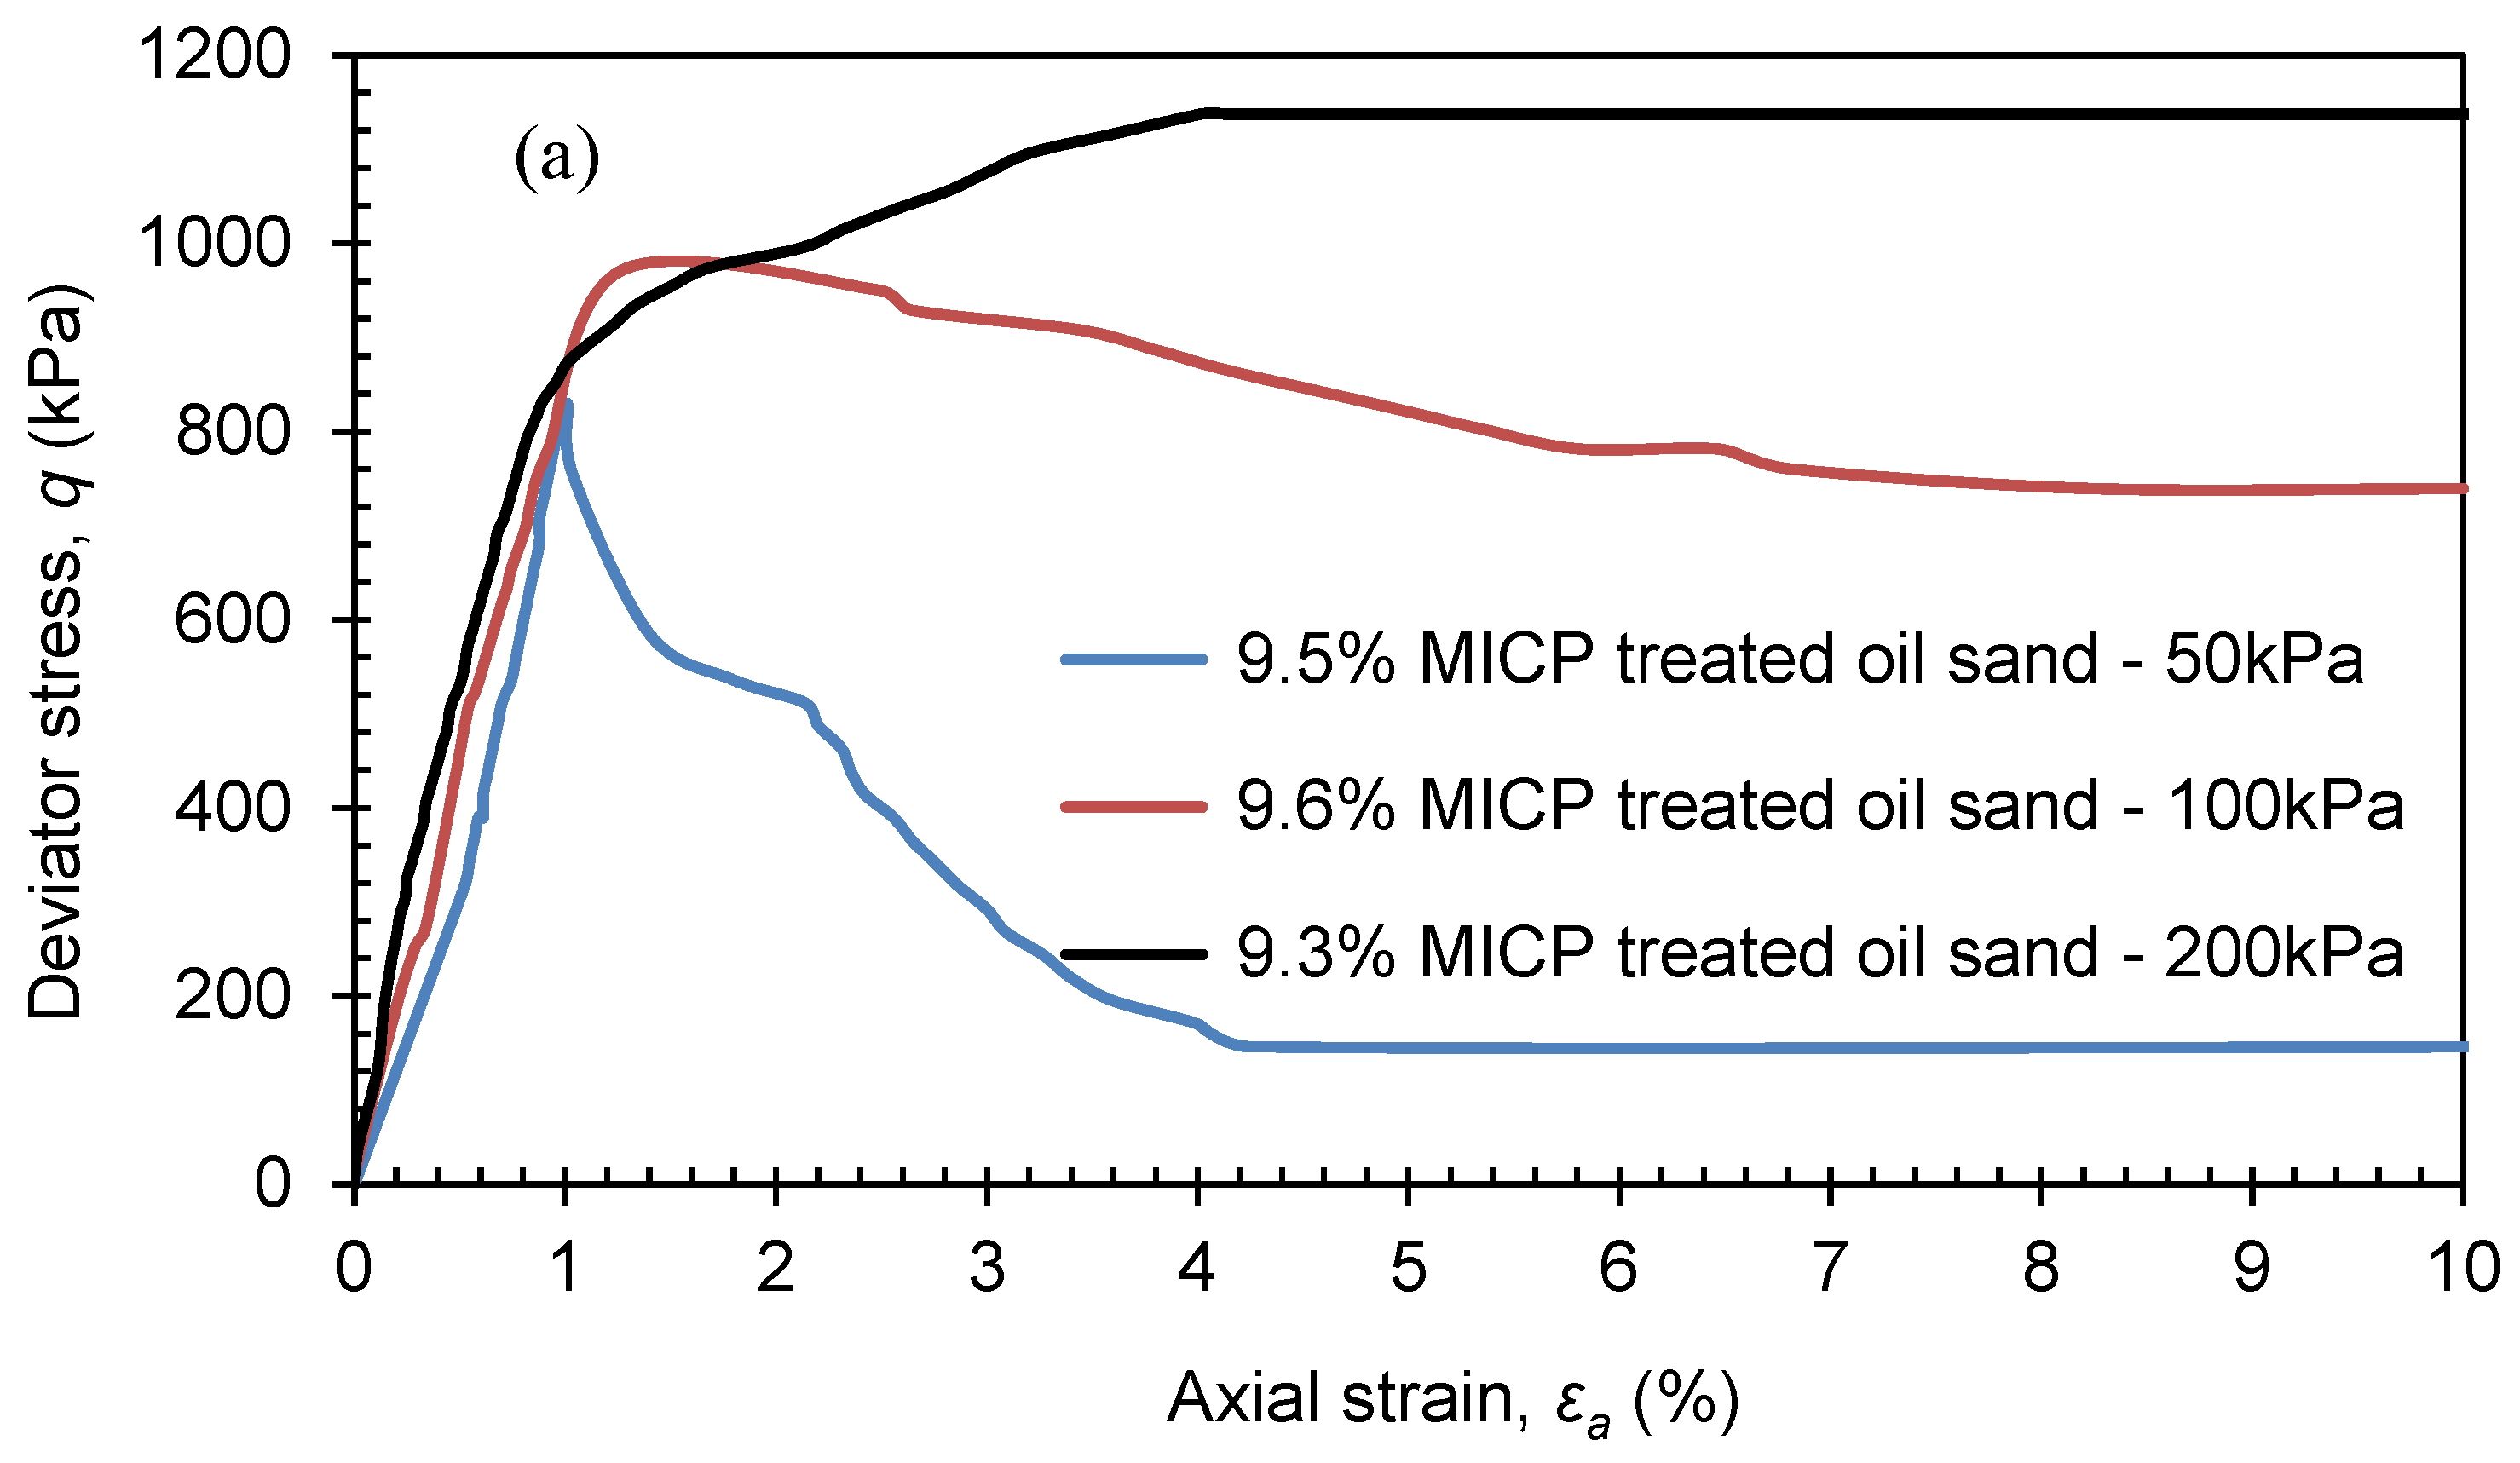
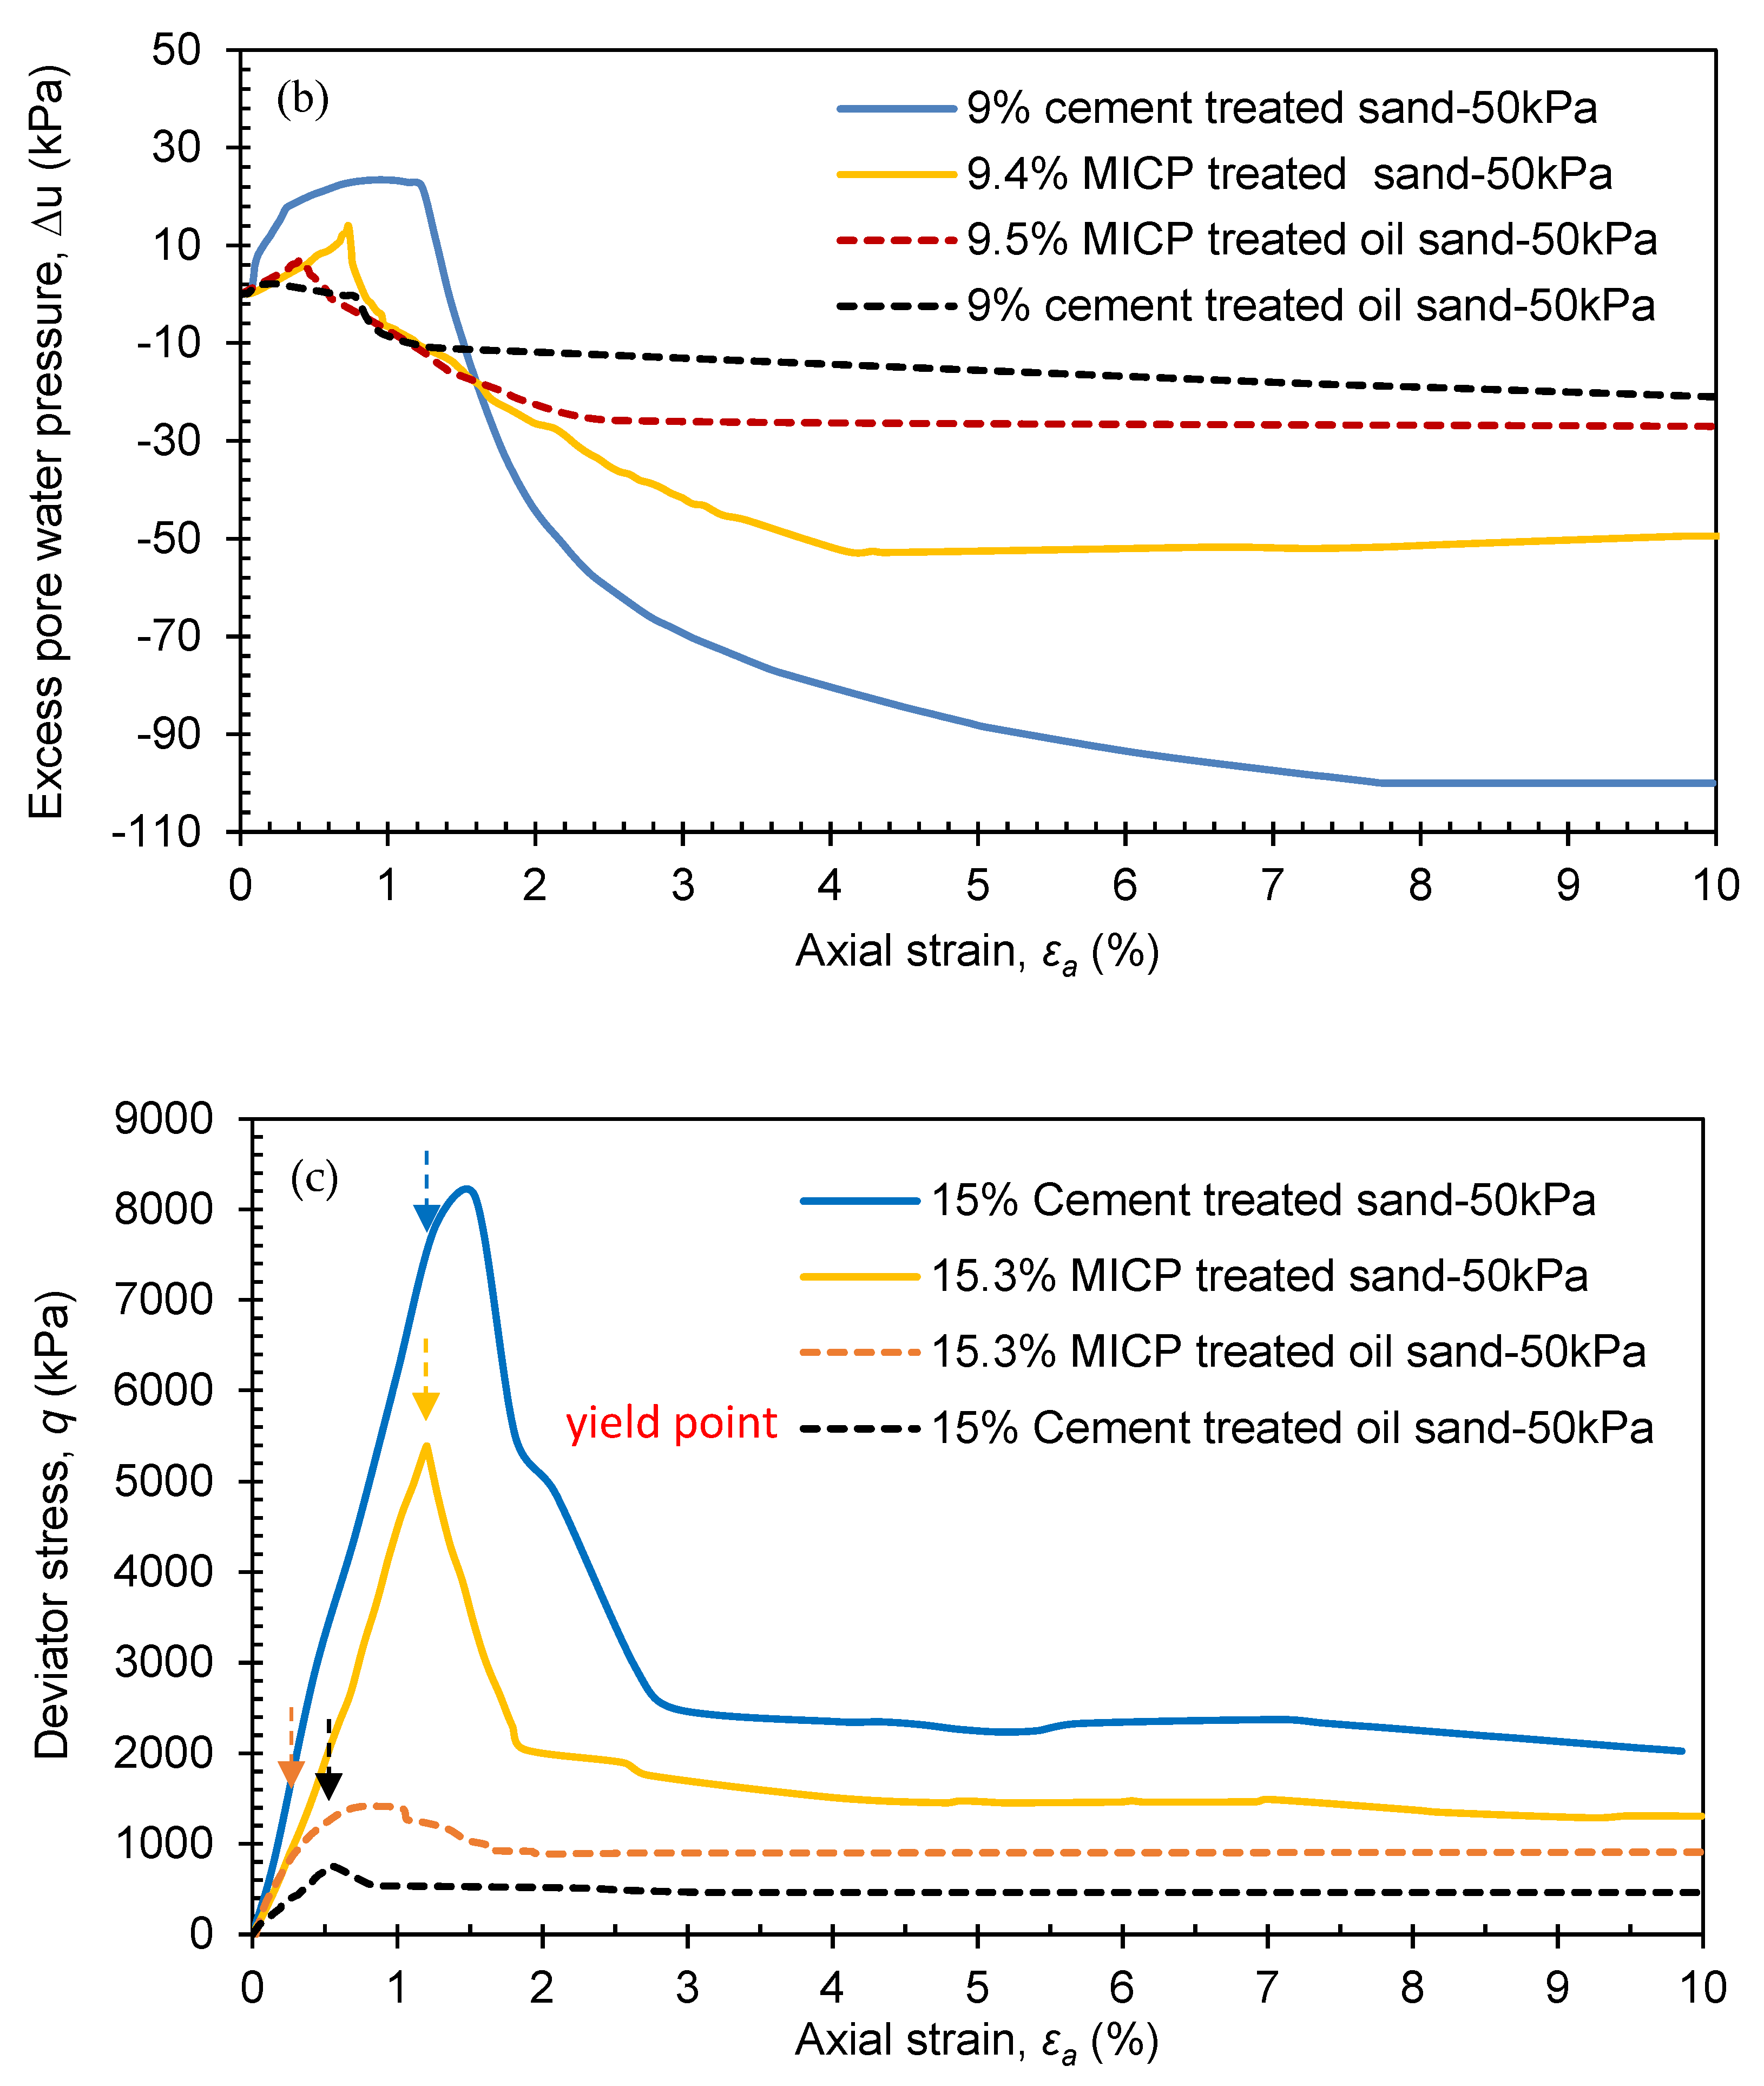
3.4. Undrained Triaxial Shear Behaviour

Figure 5a,b shows the variation of deviator stress q with εa obtained from the CU tests for bio-cemented oil-contaminated sand and Portland cement-treated oil-contaminated sand at the same cementing agent content (about 9%). For comparison, untreated clean samples were also used to run the CU test and the result was shown in Figure 5c. In general, it can be seen from Figure 5 that most of the treated samples show strain-softening behaviour compared to the strain hardening for untreated clean samples. Under the same confining pressure, compared with the untreated clean sand sample, the bio-cemented oil-contaminated sand samples showed higher strength and stiffness than Portland cement-treated oil-contaminated sand samples. The possible reason is that oil contaminants may interfere with the Portland cement hydration reaction and prevent or delay the complete hydration of the particles and reduce the friction between soil particles [32,55]. Based on the results obtained, under a confining pressure of 50 kPa, the bio-cemented samples reached peak deviator stress (qmax = 828.7 kPa) at approximately (εa = 1%), followed by strain softening. However, at higher confining pressures of 100 kPa and 200 kPa, respectively, the corresponding peak deviator stress (qmax = 971.7 kPa) and (qmax = 1137.4 kPa), was reached and this occurred at (εa = 1.27%) and (εa = 1.5%), respectively. Compared with the curve of untreated clean sand, all bio-cemented samples showed a strain-softening state after reaching the peak stress, which may be related to the degradation of the weaker calcite–silica bond that is transformed into fine particles and filled the internal voids of the soil matrix. As suggested by DeJong et al. [14] and Montoya and DeJong [32], the cementing material granules produced by cement hydration are related to the damage of calcium hydroxide CH; its strength is very low and its stability is extremely poor. The damage between cementitious material particles and calcium hydroxide CH is mostly enriched at the interface between the cement stone and aggregate; it concentrates and combines to form coarse grains, resulting in a decrease in the bonding force of the interface, which becomes the weakest link in cement-based materials.
As shown in Table 2, it can be seen that under the same confining pressure, Portland cement-treated oil-contaminated sand has the lowest strength, followed by loose sand, while bio-cemented oil-contaminated sand has the highest strength. It can also be seen that the cohesion of loose sand is almost zero, and the obtained friction angle of 38.7° shows that the loose sand depends solely on the friction between the sand particles to provide strength. The cohesion of Portland cement-treated oil-contaminated sand is about 24 kPa and the friction angle is 25°, which shows that the strength of Portland cement-treated sand depends on the cohesion and friction angle. To provide strength, it can be seen from Table 2 that the friction angle of Portland cement-treated oil-contaminated sand was reduced. The possible reason is that oil contaminants play a lubricating role, which leads to a decrease in the friction angle. Bio-cemented oil-contaminated sand has a cohesion of about 209 kPa and a friction angle of 31°, and it can be seen that the influence of oil pollutants on the oil-contaminated sand solidified by biocement is relatively low, with a relatively small reduction in the friction angle. As shown in the microscopic view presented earlier, the possible reason for the higher friction angle of the BOS sample is probably because the BOS sample has larger crystal clusters than the PCOS sample, as shown in Figure 4.
Figure 6 shows the triaxial compression test results (q versus εa, ∆u versus εa) for bio-cemented and Portland cement-treated oil-contaminated sand or clean sand samples with the same cementing agent content (about 9% and 15%) under a confining pressure of 50 kPa. Generally speaking, all specimens tested showed strain-softening behaviour after the peak stress [Figure 6a,c]. As can be seen, the deviator stress increases up to the peak value at a relatively low axial strain εa, and thereafter decreases significantly with increasing εa until a plateau of stable value. Meanwhile, the excess pore water pressure ∆u also exhibits a similar trend with increasing εa, as shown in Figure 6b,d, i.e., ∆u increases to the peak value at a small value of εa and then tends to decrease remarkably to a stable value. Moreover, for the clean sand samples, the Portland cement-treated sand curve exhibits higher (q versus εa) compared to its bio-cemented counterpart sand curve. On the contrary, the Portland cement-treated oil-contaminated sand curve exhibits lower (q versus εa) compared to its bio-cemented counterpart sand curve. This may be due to the even distribution of hydration products when the Portland cement was solidified without oil. On the contrary, calcium carbonate grows randomly in bio-cemented sand, and the effective calcium carbonate was relatively small. The effective calcium carbonate is the calcium carbonate that bonds the sand particles, which is compared with the non-effective calcium carbonate deposited on the surface of the sand particles that has little impact on the strength improvement [43]. However, for bio-cemented oil-contaminated sand, formed calcium carbonate can squeeze out organic oil or cover the surface of the oil, thus increasing its strength. For Portland cement-treated oil-contaminated sand, the absorption of crude oil into the microstructure of the soil matrix may cause gel swelling, weakening of cohesion in the paste, and low strength [47]. Additionally, the presence of oil may interfere with the cement hydration reaction and prevent or delay the complete hydration of the cement. By comparing Figure 6a with Figure 6c, it can be found that under the same confining pressure, all samples show an increase in the peak deviator stress with the increase of the cementing agent content from 9% to 15%.
Similar trends can be observed for the excess pore water pressure ∆u and axial strain εa [Figure 6b,d]. It can be seen that a strong negative pore pressure can be observed under all cemented samples. It can also be seen that higher constraints result in larger negative pore pressures. The possible reason is that the consolidation strength of the specimen promotes a higher negative value in the residual state area. The change in pore pressure is due to the change in the average total stress and/or the tendency of the soil volume to expand after the peak. In such a case, the Portland cement-treated specimens showed a greater tendency to swell in the strain-softening zone, which is attributed to the increase in stiffness and pore pressure. Before the yield point shown by the arrow of the stress-strain curve in Figure 6, cementation suppresses the tendency of the soil particles to break, which can be proved by the observed sudden decrease in stiffness [5,14,56]. Before the material exhibits a strain-softening response, the cement-treated specimen has undergone brittle yielding with the failure of cementation. The strain-softening behaviour observed after the brittle yielding may continue towards the residual value, or may transform into strain hardening due to frictional motion.
Figure 7 shows the variation of the peak stress ratio with the cementing agent content (i.e., calcium carbonate content for bio-cemented samples and cement content for Portland cement-treated samples). The peak stress ratio was obtained from qmax/p′. It can be seen that the peak stress ratio increases slowly with the increase of the cementing agent content. At the same confining pressure and cementing agent content, the data points of Portland cement-treated sand are above those of the bio-cemented sand. However, the data points of Portland cement-treated oil-contaminated sand are below those of bio-cemented sand. In addition, at the same cementing agent content, the peak stress ratio of bio-cemented or Portland cement-treated oil-contaminated sand decreases with the increase in confining pressure.

4. Conclusions

This study reports a series of laboratory tests to investigate the mechanical properties of bio-cemented and Portland cement-treated oil-contaminated sand. The oil contamination proved to deteriorate the bonding strength of both biocement and Portland cement-treated sand; however, the bio-cemented oil-contaminated samples outperformed cement-treated samples in terms of mechanical properties, including higher strength (up to four times), higher friction angle, and cohesion. Through microstructure analysis, the presence of oil resulted in incomplete Portland cement hydration. In comparison, oil has no effect on biocement (CaCO3) production, as the low-pH one-phase injection approach demonstrated a chemical conversion efficiency and CaCO3 productivity for the oil-contaminated soil. The current study also showed that both the bio-cemented and Portland cement-treated oil-contaminated sand exhibit brittle behaviour in the UCS and CU tests before the yield point, followed by strain-softening, which can continue to reach the residual values or convert to strain hardening due to friction movement.

Author Contributions

Methodology, K.Z.; Data curation, J.-X.W.; Writing—review & editing, J.Y., M.A.S. and L.C. All authors have read and agreed to the published version of the manuscript.

Funding

This work is funded by NSFC Major International Joint Research Project POW3M (Grant No. 51920105013), National Natural Science Foundation of China (Grant No. 51978315), Jiangsu Distinguished Professor Program, and Jiangsu Province “Six Talent Peak” program (XCL-111).

Institutional Review Board Statement

Not applicable.

Informed Consent Statement

Not applicable.

Data Availability Statement

The datasets generated during and/or analysed during the current study are available from the corresponding author on reasonable request.

Conflicts of Interest

The authors declare no conflict of interest.

References

  1. Dorian, J.P.; Franssen, H.T.; Simbeck, D.R. Global challenges in energy. Energy Policy 2006, 34, 1984–1991. [Google Scholar] [CrossRef]
  2. Rao, S.; Rao, K.S. Ground Heave from Caustic Soda Solution Spillage—A Case Study. Soils Found. 1994, 34, 13–18. [Google Scholar] [CrossRef] [PubMed] [Green Version]
  3. Rahman, Z.A.; Hamzah, U.; Taha, M.R.; Ithnain, N.S.; Ahmad, N. Influence of Oil Contamination on Geotechnical Properties of Basaltic Residual Soil. Am. J. Appl. Sci. 2010, 7, 954–961. [Google Scholar] [CrossRef] [Green Version]
  4. Cheng, L.; Shahin, M. Stabilisation of oil-contaminated soils using microbially induced calcite crystals by bacterial flocs. Géotechnique Lett. 2017, 7, 146–151. [Google Scholar] [CrossRef]
  5. Jamrah, A.; Al-Futaisi, A.; Hassan, H.; Al-Oraimi, S. Petroleum contaminated soil in Oman: Evaluation of bioremediation treatment and potential for reuse in hot asphalt mix concrete. Environ. Monit. Assess. 2006, 124, 331–341. [Google Scholar] [CrossRef]
  6. Shin, E.; Lee, J.; Das, B. Bearing Capacity of a Model Scale Footing on Crude Oil-Contaminated Sand. Geotech. Geol. Eng. 1999, 17, 123–132. [Google Scholar] [CrossRef]
  7. Wu, J.; Wang, X.-B.; Wang, H.-F.; Zeng, R.J. Microbially induced calcium carbonate precipitation driven by ureolysis to enhance oil recovery. RSC Adv. 2017, 7, 37382–37391. [Google Scholar] [CrossRef] [Green Version]
  8. Azadi, M.; Taghichian, A.; Taheri, A. Optimization of cement-based grouts using chemical additives. J. Rock Mech. Geotech. Eng. 2017, 9, 623–637. [Google Scholar] [CrossRef]
  9. Lemaire, K.; Deneele, D.; Bonnet, S.; Legret, M. Effects of lime and cement treatment on the physicochemical, microstructural and mechanical characteristics of a plastic silt. Eng. Geol. 2013, 166, 255–261. [Google Scholar] [CrossRef]
  10. Xiao, H.; Lee, F.H.; Chin, K.G. Yielding of cement-treated marine clay. Soils Found. 2014, 54, 488–501. [Google Scholar] [CrossRef]
  11. Chu, J.; Ivanov, V.; He, J.; Naeimi, M.; Li, B.; Stabnikov, V. Development of Microbial Geotechnology in Singapore. Geo-Frontiers 2011, 2011, 4070–4078. [Google Scholar] [CrossRef] [Green Version]
  12. Choi, S.-G.; Chae, K.; Park, S. Field Study for Application of Soil Cementation Method Using Alkaliphilic Microorganism and Low-cost Badge. J. Korean Geotech. Soc. 2015, 31, 37–46. [Google Scholar] [CrossRef] [Green Version]
  13. Al-Rawas, A.; Hassan, H.F.; Taha, R.; Hago, A.W.; Al-Shandoudi, B.; Al-Suleimani, Y. Stabilization of oil-contaminated soils using cement and cement by-pass dust. Manag. Environ. Qual. Int. J. 2005, 16, 670–680. [Google Scholar] [CrossRef]
  14. DeJong, J.T.; Mortensen, B.M.; Martinez, B.C.; Nelson, D.C. Bio-mediated soil improvement. Ecol. Eng. 2010, 36, 197–210. [Google Scholar] [CrossRef]
  15. Amin, M.; Zomorodian, S.M.A.; O’Kelly, B.C. Reducing the hydraulic erosion of sand using microbial-induced carbonate precipitation. Proc. Inst. Civ. Eng.-Ground Improv. 2017, 170, 112–122. [Google Scholar] [CrossRef]
  16. Cheng, L.; Shahin, M.A.; Mujah, D. Influence of Key Environmental Conditions on Microbially Induced Cementation for Soil Stabilization. J. Geotech. Geoenvironmental Eng. 2017, 143, 04016083. [Google Scholar] [CrossRef] [Green Version]
  17. Choi, S.G.; Chu, J.; Brown, R.C.; Wang, K.; Wen, Z. Sustainable Biocement Production via Microbially Induced Calcium Carbonate Precipitation: Use of Limestone and Acetic Acid Derived from Pyrolysis of Lignocellulosic Biomass. ACS Sustain. Chem. Eng. 2017, 5, 5183–5190. [Google Scholar] [CrossRef]
  18. Liu, L.; Liu, H.; Xiao, Y.; Chu, J.; Xiao, P.; Wang, Y. Biocementation of calcareous sand using soluble calcium derived from calcareous sand. Bull. Eng. Geol. Environ. 2017, 77, 1781–1791. [Google Scholar] [CrossRef]
  19. Lai, Y.; Yu, J.; Liu, S.; Liu, J.; Wang, R.; Dong, B. Experimental study to improve the mechanical properties of iron tailings sand by using MICP at low pH. Constr. Build. Mater. 2020, 273, 121729. [Google Scholar] [CrossRef]
  20. Xiao, P.; Liu, H.; Xiao, Y.; Stuedlein, A.W.; Evans, T.M. Liquefaction resistance of bio-cemented calcareous sand. Soil Dyn. Earthq. Eng. 2018, 107, 9–19. [Google Scholar] [CrossRef]
  21. Xiao, Y.; Zhao, C.; Sun, Y.; Wang, S.; Wu, H.; Chen, H.; Liu, H. Compression behavior of MICP-treated sand with various gradations. Acta Geotech. 2020, 16, 1391–1400. [Google Scholar] [CrossRef]
  22. Zhang, Z.-J.; Li, B.; Hu, L.; Zheng, H.-M.; He, G.-C.; Yu, Q.; Wu, L.-L. Experimental Study on MICP Technology for Strengthening Tail Sand under a Seepage Field. Geofluids 2020, 2020, 8819326. [Google Scholar] [CrossRef]
  23. Chu, J.; Ivanov, V.; Naeimi, M.; Stabnikov, V.; Liu, H.-L. Optimization of calcium-based bioclogging and biocementation of sand. Acta Geotech. 2013, 9, 277–285. [Google Scholar] [CrossRef]
  24. Cheng, L.; Cord-Ruwisch, R.; Shahin, M. Cementation of sand soil by microbially induced calcite precipitation at various degrees of saturation. Can. Geotech. J. 2013, 50, 81–90. [Google Scholar] [CrossRef] [Green Version]
  25. Cheng, L.; Cord-Ruwisch, R. Upscaling Effects of Soil Improvement by Microbially Induced Calcite Precipitation by Surface Percolation. Geomicrobiol. J. 2014, 31, 396–406. [Google Scholar] [CrossRef] [Green Version]
  26. Ismail, M.A. Strength and Deformation Behaviour of Calcite-Cemented Calcareous Soil. Ph.D. Thesis, University of Western Australia, Perth, Australia, 2000. [Google Scholar]
  27. Ivanov, V.; Chu, J. Applications of microorganisms to geotechnical engineering for bioclogging and biocementation of soil in situ. Rev. Environ. Sci. Bio/Technol. 2008, 7, 139–153. [Google Scholar] [CrossRef]
  28. Lin, H.; Suleiman, M.T.; Brown, D.G.; Kavazanjian, E. Mechanical Behavior of Sands Treated by Microbially Induced Carbonate Precipitation. J. Geotech. Geoenvironmental Eng. 2016, 142, 04015066. [Google Scholar] [CrossRef]
  29. Liu, L.; Liu, H.; Stuedlein, A.; Evans, T.M.; Xiao, Y. Strength, stiffness, and microstructure characteristics of biocemented calcareous sand. Can. Geotech. J. 2019, 56, 1502–1513. [Google Scholar] [CrossRef]
  30. Lium, D.M.A.B. Biologically Induced Cementation for Soil Stabilisation. Ph.D. Thesis, Curtin University, Perth, Australia, 2019. [Google Scholar]
  31. Ma, G.; He, X.; Jiang, X.; Liu, H.; Chu, J.; Xiao, Y. Strength and Permeability of Bentonite-Assisted Biocemented Coarse Sand. Can. Geotech. J. 2021, 58, 969–981. [Google Scholar] [CrossRef]
  32. Montoya, B.M.; DeJong, J.T. Stress-Strain Behavior of Sands Cemented by Microbially Induced Calcite Precipitation. J. Geotech. Geoenvironmental Eng. 2015, 141, 04015019. [Google Scholar] [CrossRef]
  33. Whiffin, V.S.; van Paassen, L.; Harkes, M.P. Microbial Carbonate Precipitation as a Soil Improvement Technique. Geomicrobiol. J. 2007, 24, 417–423. [Google Scholar] [CrossRef]
  34. Cheng, L.; Shahin, M.A.; Chu, J. Soil bio-cementation using a new one-phase low-pH injection method. Acta Geotech. 2018, 14, 615–626. [Google Scholar] [CrossRef] [Green Version]
  35. Yang, Y.; Chu, J.; Liu, H.; Cheng, L. Improvement of uniformity of biocemented sand column using CH3COOH-buffered one-phase-low-pH injection method. Acta Geotech. 2022, 228. [Google Scholar] [CrossRef]
  36. Khosravi, E.; Ghasemzadeh, H.; Sabour, M.R.; Yazdani, H. Geotechnical properties of gas oil-contaminated kaolinite. Eng. Geol. 2013, 166, 11–16. [Google Scholar] [CrossRef]
  37. Ajagbe, W.O.; Omokehinde, O.S.; Alade, G.A.; Agbede, O.A. Effect of Crude Oil Impacted Sand on compressive strength of concrete. Constr. Build. Mater. 2012, 26, 9–12. [Google Scholar] [CrossRef]
  38. ASTM D6913/D6913M-17; Standard Test Methods for Particle-Size Distribution (Gradation) of Soils Using Sieve Analysis. ASTM International: West Conshohocken, PA, USA, 2021.
  39. ASTM D2487-17; Standard Practice for Classification of Soils for Engineering Purposes (Unified Soil Classification System). ASTM International: West Conshohocken, PA, USA, 2020.
  40. Kim, Y.; Roh, Y. Microbially Induced Carbonate Precipitation Using Microorganisms Enriched from Calcareous Materials in Marine Environments and Their Metabolites. Minerals 2019, 9, 722. [Google Scholar] [CrossRef] [Green Version]
  41. Jain, S.; Arnepalli, D.N. Biochemically Induced Carbonate Precipitation in Aerobic and Anaerobic Environments by Sporo-sarcina pasteurii. Geomicrobiol. J. 2019, 36, 443–451. [Google Scholar] [CrossRef]
  42. ASTM D2166; Standard Test Method for Unconfined Compressive Strength of Cohesive Soil. ASTM International: West Conshohocken, PA, USA, 2013.
  43. Cui, M.-J.; Zheng, J.-J.; Zhang, R.-J.; Lai, H.-J.; Zhang, J. Influence of cementation level on the strength behaviour of bio-cemented sand. Acta Geotech. 2017, 12, 971–986. [Google Scholar] [CrossRef]
  44. ASTM D4767-11; Standard Test Method for Consolidated Undrained Triaxial Compression Test for Cohesive Soils. ASTM International: West Conshohocken, PA, USA, 2020.
  45. Almabrok, M.H.; Mclaughlan, R.G.; Vessalas, K.; Thomas, P. Effect of oil-contaminated aggregates on cement hydration. Am. J. Eng. Res. 2019, 8, 81–89. [Google Scholar]
  46. Albayrak, A.T.; Yasar, M.; Gurkaynak, M.A.; Gurgey, I. Investigation of the effects of fatty acids on the compressive strength of the concrete and the grindability of the cement. Cem. Concr. Res. 2005, 35, 400–404. [Google Scholar] [CrossRef]
  47. Ejeh, S.P.; Uche, O.A.U. Effect of crude oil spill on compressive strength of concrete materials. J. Appl. Sci. Res. 2009, 5, 1756–1761. [Google Scholar]
  48. Onabolu, O.A. Effect of Hot Crude Oil on Concrete for offshore storage application. Ph.D. Thesis, University of London, London, UK, 1986. [Google Scholar]
  49. Khamehchiyan, M.; Charkhabi, A.H.; Tajik, M. Effects of crude oil contamination on geotechnical properties of clayey and sandy soils. Eng. Geol. 2007, 89, 220–229. [Google Scholar] [CrossRef]
  50. Nakarai, K.; Yoshida, T. Effect of carbonation on strength development of cement-treated Toyoura silica sand. Soils Found. 2015, 55, 857–865. [Google Scholar] [CrossRef] [Green Version]
  51. Mujah, D.; Cheng, L.; Shahin, M.A. Microstructural and Geomechanical Study on Biocemented Sand for Optimization of MICP Process. J. Mater. Civ. Eng. 2019, 31, 04019025. [Google Scholar] [CrossRef] [Green Version]
  52. Evangelista, L.; Guedes, M. Microstructural studies on recycled aggregate concrete. In New Trends in Eco-Efficient and Recycled Concrete; Woodhead Publishing: Cambridge, UK, 2019; pp. 425–451. [Google Scholar] [CrossRef]
  53. Kostecki, P.; Bonazountas, T.M.; Calabrese, E.J. Contaminated Soils; Amherst Scientific Publishers: Amherst, MA, USA, 1997. [Google Scholar]
  54. Jaho, S.; Sygouni, V.; Rokidi, S.G.; Parthenios, J.; Koutsoukos, P.G.; Paraskeva, C.A. Precipitation of Calcium Carbonate in Porous Media in the Presence of n-Dodecane. Cryst. Growth Des. 2016, 16, 6874–6884. [Google Scholar] [CrossRef]
  55. Feng, K.; Montoya, B.M. Influence of Confinement and Cementation Level on the Behavior of Microbial-Induced Calcite Precipitated Sands under Monotonic Drained Loading. J. Geotech. Geoenvironmental Eng. 2016, 142, 04015057. [Google Scholar] [CrossRef]
  56. Feng, K.; Montoya, B.M. Quantifying Level of Microbial-Induced Cementation for Cyclically Loaded Sand. J. Geotech. Geoenvironmental Eng. 2017, 143, 06017005. [Google Scholar] [CrossRef]
Figure 1. Grain size distribution curve of tested sand.
Sustainability 15 00434 g001
Figure 2. UCS of solidified oil-contaminated and clean sand by: (a) biocement; (b) cement; and (c) comparison between biocement- and Portland cement-treated oil-contaminated sand.
Sustainability 15 00434 g002
Figure 3. Correlation between the permeability of the samples and the content of the cementing agent.
Sustainability 15 00434 g003
Figure 4. SEM images of biocement- and cement-treated soil: (a,b) bio-cemented clean sand (CaCO3 content 11.04%); (c,d) Portland cement-treated clean sand (cement content 11%); (e,f) bio-cemented oil-contaminated sand (CaCO3 content 11.2%); and (g,h) Portland cement-treated oil-contaminated sand (cement content 11%).
Sustainability 15 00434 g004
Figure 5. Triaxial test results at different confining pressures: (a) 9% qa curve of bio-cemented oil-contaminated sand; (b) 9% qa curve of Portland cement-treated oil-contaminated sand; and (c) qa curve of untreated sand.
Sustainability 15 00434 g005aSustainability 15 00434 g005b
Figure 6. Triaxial test diagram under 50 kPa confining pressure: (a) 9% qa curve; (b) 9% ∆u-εa curve; (c) 11% qa curve; and (d) ∆u-εa curve.
Sustainability 15 00434 g006aSustainability 15 00434 g006bSustainability 15 00434 g006c
Figure 7. Variation of peak stress ratio with cementing agent content.
Sustainability 15 00434 g007
Table 1. Summary of test details.
GroupOil
Content
Cementation Solution/MaterialCementation Solution Injection Times/
Material Content
UCS/PermeabilityCU
BOS5%16 U/mL bacteria culture + 2 mol CS4, 5, 6, 7, 84, 8
BCS0%
PCOS5%32.5 Portland cement9%, 11%, 13%, 15%9%, 15%
PCS0%
Table 2. qmax, effective stress parameters c′ and ϕ′ for untreated sand, MICP-treated oil sand and cement-treated oil sand.
Materialqmax (kPa)
3 = 50 kPa)
qmax (kPa)
3 = 100 kPa)
qmax (kPa)
3 = 200 kPa)
c′ (kPa)ϕ′ (°)
Untreated clean sand215477723038.7
Bio-cemented oil-contaminated sand828.7971.71137.4209.731.2
Portland cement-treated oil-contaminated sand140.0227.5352.424.125.0
Disclaimer/Publisher’s Note: The statements, opinions and data contained in all publications are solely those of the individual author(s) and contributor(s) and not of MDPI and/or the editor(s). MDPI and/or the editor(s) disclaim responsibility for any injury to people or property resulting from any ideas, methods, instructions or products referred to in the content.

