Abstract
Fluorinated gases (F-gases) used as refrigerants in air conditioners have a significant global warming effect, so their release into the atmosphere must be minimized. The purpose of this study was to evaluate and compare the environmental impact of two treatment methods: reclamation and destruction after refrigerant recovery. Plant data for R410A, R32, R134a, and R22 were collected from Japan and Europe and evaluated in terms of greenhouse gas (GHG) emissions, energy consumption, and the Life-cycle Impact assessment Method based on Endpoint modeling 3 (LIME3). As for GHG emissions, the results per kg of used refrigerant showed that the reclamation process emitted approximately 5.7 to 15.9 kg CO2-eq less than the destruction process. In addition, the energy consumption was found to be 82.5 to 250.6 MJ lower, and, for LIME3, the results were found to be USD 0.40 to 0.97 lower for the reclamation compared with the destruction. This trend was the same regardless of the refrigerant type and location, and it was quantitatively clarified that the environmental impact was smaller for the reclamation process than for the destruction process.
1. Introduction
Global cooling demand is expected to grow significantly in the future, especially in developing countries, such as India, China, and Indonesia, and there are concerns that electricity consumption and its global warming impact will increase by about three times between 2016 and 2050 [1]. The life-cycle global warming impact of air conditioners and refrigeration equipment can be divided into two main categories: indirect impacts due to carbon dioxide emissions from energy consumption during equipment use, and direct impacts when refrigerants are emitted into the atmosphere. Comparative evaluation results have been reported for various types of refrigerants and equipment (Wan et al. 2021 [2]; Troch 2016 [3]; Hill and Papasavva 2005 [4]; Banks and Sharatt 1996 [5]; Chen, 2008 [6]; Spatz and Motta, 2004 [7]; Aprea et al. 2016 [8]; Bovea et al., 2007 [9]; Cao and Hwang 2022 [10]; Jovell et al. 2022 [11]; Wang et al. 2021 [12]). For example, using a simulation, Jovell et al. 2022 [11] showed that the R32 recovery from wasted R407F has considerably lower environmental impacts than the production of fresh R32, with a global warming potential (GWP) reduction of 86% (10.9 vs. 2.13 kgCO2eq). Wang et al. 2021 [12] reported that the refrigerant-manufacturing CO2 emissions were about 15.9 kgCO2eq per kg for the R134a production process. Troch 2016 [3] found that an advanced cycle heat pump with low GWP refrigerants (10) can reduce the total lifetime carbon dioxide emissions by 13.7%, 16.3%, and 18.6% compared to a conventional cycle heat pump with R410A.
On the other hand, F-gases (fluorinated gases: Hydrofluorocarbons (HFCs), Perfluorochemicals (PFCs), Sulfur Hexafluoride (SF6), Nitrogen trifluoride (NF3)) account for about 2% of global GHG emissions [13]. About 20,000 tons of HFCs are produced every year in Europe and Japan, representing about 35–45 MT of CO2 [14,15]; China is the largest producer (60% of the global production), with more than 300,000 tons produced annually (based on 2013 figures) [16,17]. R410A, R32, and R134a are widely used refrigerants; R22 is still used in developing countries, but it is no longer mainstream in developed countries. R22 is a refrigerant with excellent characteristics in terms of performance, safety, and economy, but it is an HCFC refrigerant with production as a refrigerant that was discontinued in developed countries in 2019 due to its ozone-depleting effects. There is still a lot of equipment on the global market that uses R22, as there is demand for service refrigerants. R410A is an HFC refrigerant that has no ozone-depleting effect and was developed as an alternative refrigerant to R22. It is widely used in residential and commercial air conditioners and refrigeration. R32 is positioned as a low-level GWP refrigerant and as one of the technological innovations necessary to reduce environmental and safety risks associated with refrigerants [18], so conversion from R410A to R32 is being promoted worldwide. R134a is widely used in car air conditioners, refrigerators, and turbo chillers, though conversion to lower GWP values is underway.
Under the Kigali Amendment [19], which added greenhouse gases as target substances to the protocol framework, it was agreed to gradually reduce the production and consumption of HFCs in terms of GWP values. HFCs, the main constituents of F-gas, account for about 86% of F-gas production [20] and are mostly used as refrigerants for refrigeration and air-conditioning equipment. Although countries are switching to refrigerants with lower GWP values, for example, from R410A to R32, there is a growing demand for cooling in developing countries. Even in developed countries, practical refrigerants with sufficiently low GWP values have not yet been found for all applications. Therefore, there are concerns that the refrigerant supply might not be enough in the near future, meaning prices would skyrocket [21,22]. Against this background, there is a movement to position refrigerant reclamation as a key part of the HFC emissions reduction strategy and to mandate the use of a certain amount of reclaimed refrigerant in new equipment [23,24].
It will take a considerable amount of time to complete the conversion of refrigerants, and service refrigerants are needed to continue to keep the pre-transition existing units in use for a period equivalent to the equipment’s life. Thus, during the transition period, there will still be a demand for pre-transition refrigerants, and it is desirable to actively utilize reclaimed refrigerants rather than producing new refrigerants. The use of reclaimed refrigerants can replace the production of new refrigerants and reduce GHG emissions and energy consumption during production. Furthermore, the amount of fluorite mined, which is the raw material for HFC refrigerants, can be reduced, which is desirable from the perspective of resource recycling and the circular economy.
Previous studies on the environmental assessment of the refrigerant life cycle, focusing on refrigerant recovery and its treatment, are limited [11,12,25]. Currently, there is no information available in the literature based on actual plant survey data that evaluates R410A and R134a, which have relatively large refrigerant-recovery volumes. Assuming that refrigerant recovery at the time of equipment disposal will be promoted worldwide to achieve carbon neutrality in the future, using indicators such as GHG emissions (kgCO2-eq), energy consumption (MJ), and LIME3 (USD), this study investigated the actual performance data of reclamation, destruction, and manufacturing facilities for R410A, R32, R134a, and R22. The system boundary was set up from the equipment disposal to the supply of other equipment.
In this study, we evaluated the desirable treatment methods for recovered refrigerants, not only from the perspective of global warming mitigation but also from the perspective of resource recycling and the circular economy. Compared to previous studies, this study considered not only the refrigerant production process but also the treatment process of recovered refrigerants and compared the environmental impact assessments of the two treatment methods: destruction and reclamation. The study also considered two aspects of the reclamation process: the treatment of recovered refrigerants and the refrigerant production method. Additionally, according to the authors’ knowledge, for the first time, different treatment methods after refrigerant recovery in different locations and for different refrigerants using real facility data were evaluated and compared. We believe that this led to more general findings.
2. Materials and Methods
2.1. Goal and Scope
The goal of this study was to evaluate and compare the environmental impact of two treatment methods: reclamation and destruction after refrigerant recovery. An evaluation was made based on the data obtained from a survey conducted on the actual status of reclamation, destruction, and manufacturing facilities for general air-conditioning refrigerants.
R410A and R22 were targeted in Japan, while R410A and R134a were targeted in Europe. Japan has the highest refrigerant-recovery rate in the world at about 40% [22], and Europe is a region where heat pump installations are rapidly increasing under the re-Power EU program [18]; additionally, demand for refrigerants is rising. These two locations were chosen as it was possible to collect the data for production/destruction/reclamation for various plants using different treatment methods. For R32, which is becoming mainstream as a low-GWP refrigerant, the amount recovered was still small, and data on reclamation and destruction were not available; therefore, the evaluation for R32 was based on estimated results using survey data for R410A, with the exception of one plant for batch distillation. As for manufacturing, some refrigerants are imported from China, so in addition to Japan and Europe, manufacturing facilities in China (Figure A6 and Figure A7) were also surveyed. The treatment methods of the reclamation and destruction facilities surveyed are shown in Table 1. As for the refrigerant-recovery method, segregated gas recovery is common in Japan, while batch recovery of gas types is common in Europe. The simplified system boundary for this study is provided in Figure 1.

Table 1.
Refrigerants and treatment methods assessed in this study. The following table shows the treatment methods and the refrigerants to be treated that make up the product systems under study in this survey. ●: Treatment systems assessed based on primary data. The number in parentheses represents the number of sites where data was collected. ▲: Adaptation of the primary data collected in ●.
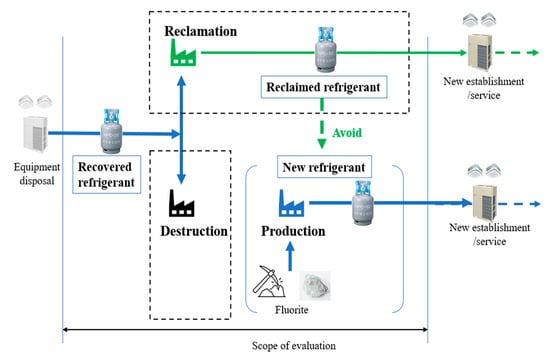
Figure 1.
System boundary for this study.
In this study, a cut-off was applied when data collection was presumed to be difficult or when the contribution of the load was considered small. The cut-off items are listed below:
- Manufacturing, transportation, and post-use treatment processes of packaging materials for raw materials and auxiliary materials;
- Sub-materials used for general purposes in factories that are not directly related to the production of products, such as gloves, masks, uniforms, products for cleaning, etc.;
- Construction of the facilities or transportation services not related to refrigerants, such as cars, ships, trains, and capital goods used for multiple years (however, capital goods included in secondary data are covered, and land use occupied by the factories is included in the calculation).
Additional information related to the life-cycle flowcharts for the different detailed production, destruction, and reclamation treatment processes is provided in Appendix A. Several observations can be made concerning Figure A1, Figure A2, Figure A3, Figure A4 and Figure A5.
In Figure A1, the destruction process “superheated-steam incineration” is presented: The refrigerant is destroyed in a vapor phase under very high temperatures. When mixed with F-gas, water vapor and air are preheated up to approximately 500 °C and fed into a tubular reactor with walls that are electrically heated up to 800–1000 °C [26]. The resulting exhaust gas is fed into a scrubber to be quenched with a calcium hydroxide solution (also called slaked lime) to neutralize the acid gases.
In Figure A2, the destruction process “liquid-injection incineration” is presented. A typical liquid-injection incinerator consists of a waste-burner feed system, an auxiliary fuel system, an air supply system, and a combustion chamber [27]. F-gas is sped into the furnace with a combustion improver, waste oil, and a waste-melting agent [28]. A typical combustion temperature in the chamber is in the range of 700–1700 °C. Fluorite can be recovered from the destruction process to produce hydrofluoric acid later.
In Figure A3, the destruction process “gaseous/fume oxidation” is presented. Waste refrigerants and water vapors are thermally destroyed in fire-resistant combustion chambers [26]. Hydrofluoric and hydrochloric acids can be recovered from the destruction process.
In Figure A4, the reclamation process “simple distillation” is presented. Simple distillation, used for separating components with boiling points that are different by a significant degree, can be used to remove non-refrigerant contaminants (e.g., oil) by evaporating components and then condensing them in separation [29].
In Figure A5, in batch rectification, solvent vapors pass through a fractionating column, where they contact condensed solvent (reflux) entering at the top of the column. Solvent not returned as reflux is drawn off as overhead product [30].
In this study, cutoffs were made for processes for which data collection was presumed to be difficult or for which the contribution of the load was considered small, such as the manufacturing, transportation, and post-use treatment processes of packaging materials or the leakage during recovery of processed refrigerant from waste equipment.
2.2. Life-Cycle Inventory (LCI) Data
The evaluation was conducted using a functional unit: 1 kg of used refrigerant. From the perspective of disposing of air-conditioning equipment and recovering refrigerant, it is appropriate to set the functional unit per recovered refrigerant, as this study wants to compare the environmental impacts of destruction treatment and reclamation treatment as a method for treating recovered refrigerant. On the other hand, from the perspective of manufacturing, installing, or purchasing equipment, it is appropriate to use the functional unit per produced refrigerant, as it is also desirable to compare the environmental impacts of newly produced refrigerant and reclaimed refrigerant; this latter aspect is evaluated in Section 4.2. In this LCA, the following data were collected to evaluate the environmental impact of used refrigerant, from receipt to treatment to final disposal of waste, avoiding production of new refrigerants through reclamation of used refrigerant. Additional information is provided in Table 2 to indicate the source of the data for this LCA.
Table 2.
Details of processes and data types.
The life-cycle database AIST IDEA v2.3 (English version) contained inside the LCA software Simapro (version) 9.3 (PRé Sustainability, Amersfoort, Netherlands) was used as a background LCA database. Concerning secondary data in the background databases, other than heat sources for electricity and steam, the same processes were used whether in Japan, China, or Europe. For Japan, the source of the power supply was selected based on the factory’s address. Additionally, as primary data, the recovery ratios calculated for the different reclamation technologies through a survey in the different facilities are provided in Table A1.
2.3. Life-Cycle Impact Assessment (LCIA)
GHG emissions (kgCO2-eq), energy consumption (MJ), and LIME3 (USD) were used as indicators to evaluate the environmental impacts in this study. The GHG emissions were calculated using the GWP AR5 (IPCC 2013 GWP 100a) developed by the Intergovernmental Panel on Climate Change, which contains the climate change factors of IPCC with a timeframe of 100 years. The GWP AR5 values shown below (Table 3) were used to calculate GHG emissions. The GWP value for R410A is 1920 kgCO2-eq/kg in AR5, but, in this calculation, R410A was treated as a mixture of R32 and R125; therefore, a GWP value of 1924 kgCO2-eq/kg was used. Energy consumption was evaluated based on the resource consumption of coal, oil, and natural gas. LIME3 is an indicator developed by Inaba and Itsubo [31] as part of the outcome of a national project in Japan. It is an index that comprehensively identifies and calculates multiple environmental impacts, weights them, and evaluates them in an integrated manner as the calculated amount of damage expressed in USD [31,32]. The consumption-based integration factors for Japan, Germany, and China were used with the G20 population weighting average and a discount rate of 5%.
Table 3.
GWP by refrigerant type.
3. Results
3.1. GHG Emissions
3.1.1. Production Process
The average GHG emissions per 1 kg of produced refrigerant are shown in Figure 2 (values are shown in Table A2). This calculation was necessary to evaluate the avoided emissions for the reclaimed refrigerant.
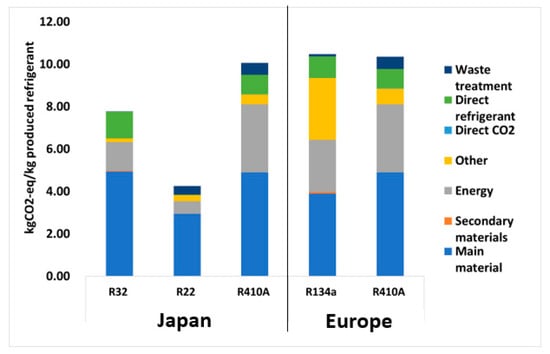
Figure 2.
GHG emissions per refrigerant manufacture (kgCO2eq/kg of produced refrigerant). Main material refers to the main materials used for the production of the refrigerant, such as anhydrous hydrofluoric acid and methylene chloride. Secondary materials refer to other types of chemicals, such as sodium hydroxide. Energy refers to steam and electricity. Other refers to other processes, such as transportation services related to the refrigerants, water supply, etc. Direct CO2 refers to direct CO2 emissions. Direct refrigerant refers to direct refrigerant emissions. Waste treatment refers to the waste treatment of the manufacturing plant.
Results were found in the range of 4.26 (R22 Japan) to 10.5 (R134a Europe) kgCO2-eq per kg of refrigerant produced. For the main material, most of the impacts occur due to the production of chemicals (37–69%) required for refrigerant production: methylene chloride (R32, R410A), tetrachloroethylene (R125, R410A), and methane derivatives (R22). The remaining impacts occur due to heat and electricity (0–44%).
Several observations can be added: R410A was produced by mixing R32 and R125. Therefore, very little electricity or energy was used, and almost all of the production GHG-emission load is for R32 and R125 refrigerants; the contribution of R32 and R125 to the total GHG emission was about 50% each (for R125, the main material and energy accounted together for 80% of the refrigerant production impact). For R134A, distillation water is fed into the system, which accounts for an important source of CO2 emissions (“other”).
The results obtained were similar to the values of 10.9 CO2eq/kg for R32 and 14 CO2eq/kg for R410A reported elsewhere (Jovell et al. 2022 [11]; Dieckmann 1999 [33]). It has to be noted that the data from Jovell et al. are simulated values, not actual data, for the purpose of developing new reclamation methods using ionic liquids.
3.1.2. Whole Scope
The GHG emissions related to the treatment of 1 kg of used refrigerant are shown in Figure 3 (values shown in Table A3). When considering only the environmental burden without any credits, the results for the destruction of the refrigerant were, on average, more than twice as high as the reclamation of refrigerant. When including the credits due to the refrigerant reclamation that replaced the production of new refrigerant in the case of the reclamation process, as well as the credits due to the recycled acids and regenerated fluorite in the case of the destruction process, the GHG emissions in the reclamation processes were 5.7 to 15.9 kgCO2eq less than those from destructive treatment in Japan and approximately 7.8 to 9.9 kgCO2eq less than those from destructive treatment in Europe.
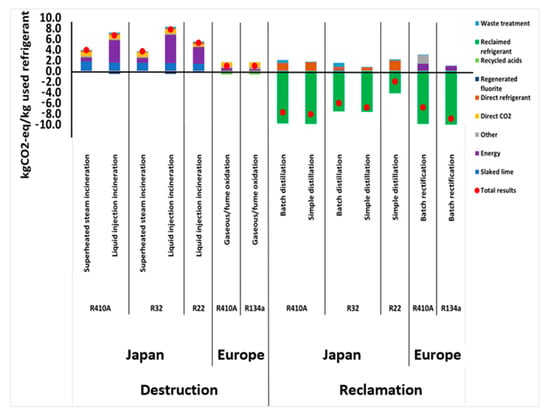
Figure 3.
GHG emissions related to the treatment of 1 kg of used refrigerant (kgCO2eq/kg of used refrigerant).
The effect of the reclamation process in obtaining reclaimed refrigerant and replacing the production of new refrigerant, as well as the benefits induced by the recycled acids and regenerated fluorite in the case of the destruction process, are expressed on the lower part of the X-axis. When considering the recovery and substitution effect of fluorite and hydrofluoric acid for the destruction of refrigerant, gaseous/fume oxidation achieved the best performance, with an average value of 0.95 kgCO2-eq/kg of used refrigerant, compared with 3.8 for superheated-steam incineration and 6.6 for liquid-injection incineration. The GHG emissions value for the gaseous/fume oxidation in Europe was lower than the other destruction methods because gaseous/fume oxidation outputs hydrochloric acid and hydrofluoric acid water as (valuable) by-products, thus eliminating the need for sludge treatment.
Liquid-injection incineration has higher GHG emissions than superheated-steam incineration. This is because the investigated liquid-injection-incineration plant is dedicated to destroying recovered refrigerants and is used to destroy a wide range of other chemical substances that are by-product outputs when producing other fluorinated compounds. This operational condition forces the plant to operate at higher temperatures than those required for refrigerant destruction only, resulting in excessive energy consumption. Furthermore, the additional drying process, after precipitation and dehydration to recover fluorite, increases energy consumption.
For the reclamation processes, no significant differences were found with regard to the method. The reclamation process can further reduce GHG emissions, as it can substitute for new refrigerant production.
3.2. Energy Consumption
The results of energy consumption per 1 kg of used refrigerant are shown in Table A4. The energy consumption was shown to be, on average, 155 MJ higher for the destruction results than the reclamation. Overall, the results were found to have a similar trend to the results obtained for the GHG emissions with the importance of credits for the reclaimed refrigerant (reclamation in Japan and Europe).
3.3. LIME3 (Integrated Weighted Evaluation Index)
The results of LCIA per 1 kg of used refrigerant are shown in Figure 4 (values shown in Table A5). The weighting results (external costs) were shown to be, on average, USD 0.65 higher for the destruction results than the reclamation. Similar to the GHG emissions and energy consumption, in this section, the effect of the reclamation process on obtaining reclaimed refrigerant and replacing the production of new refrigerant, as well as the benefits induced by the recycled acids and regenerated fluorite, in the case of the destruction process, are also considered (reported as “credits”).
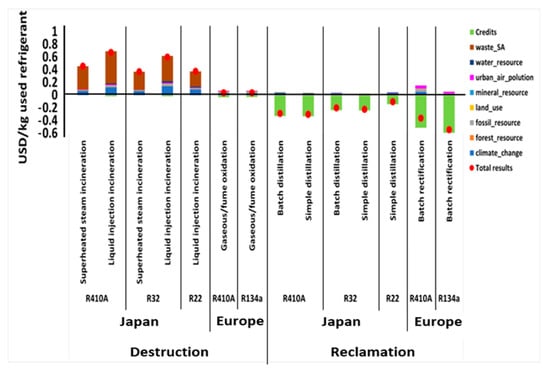
Figure 4.
LIME3 impacts breakdown per impact category (USD/kg used refrigerant).
For the destruction processes, when looking at the breakdown per process in Japan, the waste treatment (waste_SA) showed a significant contribution to the destruction processes in Japan, USD 0.37 on average; this is mainly due to the wastewater amount generated by the treatment process, about 2 kg per kg of used refrigerant for the destruction processes in Japan. The other impact categories were almost negligible except for climate change for R410A and R32 (about 0.15 USD/kg of used refrigerant). For the European refrigerant, no particular process could be highlighted as a main contributor to the burden. It should be noted that no waste is generated in Europe, as the plants investigated this time recovered hydrofluoric acid through gaseous/fume oxidation; therefore, the environmental impact is rather small.
For the reclamation process, no particular impact could be highlighted. No trade-off could be observed between the impact categories, whether for reclamation or destruction. Indeed, when looking at the results for each impact category, reclamation was shown to have lower impacts than destruction, and the trend observed for climate change was also valid for the other impact categories, including resource consumption. The impacts from waste treatment on destruction treatment and the dominant effect of credits on reclamation treatment indicate that reclamation treatment is desirable from the perspective of resource recycling and the circular economy.
4. Discussion
4.1. Comments on Section 3
Most GHG emissions during reclamation in Japan are attributable to sampling gases during refrigerant inspections. These emissions can be reduced by ensuring separate recovery of each refrigerant type, reducing the number of inspections, and destroying the sampling gases.
If the reclamation is difficult, the recovered refrigerant has to be destroyed. Liquid-injection incineration provides fluorite from the destruction products, which can be used as a raw material for chemical recycling to produce refrigerant again. This is considered desirable from the perspective of resource recycling, but there is a trade-off with energy consumption, GHGs, and the amount of sludge generated. Gaseous/fume oxidation in Europe can recover hydrochloric acid and hydrofluoric acid water instead of fluorite and is considered the preferred treatment method if those applications are available. Future research is required on desirable resource recovery methods from the perspective of promoting resource recycling.
4.2. Reclaimed Refrigerant as a Product: Setting the Functional Unit as the Production of 1 kg of Reclaimed Refrigerants
In Section 3, a comparison was made between destruction treatment and reclamation treatment as treatment methods for the recovered refrigerant. Alternatively, the treatment of refrigerant can be seen in another way, which focuses on the reclaimed refrigerant as a product. In this case, the reclamation process can be regarded as a production method. Figure 5 shows the situation where the standardized flow that generates 1 ton of reclaimed refrigerant is set as the functional unit and compared with its equivalent by the destruction of used refrigerant and the creation of new refrigerant. From the perspective of disposing of air-conditioning equipment and recovering refrigerant, it is appropriate to set the functional unit per recovered refrigerant, as this study wants to compare the environmental impacts of destruction treatment and reclamation treatment as a method for treating recovered refrigerant. On the other hand, from the perspective of manufacturing, installing, or purchasing equipment, it is appropriate to use the functional unit per produced refrigerant, as it is also desirable for comparing the environmental impacts of newly produced refrigerant and reclaimed refrigerant. The difference between the two is whether the reclamation process is regarded as a process that replaces the production of a new refrigerant or whether the production of a new refrigerant is necessary after the destruction treatment within the same system boundary. The LCIA results are also uniformly affected by the yield of the reclamation process. Therefore, in this section, we also evaluated and compared the destruction and reclamation treatment per 1 kg of reclaimed refrigerant, using R410A as a reference in accordance with the general LCA approach. R410A was selected as it has the highest recovery volume for the time being in Japan.
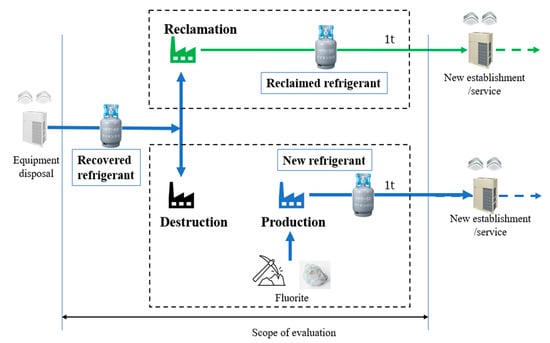
Figure 5.
System boundaries for the new functional unit (1 ton of available reclaimed refrigerant/new refrigerant).
Figure 6 shows the results of a comparison of the environmental impact of the reclamation process and the destruction process, using R410A, the most recovered refrigerant in Japan, as an example, based on 1 ton of available reclaimed refrigerant. In this graph, each of the three processes is shown: reclamation treatment, destruction treatment, and refrigerant production.
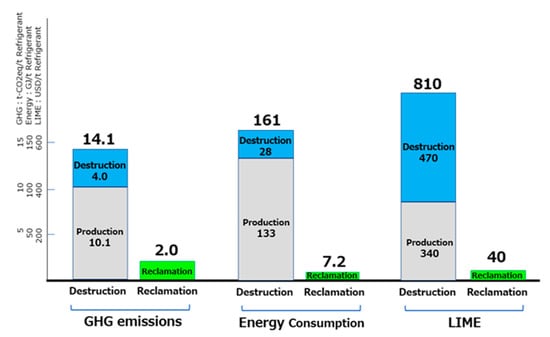
Figure 6.
Comparison of the environmental impact of reclamation and destruction (per 1 t of produced refrigerant for R410A).
It can be seen that, for all the indicators, GHG emissions, energy consumption, and LIME3 results, the reclaimed treatment is smaller than the destruction treatment. This trend was similar regardless of refrigerant and region (14.1 vs. 2 tonCO2eq; 161 vs. 7.2 GJ; 810 vs. 40 USD, respectively).
The results were in the same range as Jovell et al. 2021 [11], who showed that refrigerant reclamation had considerably lower environmental impacts than the production of fresh R32, with a GHG emissions reduction of 86% (10.9 vs. 1.5 kgCO2eq/kg, respectively, for produced and reclaimed refrigerants).
4.3. Novelty and Critical Comparison with the Previous Studies
At first, before comparing the results with the previous studies, as explained in the introduction, it has to be highlighted that most of the previous studies only reported on refrigerant production emissions and did not focus on the destruction/reclamation of refrigerant because they assessed the life cycle of air conditioners and refrigeration equipment, not the life cycle of refrigerants. Therefore, only a little information is available in the literature.
According to the authors’ knowledge, recently, only two research articles (Jovell et al. and Wang et al.) focused on the refrigerant disposal treatment. Jovell et al. tried to assess the environmental impact of refrigerant reclamation for R32 using the commercial blend R407F. Wang et al. [12] compared CO2 emissions between new refrigerant production and reclaimed refrigerant for R134a. Indeed, R32 was only introduced to the market recently; knowing that the total life-cycle of an air-conditioner is more than 10 years on average, it is necessary to consider the refrigerants that could be reclaimed soon, i.e., the ones used in the oldest machines. For example, in Japan, even if residential and commercial split systems have already shifted to R32, packaged units will shift from R410A by 2025. In accordance with the actual situation of refrigerant transition, we evaluated R410A, which currently has the highest refrigerant-recovery amount [34]; R22 and R134a, which have a large refrigerant-recovery amount. Since R32 [34] has only recently been introduced to the market, the amount of refrigerant recovery is not yet large, and R407F, as presented by Jovell et al., has not been adopted for residential air conditioners or general commercial air conditioners.
It has to be also noted that Jovell et al. [11] used computer simulation values, while Wang et al. [12] adopted equipment-rating catalog values as the values for reclamation treatment, whereas the evaluation in our study is more in line with the actual plant operation. Wang et al. [12] did not consider destruction. While looking closely at the results reported by Jovell et al., the results for the production of R32 were reported to be 10.9 kgCO2eq for the GHG emissions (vs. 7.77 kgCO2eq for R32 in our study results per 1kg of produced refrigerant are provided in Table A6) and 115 MJ for the energy use (vs. 147 MJ for R32 in our study). For the reclamation, the results were 1.5 kgCO2eq (vs. 1.6 kgCO2 eq for R32; batch distillation in our study) and 2.13 MJ (vs. 15.7 MJ for R32 in our study). The results are close to ours, even though the impact of the reclamation was lower in Jovell et al. (results for destruction were not provided). One possible reason is that in Jovell et al., the fugitive emissions during the production process of fluorinated ionic liquids and in the process of recovering R32 and regenerating fluorinated ionic liquids were mostly considered: representing 90% of the GWP vs. 30% in our study. Waste treatment after R32 separation (a mixture of R32, R125, and R134a) was also not considered, though it accounted for about 50% of the GHG emissions in our study. Those observations could lead to the conclusion that it was worth collecting the information related to the actual plants’ energy use and waste treatment processes in our study. It is difficult to compare our results with Wang et al. 2021, as their results were not provided per functional unit (i.e., kg), and a breakdown of the results was also not provided.
Finally, in other documents [11,12], only one type of refrigerant and one type of treatment method were evaluated; however, in this study, multiple plants/regions and multiple refrigerants were consistently evaluated and compared using the same method. We believe that this led to more general findings. In addition, this study provided the first detailed analysis on refrigerant reclamation from both a global warming control and circular economy perspective, using three indicators: GHG emissions, energy consumption, and LIME3.
4.4. Limitations
From the viewpoint of LCA, AIST IDEA v2.3 (AIST, Tokyo, Japan) was used as the background data, including the main raw materials for refrigerant production; however, Japanese background data were applied to the production process in China. Although some adaptations were made to suit each country’s circumstances, such as the use of coal for electricity and energy, the challenge is to examine these background processes more closely in order to improve the accuracy of the refrigerant production data.
4.5. Further Research
Further research issues for the future include scrutiny of the background processes of refrigerant production, understanding the material flow of sludge generated during destruction treatment for each disposal method, understanding and improving the trade-off in the chemical-recycling process, and understanding the environmental impact of promoting recovery and reclamation on a global scale.
5. Conclusions
As the GWP value of refrigerants used in refrigeration and air-conditioning equipment is large, the GHG emission-reduction effect of refrigerant recovery is very large, so refrigerant recovery is an effective and essential measure from the perspective of combating global warming, alongside switching to practical refrigerants with low GWP values. On the other hand, the recovered refrigerant must be treated, either by destruction or reclamation. The objective of this study was to evaluate and compare the environmental impact of reclamation and destruction treatment methods for recovered refrigerants from refrigeration/air-conditioning equipment. Primary data consistent with the system boundary were collected, and the environmental impact of each treatment method could be quantified.
The GHG emissions from reclaimed treatment per kg of used refrigerant were approximately 5.7 to 15.9 kg CO2eq less than those from destructive treatment, confirming that the promotion of reclaimed treatment together with refrigerant recovery can contribute to global warming mitigation. The trend was also confirmed for energy consumption (82.5 to 250.6 MJ per kg of used refrigerant) and LIME3 (0.40 to 0.97 USD). This trend was similar for different refrigerant types and different treatment regions (Japan and Europe). This is thought to be due to the fact that reclamation treatment has a significant effect in terms of replacing the production of new refrigerants. A comprehensive environmental impact analysis using LIME3 considered the dominant impact of waste treatment in destruction treatment and the dominant effect of credits in reclamation treatment; the results of this analysis indicate that reclamation treatment, which avoids the need for new mining of fluorite, the raw material of refrigerants, is desirable from the perspective of resource recycling and the circular economy.
It is expected that the recovery and reclamation of refrigerants will be promoted globally from the viewpoints of global warming mitigation, Kigali Amendment compliance, and resource recycling.
Author Contributions
Conceptualization, N.I. and K.S.; methodology, Y.Y. and K.S.; software, Y.Y. and K.S.; validation, N.I. and F.Y.; formal analysis, Y.Y. and K.S.; investigation, Y.Y.; resources, Y.Y. and S.K.; data curation, Y.Y.; writing—original draft preparation, S.K.; writing—review and editing, S.K.; visualization, Y.Y.; supervision, N.I. and F.Y. All authors have read and agreed to the published version of the manuscript.
Funding
This research received no external funding.
Institutional Review Board Statement
Not applicable.
Informed Consent Statement
Not applicable.
Data Availability Statement
The data used in this study is confidential therefore it cannot be shared.
Conflicts of Interest
The authors declare no conflict of interest.
Appendix A

Figure A1.
Life-cycle flowchart (destruction: superheated-steam incineration).
Figure A1.
Life-cycle flowchart (destruction: superheated-steam incineration).


Figure A2.
Life-cycle flowchart (destruction: liquid-injection incineration).
Figure A2.
Life-cycle flowchart (destruction: liquid-injection incineration).


Figure A3.
Life-cycle flowchart (destruction: gaseous/fume oxidation).
Figure A3.
Life-cycle flowchart (destruction: gaseous/fume oxidation).


Figure A4.
Life-cycle flowchart (reclamation: simple distillation/batch distillation).
Figure A4.
Life-cycle flowchart (reclamation: simple distillation/batch distillation).


Figure A5.
Life-cycle flowchart (reclamation: batch rectification).
Figure A5.
Life-cycle flowchart (reclamation: batch rectification).


Figure A6.
Life-cycle flowchart (R410A production, Japan).
Figure A6.
Life-cycle flowchart (R410A production, Japan).


Figure A7.
Life-cycle flowchart (R410A production, Europe).
Figure A7.
Life-cycle flowchart (R410A production, Europe).

Table A1.
Average calculated recovery ratio based on a survey of the different reclamation technologies.
Table A1.
Average calculated recovery ratio based on a survey of the different reclamation technologies.
| Reclamation Technology | Location | Refrigerant | Recovery Ratio |
|---|---|---|---|
| Batch distillation | Japan | R22 | 95.0% |
| Batch distillation | Japan | R32 | 97.4% |
| Batch distillation | Japan | R410A | 97.4% |
| Batch rectification | Europe | R134a | 95.6% |
| Batch rectification | Europe | R410A | 95.6% |
| Simple distillation | Japan | R22 | 97.9% |
| Simple distillation | Japan | R32 | 98.3% |
| Simple distillation | Japan | R410A | 98.3% |
Table A2.
GHG emissions per refrigerant manufacture (kgCO2eq/kg produced refrigerant).
Table A2.
GHG emissions per refrigerant manufacture (kgCO2eq/kg produced refrigerant).
| Country of Implementation | Refrigerant | Country of Production | Total | Main Material | Secondary Materials | Energy | Other | Direct CO2 | Direct Refrigerant | Waste Treatment |
|---|---|---|---|---|---|---|---|---|---|---|
| Japan | R32 | Japan | 7.77 | 4.93 | 0.04 | 1.36 | 0.16 | x | 1.27 | 0.00 |
| China | 10.01 | 5.34 | 0.05 | 2.85 | 0.24 | x | 1.53 | 0.01 | ||
| R22 | Japan | 4.26 | 2.94 | 0.01 | 0.59 | 0.29 | x | 0.01 | 0.42 | |
| R410A | Japan | 10.07 | 4.89 | x | 3.22 | 0.45 | 0.02 | 0.91 | 0.57 | |
| Europe | R125 | China | 9.59 | 3.65 | 0.03 | 4.20 | 0.53 | 0.03 | 0.01 | 1.12 |
| R134a | Europe | 10.48 | 3.90 | 0.07 | 2.46 | 2.91 | x | 1.02 | 0.11 | |
| R410A | Europe | 10.35 | 4.89 | 0.00 | 3.22 | 0.73 | 0.02 | 0.91 | 0.57 |
Table A3.
GHG emissions related to the treatment of 1 kg of used refrigerant (kgCO2eq/kg used refrigerant.
Table A3.
GHG emissions related to the treatment of 1 kg of used refrigerant (kgCO2eq/kg used refrigerant.
| Refrigerant Treatment Method | Country of Implementation and Refrigerant | Refrigerant | Treatment Detail | Total | Slaked Lime | Energy | Other | Direct CO2 | Direct Refrigerant | Regenerated Fluorite | Recycled Acids | Reclaimed Refrigerant | Waste Treatment |
|---|---|---|---|---|---|---|---|---|---|---|---|---|---|
| Destruction | Japan | R410A | Superheated steam incineration | 27.62 | 8.65 | 14.22 | 2.85 | x | x | x | x | x | 1.89 |
| Liquid injection incineration | 98.55 | 7.62 | 93.55 | 2.77 | x | x | −9.16 | x | x | 3.77 | |||
| R32 | Superheated steam incineration | 27.79 | 7.56 | 16.01 | 2.48 | x | x | x | x | x | 1.75 | ||
| Liquid injection incineration | 123.55 | 7.31 | 116.53 | 3.37 | x | x | −8.79 | x | x | 5.12 | |||
| R22 | Liquid injection incineration | 75.73 | 6.60 | 68.98 | 1.33 | x | x | −4.25 | x | x | 3.08 | ||
| Europe | R410A | Gaseous/fume oxidation | 4.00 | x | 9.26 | 6.53 | x | x | x | −11.80 | x | 0.00 | |
| R134a | Gaseous/fume oxidation | 3.01 | x | 6.59 | 7.97 | x | x | x | −11.55 | x | 0.00 | ||
| Reclamation | Japan | R410A | Batch distillation | −118.51 | x | 2.09 | 0.57 | x | x | x | x | −129.22 | 8.05 |
| Simple distillation | −127.00 | x | 1.13 | 0.46 | x | x | x | x | −130.35 | 1.76 | |||
| R32 | Batch distillation | −100.18 | x | 2.92 | 0.59 | x | x | x | x | −115.47 | 11.78 | ||
| Simple distillation | −112.69 | x | 1.58 | 0.45 | x | x | x | x | −116.48 | 1.76 | |||
| R22 | Simple distillation | −54.85 | x | 1.38 | 0.46 | x | x | x | x | −60.21 | 3.53 | ||
| Europe | R410A | Batch rectification | −87.14 | x | 22.78 | 21.35 | x | x | x | x | −130.42 | −0.85 | |
| R134a | Batch rectification | −124.75 | x | 15.31 | 1.59 | x | x | x | x | −141.56 | −0.09 |
Table A4.
Energy consumption related to the treatment of 1 kg of used refrigerant (MJ/kg used refrigerant).
Table A4.
Energy consumption related to the treatment of 1 kg of used refrigerant (MJ/kg used refrigerant).
| Refrigerant Treatment Method | Country of Implementation and Refrigerant | Refrigerant | Treatment Detail | Total | Slaked Lime | Energy | Other | Direct CO2 | Direct Refrigerant | Regenerated Fluorite | Recycled Acids | Reclaimed Refrigerant | Waste Treatment |
|---|---|---|---|---|---|---|---|---|---|---|---|---|---|
| Destruction | Japan | R410A | Superheated steam incineration | 3.90 | 1.78 | 0.79 | 0.21 | 0.79 | 0.19 | x | x | x | 0.15 |
| Liquid injection incineration | 6.68 | 1.57 | 4.22 | 0.20 | 0.79 | 0.19 | −0.55 | x | x | 0.27 | |||
| R32 | Superheated steam incineration | 3.69 | 1.56 | 0.89 | 0.18 | 0.85 | 0.07 | x | x | x | 0.16 | ||
| Liquid injection incineration | 7.76 | 1.51 | 5.26 | 0.25 | 0.85 | 0.07 | −0.53 | x | x | 0.36 | |||
| R22 | Liquid injection incineration | 5.25 | 1.36 | 3.12 | 0.10 | 0.51 | 0.20 | −0.24 | x | x | 0.22 | ||
| Europe | R410A | Gaseous/fume oxidation | 0.96 | x | 0.51 | 0.32 | 0.79 | x | x | −0.67 | x | 0.00 | |
| R134a | Gaseous/fume oxidation | 0.95 | x | 0.36 | 0.38 | 0.86 | x | x | −0.65 | x | 0.00 | ||
| Reclamation | Japan | R410A | Batch distillation | −7.74 | x | 0.15 | 0.04 | x | 1.33 | x | x | −9.81 | 0.56 |
| Simple distillation | −8.12 | x | 0.06 | 0.03 | x | 1.53 | x | x | −9.90 | 0.15 | |||
| R32 | Batch distillation | −6.03 | x | 0.20 | 0.04 | x | 0.48 | x | x | −7.57 | 0.81 | ||
| Simple distillation | −6.83 | x | 0.09 | 0.03 | x | 0.54 | x | x | −7.64 | 0.15 | |||
| R22 | Simple distillation | −1.97 | x | 0.08 | 0.03 | x | 1.82 | x | x | −4.17 | 0.27 | ||
| Europe | R410A | Batch rectification | −6.83 | x | 1.34 | 1.61 | x | 0.00 | x | x | −9.89 | 0.11 | |
| R134a | Batch rectification | −8.94 | x | 0.91 | 0.11 | x | 0.00 | x | x | −10.01 | 0.05 |
Table A5.
LIME3 external costs related to the treatment of 1 kg of used refrigerant (USD/kg used refrigerant).
Table A5.
LIME3 external costs related to the treatment of 1 kg of used refrigerant (USD/kg used refrigerant).
| Refrigerant Treatment Method | Country of Implementation and Refrigerant | Refrigerant | Treatment Detail | Total | Slaked Lime | Electricity | Steam | Energy | Other | Direct CO2 | Direct Refrigerant | Regenerated Fluorite | Recycled Acids | Reclaimed Refrigerant | Waste Treatment |
|---|---|---|---|---|---|---|---|---|---|---|---|---|---|---|---|
| Destruction | Japan | R410A | Superheated steam incineration | 0.46 | 0.04 | 0.02 | x | 0.00 | 0.01 | 0.01 | 0.00 | x | x | x | 0.37 |
| Liquid injection incineration | 0.67 | 0.04 | 0.04 | 0.01 | 0.05 | 0.03 | 0.01 | 0.00 | −0.02 | x | x | 0.52 | |||
| R32 | Superheated steam incineration | 0.37 | 0.04 | 0.02 | x | 0.00 | 0.01 | 0.01 | 0.00 | x | x | x | 0.29 | ||
| Liquid injection incineration | 0.60 | 0.03 | 0.05 | 0.01 | 0.06 | 0.04 | 0.01 | 0.00 | −0.02 | x | x | 0.41 | |||
| R22 | Liquid injection incineration | 0.37 | 0.03 | 0.03 | 0.01 | 0.03 | 0.02 | 0.01 | 0.00 | −0.01 | x | x | 0.25 | ||
| Europe | R410A | Gaseous/fume oxidation | 0.04 | x | 0.01 | 0.01 | x | 0.02 | 0.01 | x | x | −0.03 | x | 0.01 | |
| R134a | Gaseous/fume oxidation | 0.04 | x | 0.01 | 0.01 | x | 0.03 | 0.01 | x | x | −0.03 | x | 0 | ||
| Reclamation | Japan | R410A | Batch distillation | −0.29 | x | 0.00 | x | 0.00 | 0.00 | x | 0.02 | x | x | −0.33 | 0.02 |
| Simple distillation | −0.30 | x | 0.00 | x | x | 0.00 | x | 0.03 | x | x | −0.33 | 0.00 | |||
| R32 | Batch distillation | −0.20 | x | 0.00 | x | 0.00 | 0.00 | x | 0.01 | x | x | −0.24 | 0.02 | ||
| Simple distillation | −0.22 | x | 0.00 | x | x | 0.00 | x | 0.01 | x | x | −0.24 | 0.00 | |||
| R22 | Simple distillation | −0.10 | x | 0.00 | x | x | 0.00 | x | 0.03 | x | x | −0.14 | 0.01 | ||
| Europe | R410A | Batch rectification | −0.36 | x | 0.06 | 0.01 | x | 0.08 | x | 0.00 | x | x | −0.51 | 0.00 | |
| R134a | Batch rectification | −0.54 | x | 0.04 | 0.01 | x | 0.01 | x | 0.00 | x | x | −0.59 | 0.00 |
Table A6.
Environmental impact of reclamation and destruction (per 1 kg of produced refrigerant for R32).
Table A6.
Environmental impact of reclamation and destruction (per 1 kg of produced refrigerant for R32).
| Destruction | Reclamation (Batch Distillation) | |||
|---|---|---|---|---|
| Total | Production | Destruction | ||
| GHG emissions (kgCO2eq) | 11.54 | 7.77 | 3.77 | 1.58 |
| Energy consumption (MJ) | 146.9 | 118.5 | 28.4 | 15.7 |
| LIME3 (USD) | 0.62 | 0.24 | 0.38 | 0.04 |
References
- International Energy Agency. The Future of Cooling; IEA Publications: Paris, France, 2018. [Google Scholar]
- Wan, H.; Cao, T.; Hwang, Y.; Radermacher, R.; Andersen, S.O.; Chin, S. A Comprehensive Review of Life Cycle Climate Performance (LCCP) for Air Conditioning Systems. Int. J. Refrig. 2021, 130, 187–198. [Google Scholar] [CrossRef]
- Troch, S.V. Harmonization of Life Cycle Climate Performance and Its Improvements for Heat Pump Applications; The University of Maryland: College Park, MD, USA, 2016. [Google Scholar] [CrossRef]
- Hill, W.; Papasavva, S. Life Cycle Analysis Framework; A Comparison of HFC-134a, HFC-134a Enhanced, HFC-152a, R744, R744 Enhanced, and R290 Automotive Refrigerant Systems. In Proceedings of the SAE 2005 World Congress & Exhibition, Detroit, MI, USA, 11–14 April 2005. [Google Scholar]
- Banks, R.E.; Sharratt, P.N. Environmental Impacts of the Manufacture of HFC-134a; Department of Chemical Engineering, UMIST: Manchester, UK, 1996; Unpublished Paper. [Google Scholar]
- Chen, W. A Comparative Study on the Performance and Environmental Characteristics of R410A and R22 Residential Air Conditioners. Appl. Therm. Eng. 2008, 28, 1–7. [Google Scholar] [CrossRef]
- Spatz, M.W.; Yana Motta, S.F. An Evaluation of Options for Replacing HCFC-22 in Medium Temperature Refrigeration Systems. Int. J. Refrig. 2004, 27, 475–483. [Google Scholar] [CrossRef]
- Aprea, C.; Greco, A.; Maiorino, A.; Masselli, C.; Metallo, A. HFO1234yf as a Drop-in Replacement for R134a in Domestic Refrigerators: A Life Cycle Climate Performance Analysis. Int. J. Heat Technol. 2016, 34, S212–S218. [Google Scholar] [CrossRef]
- Bovea, M.D.; Cabello, R.; Querol, D. Comparative Life Cycle Assessment of Commonly Used Refrigerants in Commercial Refrigeration Systems. Int. J. Life Cycle Assess 2007, 12, 299–307. [Google Scholar] [CrossRef]
- Cao, T.; Hwang, Y. HPT Annex 54: Heat Pump Systems with Low-GWP Refrigerants, 2021. The Technology Collaboration Programme Website. Available online: https://heatpumpingtechnologies.org/annex54/wp-content/uploads/sites/63/2022/02/iea-annext-54-2021-annual-report-v2-021822.pdf (accessed on 8 November 2022).
- Jovell, D.; Pou, J.O.; Llovell, F.; Gonzalez-Olmos, R. Life Cycle Assessment of the Separation and Recycling of Fluorinated Gases Using Ionic Liquids in a Circular Economy Framework. ACS Sustain. Chem. Eng. 2021, 10, 71–80. [Google Scholar] [CrossRef] [PubMed]
- Wang, H.; Wang, Y.; Mi, H.; Zang, J.; Wang, S. Analysis of Carbon Emission Energy Inventory from Refrigerant Production and Recycling Carbon Compensation. Appl. Sci. 2021, 12, 1. [Google Scholar] [CrossRef]
- The Intergovernmental Panel on Climate Change (IPCC). Climate Change 2022, Mitigation of Climate Change, Summary for Policymakers. 2022. Available online: https://www.ipcc.ch/report/ar6/wg3/downloads/report/IPCC_AR6_WGIII_SPM.pdf (accessed on 8 November 2022).
- European Environment Agency. Fluorinated Greenhouse Gases 2020. Available online: https://www.eea.europa.eu/publications/fluorinated-greenhouse-gases-2020 (accessed on 8 November 2022).
- Ministry of Economy, Trade and Industry (METI), Government of Japan. 2021 Allocation Operation Results Based on the Ozone Layer Protection Law. Available online: https://www.meti.go.jp/shingikai/sankoshin/seizo_sangyo/kagaku_busshitsu/flon_taisaku/pdf/017_04_00.pdf (accessed on 8 November 2022). (In Japanese)
- Fang, X.; Velders, G.J.M.; Ravishankara, A.R.; Molina, M.J.; Hu, J.; Prinn, R.G. Hydrofluorocarbon (HFC) Emissions in China: An Inventory for 2005–2013 and Projections to 2050. Environ. Sci. Technol. 2016, 50, 2027–2034. [Google Scholar] [CrossRef] [PubMed]
- Columbia University. Guide to Chinese Climate Policy. Available online: https://chineseclimatepolicy.energypolicy.columbia.edu/en/hfcs-and-cfcs#/_ftn1 (accessed on 8 November 2022).
- International Energy Agency. The Future of Heat Pumps. Available online: https://iea.blob.core.windows.net/assets/2cf6c5c5-54d5-4a17-bfbe-8924123eebcd/TheFutureofHeatPumps.pdf (accessed on 8 November 2022).
- United Nations. Amendment to the Montreal Protocol on Substances that Deplete the Ozone Layer. Available online: https://treaties.un.org/doc/Treaties/2016/10/20161015%2003-23%20PM/Ch_XXVII-2.f-English%20and%20French.pdf (accessed on 8 November 2022).
- United Nations Environment Programme, Current Use of HCFCs and HFCs. Available online: https://wedocs.unep.org/bitstream/handle/20.500.11822/26867/7877FS02_C_Uses_EN.pdf?sequence=1&isAllowed=y (accessed on 8 November 2022).
- U.S. Environmental Protection Agency. Phasedown of Hydrofluorocarbons: Allowance Allocation Methodology for 2024 and Later Years. Available online: https://www.epa.gov/system/files/documents/2022-10/FRL-8838-01-OAR_2024-HFC-Allocation_NPRM_20221019_ADMIN_pre-pub.pdf (accessed on 8 November 2022).
- Ministry of Economy, Trade and Industry (METI), Government of Japan. Report on the Evaluation and Examination of the Status of Enforcement of the 2013 Revised Fluorocarbon Emission Control Law. Available online: https://www.meti.go.jp/shingikai/sankoshin/seizo_sangyo/kagaku_busshitsu/flon_godo/pdf/20220628_1.pdf (accessed on 8 November 2022). (In Japanese)
- The California Air Resources Board. California Code of Regulations, Title 17, Division 3, Chapter 1, Subchapter 10 Climate Change, Article 4. Available online: https://ww2.arb.ca.gov/sites/default/files/barcu/regact/2020/hfc2020/frorevised.pdf (accessed on 8 November 2022).
- The California Air Resources Board. Final Statement of Reasons for Rulemaking, Including Summary of Comments and Agency Response. Available online: https://ww2.arb.ca.gov/sites/default/files/barcu/regact/2020/hfc2020/fsorrevised.pdf (accessed on 8 November 2022).
- Baba, N.; Kasai, S.; Itsubo, N. LCA Comparison of Refrigerant Reclamation and Destruction Applying LIME Method. In Proceedings of the 5th Annual Meeting of Life-Cycle Assessment Society of Japan, Tokyo, Japan, 20–22 March 2010; p. 138. [Google Scholar]
- U.S. Environmental Protection Agency. ODS Destruction in the United States and Abroad. Available online: https://www.epa.gov/sites/default/files/2018-03/documents/ods-destruction-in-the-us-and-abroad_feb2018.pdf (accessed on 8 November 2022).
- U.S. Environmental Protection Agency. On-Site Incineration: Overview of Superfund Operating Experience. Available online: https://www.epa.gov/sites/default/files/2015-04/documents/on_site_incineration.pdf (accessed on 8 November 2022).
- Ministry of the Environment, Government of Japan. Guidelines on the Destruction of CFCs in Japan. Available online: https://www.env.go.jp/content/900451343.pdf (accessed on 8 November 2022).
- Stratus Consulting Inc. Analysis of Equipment and Practices in the Reclamation Industry. Available online: https://www.epa.gov/sites/default/files/2015-08/documents/analysis_of_equipment_and_practices_in_the_reclamation_industry.pdf (accessed on 8 November 2022).
- U.S. Environmental Protection Agency. AP-42, Vol. I, CH 4.7: Waste Solvent Reclamation. Available online: https://www.epa.gov/sites/default/files/2020-10/documents/c4s07.pdf (accessed on 8 November 2022).
- Inaba, A.; Itsubo, N. Preface. Int. J. Life Cycle Assess 2018, 23, 2271–2275. [Google Scholar] [CrossRef]
- Karkour, S.; Ihara, T.; Kuwayama, T.; Yamaguchi, K.; Itsubo, N. Life Cycle Assessment of Residential Air Conditioners Considering the Benefits of Their Use: A Case Study in Indonesia. Energies 2021, 14, 447. [Google Scholar] [CrossRef]
- United Nations Framework Convention on Climate Change. Global Comparative Analysis of HFC and Alternative Technologies for Refrigeration, Air Conditioning, Foam, Solvent, Aerosol Propellant, and Fire Protection Applications. Available online: https://unfccc.int/sites/default/files/wamatt054_1.pdf (accessed on 8 November 2022).
- Ministry of Economy, Trade and Industry (METI), Government of Japan. Aggregation Results of Recycled and Destroyed amounts of Fluorocarbons in FY2021 Based on the Fluorocarbons Emissions Control Law. Available online: https://www.env.go.jp/content/000074323.pdf (accessed on 8 November 2022). (In Japanese)


Disclaimer/Publisher’s Note: The statements, opinions and data contained in all publications are solely those of the individual author(s) and contributor(s) and not of MDPI and/or the editor(s). MDPI and/or the editor(s) disclaim responsibility for any injury to people or property resulting from any ideas, methods, instructions or products referred to in the content. |
© 2022 by the authors. Licensee MDPI, Basel, Switzerland. This article is an open access article distributed under the terms and conditions of the Creative Commons Attribution (CC BY) license (https://creativecommons.org/licenses/by/4.0/).