Article

Effects of Rotational Tillage on Soil Physicochemical Properties and Crop Yield in a Rice–Wheat Double Cropping Area

School of Agriculture Engineering and Food Science, Shandong University of Technology, Zibo 255049, China
*
Author to whom correspondence should be addressed.
Sustainability 2023, 15(1), 474; https://doi.org/10.3390/su15010474
Submission received: 14 November 2022 / Revised: 21 December 2022 / Accepted: 24 December 2022 / Published: 27 December 2022

Abstract

:
This paper aims to explore issues related to destruction of soil nutrients and structure in a rice-wheat double-cropping area caused by over-tillage prior to rice cultivation. A three-year cycle of rotation tillage pattern (RT), consisting of “no-tillage–no-tillage–plough”, with a straw-returning and direct rice-seeding technology, was designed and tested, and was compared with continuous no-tillage pattern (CN) and conventional ploughing & rotary tillage (PR). The soil rotation experiment in the rice-wheat double-cropping region is located on the southeastern coast of Shandong Province, with a warm, temperate, humid monsoon climate and paddy soil type. Comparison experiments were conducted on the three farming patterns over a period of 3 years, continuously measuring soil physical and chemical properties and crop yields. The results showed that under the same straw-returning conditions, RT significantly increased soil macroaggregates content and enhanced their stability within 0~30 cm (p < 0.05). RT significantly reduced the bulk density of 0~30 cm soil to below 1.5 g/cm3, which was beneficial to crop root growth (p < 0.05). Meanwhile, RT significantly increased the contents of soil organic carbon, total nitrogen, and available phosphorus, and the nutrients are evenly distributed in 0~30 cm layer (p < 0.05). Another result was that the RT significantly increased the rice panicle length, grains number per panicle, and thousand-grain weigh. The crop yield was not significantly different from that of PR, but significantly higher than that of CN (p < 0.05). At the same time, cultivation measures prior to rice cultivation had some after-effects on wheat; the RT significantly increased the average tillers, effective panicle number, effective panicle grain number, and thousand-seed weight of wheat; and the wheat yields were 10.5% and 13.3% higher than that of CN and PR, respectively. This study provides a theoretical reference for improving tillage patterns in rice-wheat double-cropping areas.

1. Introduction

Rice and wheat are the dominant food crops in the world. Rice-wheat rotation is a unique cultivation technique in China. Due to the limitations of rice cultivation methods and existing machinery and tools, the tillage process of rice before sowing in the double-cropping area is mostly tilling, rotating tilling, irrigation, pulping, and then transplanting. The many tillage links lead to the problems of large energy consumption, soil destruction, and fertility diminution [1,2,3]. The plough pan formed by long-term ploughing makes the soil bulk density too large. In turn, it will hinder the growth and distribution of crop roots, reduce the number and proportion of deep roots, and affect the crop yield [4,5,6]. Reasonable tillage measures and straw returning are effective measures to improve soil structure, improve soil fertility and increase crop yield. Research has shown that both no-till and straw returning could increase the content of water-stable aggregates (WSA), mean weight diameter of aggregates (MWD), and geometric mean and reduce the content of microaggregates [7,8]. Other studies have shown that long-term no-till and conservation tillage with straw mulch enriches the organic carbon and nutrients on the soil surface. But grass seeds and insect eggs accumulate on the surface as well, especially in double-cropping areas prone to grass damage and insect pests, increasing the dependence on pesticides [9,10,11]. No-tillage and deep loosening effectively eliminate plow pan and improve soil structure in dry farming areas in conservation tillage systems, still, these methods are not applicable in paddy fields [12,13,14]. Studies have shown that no-tillage for five consecutive years in paddy fields results in enhanced soil permeability and accelerated soil water and fertilizer seepage leakage, leading to a reduction in rice yield [15,16]. Plowing every 2 or 3 years is beneficial to increasing crop yield, and for paddy fields with sandy loam, plow pan formed after plowing plays an important role in water and fertilizer conservation [17]. In the rice-wheat double-cropping region, therefore, it is necessary to have a certain level of plough-bed, and to ensure the efficient excavation of the roots of rice and wheat, which requires that the soil content of the plough-bed should be within the proper limits, and that there should be no long-term ploughing, long-term tilling, or deep loosening. At present, the research reports on no tillage at home and abroad mostly focus on dry land soil and crops, while the research on no tillage with wheat rice rotation as the background is less. At present, there is little research on the tillage pattern combining tillage with no-tillage. Therefore, it is necessary to optimize the soil tillage pattern to simplify the rice cultivation process, reduce the cost of rice production and improve the soil structure in rice-wheat double-cropping areas. In this paper, the rotation tillage pattern of “no-tillage–no-tillage–plough” was designed to explore the effects of rotation tillage on soil physical and chemical properties and crop yield. This mode of tillage may improve soil structure, enrich soil organic matter content, and significantly increase crop yield. The results may provide a basis for improving tillage patterns in rice-wheat double-cropping areas.

2. Materials and Methods

2.1. Overview of Test Area

The soil rotation experiment in the rice-wheat double-cropping area was selected in Taoluo Town, Donggang District, Rizhao City, a typical rice-wheat double-cropping area on the southeastern coast of Shandong Province. It has a warm, temperate, humid monsoon climate. The average temperature in winter is above 0 °C and 25 °C in summer. The average annual temperature is 12.6 °C, the yearly sunshine is 2532.9 h, and the total precipitation is 916 mm. Before the experiment, the tillage and planting pattern consisted of successive ploughings and transplants after repeated rotations of tillage. Tillage depth is generally 15 to 18 cm, and straw is removed from the field. See Table 1 for detailed soil data.

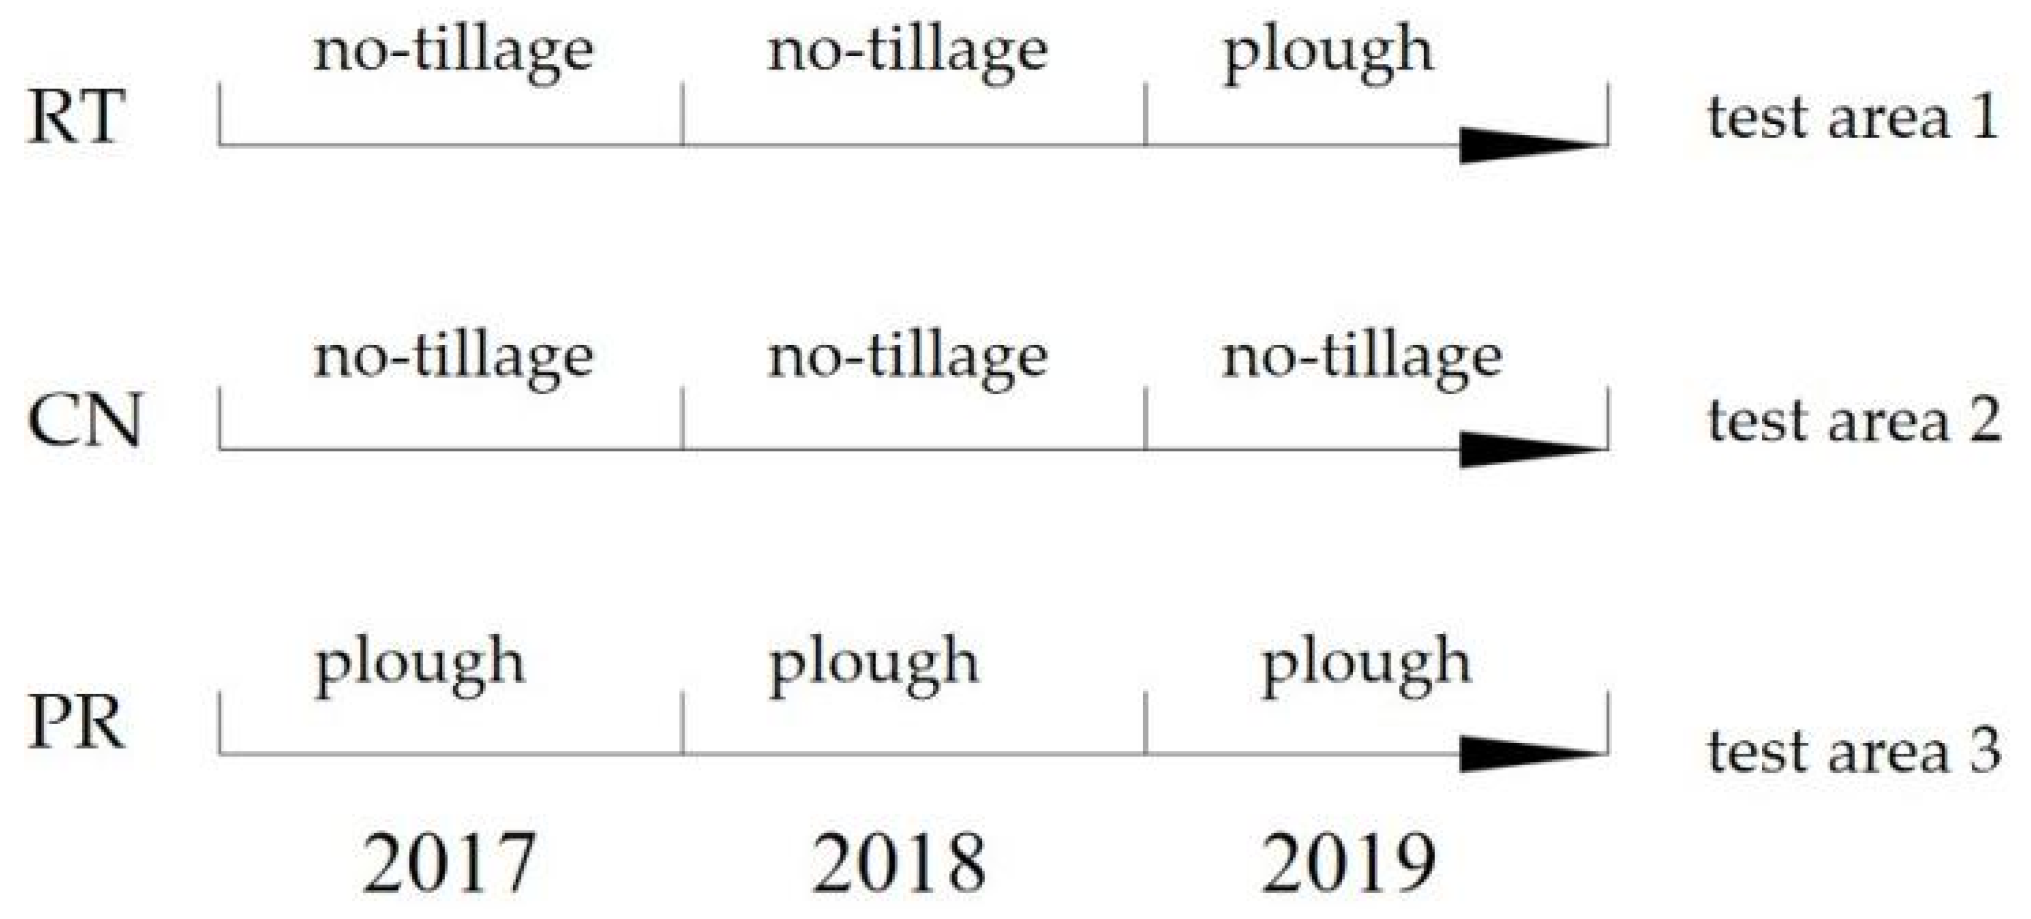
2.2. Experimental Scheme
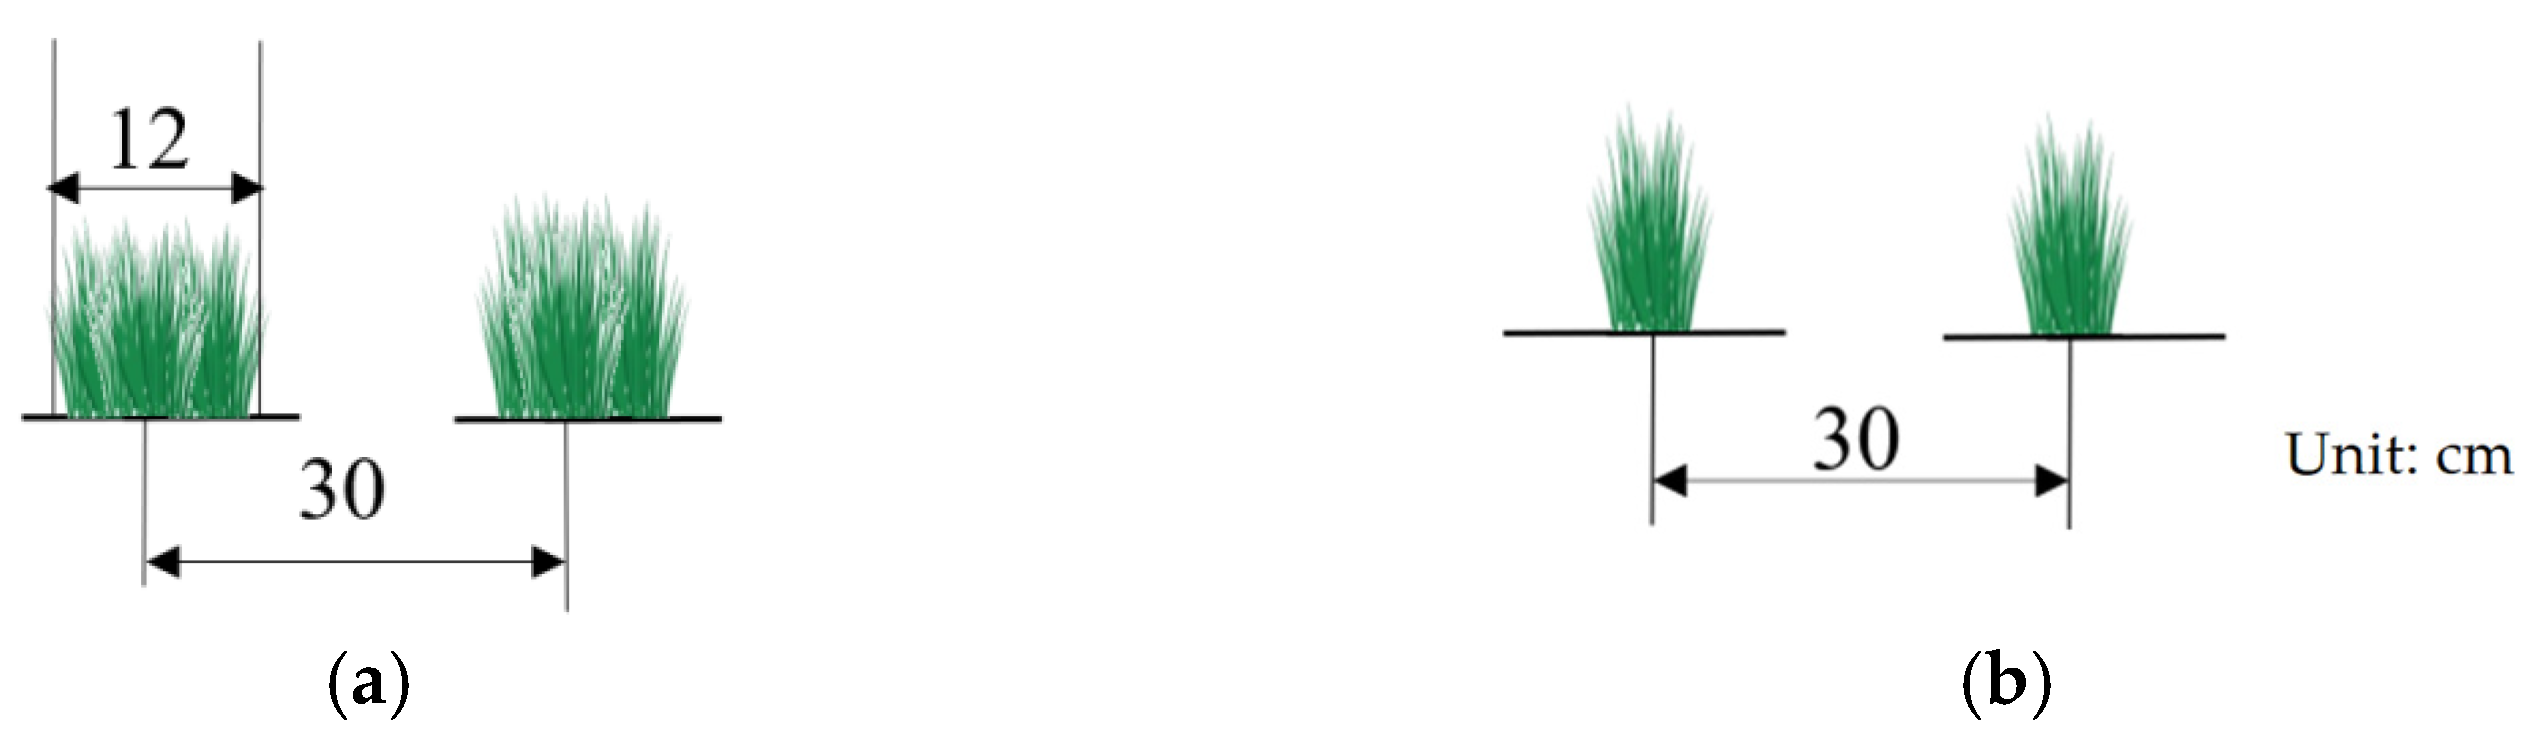
The tillage pattern of the soil before rice sowing is a 3-year cycle. Rotational tillage (RT) (no-tillage–no-tillage–plough) continuous no-tillage (CN) and plowing and rotary tillage (PR) were investigated for comparison. The treatment distribution in different regions is shown in Figure 1. One experimental area is selected for each tillage mode, and the area is 960 m2 (200 m × 4.8 m) without interleavingng. The historical farming conditions in each experimental area were the same. Before the experiment, the wheat straw was crushed and returned to the field. The straw was evenly crushed to a length of no more than 100 mm. The treatment RT was no-tillage in 2017 and 2018, and was sown and fertilized by the rice no-tillage dry direct seeding machine in 2019. Treatment CN consisted of no-tillage for 3 consecutive years (2017~2019) and was seeded and fertilized with a no-till dry direct seeding machine; the treatment PR was ploughed for 3 consecutive years (2017~2019), then irrigated, rotary tilled and grain filled, and rice transplanting was carried out after settling. After the rice is harvested and the straw was fully returned to the fields, the wheat was sown without tillage. The other specific methods of operation for each treatment are as follows:
Rice sowing: The seeds were coated with seed coating agent, and the seeds were dried for 1–2 days before sowing to increase the aeration of seed coat and the germination rate. RT and CT were sown directly on June 10 with a wide seeding strip, 12 cm wide and 30 cm between the center of the seeding strip as shown in Figure 2, with 127.5 kg of seed per ha. PR was transplanted on 10 July when the plant was 20 cm high and had three leaves. The rows are 30 cm apart and the planting holes are 12 cm apart, with an average of 3 plants per planting hole.
Wheat sowing: Wheat was sown on 14 October using the same machinery used for rice sowing, and 187.5 kg of seed was sown per ha.
Irrigation: For RT and CN treatment, if the soil moisture content is low during sowing, which cannot ensure the emergence of rice seeds, it is necessary to timely water the seeds after sowing. After emergence, it is necessary to ensure thin water irrigation in the seedling stage, intermittent irrigation in the early stage of tillering, sun drying in the middle and late stages of tillering, 10 cm water layer in the booting and heading stages, dry and wet alternate irrigation in the filling period, and sun drying in the field 10 days before harvest. The PR used traditional rice irrigation methods. The wheat in each treatment is traditionally irrigated.
Fertilization: Basic fertilizers and additional fertilizers are included. For RT and CN, deeply fertilized long-term slow-control fertilizer of 600 kg/ha (N:P:K = 25:10:10) was used when sowing rice, and then added 300 kg/ha (N:P:K = 53:10:30) of compound fertilizer was added at the later stage. For PR, 600 kg/ha of the same slow-control fertilizer was applied at the time of ploughing and the same compound fertilizer was applied. At the late filling stage, 0.3% potassium dihydrogen phosphate was sprayed twice on the surface of the leaves. Deep application of pure N 225 kg/ha, P2O5 180 kg/ha, and K2O 25 kg/ha was performed in wheat sowing for each treatment.
Weed controlling: Weeds in direct-seeded rice fields are more difficult to control compared to mechanical seedling transplantation. Based on reference [18], “Daojie” was used for RT and CT when rice grew to 2~3 leaves, and for every 666.7 m2, a concentration of 25 g/L of miscible flowable oil was concentrated to 40~80 mL and mixed with 20 kg of water. The PR therapy is applied 5 to 7 days after transplantation. The wheat in each treatment was sprayed in the traditional way.

2.3. Materials

Rice varieties: As climatic conditions include low temperatures in the paddy-rice-wheat double-cropping area of Huang-huai-hai, the growing period of directly sown rice must be short. In this paper, Linhan number 1 was selected, which has a growth period of 125 days, an average plant height of 81.3 cm, an average spike length of 13.9 cm, an average number of grains per panicle of 96.9, an average seed setting rate of 80.1%, and a thousand-grain weight of 26.4 g.
Wheat varieties: To ensure a good crop yield, we selected Yannong 21, a type with multiple spikes and strong tilings, a high crop yield, an average plant height of 71 cm, an average spike number of 31, and a weight of 40.1 g per thousand grains.
Seeder: No-tillage sowing was the key to these soil tillage tests in the rice-wheat double-cropping areas. The research group proposed direct rice seeding technology with no-tillage [19] and designed a rice-wheat wide seedling belt stubble seeder based on the paper [20].

2.4. Test Items and Methods

2.4.1. Methods for Soil Sampling and Determination

Select the cultivation area that is planted continuously and uniformly throughout the year as the test area, and randomly select 20 points in the test area for sampling test and physical and chemical analysis of the consistency of soil properties, so as to ensure that soil properties will not be taken as independent variables in subsequent tests. After the 2017 to 2020 wheat harvest, representative undisturbed soil was collected at multiple points using a circular knife with a volume of 100 cm3. The soil was divided into 3 layers of 0~10, 10~20, and 20~30 cm, and the three layers of soil are sampled continuously by the positioning test method. The soil’s bulk density was determined using the drying weighing method, cut the weight with a ring knife, and weigh it after drying; soil mechanically stable aggregates were determined using a dry sifting method, which sifts out soil aggregates after drying; the water-stable aggregates were determined using wet screening, in which soil samples were immersed in deionized water and screened; and the organic carbon content was determined using the potassium dichromate volumetric method (external heating method), add potassium dichromate solution into the soil sample, and measure the content change after reaction [21].
The effects of different tillage patterns on the soil structure and nutrient content were further analyzed. The stability of soil aggregates and organic carbon content were used as indicators for further statistical analysis. The radius, mass, the percentage of aggregate disruption and the mean weight diameter (MWD) were measured and calculated. Among them, the MWD is calculated by multiplying the percentage weight of aggregates of a certain particle size by the average diameter of this particle size and summing the above products over all measured particle sizes. Soil aggregates with a diameter of >0.25 mm are called soil macroaggregates. Six. J et al. [22] maintain that macroaggregates with a diameter of >0.25 mm are the best soil aggregates and reflect soil fertility. The mean weight diameter (MWD) of soil aggregates is a common indicator of the distribution of soil aggregates. The larger the MWD of water-stable aggregates, the higher the degree of uniformity of the average particle size and the stronger the stability of soil aggregates. The percentage of aggregate disruption (K) refers to the percentage of the total amount of soil aggregates destroyed. The formation of water-stable aggregates is affected by tillage practices and soil organic matter. Some studies [23,24,25] have found that no-tillage could increase the content of surface soil organic matter, reduce the damage of surface soil aggregates, and improve the content of water-stable aggregates. However, frequent tillage decreases the water-stable aggregates content and the MWD of aggregates, which results in the destruction of soil structure. However, there are opposing views. Some studies [26,27] show that long-term continuous no-tillage also leads to soil compaction and reduces the soil MWD, which is not conducive to soil structure. Hence, timely tillage is necessary. In this study, the effects of different tillage patterns on soil structural stability were analyzed by measuring the content of soil macroaggregates with a diameter of >0.25 mm (R > 0.25) and the MWD.

2.4.2. Methods of Crop Yield Factor Determination

The constituent elements of crop yield were measured using a sampling survey method with 5 randomly selected points, a statistical area of 1 m2, and an effective ear number and crop effective grain number per panicle. This was repeated 3 times to calculate the average value, the effective number of panicles, and the number of grains per hectare. 20 representative plants were then randomly selected and roasted in a room. The thousand-grain weight was determined and repeated 3 times to calculate the crop yield per hectare. The effective panicle size, grains per panicle, thousand-grain weight and actual panicle crop yield of rice under different tillage methods were statistically analyzed.

2.4.3. Measuring Methods for Crop Yield Components

Grains per spike: primary branches number × 5.5 + secondary branches number × 3.
Effective panicle: Randomly sample, count the number of ears with more than 5 grains per ear, and take the average.
Spike length: Use a ruler to measure the distance from spike neck node to spike top.
Seed setting rate: Real grains divided by total grains multiplied by 100%.
Thousand-grain weight: Take samples from multiple points, count 1000 seeds one by one, repeat twice, weigh them with a balance, and take the average.
Effective number of grains per spike: Randomly sample 100, count the effective grains per panicle and take the average.

2.4.4. Data Processing and Statistical Analysis

The data in this paper are statistically analyzed by SPSS16.0 software(Made by IBM in New York, NY, USA) and Excel software(Made by Microsoft in Redmond, Washington, DC, USA). Multiple comparisons “LSD” method was used for analysis of variance and significance test. And use “Sig.” value to test the significance level of statistical analysis. “p < 0.05”: extremely significant level; “0.05 < p < 0.1”: significant level; “p > 0.05”: not significant.

3. Results and Analysis

3.1. Effects of Different Tillage Methods on Soil Structure

3.1.1. Effects on Soil Aggregate

Table 2 showed the effects of different tillage patterns on the content of soil macroaggregates (R > 0.25), MWD, and the percentage of aggregate disruption (K) in 0~30 cm soil layers. It can be seen from Table 2 that tillage patterns have a significant impact on the macroscopic aggregate content and stability of the soil. In a 0~10 cm soil layer, the content of structurally stable macroaggregates and water-stable macroaggregates and the MWD of RT and CN showed no difference (p < 0.05) but were significantly higher than those of PR (p < 0.05). The results show that rotational tillage and no-tillage significantly increase the amount and stability of soil macroscopic aggregates in a 0~10 cm soil layer. The reason was that there was a small damage rate for soil macroaggregates with no-tillage for 2~3 consecutive years, while straw mulching on the surface had a protective effect on soil aggregates. It can also be seen from the failure rate of aggregates that the K value of RT and CN was significantly smaller than that of PR. In the 10~20 cm soil layer, there were no significant differences in the contents of mechanical stability of large aggregates, water stability of large aggregates, and MWD of RT and PR, but they were significantly higher than those of CN (p < 0.05). Through analysis, it is because the treatment RT has little damage to the soil after 2 years of no-tillage, and the tillage has increased the organic carbon content of 10~20 cm soil layer. Although the treatment PR has continuous tillage, which has damage to the soil, the tillage will turn the straw to 10~20 cm soil layer, which increases the organic carbon content of the soil in this layer. Although the treatment CN has no-tillage, which has little damage to the soil, the straw is covered on the surface, The content of organic carbon in 10~20 cm subsurface is low, which is not conducive to the formation of soil aggregates. In the 20~30 cm soil layer, the contents of mechanical stability macroaggregates, water stability macroaggregates, and MWD of RT were significantly higher than those of CN and PR (p < 0.05). The results showed that this is due to the fact that 2 consecutive years of no-tillage RT reduced the soil bulk density at the pan of the plow, which is conducive to the formation of soil macroscopic aggregates. The continuous tillage of PR increases the bulk density of the plowed pan of the 20~30 cm soil layer, which is not conducive to the formation of macroscopic aggregates. The continuous no-tillage of CN eliminates the pan layer of the plow, but the organic carbon content is lower, which is also not conducive to the formation of large soil aggregates. This suggests that both tillage measures and organic carbon content are factors that influence the formation and stability of soil macroscopic aggregates, and that minimum tillage and increased organic carbon content favor the formation of soil macroscopic aggregates. This is consistent with the research results of Briedis et al. [28]

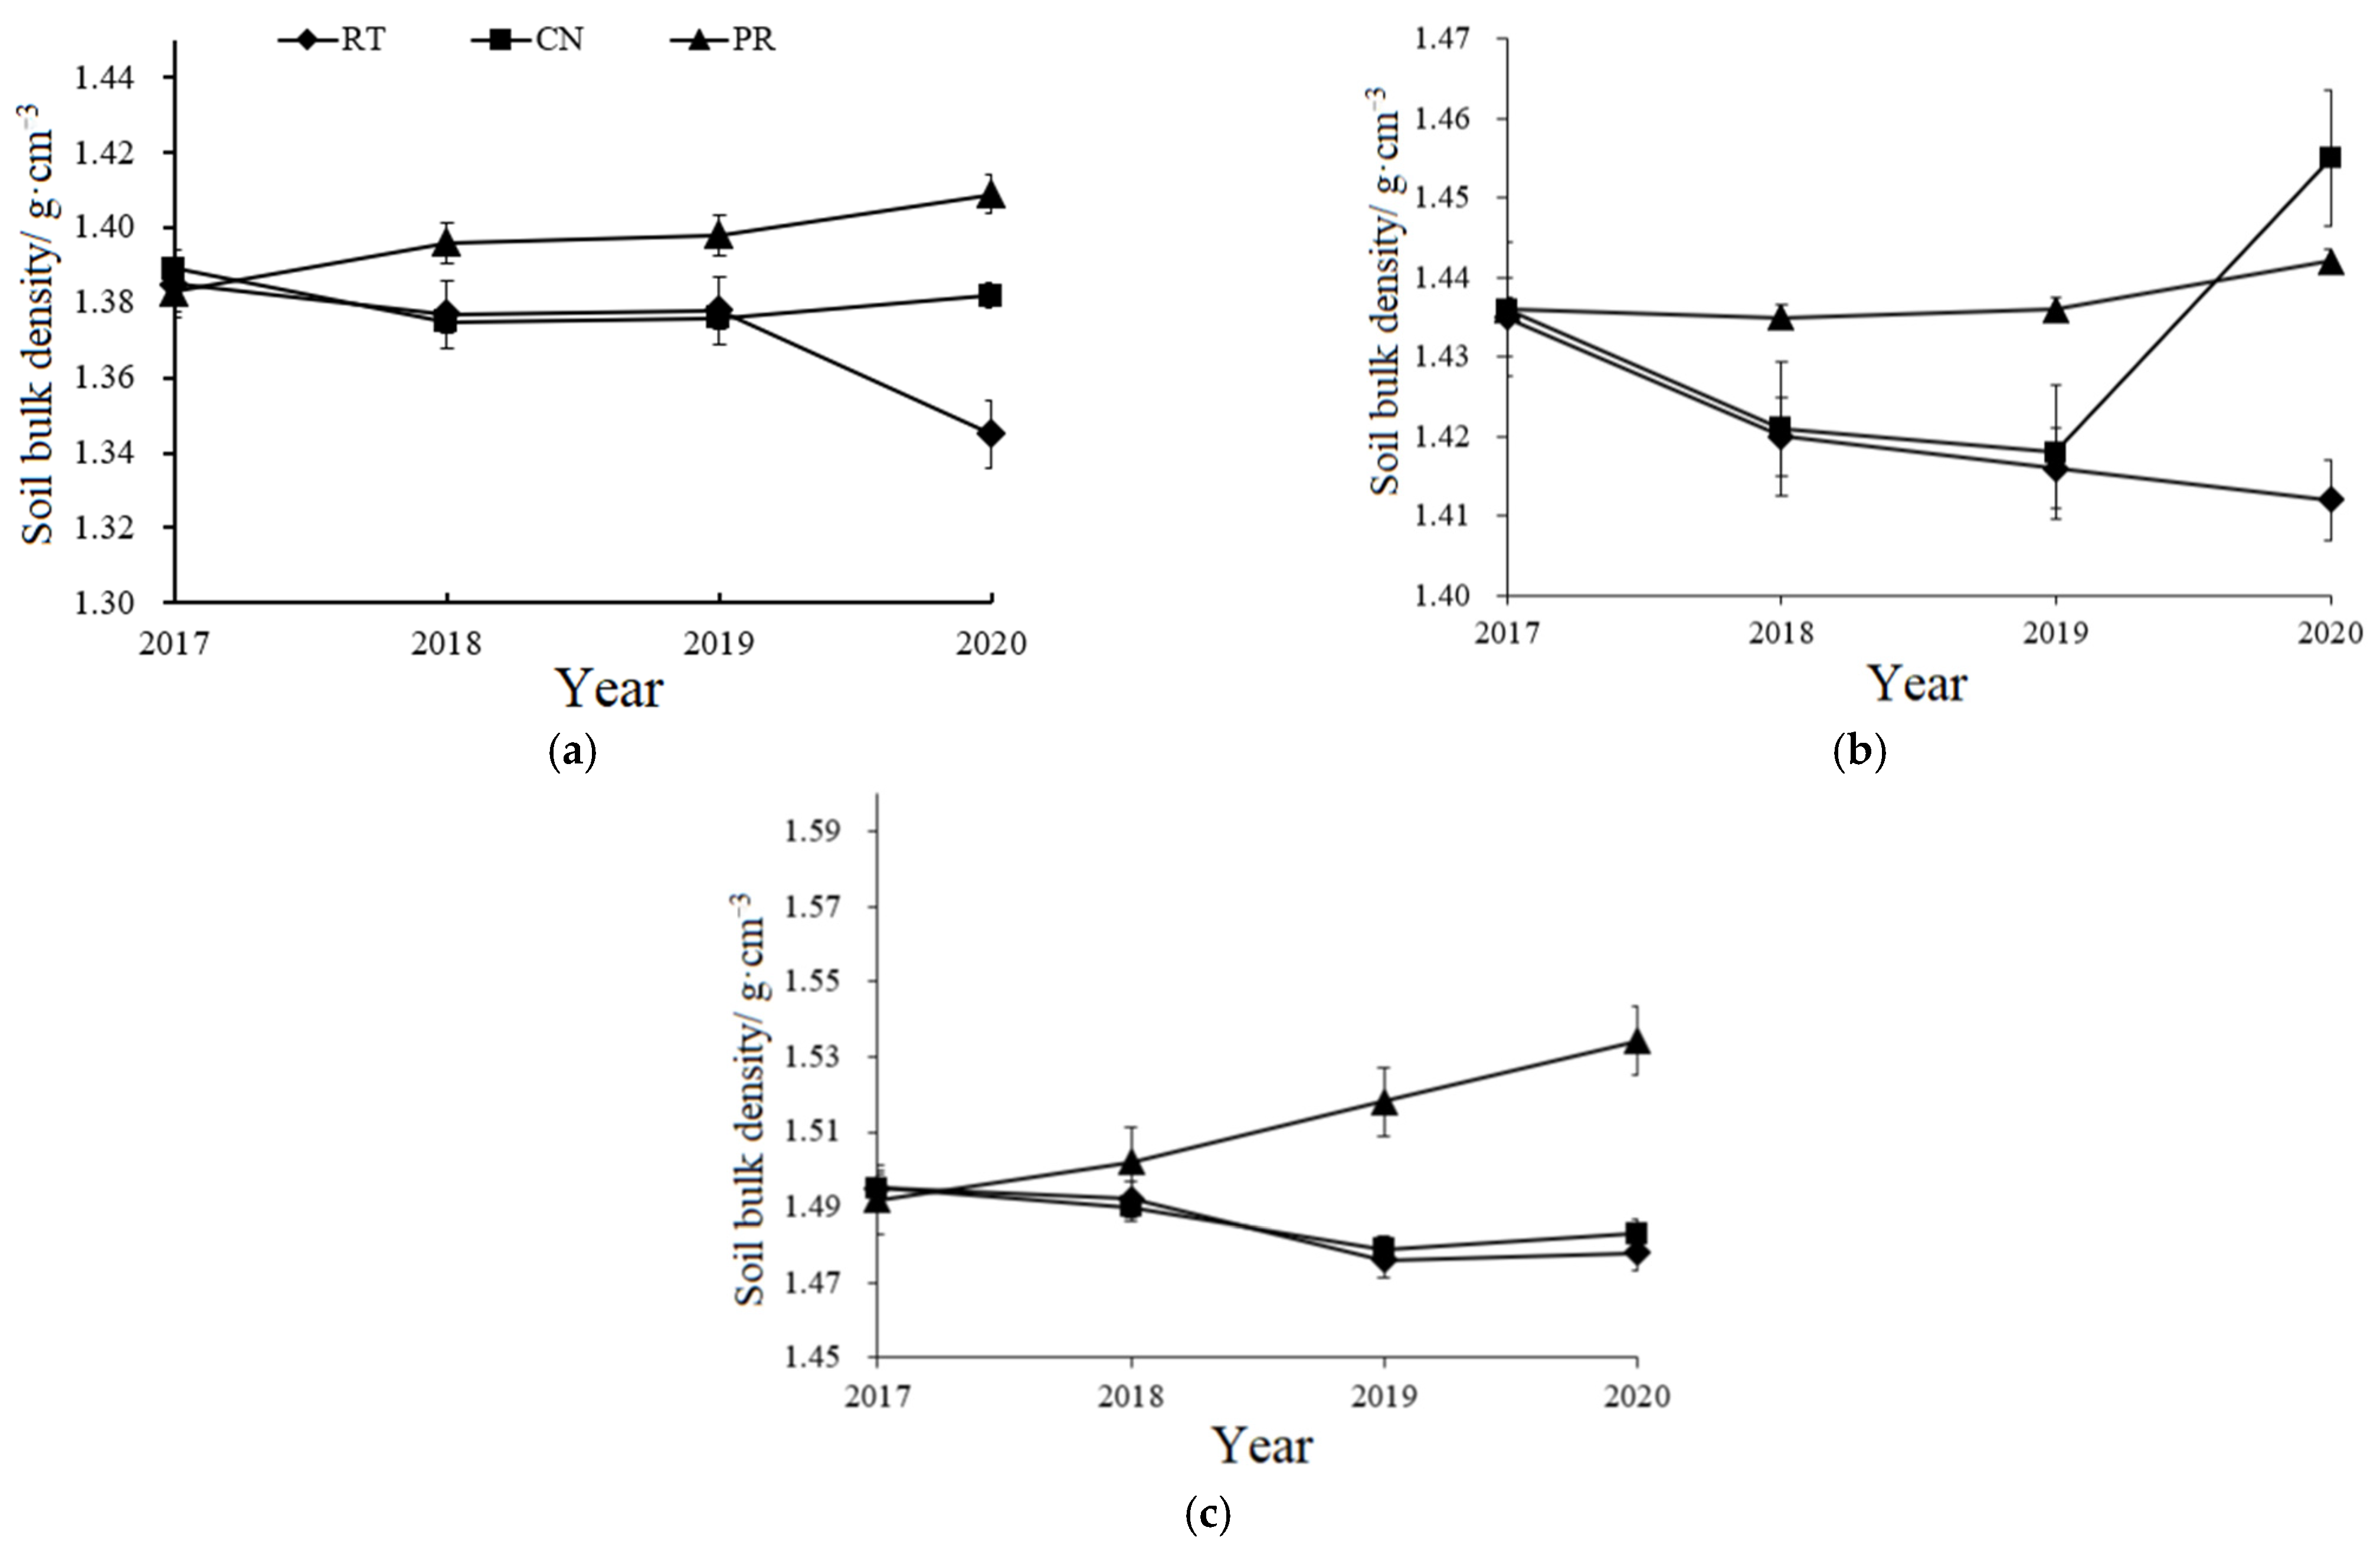
3.1.2. Effects on Soil Bulk Density

Figure 3 showed the variation of the soil bulk density for different years from 2017 to 2020. Comparison of soil bulk density between different treatments after 3 years of tillage showed that tillage pattern has a significant effect on soil bulk density.
There were significant differences (p < 0.05) between the 3 treatments in terms of the bulk density of the 0~10 cm soil layer, and their values, from small to large, were in the following order: RT, CN, and PR. The bulk density of RT was 0.037 and 0.064 g/cm3 lower than that of CN and PR, respectively. We believe that the continuous tillage of PR has resulted in a bare surface and severe compaction of the topsoil due to erosion from irrigation water and rain. In the treatment of CN, straw covers the surface of the soil, but there is no cultivation for 3 consecutive years, so soil deposition and mechanical compaction of the soil occurs, resulting in a hardening of the soil surface and an increase in bulk density. However, the 2-year RT no-tillage resulted in little damage to the soil, and soil compaction caused by deposition and mechanical rolling could be improved. There were significant differences (p < 0.05) between the three treatments in terms of the bulk density of the 10~20 cm soil layer, and their values, from small to large, were in the following order: RT, PR, and CN. The bulk density of RT is 0.030 and 0.021 g/cm3 lower than that of CN and PR, respectively. The reason may be that the CN treatment has less organic carbon in the 10~20 cm range compared to the no-tillage treatment for 3 consecutive years, while the PR treatment has more organic carbon, which is conducive to reducing the soil bulk density. However, continuous mechanical tillage strongly affects soil damage, making the soil bulk density higher than RT. The values of the bulk density of the 20~30 cm soil layer are in the following order from small to large: CN, RT, PR; however, there was no significant difference between CN and RT, which were both lower than PR. The bulk densities of RT and CN were 0.056 and 0.051 g/cm3 lower than PR, respectively, because 2 and 3 continuous years of no-tillage for RT and CN reduced the plow pan bulk density, and the plow pan was disappearing, while the continuous tillage of PR increased. The above analysis indicates that under the same conditions of the returning of straw, rotation tillage significantly reduced the soil bulk density in the 0~30 cm soil layer, continuous no-tillage significantly reduced soil bulk density in the 20~30 cm layer, and traditional tillage significantly increased soil bulk density in the 20~30 cm layer, forming a hard plow pan.
By comparing the annual changes in the soil bulk density from 2017 to 2020 due to different treatments, the trend of the RT soil bulk density in the 0~20 cm soil layer is always decreasing, while in the 20~30 cm layer it is first decreasing and then increasing. This suggests that the absence of tillage and the return of straw after a long period of conventional tillage is beneficial in reducing the soil bulk density in the 0–30 cm soil layer. Plow pans formed by long-standing traditional plowing are eliminated, and the soil has a bulk density of less than 1 g/cm3, which is conducive to the growth of crop roots. Under the CN treatment, the bulk density of the soil first decreases and then gradually increases, indicating that as the number of years of no-tillage increases, the effect of no-tillage diminishes due to the differentiation of soil nutrients and mechanical compaction, requiring proper rotational tillage. Under the PR treatment, the soil bulk density increased from 0~30 cm, indicating that continuous tillage resulted in the destruction of the soil structure at the surface layer, and the aggravation of the plowing pan layer, especially in the 20~30 cm soil layer, was greater than 1.5 g/cm3, which was not conducive to the development of crop roots.

3.2. Effects of Different Tillage Patterns on Soil Nutrient Content

3.2.1. Effects on Soil N, P, and K Contents

As plant residues, straw can provide the large amounts of trace elements required for crop growth after decomposition. Thus, returning straw to the field reduces the amount of fertilizer applied. Table 3 showed the soil nutrient content after three years of different tillage systems. It can be seen from the table that the contents of total nitrogen, alkaline hydrolysis nitrogen, available phosphorus, and available potassium from each treatment after returning straw for 3 years were significantly increased (p < 0.05). Among them, alkali hydrolyzed nitrogen is also called available nitrogen, which can be used by crops in the near future and is often used as an indicator of soil nitrogen availability. Compared with the contents before the experiment, showing that returning straw to the field can increase soil nutrients. Comparing the factors of different treatments in the same soil layer showed that tillage patterns had significant effects on the contents of total nitrogen, available phosphorus, and available potassium in the 0~30 cm soil layer (p < 0.05) and only had significant effects on the content of alkali-hydrolyzed nitrogen in the 20~30 cm soil layer, but not in 0~20 cm. Comparing the differences in various indexes in different soil layers showed that, in the 0~10 cm soil layer, the total nitrogen and available potassium contents of RT and CN were significantly higher than those of PR (p < 0.05), but there was no significant difference between RT and CN. This may be due to the fact that RT and CN for 2 and 3 years of consecutive no-tillage, as well as the straw cover on the surface, increased the N, P, and K contents of the surface soil. In the 10~20 cm soil layer, the contents of total nitrogen, alkali-hydrolyzed nitrogen, available phosphorus, and available potassium of RT and PR were significantly higher than those of CN (p < 0.05), however, there was no significant difference between RT and PR. The reason may be that the CN had been plowed for 3 consecutive years, nutrients had accumulated in the surface soil, and soil bulk density was large, which was not conducive to the infiltration of surface nutrients. The surface layer has low levels of nitrogen, phosphorus, and potassium. However, rotational tillage has a smaller soil bulk density, which favors infiltration of surface nutrients and increases nitrogen, phosphorus, and potassium content. In the 20~30 cm soil layer, the total nitrogen, alkali solution nitrogen, available phosphorus, and available potassium content with RT were significantly higher than those with CN and PR and had significant differences between the treatments (p < 0.05). This suggests that the ploughed pan formed by ploughing is not conducive to the penetration of soil nutrients at the surface, and that 2~3 years of tilling has reduced the soil bulk density by 0~30 cm, which is conducive to nutrient penetration at the surface. However, as the number of years without tillage increases, the surface soil bulk density increases and nutrient permeability decreases, requiring proper tillage.

3.2.2. Effects on Soil Organic Carbon Content

The average soil organic carbon content of RT, CN, and PR increased by 18.60%, 10.96%, and 9.39%, respectively, compared to the pre-experiment levels, indicating that returning straw can increase the soil organic carbon content, and different tillage patterns have different effects on the soil organic carbon content. Comparing the soil organic carbon content in different soil layers showed that the soil organic carbon content in the 0~10 cm soil layer was significantly increased (p < 0.05) with RT and CN, but the difference between the two was not significant, although both were significantly higher, about 10% higher, than that with PR (p < 0.05). The reason may be that the straw returned to the field covered the ground for 2 or 3 consecutive years with RT and CN, which may have significantly increased the soil organic carbon content of the surface layer. In the 10~20 cm soil layer, there was no significant difference between RT and PR, but they were significantly higher than CN (p < 0.05), because 3 consecutive years of tillage of PR transferred the straw to the 10~20 cm soil layer, which increased the content of soil organic carbon in this layer. After only 2 years of no-tillage of RT, the soil firmness could still maintain the infiltration of organic carbon, whereas plowing after 2 years of no-tillage transferred the rich organic carbon from the surface layer to the 10~20 cm layer, which showed no significant difference between the 10~20 cm soil layer and 0~10 cm soil layer. In the 20~30 cm soil layer, the organic carbon of RT was significantly higher than that of CN and PR, and there was also a significant difference between CN and PR (p < 0.05). This may be because the continuous plowing of the PR formed a hard plow pan, so the organic carbon could not penetrate to the 20~30 cm soil layer, and 2 years of no-tillage of RT reduced the solidity of the plow pan soil, which was beneficial to the infiltration of the organic carbon. However, with the increase in the consecutive no-tillage years of CN, the soil solidity of the surface layer increased, and the nutrients that had accumulated in the surface layer could not penetrate to the pan layer, so it was necessary to carry out certain tillage to reduce the bulk density of the surface soil. This suggests that rotational tillage can make the soil organic carbon distribution in each 0~30 cm layer more uniform. In addition, continuous tillage only increases the organic carbon content of the 10~20 cm layer, continuous no-tillage only increases the organic carbon content of the 0~10 cm layer of the surface soil, and proper rotational tillage should be performed after either continuous or no-tillage.

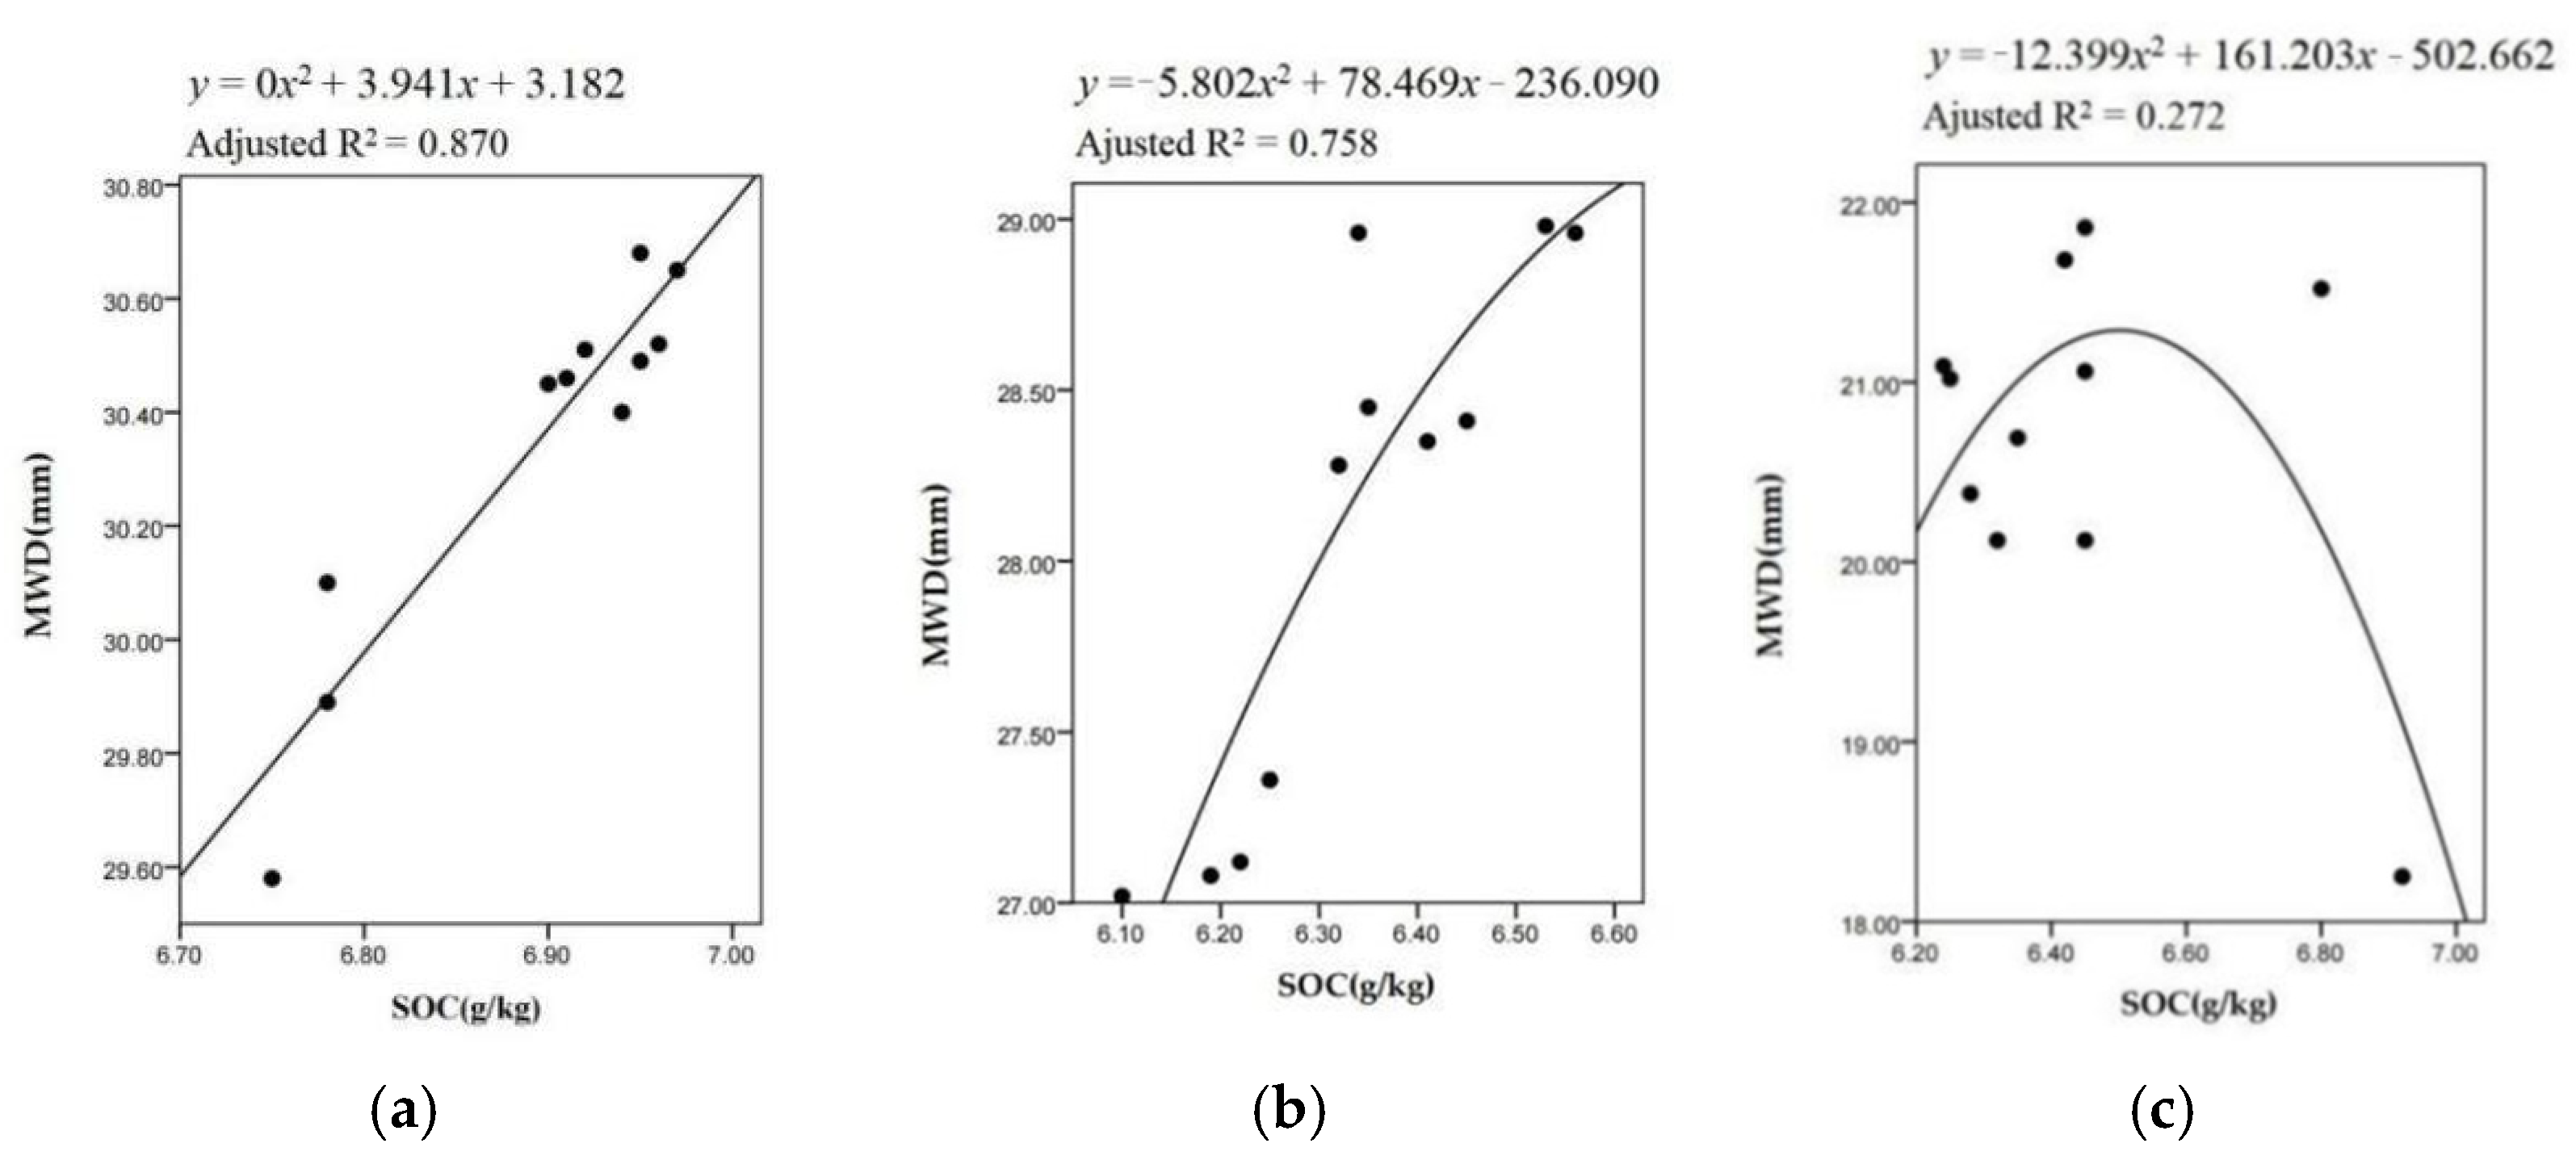
3.2.3. Regression Analysis of Soil Organic Carbon Content and Macroaggregate Stability

Figure 4 showed the regression curves of the macroscopic aggregate stability and organic carbon content of the soil in the 0~30 cm soil layer. Regression analysis showed that there was a very significant correlation between the soil’s macroaggregate stability and the soil’s organic carbon content in the 0~10 cm soil layer and the 10~20 cm soil layer (adjusted R2 = 0.870 and 0.758, p < 0.001) but not in the 20~30 cm soil layer. This indicates that organic carbon is an important factor affecting the stability of macroscopic aggregates in the 0–20 cm soil layer. However, it is not an effect in the 20~cm soil layer, but the soil bulk density is consistent with the result of 2.1.

3.3. Effect of Tillage Systems on Crop Yield

Table 4 showed the rice yield and yield components for different patterns. It showed that the effective panicles numbers of RT and CN were 4.22 and 4.26 × 10⁶/ha, respectively, which were significantly higher than 3.81 × 10⁶/ha of PR (p < 0.05). Although the tillage rate for direct seeding is lower than for transplanting, the amount of seed sown is larger and there are more basic seedlings, which ultimately results in more effective planting and effective panicles. The average panicle number of RT and CN was 90 and 88 grains per panicle, respectively, significantly lower than that of PT (98 grains per panicle). And the panicle length, seed setting rate and thousand-grain weight of RT and CN were all lower than those of PT. This may be because the growth period of direct seeding rice was shorter than that of transplanting rice, and the panicle development of rice was not as good as that of transplanting rice. Analyzing the final actual rice yield showed that RT is 8970 kg/ha, which is not significantly different from PR’s 9020 kg/ha but significantly higher than CN’s 7866 kg/ha. The main reason may be that the effective number of panicles under the rotation pattern with no-tillage and direct seeding is large, thus ensuring crop yield. However, with the increase in no-tillage for CN, the surface soil strength is increasing and the nutrient content of the underlying surface soil is decreasing, which is not conducive to nutrient uptake for the rice roots and results in a spike length and relatively small grains, resulting in a lower crop yield than the rotation pattern.
Table 5 showed the wheat yield and yield components for different tillage patterns. It showed that there is no significant difference in the number of base seedlings due to wheat sown without tillage in each treatment. However, average tillers, effective panicles, effective spike, grain number per spike, and thousand-grain weight had significant differences (p < 0.05). These values for RT are significantly higher than those for CN and PR. This suggests that the soil-tillage measure has some after-effects: soil tillage prior to rice planting can increase the average tillage rate and crop yield rate, while significantly increasing the effective number of grains and the number of grains per thousand weight. As for the analysis of actual crop yields, RT’s actual crop yields were 10.5% and 13.3% higher than CN’s and PR’s respectively, indicating that tillage measures prior to rice sowing had a significant effect on wheat yields, and that rotational tillage patterns could significantly improve wheat yields.

4. Discussion

In this paper, the effects of rotation tillage (RT) on soil physical and chemical properties and crop yield in wheat-rice double-cropping area were studied, and the comparison test between continuous tillage (CN) and continuous no-tillage (PR) was conducted to verify its superiority. At present, Chinese scholars mainly test the field effects of different crops combined with different tillage patterns. As far as we know, the rotation tillage pattern based on conservation tillage and combining traditional tillage with no tillage has not been designed. Therefore, the design of processing RT is innovative and scientific. Wu et al. [29] Designed and tested the effects of “wheat no-tillage, rice tillage” pattern and “wheat tillage, rice no-tillage” pattern on soil physical and chemical properties and crop yield in rice-wheat double-cropping area, and finally obtained that “wheat no-tillage, rice tillage” pattern has more advantages, and the crop yield of this pattern is increased by 5.70% compared with “wheat tillage, rice no-tillage” pattern. The similarity with this design is that the method of combining tillage with no-tillage is adopted, but the combination of tillage patterns is adopted for wheat and rice respectively, and the impact is different. The test method and duration are also different. The specific performance is as follows: In this design, in order to achieve the conservation tillage in the double-cropping area and minimize the soil tillage, the “wheat no-tillage, rice RT” pattern is adopted. This can prevent over tillage, further reduce the damage to soil structure and nutrients, and is conducive to nutrient accumulation. Due to the difference between the design duration of tillage pattern and the scheme, the test results can not be compared. It can be seen from the control experiment that the control treatment CN and PR, RT have advantages in soil structure and nutrient content of each soil layer, rice yield is the same as PR, but significantly higher than CN; The wheat yield was 10.5% and 13.3% higher than that of CN and PR respectively.
Through the analysis of the research on the domestic tillage pattern, it is found that in the rice-wheat double-cropping area of North China, the research on the tillage pattern is mainly to carry out theoretical analysis, integrate the advantages of different patterns, optimize the machines and tools, optimize the planting methods of seed and fertilizer, and verify in the field. This research innovatively designed a rotation tillage pattern combining traditional tillage with no-tillage, which improved the sustainability of soil structure and nutrient content advantages, improved the destructiveness of tillage to soil, and further increased crop yield. On the other hand, RT treatment creates good conditions for farming, optimizes the quality of seedbed, and further facilitates the implementation and promotion of no-tillage sowing. The research on the design of the new rotation tillage pattern in the rice-wheat double-cropping area has not been found, so the research has certain novelty.
This study has carried out some innovative farming pattern design, but there are also some limitations. The details are as follows.
(1) The designed treatment RT takes 3 years as the research period, and takes rice-wheat double-cropping area as the regional basis. The field effects of the following years need to be further studied, and the effects of different crop conditions also need to be further studied.
(2) In this paper, the field experiments of different tillage patterns were conducted in the rice-wheat double-cropping area of Rizhao City, Shandong Province. The soil type is paddy soil, and the main crops are wheat and rice. The next step will be to study the method optimization of the rotation tillage pattern under different soil conditions and different types of environmental conditions, so as to find out the tillage pattern suitable for different regions and environments.

5. Conclusions

Combining traditional tillage with no tillage, a soil rotation tillage (RT) pattern was designed for rice-wheat double-cropping area. With continuous tillage (CN) and continuous no tillage (PR) as the control group, a three-year contrast experiment of different tillage patterns was completed, which verified the advantages of the rotation pattern in rice wheat dual cropping area.
Through soil sampling and determination in the control test area for three consecutive years, soil aggregates and soil bulk density were taken as the marker factors of soil structure change, which confirmed that treatment RT could improve soil structure. The results showed that, on the one hand, in the 0~10 cm soil layer, the content of soil aggregates of RT and CN treatments increased significantly; In 10~20 cm soil layer, the aggregate content of RT and PR was significantly higher than that of CN; In 20~30 cm soil layer, RT of treatment was significantly higher than that of CN and PR. On the other hand, the soil bulk density of RT treatment is at a low level in each soil layer, as low as 1.5 g/cm3. It can be concluded that rotation tillage can significantly improve the stability of soil structure and improve soil structure.
By sampling and measuring the main nutrient components of soil in each area of the control experiment for three consecutive years, the content of N, P, K and organic carbon were taken as the marker factors of soil nutrient content changes, which confirmed that treatment RT could improve soil nutrient content. The results showed that the contents of total nitrogen, available potassium and organic carbon of RT and CN treatments were significantly higher than those of PR treatments in 0~10 cm soil layer; In 10~20 cm soil layer, the contents of total nitrogen, alkali hydrolyzable nitrogen, available phosphorus, available potassium and organic carbon of RT and PR treatments were significantly higher than those of CN treatments; In 20~30 cm soil layer, the contents of total nitrogen, alkali hydrolyzable nitrogen, available phosphorus, available potassium and organic carbon of RT treatment were significantly higher than those of CN and PR. It can be concluded that rotation tillage can significantly improve the comprehensive nutrient content of soil.
The control experiment showed that RT could improve rice yield, panicle length, grains per panicle and thousand grain weight. Rice yield is similar to PR, but significantly higher than CN. The soil tillage before rice planting affected wheat. RT significantly increased the average tillage, effective panicles, effective grains per panicle and thousand grain weight, and the crop yield was 10.5% and 13.3% higher than CN and PR respectively.

Author Contributions

Conceptualization, Y.-P.Z.; methodology, Y.-P.Z. and H.-J.H.; software, X.L. and H.-J.H.; validation, Y.-P.Z., H.Z. and D.-Y.G.; formal analysis, Y.-P.Z. and Y.-Z.Z.; investigation, H.Z. and X.L.; writing—original draft preparation, X.L. and H.-J.H.; writing—review and editing, Y.-P.Z. All authors have read and agreed to the published version of the manuscript.

Funding

The work was supported by the National Key R&D Program of China (2021YFD2000401-2), the Modern Agricultural Industrial System of Shandong Province (SDAIT-02-12), the School-City Integration Development Plan of Zibo, Shandong (2018ZBXC304).

Institutional Review Board Statement

Not applicable.

Informed Consent Statement

Not applicable.

Data Availability Statement

The data presented in this study are available on request from the corresponding author.

Conflicts of Interest

The authors declare no conflict of interest.

References

  1. Jacobs, A.; Helfrich, M.; Hanisch, S.; Quendt, U.; Rauber, R.; Ludwig, B. Effect of conventional and minimum tillage on physical and biochemical stabilization of soil organic matter. Biol. Fertil. Soils 2010, 46, 671–680. [Google Scholar] [CrossRef] [Green Version]
  2. Zhang, Y.P.; Chi, Y.J.; Wang, Z.B.; Li, X.R.; Li, H.W.; Diao, P.S. Comprehensive evaluation of periodic productivity of combined tillage mode in wheat-maize double cropping areas. Trans. Chin. Soc. Agric. Eng. 2020, 36, 35–43. [Google Scholar]
  3. Zhang, H.H.; Zhang, Y.Q.; Yan, C.R.; Liu, E.K.; Chen, B.Q. Soil nitrogen and its fractions between long-term conventional and no-tillage systems with straw retention in dryland farming in northern China. Geoderma 2016, 269, 138–144. [Google Scholar] [CrossRef]
  4. Hong, Y.H.; Zhao, D.; Zhang, F.Z.; Shen, G.N.; Yuan, Y.; Gao, Y.M.; Yan, L.; Wei, D.; Wang, W.D. Soil water-stable aggregates and microbial community under long-term tillage in black soil of Northern China. Ecotoxicology 2021, 30, 1754–1768. [Google Scholar] [CrossRef]
  5. Tang, W.G.; Xiao, X.P.; Tang, H.M.; Zhang, H.L.; Chen, F.; Chen, Z.D.; Xue, J.F.; Yang, G.L. Effects of long-term tillage and rice straw returning on soil nutrient pools and Cd concentration. J. Appl. Ecol. 2015, 26, 168–176. [Google Scholar]
  6. Luo, Z.Z.; Gan, Y.T.; Niu, Y.N.; Zhang, R.Z.; Li, L.L.; Cai, L.Q.; Xie, J.H. Soil quality indicators and crop yield under long-term tillage systems. Exp. Agric. 2017, 53, 497–511. [Google Scholar] [CrossRef]
  7. Liu, W.; Zhang, G.Y.; Zhang, J.; Liu, L.; Huang, L.; Lu, J.W. Effects of Two Conservation Tillage Measures on Soil Aggregate Stability. J. Soil Water Conserv. 2015, 29, 117–122. [Google Scholar]
  8. Gao, H.J.; Peng, C.; Zhang, X.Z.; Li, Q.; Jia, L.H.; Zhu, P. Effects of Different Straw Returning Modes on Characteristics of Soil Aggregates in Chernozem Soil. J. Soil Water Conserv. 2019, 33, 75–79. [Google Scholar]
  9. Sheehy, J.; Regina, K.; Alakukku, L.; Six, J. Impact of no-till and reduced tillage on aggregation and aggregate-associated carbon in Northern European agroecosystems. Soil Tillage Res. 2015, 150, 107–113. [Google Scholar] [CrossRef]
  10. Tian, S.Z.; Ning, T.Y.; Wang, Y.; Liu, Z.; Li, G.; Li, Z.J.; Lal, R. Crop yield and soil carbon responses to tillage method changes in North China. Soil Tillage Res. 2016, 163, 207–213. [Google Scholar] [CrossRef]
  11. Zhang, Y.F.; Sun, G.F.; Zhou, W.; Hu, Y.R.; Wang, X.; Chen, L.G.; Zheng, J.C. Effects of conservation tillage on soil carbon pool from high production rice-wheat double cropping systems in South China. Southwest-China J. Agric. Sci. 2015, 28, 1155–1160. [Google Scholar]
  12. Zhang, Y.P.; Wang, Z.W.; Diao, P.S.; Du, R.C.; Li, H.W.; Yao, W.Y. Short-term effects of mechanical and ecological tillage pattern on physical and chemical characteristics of soil in arid area. Trans. Chin. Soc. Agric. Mach. 2018, 49, 45–55. [Google Scholar]
  13. Du, Z.L.; Ren, T.S.; Hu, C.S.; Zhang, Q.Z. Transition from intensive tillage to no-till enhances carbon sequestration in microaggregates of surface soil in the North China Plain. Soil Tillage Res. 2015, 146, 26–31. [Google Scholar] [CrossRef]
  14. Zhang, Q.; Wang, S.L.; Sun, Y.G.; Zhang, Y.H.; Li, H.Y.; Liu, P.Z.; Wang, X.L.; Wang, R.; Li, J. Conservation tillage improves soil water storage, spring maize (Zea mays L.) yield and WUE in two types of seasonal rainfall distributions. Soil Tillage Res. 2022, 215, 105237. [Google Scholar] [CrossRef]
  15. Cheng, J.P.; Wu, J.P.; Luo, X.W.; Fan, Q.Z.; Zhang, G.Z.; Zhou, Z.Y.; Zang, Y.; Yang, B.B. Influence of different planting methods on growth characteristics and yield of early rice. Hubei Agric. Sci. 2011, 50, 457–460. [Google Scholar]
  16. Farooq, M.; Siddique, K.H.; Rehman, H.; Aziz, T.; Lee, D.J.; Wahid, A. Rice direct seeding: Experiences, challenges and opportunities. Soil Tillage Res. 2011, 111, 87–98. [Google Scholar] [CrossRef]
  17. Gupta, R.K.; Hussain, A.; Sooch, S.S.; Kang, J.S.; Sharma, S.; Dheri, G.S. Rice straw biochar improves soil fertility, growth, and yield of rice–wheat system on a sandy loam soil. Exp. Agric. 2020, 56, 118–131. [Google Scholar] [CrossRef]
  18. Hossain, M.I.; Ohab, M.A.; Sheikh, M.H.R.; Nag, B.L. Different Tillage Options and Residue Management for Improving Crop Productivity and Soil Fertility in Wheat-Maize-Rice Cropping Pattern. Bangl. Agron. J. 2019, 22, 55–66. [Google Scholar] [CrossRef]
  19. Zhang, Y.P.; Du, R.C.; Diao, P.S.; Yang, S.D. Experiment of no-tillage and drought direct sowing rice and feasibility analysis in Shandong Province. Trans. Chin. Soc. Agric. Eng. 2016, 32, 24–30. [Google Scholar]
  20. Zhang, Y.P.; Du, R.C.; Diao, P.S.; Yang, S.D.; Wang, Z.W. Design and experiment of wide band seeding rice seeder with reversed stubble cleaning and anti-blocking. Trans. Chin. Soc. Agric. Eng. 2017, 33, 7–13. [Google Scholar]
  21. Song, K.; Yang, J.J.; Xue, Y.; Lv, W.G.; Zheng, X.Q.; Pan, J.J. Influence of tillage practices and straw incorporation on soil aggregates, organic carbon, and crop yields in a rice-wheat rotation system. Sci. Rep. 2016, 6, 36602. [Google Scholar] [CrossRef] [PubMed]
  22. Six, J.; Elliott, E.T.; Paustian, K.; Doran, J.W. Aggregation and soil organic matter accumulation in cultivated and native grassland soils. Soil Sci. Soc. Am. J. 1998, 62, 1367–1377. [Google Scholar] [CrossRef] [Green Version]
  23. Martins, M.D.R.; Angers, D.A.; Corá, J.E. Carbohydrate Composition and Water-Stable Aggregation of an Oxisol as Affected by Crop Sequence under No-Till. Soil Sci. Soc. Am. J. 2012, 76, 475–484. [Google Scholar] [CrossRef]
  24. Bottinelli, N.; Angers, D.A.; Hallaire, V.; Michot, D.; Le Guillou, C.; Cluzeau, D.; Heddadj, D.; Menasseri-Aubry, S. Tillage and fertilization practices affect soil aggregate stability in a Humic Cambisol of Northwest France. Sci. Rep. 2017, 170, 14–17. [Google Scholar] [CrossRef]
  25. Yin, T.; Zhao, C.X.; Yan, C.R.; Du, Z.L.; He, W.Q. Inter-annual changes in the aggregate-size distribution and associated carbon of soil and their effects on the straw-derived carbon incorporation under long-term no-tillage. J. Integr. Agric. 2018, 17, 2546–2557. [Google Scholar] [CrossRef] [Green Version]
  26. Ferreira, C.J.B.; Tormena, C.A.; Severiano, E.D.C.; Zotarelli, L.; Betioli Júnior, E. Soil compaction influences soil physical quality and soybean yield under long-term no-tillage. Arch. Agron. Soil Sci. 2021, 67, 383–396. [Google Scholar] [CrossRef]
  27. Wang, H.H.; Li, X.; Li, X.; Wang, J.; Li, X.Y.; Guo, Q.; Yu, Z.X.; Yang, T.T.; Zhang, H.W. Long-term no-tillage and different residue amounts alter soil microbial community composition and increase the risk of maize root rot in northeast China. Soil Tillage Res. 2020, 196, 104452. [Google Scholar] [CrossRef]
  28. Briedis, C.; de Moraes Sá, J.C.; Caires, E.F.; de Fátima Navarro, J.; Inagaki, T.M.; Boer, A.; Neto, C.Q.; de Oliverira Ferreira, A.; Canalli, L.B.; Dos Santos, J.B. Soil organic matter pools and carbon-protection mechanisms in aggregate classes influenced by surface liming in a no-till system. Geoderma 2012, 170, 80–88. [Google Scholar] [CrossRef]
  29. Wu, J.; Guo, X.S.; Wang, Y.Q.; Xu, Z.Y.; Lu, J.W. Effects of tillage patterns on crop yields and soil physicochemical properties in wheat-rice rotation system. Trans. Chin. Soc. Agric. Eng. 2012, 28, 87–93. [Google Scholar]
Figure 1. Schematic diagram of annual farming patterns in different test areas.
Sustainability 15 00474 g001
Figure 2. Seedling belt pattern diagram: (a) Wide seeding belt; (b) Narrow seeding belt.
Sustainability 15 00474 g002
Figure 3. Change of soil bulk density in different years from 2017 to 2020 at different depths: (a) 0~10 cm; (b) 10~20 cm; (c) 20~30 cm.
Sustainability 15 00474 g003
Figure 4. The multiple regression analysis between SOC and MWD in 0~30 cm layer: (a) 0~10 cm; (b) 10~20 cm; (c) 20~30 cm.
Sustainability 15 00474 g004
Table 1. Physico-chemical properties of pre-sowed soil.
ParameterNumerical Value
Soil typeRetention of fertile paddy soil
pH6.8
average organic carbon of 0~30 cm soil layer (g/kg)5.75
total nitrogen (g/kg)0.95
alkaline hydrolysis nitrogen (mg/kg)82.43
available phosphorus (mg/kg)34.30
rapidly available potassium (mg/kg)73.10
average bulk density (g/cm3)1.423
Table 2. The content of soil macroaggregates with a diameter of >0.25 mm (R > 0.25), mean weight diameter (MWD), and the percentage of aggregate disruption (K) in 0~30 cm soil layers of different tillage patterns.
Soil Sample Depth (cm)TreatmentR > 0.25 (%)MWD (mm)K (%)
Mechanical
Stability
Water StabilityMechanical
Stability
Water Stability
0~10RT *76.43a30.52a3.01a0.48b60.07b
CN **77.41a31.44a3.24a0.54a59.39b
PR ***64.53b22.38b2.21b0.38c65.32a
10~20RT71.57a28.41a2.88a0.40a60.30b
CN68.62b26.26b2.59b0.32b61.73a
PR70.12a27.88a2.76a0.38a60.24b
20~30RT69.92a26.31a2.48a0.34a62.37c
CN63.86b22.23b2.17b0.27b65.19b
PR55.76c18.82c2.11c0.21c66.25a
Note: Here and below, different small letters in the same column indicate a significant differences at the 0.05 level. * A 3-year cycle of rotation tillage pattern; ** Continuous no-tillage pattern; *** Ploughing and rotary tillage.
Table 3. The content of various nutrients in soil under different tillage systems.
Depth (cm)TreatmentsTotal
Nitrogen (g/kg)
Alkali
Hydrolyzed
Nitrogen (mg/kg)
Available
Phosphorus (mg/kg)
Available
Potassium (mg/kg)
Organic
Carbon (g/kg)
0~10RT1.12a92.05a38.84a105.24a6.96a
CN1.18a93.21a36.28b106.36a6.98a
PR0.96 b91.42a32.54b102.55b6.32b
10~20RT0.99a89.21a35.98a98.32a6.85a
CN0.82b87.05a32.60a90.56b6.25b
PR0.97 a88.00a35.68a99.47a6.92a
20~30RT0.94a90.21a33.98a96.32a6.65a
CN0.78b75.05b26.40b80.56b5.92b
PR0.68c60.00c23.68c69.47c5.65c
Note: Here and below, different small letters in the same column indicate a significant differences at the 0.05 level.
Table 4. Effects on rice yield and yield components of different tillage systems.
TreatmentEffective Panicles (106·ha)Spike Length (cm)Grain Number Per SpikeSeed Setting Rate (%)Thousand-Grain Weight (g)Actual Output (kg·ha)
RT4.22b13.2a90b93b26.5a8 970a
CN4.41a12.8b88b92b24.6b7 866b
PR3.81c13.9a98a96a27.3a9 020a
Note: Here and below, different small letters in the same column indicate a significant differences at the 0.05 level.
Table 5. Effects on wheat yield and yield components of different tillage systems.
TreatmentBasic
Seedling (106·ha)
Average Tiller
Per Plant
Effective
Panicles (106·ha)
Effective
Number of Grains Per Spike
Thousand-
Grain Weight (g)
Actual
Output (kg·ha)
RT1.65a3.75a5.95a34.2a45.2a7818 a
CN1.63a3.59b5.87b32.5b43.6b7073 b
PR1.62a3.42c5.78b32.3b42.8c6898 b
Note: Here and below, different small letters in the same column indicate a significant differences at the 0.05 level.
Disclaimer/Publisher’s Note: The statements, opinions and data contained in all publications are solely those of the individual author(s) and contributor(s) and not of MDPI and/or the editor(s). MDPI and/or the editor(s) disclaim responsibility for any injury to people or property resulting from any ideas, methods, instructions or products referred to in the content.

