Article

Where Are We Heading? Tackling the Climate Change in a Globalized World

1
Faculty of Economics and Business Administration, Babes-Bolyai University, 400347 Cluj-Napoca, Romania
2
Transylvania Bank, 400117 Cluj-Napoca, Romania
*
Author to whom correspondence should be addressed.
Sustainability 2023, 15(1), 565; https://doi.org/10.3390/su15010565
Submission received: 30 October 2022 / Revised: 20 December 2022 / Accepted: 23 December 2022 / Published: 28 December 2022
(This article belongs to the Special Issue Air Pollution and Environmental Sustainability)

Abstract

:
Nowadays, a very strong concern is coming from the fact that human intervention is heavily affecting the environment. In the past, the most harmful countries for the environment were the USA and Europe due to their development and level of industrialization. Today, the most impactful countries on the environment are the ones from across Asia, especially China and India. In order to interrupt these issues and to help prevent the further deterioration of the world, the UN redacted the 2030 Agenda. This presents a possible way in which countries might act against the effects of climate changes, reducing global warming and further world pollution. Being the most ambitious in this regard, the EU decided to implement the Green Deal. In our paper, based on the EU accomplishments in this direction, we try to build a scenario of how the world will look like if the three most polluting countries will apply the targets set by the EU. In this attempt, we used the Kaya Identity to measure the forecasted impact and arrived to the conclusion that, by applying this measures, energy consumption will be reduced, the consumption of renewable energy will increase, CO2 emissions will be reduced and the world can manage to come back to the level it had in 1990.

1. Introduction

Given the fact that a war is going on in Europe and an incredible pressure regarding energy supply affects all European countries, leading some to consider going back to exploiting polluting resources, we considered the international environment to be very complicated. Still, the climate changes and the urge to mitigate them are still here.
Climate change is a long-term change in climate patterns, which happens at both the global and regional level. The term is often used in correlation with the rise of global temperatures. In other words, this term represents a long-term modification of temperature and typical weather in a certain area.
This phenomenon is as sure as can be and cannot be stopped, but it can be reduced or mitigated before irreversible damage occurs [1]. The appropriate way of doing this is preventing or reducing the emissions of greenhouse gasses. Global climate change has already caused visible alterations in the environment. The glaciers have shrunk in the last 10 years, and the ice that was covering the lakes and rivers is melting much faster compared to previous years [2]. The plants and trees are growing faster, the seasons are not as clear as they were in the past, and the global temperatures increased by almost 2 degrees Celsius compared to 1880, as NASA shows, which is prospected to increase to almost 4 degrees Celsius until 2030 [3]. Due to all these changes, which started as being not as impactful as they are today, climate change is one of the most serious and severe challenges that Earth is facing nowadays. This phenomenon is most influenced by the greenhouse gasses, which both humans, e.g., such human inventions as factories and industries and so on, and some natural processes emit into the atmosphere. Evidence shows that some natural processes are polluting even the same as some factories. The natural processes cannot be controlled and mitigated, but the human impact on the atmosphere can be controlled and should be done in order to hold the world temperature increase below 1.5 °C [4]. However, human activities release large amounts of other greenhouse gases, which increases their atmospheric concentration and enhances the greenhouse effect, thus warming the climate. The main greenhouse gas sources resulting from human activities are the following:
  • burning of fossil fuels (coal, oil and gas) in electricity generation, transport, industry and households (CO2);
  • agriculture (methane from livestock and manure);
  • land use change and deforestation (CO2);
  • landfilling of waste (methane from decomposition);
  • use of industrial fluorinated gases.
In order to mitigate these impacts, an essential step is to determine which are the drivers for changing consumption and emissions. A precise determination of a causality between human activities and energy use is difficult to establish due to its complex nature [5]. Thus, these drivers might be used to provide the framework for an analysis [6].
According to the Kaya Identity methodology, these drivers are grouped into three categories [7]:
-
Activity drivers directed to measure the demand for energy service, such as population, welfare, living standards, economy;
-
Efficiency drivers measuring the direct impact of technology;
-
Carbon drivers, which set a relation between emissions and energy.
In the literature, analysis aimed at disaggregating the impact of the energy system on sustainability has been developed as IPAT Identity [8], based on population, affluence and technology, and Kaya Identity [9], which expresses CO2 emissions as the product of demographic (population, P), economic (per capita income, g), efficiency (energy intensity, e) and emissive (carbon intensity, f) factors.
As climate change has turned into a critical problem due to the close relation between CO2 emissions and the rise of global temperatures [10], Kaya Identity became a standard in the research field [11]. However, this decomposition is not unique, as additional indicators could be defined by further decomposing or combining the factors of the Kaya Identity. [12]
According to a World Meteorological Organization (WMO) report and Climate Trade data offered in 2019, because the responsibility countries share regarding the climate crisis is not equal, immediate action should be taken by the biggest polluters. Firstly, they should reduce carbon emissions. Secondly, they should support environmental projects all over the world and, thus, contribute to offset their carbon footprint. The main source of greenhouse gases are the tons of CO2 released into the atmosphere (more than 30 gigatons each year). Most of them come from burning fossil fuels and polluting human activities. Another fact worth mentioning is that just three countries are accountable for more than half of these carbon emissions. For instance, China generates around 30% of all global emissions, while the US accounts for approximately 14%, followed by India with close to 7% [13].
This paper aims to conduct an empirical analysis and a forecast of how the world will look if the target of the EU directives proposed for preventing the further deterioration of the world was embraced and used by the most impactful economies in terms of energy consumption, gas emissions and so on. The purpose of the present paper is to analyse the impact of complying with the targets established by the European Union’s Agenda (Green Deal) for the USA, India and China, namely, reduction of gas emissions, increasing efficiency and increasing energy from renewable sources

2. Materials and Methods

2.1. EU Directives and Measures

In 2000, the European Commission established ECCP, namely, the European Climate Change Programme [14], which was a mechanism by which the EU aimed to identify the issues regarding the environment, as well as the most effective policies, rules, measures and regulations, in order to reduce greenhouse gas emissions. The idea behind this programme was to help the EU meet the requirements and targets imposed by the Kyoto Protocol. Article 2 of this international treaty aims to reduce the onset of global warming by reducing greenhouse gas concentrations in the atmosphere to “a level that would prevent dangerous anthropogenic interference with the climate system” [15]. There are seven greenhouse gases listed: carbon dioxide (CO2), methane (CH4), nitrous oxide (N2O), hydrofluorocarbons (HFCs), perfluorocarbons (PFCs), sulfur hexafluoride (SF6) and nitrogen trifluoride (NF3-was added for the second compliance period during the Doha Round) [16,17].
The programme was built starting from previous such programmes and considering several initiatives, ideas and methods by which the EU might be able to meet the Kyoto Protocol targets. It acted as a thinking mechanism composed by several sub-mechanisms that were individually responsible for bringing innovative ideas or enhanced ways by which the EU could reduce greenhouse gas emissions. It also acted as an analyzing mechanism that was responsible for bringing changes and improvements to other policies, such as the one that addressed the issue of clean air, energy security or the dependency of the EU on other countries.
In 2005, the second version of this programme was launched [18]. This comprised the revised first edition and the findings of the first edition individual sub-mechanisms. The second programme was created in combination with the EU’s Lisbon strategy for increasing economic stability and enhancing the economic situation, as well as creating new jobs or further developing the existing ones. The second version had fewer sub-mechanisms and managed to address the issue in a more focused way. The focus points were to help further developing and implementing the findings from the first versions, deal with the aviation issues, reduce the impact of cars and consumers that impact the CO2 emissions, find ways by which carbon can be stored, adapt to possible outcomes of climate change and reduce the emissions of ships. The programme managed to find additional ways to enhance these five domains and aid in implementing the findings.
The latest programme of the EU has set ambitious targets, namely, to reduce emissions to almost 0 by 2050. Under the Paris Agreement, the regulation on the governance of the Energy Union and Climate Action, the EU adopted a set of measures and integrated rules that would help achieve the goals for 2030 and 2050 [19,20,21]. EEA is responsible for these regulations and deals with the monitoring, planning and reporting of the progress made by the EU towards reaching its goal. In 2015, the energy union was created, which represents another mechanism that is needed in order to reach the goal for 2030 and 2050. The Energy Union deals with assuring that EU consumers, both physical and juridical persons, pursue a sustainable, competitive and affordable energy. The Energy Union built five dimensions that are interconnected, namely:
  • decarbonization (greenhouse gas reduction and renewables)
  • energy security
  • energy efficiency
  • internal energy market
  • research, innovation and competitiveness
For this latest programme, the EU member states have to submit their individual final plans on how they will act towards reaching the EU’s goal by 2019. These plans must be submitted by June 2023, and the final form of the draft, with a revised and more ambitious tackling of the problem, must be submitted by June 2024. This latest programme created the 2020 package and the 2030 package, which are laws that aim to show the interest of the EU in achieving the target it assumed.
The legislation regarding the climate and environment were revised. In December 2018, four key pieces of new regulations were added. The main provisions of the revised regulations are as follows:
  • From the Regulation (EU) 2018/1999 of the European Parliament and of the Council of 11 December 2018, on the Governance of the Energy Union and Climate Action [22], the following ideas are to be remembered:
    • The European Council endorsed a 2030 Framework for Energy and Climate for the Union based on four key Union-level targets:
      -
      a reduction of at least 40% in economy-wide greenhouse gas (GHG) emissions,
      -
      an indicative target of improvement in energy efficiency of at least 27%, to be reviewed by 2020 with a view to increasing the level to 30%;
      -
      a share of renewable energy consumed in the Union of at least 27%;
      -
      electricity interconnection of at least 10% for 2020 and 15% for 2030.
    • A recast of Directive 2009/28/EC of the European Parliament and of the Council [23] has introduced a new, binding, renewable energy target for the Union for 2030 of at least 32%, including a provision for a review with a view to increasing the Union-level target by 2023.
    • Amendments to Directive 2012/27/EU [24] have set the Union-level target for improvements in energy efficiency in 2030 to at least 32.5%, including a provision for a review with a view to increasing the Union-level targets.
    • Member States should use the energy efficiency first principle. This includes, in particular, the treatment of energy efficiency as a crucial element and a key consideration in future investment decisions on energy infrastructure in the Union. Such cost-efficient alternatives include measures to make energy demand and energy supply more efficient, in particular, by means of cost-effective end-use energy savings, demand response initiatives and conversion that is more efficient, transmission and distribution of energy.
  • The Directive (EU) 2018/2002 of the European Parliament and of the Council of 11 December 2018 amending Directive 2012/27/EU [22] on energy efficiency set the targets for 2020 and 2030:
    • That the Union’s 2020 primary energy consumption has to be no more than 1474 Mtoe of primary energy, and the final energy consumption has to be no more than 1078 Mtoe.
    • Projections made in 2007 showed a primary energy consumption in 2020 of 1842 Mtoe. A 20% reduction results in 1474 Mtoe in 2020, i.e., a reduction of 368 Mtoe as compared to projections.
    • After Croatia entered in UE, the primary energy consumption value is 1483 Mtoe and 1086 Mtoe for final energy consumption.
From The Directive (EU) 2018/2002 on energy efficiency, the most important paragraphs that need to remembered are:
  • The European Council supported a 27% energy efficiency target for 2030 at Union level, to be reviewed by 2020 having in mind a Union-level target of 30%, and with the future perspective to reach 40% until 2030.
  • Projections made in 2007 showed a primary energy consumption in 2030 of 1887 Mtoe and a final energy consumption of 1416 Mtoe. A 32.5% reduction results in 1273 Mtoe and 956 Mtoe in 2030 respectively.
  • Member States should set their national indicative energy efficiency contributions taking into account that the Union’s 2030 energy consumption has to be no more than 1273 Mtoe of primary energy and/or no more than 956 Mtoe of final energy. This means that primary energy consumption in the Union should be reduced by 26%, and final energy consumption should be reduced by 20% compared to the 2005 levels.
  • Member States are required to achieve cumulative end-use energy savings for the entire obligation period 2021 to 2030, equivalent to new annual savings of at least 0,8% of final energy consumption. To that end, Member States should be able to make use of an energy efficiency obligation scheme, alternative policy measures, or both.
3.
The Directive (EU) 2018/2001 of the European Parliament and of the Council of 11 December 2018 on the promotion of the use of energy from renewable comes with amendments for the Directive 2009/28/EC of the European Parliament and of the Council of 23 April 2009 [22]. The most important paragraphs from this directive are those that set the targets for 2020 and 2030:
  • 20% target for the overall share of energy from renewable sources and a 10% target for energy from renewable sources in transport. Those targets exist in the context of the 20% improvement in energy efficiency by 2020.
  • Each Member State shall ensure that the share of energy from renewable sources, in gross final consumption of energy in 2020 is at least its national overall target for the share of energy from renewable sources in that year.
  • Such mandatory national overall targets are consistent with a target of at least a 20% share of energy from renewable sources in the Community’s gross final consumption of energy in 2020.
From the Directive (EU) 2018/2001 [25] regulating year 2030, the most important aspects that have to be remembered are:
  • Member States should take additional measures in the event that the share of renewable energy at Union level does not meet the Union trajectory towards the renewable energy target of at least 32%.
  • Representing around half of the final energy consumption of the Union, the heating and cooling sector is considered to be a key sector in accelerating the decarbonization of the energy system. Moreover, it is also a strategic sector in terms of energy security, as around 40% of the renewable energy consumption by 2030 is projected to come from renewable heating and cooling.
  • Advanced biofuels and other biofuels and biogas, renewable liquid and gaseous transport fuels of non-biological origin, and renewable electricity in the transport sector can contribute to low carbon emissions, stimulating the decarbonization of the Union transport sector in a cost-effective manner.
  • With regard to Intelligent Transport, it is important to increase the development and deployment of electric mobility for road, as well as to accelerate the integration of advanced technologies into innovative rail. Electro mobility is expected to constitute a substantial part of the renewable energy in the transport sector by the year 2030.
4.
The Directive 2009/31/EC of the European Parliament and of the Council on the geological storage of carbon dioxide (so-called “CCS Directive”) [26] establishes a legal framework for the environmentally safe geological storage of CO2 to contribute to the fight against climate change and for stabilizing greenhouse gas concentrations in the atmosphere at a level that would prevent dangerous anthropogenic interference with the climate system.
The most important paragraphs from this directive are:
  • The Community is committed to achieving an 8% reduction in emissions of greenhouse gases by 2008 to 2012 compared to 1990 levels, and that, in the longer term, global emissions of greenhouse gases will need to be reduced by approximately 70% compared to 1990 levels.
  • The Commission Communication of 10 January 2007 entitled ‘Limiting global climate change to two degrees Celsius—The way ahead for 2020 and beyond’ clarifies that in the context of the envisaged global reduction of greenhouse gas emissions of 50% by 2050, a reduction in greenhouse gas emissions of 30% in the developed world by 2020 is required, rising to 60–80% by 2050.
  • Carbon dioxide capture and geological storage (CCS) is a bridging technology that will contribute to mitigating climate change. It consists of the capture of carbon dioxide (CO2) from industrial installations, its transport to a storage site and its injection into a suitable underground geological formation for the purposes of permanent storage. This technology should not serve as an incentive to increase the share of fossil fuel power plants. Its development should not lead to a reduction of efforts to support energy saving policies, renewable energies and other safe and sustainable low carbon technologies, both in research and financial terms.
  • Preliminary estimates, indicate that seven million tonnes of CO2 could be stored by 2020, and up to 160 million tonnes by 2030, assuming a 20% reduction in greenhouse gas emissions by 2020 and provided that CCS obtains private, national and Community support and proves to be an environmentally safe technology. The CO2 emissions avoided in 2030 could account for some 15% of the reductions required in the Union.
  • Member States that intend to allow geological storage of CO2 on their territory should undertake an assessment of the storage capacity available within it.
Important to add is that, given the strict rules and regulations, many countries in the EU 28 have achieved beforehand the 2020 targets in terms of energy efficiency, renewable energy and CO2 emissions, as well as for reducing the emissions from industries, having more sustainable vehicle infrastructure and shifting towards greener alternatives to fossil fuels and hydrogen.
Having already reached the target for 2030, several countries already showed an interest in respecting and working together for reducing and preventing global warming.
The EU aims to be climate-neutral by 2050, exhibiting an economy with net-zero greenhouse gas emissions. This objective is at the heart of the European Green Deal [27], a plan to make the EU’s economy sustainable and in line with the EU’s commitment to global climate action under the Paris Agreement [28].
First climate action initiatives under the Green Deal include:
  • European Climate Law [29] to enshrine the 2050 climate-neutrality objective into the EU law;
  • European Climate Pact [30] to engage citizens and all parts of society in climate action;
  • 2030 Climate Target Plan [31] to further reduce net greenhouse gas emissions by at least 55% by 2030 compared to levels in 1990;
  • New EU Strategy on Climate Adaptation [32] to make Europe a climate-resilient society by 2050, fully adapted to the unavoidable impacts of climate change.
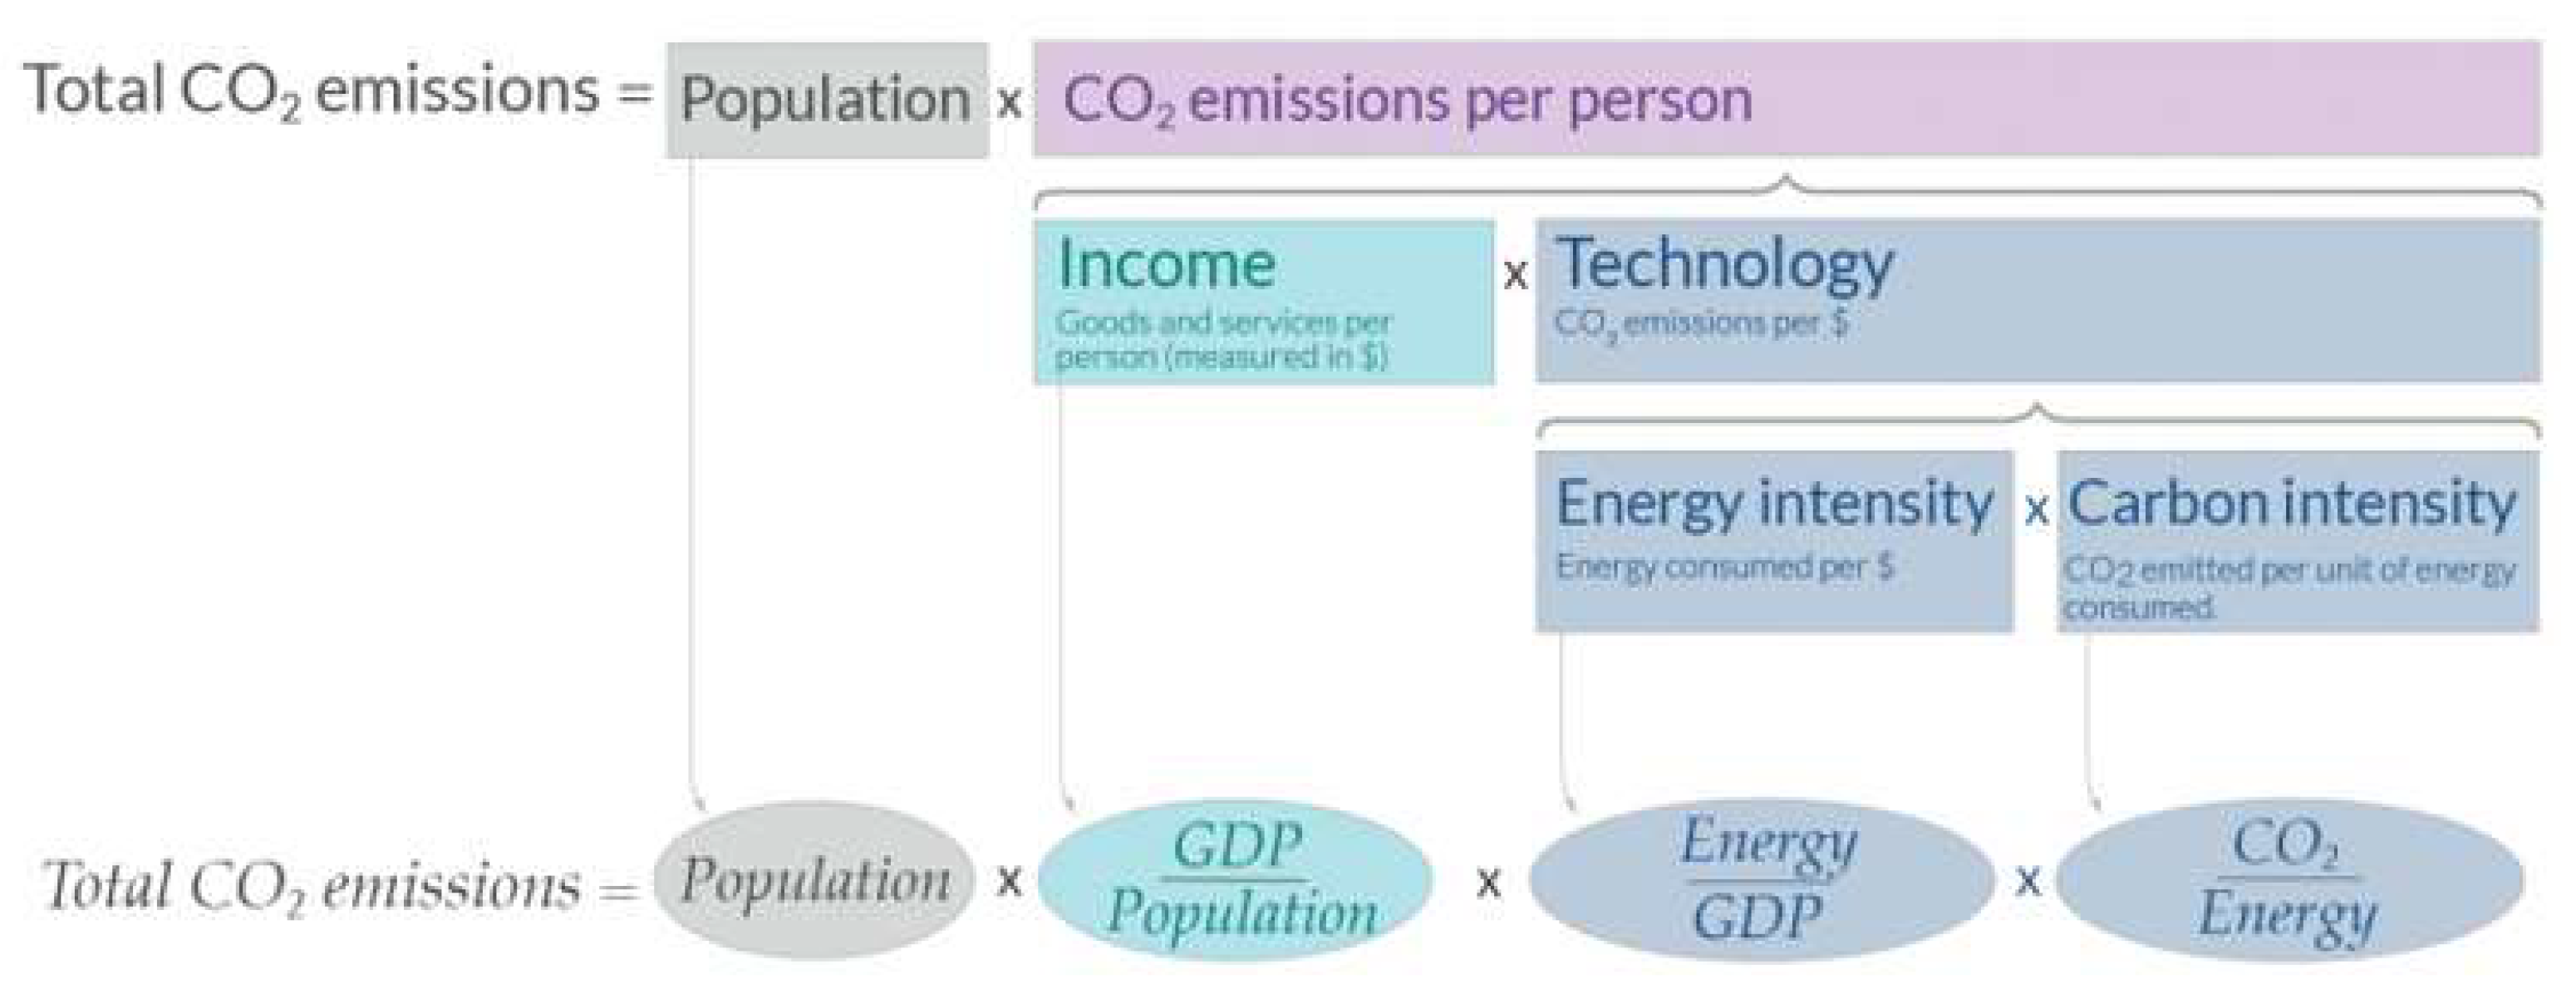
2.2. Kaya Identity

Taking into account that the Kaya Identity equation helps us understand and measure—from an economic point of view, considering population, income, energy intensity and carbon intensity—the impact of CO2 emissions from human sources, and what influence this has over the political and economic drivers, we choose to use the decomposition of the Kaya Identity parameters.
The total CO2 emissions are considered to be driven by four big and fundamental factors that, combined, lead to the Kaya Identity. Kaya Identity is an equation that puts together the four factors that lead to the total CO2 emissions, as represented in the above picture (Figure 1).
Total CO2 emissions are believed [7] to be determined by:
  • population, because every inhabitant is polluting in one way or another;
  • per capita impact, due to the fact that the larger the population is, the bigger and richer the country is and, therefore, the bigger, richer and more impactful the economy and industry are overall;
  • income, because of the fact that richer people tend to emit more CO2, as many studies show;
  • technology, which is computed as how much CO2 is emitted per dollar spent. In the case of technology, the more advanced in technology a country is, the more CO2 the technology emits. Technology can be separated into two factors, namely:
    Energy intensity, which represents the energy consumed per unit of GDP;
    Carbon Intensity, which represents the amount of CO2 emitted per unit of energy.
The Kaya Identity equation is:
Total of CO2 emissions = P × (GDP/P) × (TES/GDP) × (CO2/TES), where:
  • CO2 = CO2 emissions;
  • P = population;
  • GDP/P = GDP/population;
  • Energy intensity: TEC/GDP = Total energy consumption per GDP;
  • Carbon intensity: CO2/TEC = CO2 emissions per unit TEC
The Kaya Identity is a good mean used lately to discuss the primary forces that are impactful in describing and analyzing CO2 emissions. The trend that the world is going through means the increase in GDP per capita and population overall can be considered consequences of the increase in CO2 emissions. Furthermore, the fact that the energy matrix is still dominated by fossil fuels and the low-carbon technologies did not yet enter the market as they were forecasted to do shows that the first two factors, namely, the population and GDP per capita, impacts CO2 emissions more compared to the technology side. Moreover, the fact that the development in renewables and green hydrogen was not as fast as it was expected to be showed the fact that CO2 emissions increased overall at the world level, with some exceptions where the impact of policies, rules and regulations was notable. It is a known fact that CO2 emissions are often closely correlated with economic growth. This can be seen as being due to the impact of economic events on CO2 emissions. The best example is offered by the period 2008–2009, which shows a decrease in CO2 emissions due to the financial crisis. A more recent example is the pandemic, which, at the peak, led to a reduction of over 17% in global CO2 emissions. India, which was hit hard by the pandemic, registered a decrease in CO2 emission of about 26% [34].
As components and technological factors of the Kaya Identity equation, both energy intensity and carbon intensity are extremely important to be correctly understood, and analyzing them is mandatory.
In terms of energy intensity, a country with low energy intensity would generate more value, i.e., units of GDP, with less energy involved. In order for a country to have a lower energy intensity, the industry must be based on less energy-intensive technology and processes, and the production and industry overall should be more efficient and record fewer total losses.
In terms of carbon intensity, a country with a low carbon intensity should have fewer fossil fuels consumption included in the energy matrix. A country can reach a low level of carbon intensity if a large share in the energy matrix comes from renewable energy and other nature-friendly alternatives, or if it manages to store emissions of CO2, a procedure known as carbon sequestration. This process can be both natural, by using plants and trees, or chemical, by using certain natural materials that can sequestrate carbon. The most common such mechanism is natural charcoal, which, after getting fully filled with carbon, is planted back in the soil [35,36].
Overall, the Kaya Identity is the best means by which CO2 emissions can be assessed and analyzed. This method, compared to others, takes into consideration several factors when analyzing CO2 emissions. It also allows us to detangle growing emissions drivers and to identify possible actions that can be taken [37,38,39].
The selected countries for the analysis are the EU 28 countries—especially Germany, United Kingdom, France and Italy—which are namely GUFI countries, as well as the USA, China and India. In the above-mentioned paper, the European Union was considered as a standard in approaching and mitigating climate change issues. The GUFI countries were taken into consideration, as for only these countries were the data provided consistent. For comparison, the USA, China and India were chosen as the largest polluters in the world, as previously shown.
The Kaya Identity data used covers the period between 1990 and 2018. The year 1990 is considered a benchmark, when the Kyoto Protocol was signed and the Kaya Identity was defined. Data from 2018 on are not available or consistent, as the research of various databases shows; therefore, the analysis was limited to this year [40].
The first methodological step was to analyze the Kaya Identity decomposed for the countries that we took into consideration for our research. The next step was to identify the major trends for all four components of the Kaya Identity. For an in-depth analysis concerning the EU, only the GUFI countries were included in the analysis due to the relevance of the data.
The second methodological step was to build three possible scenarios for the US, China and India in order to see the effects of implementing the same measures as those imposed in EU countries, and to be able to predict a future cohesive plan for all climate changes. Scenarios were made based on the EU proposal on reduction of green gas emissions, increasing energy efficiency and—in our opinion, the most important—increasing the use of energy for renewable sources.

3. Results

The analysis is based on a scenario that has as a main hypothesis an alignment of the most polluting countries to the standards the EU enforces. Accordingly, there were calculated and commented on the results of complying with these requirements. Firstly, the Kaya Identity decomposition is presented and its components analyzed for the above-mentioned countries. Secondly, the scenarios of complying with the EU agenda were built.

3.1. CO2 Emissions and Drivers (Kaya Decomposition)

As stated previously, the four factors included in the Kaya Identity are Population, GDP per capita, Energy intensity and Carbon intensity. In order to analyze their impact and influence on CO2 emissions, these factors were all indexed since 1990, their definition being set in the Kyoto Protocol. This indicator accurately reflects how the selected countries managed to adapt and act toward the reduction of their emissions of CO2.
The comparative results of the analysis conducted are illustrated in the following figures. This provides the reader with better insight regarding the Kaya Identity Decomposition at the world level, and also for the EU, USA, China and India.
At the global level, the evolution of the Kaya Identity components is presented in Figure 2.
In order to accomplish the aim of the analysis, a further decomposition of this figure for the analyzed countries is necessary. Hence, in the following graphs, Figure 3a,b and Figure 4a,b, present a detailed perspective of the Kaya Identity components (for more data see Table S1). Subsequently, the situation of developed countries—i.e., the USA and EU—in comparison to the emerging economies—i.e., China and India—is illustrated
Many different trends can be observed. In terms of GDP per capita, if for the USA and the EU the trend is close to linear, for China and India the trend is exponential, proving the emerging stature of these two new major economies. While for the USA and the EU the indicator GDP per capita and CO2 emissions show different trends, one an increase and the other a decrease, in the case of China and India the situation is different. These two countries share the same trend, namely, the increase in GDP per capita is very high in comparison with the Energy intensity and Carbon intensity. These two countries should implement some measures in order to decrease EI and CI, as well as to implement measures for a sustainable increase of GDP per capita.
The living standard in China and India is much lower, compared to the USA and the EU, due to the fast and forced growth, which many specialists consider to be unnatural.
As mentioned before, the evolution for CO2 emissions and GDP per capita indicators shares the same trend, an aspect that emphasizes, again, the fact that this process is happening too fast and is harmful for the environment, as well as the population.
The only aspect that showed whether CO2 emissions have greatly increased, stayed stable or decreased is whether countries managed to reduce their carbon and energy intensity rapidly enough in order to prevent and reduce the large increase in GDP and Population. The CO2 emissions grew rapidly, the aspect that reflects those countries, which some of them did not manage to implement fast enough with regards to the schemes meant to improve the energy and carbon intensity (and, in some cases, no measures were taken).
There are clear trends emphasized by these Kaya Identity drivers as they follow. The analysis will be made according to each indicator for these four countries, as a clear comparison for each indicator.
CO2 emissions:
  • The USA increases until the tipping point, represented by the financial crisis, then it follows a decreasing trend.
  • The EU took the harshest measures and, therefore, managed to reduce this indicator, the highest decrease almost 80%.
  • China, as a result of fast and unsustainable development, increased this indicator by 456%.
  • India, due to fast industrialization and fast growth, increased this indicator by 435%.
Population:
  • The trend for the USA is an ascending one, having a notable increase with 31% in 2018, indexed to 1990.
  • The EU went through a small increase of just 7%.
  • Even if the value could have been higher due to the fast development process, China adhered to a natality limitation policy and, thus, managed to keep the natality in check, registering an increase of 23%.
  • India registered the highest increase of 45%.
GDP per capita or GDP per population:
  • The USA had an increase in this indicator, but with a big decrease after the financial crisis point.
  • The EU followed the same trend, as it was also influenced by the financial crisis.
  • China increased this indicator’s value by almost 1063% due to rapid growth.
  • India increased this by 361% due to high natality rates, as well as rapid growth.
Energy intensity (TES/GDP):
  • The USA registered a decrease of almost 59%.
  • The EU registered a decrease of almost 60%.
  • China registered a decrease of 28%, not because of the actual TES reduction, but rather because of the exponential growth in GDP.
  • India registered a decrease of up to 45%, not because of the actual TES reduction, but rather because of exponential growth in GDP.
Carbon intensity: ESCII (CO2/TES):
  • The USA registered a decrease of up to 88%.
  • The EU registered a decrease of up to 80%.
  • China registered an increase of up to 125% due to the increase in CO2. This is hardly influenced by the rapid industrialization process, as well as the unnaturally fast globalization China went through. China had to keep up with the world, and, for this, the country sacrificed the environment in favor of development.
  • India registered an increase of up to 145% due to the increase in CO2. Exactly as in the case of China, this increase is due to the exponential increase in CO2, which is, again, a consequence of the fast and unnatural growth and development of the country.
In order to have an even clearer and more in-depth image for the EU situation, additional figures were added: Figure 5a,b and Figure 6a,b (for more data see Table S2). The intention was to analyze all the state members of the European Union. However, as the World Energy Balance does not report the EU as a whole, Germany, the United Kingdom, France and Italy (GUFI), which are the most important components of this balance within the European Union, were considered. Moreover, for these countries, consistent data were found.
Summarizing the analysis, we can observe the following.
The CO2 indicator confirms again the trend analyzed before.
  • In the case of China and India, this indicator registered an increase above the registered world level, meaning that the values for 2018 indexed to 1990 are 456 and 435, compared to the world level of 163. These two countries did not manage to reduce their emissions under the level of emissions registered in 1990.
  • The EU policies that are responsible for reducing the level of CO2 are illustrated, as well, in the descending trend. Namely, in 2018 compared to 1990, EU28 decreased from 100 to 78, 100 being reference level. The UK decreased from 100 to 64, Germany from 100 to 74, France from 100 to 88 and Italy from 100 to 81. All these show the descending trend, which is due to the rigorous policies implemented by the EU.
Population
  • In the period 1990–2018, the global population increased by almost 44%.
  • The population in India surpassed the global trend, registering an increase of 55%.
  • In the case of the USA, the increase was 31%. This trend was given as well from the increase in migration. The EU registered an average increase of 7%.
  • Notable, as well, is the UK and France increase above the EU’s average level of migration.
GDP per capita
  • This indicator registered a constant increase at the world level, with 77% more in 2018 compared to 1990.
  • China has the highest increase in this indicator, the value in 2018 being 10.63 times higher than 1990. This is due to the very strong development path China followed in the past 30 years, which placed China second in the world in terms of GDP.
  • India registered an increase in this indicator. In 2018, the value is 3.61 times higher compared to the value in 1990. This is similar to China’s case, the result of the robust growing period of the Indian economy. Its GDP is comparable now to the UK and France, which India surpassed in the ranking recently. In the case of other countries, there are no massive fluctuations, as the trend is almost linear.
Energy intensity (TES/GDP)
  • The trend in this case is clear: all countries are on a descending trend. While GDP per capita increased, this indicator decreased exactly due to the increase in GDP in some cases or, in other cases, due to the policies directed to reducing the TES indicator.
  • In the case of China, the value in 2018 decreased 3.57 times compared to 1990. The decrease is two times higher than the decrease registered at the world level. This is due to the increase of GDP, not to TES reduction.
  • The EU and the USA have almost the same value for this indicator, which emphasizes again that these two are highly preoccupied with reducing emissions and reaching a higher level of energy efficiency.
Carbon intensity: ESCII (CO2/TES)
  • At the world level, this indicator had some fluctuations, but not anything notable, as the level stayed almost the same in 2018 compared to 1990.
  • Countries such as China and India registered the largest increases, namely 25% and 45%, respectively, in 2018 compared to 1990. India is the only country that is on a fast-ascending trend, without any sign of reducing the rise in the following period. India is, as well, one of the countries that did not introduce any thorough measures in terms of CO2 emissions, but rather introduced some newer standards that act in the same way, but at a much lower speed.
  • The USA and the EU decreased with 12% and 20%, respectively, which shows that with the right measures, standards and policies, it is possible for even a developed country to reduce its emissions.
It can be observed that Germany and UK are the ones that give the trend, while Italy and France are in second position, with not such a spectacular development. It is also notable that Italy and France managed to reduce emissions only after 2009. Italy, in comparison with the other three countries, faces a descending trend from 2001 to 2014 in terms of GDP, while the other three countries from the EU have a more linear trend in terms of GDP. With regard to energy intensity, the trend suffered variations and does not follow the same nearly linear pattern, as is the case for the other three countries.

3.2. What If the Top 3 Polluters Would Apply the EU Policy Regarding Climate Change?

In the 2020 package that was based on legislation enacted in 2009 and first set by the EU leaders in 2007, the EU propose a 20% cut in greenhouse gas emissions compared to the level registered in 1990; 20% improvement in energy efficiency; and 20% of EU energy from renewables. For 2030, the proposal was adapted, and the EU proposes at least 40% cuts in greenhouse gas emissions compared to the level registered in 1990; at least a 32% share for renewable energy; and at least 32.5% improvement in energy efficiency [20]
Over the years, the EU changed and adapted the previously set targets by adopting policies, rules and regulations for a wider horizon up until 2050, the middle of the century. In 2050, the end goal of all the policies adopted by the EU is to be climate-neutral; if not, to help rebalance nature and the carbon cycle in both natural and chemical ways. In this empirical and hypothetical study, the idea of China, India and the USA following the EU examples and using the EU policy in order to move towards a carbon neutral economy is analyzed.

3.2.1. The EU Proposal for an Internal Reduction of the Green Gas Emissions

The EU proposes an internal reduction of the green gas emissions at the whole EU economy with 20% up to 2020 and 40% up to 2030 compared to 1990 (Table 1). The EU proposes as well to reach a green gas emission level of 0% inside the Union up to 2050. The EU proposes to the other governments to apply a global reduction of green gas emissions of 50% up to 2050. The EU proposes to the other countries, as well, a reduction of green gas emissions of 30% up to 2020. The evolution of CO2 emissions from fuel combustion emphasizes that the UE managed to reach its target, some countries reached the target for 2020 earlier than the deadline in 2017 and seven of them, Romania included, even achieved the target for 2030. This shows that the targets are not too hard to achieve with the right mixture of policies, rules and regulations.
If other economies would follow the EU target for greenhouse gases, the hypothetical calculation takes into account the following aspects:
  • The CO2 emissions of the EU, USA, China and India will weigh the same in the total CO2 emissions for the world as in 2018, namely 59.4%.
  • Events such as the pandemic, Brexit or others will not be taken into consideration either. (Still, it is worth mentioning that for the first time in ages, the percentage of CO2 emissions for the world decreased from 33 Mt to 31 Mt due to the pandemic, which forced the big industries to reduce production capacity)
  • For the EU, we applied the 40% target because the 20% target in terms of reduction was achieved already in 2018 for the majority of countries.
  • For the USA, we applied the same reduction percentage, 40%, compared to 1990. This percentage is ambitious because in 2018, the emissions were 2.46% higher compared to 1990. Hypothetically, the reduction of 10% was applied for 2020 compared to 1990. The data are not available online later than 2018.
  • For China, we maintained the same value in 2020 as in 2018. The aim for China will be 20% due to the fact that China is a country still developing at a very fast pace, and a percentage of 40% would not be possible.
  • For India, we maintained in 2020 the same value as in 2018. Exactly as in China’s case, the target decrease will be 20% due to the context of India’s economy.
  • Due to the fact that data for 2020 are not available online, in order to realize the forecast, these adjustments have been made. As the historical data show, the fluctuations in 2 years are not exponential, and for these reasons, these adjustments were made.
After the empirical study, the first notable aspect is that CO2 emissions from fuel combustion will increase in 2030 compared to 1990, with only 21% compared to 63.35%, which represents the increase in 2018 compared to 1990 (Table 2). The decrease will be in consequence of 26% compared to 2018, from the value of 33.513 Mt to 24.855 Mt. This refers to the world, which will reduce the emissions to almost the amount in 1990, before Kyoto. This will represent exactly the trend to preserve the ozone layer and the environment and to stop the further deterioration of the planet.

3.2.2. The EU Proposal to Grow Energy Efficiency

The EU proposes that the energy efficiency at the EU level expressed in primary and secondary energy consumption will reach the set target of 32.5% for 2030 (Table 3). As a consequence, the consumption of primary energy sources will need to be reduced by 26%, and the total energy consumption will need to be reduced by 20% compared to the values registered in 2005. We will make a more pessimistic option compared to the 20% for the EU compared to 2005. Accordingly:
  • Due to the fact that the world energy balance [40] does not report the EU as a whole, we considered EU-GUFI as a reference. For 2030, the percentage of EU-GUFI, USA, China and India in the total world will be the same as in 2018 in terms of Total Final Consumption, namely, accounting for 49.11% in the world.
  • For the EU and the USA, the target set will be a decrease of 20% in 2030 compared to 2005.
  • For China and India, we set a decrease, as well, of 20% in 2030 compared to 2018 due to the fact that total final consumption almost doubled in the period 2005–2018. Due to these factors, the 20% reduction in 2030 compared to 2005 would be impossible to achieve; thus, we considered it as a reference year for 2018’s level. After doing the calculations, we obtained a value for total final consumption of 8.009.043 ktoe. Taking into account that the proportion of CO2 emissions in 2018 will be comparable to 2030, the result would be a decrease of CO2 emissions and total final consumption of 19% in 2030 compared to 2019, generating 27.009 Mt CO2, a value which will be very close to the one obtained in 2005.

3.2.3. The EU Proposal to Increase Energy from Renewable Sources

The EU proposes that the percentage of energy coming from renewable sources in total final consumption of the EU should be at least 32% for 2030. Thus, for the measures taken in order to increase energy efficiency and decrease total final consumption, we add a constant increase of the percentage of renewable energy to the total final consumption and reach 20% in 2030 (Table 4).
The result after the computation shows that the world could reduce CO2 emissions by 28% in 2030 compared to 2018 and from 33.513 Mt to 24.189 Mt CO2. In the computation, due to the fact that the data are not available for the EU as a whole, we considered again EU-GUFI. In the world computation, we kept the percentage of 49.11% in 2018 for total final consumption for the four entities into the world. We applied a scenario a little more optimistic due to the fact that there are more and more innovations in the renewable field. Therefore, we considered what the EU proposed, namely that 32% of total final consumption should be from renewable energy. In this case, in 2030, we could reach a value of CO2 emissions comparable to the one registered in 1990, registering a decrease of 39% compared to 2018 and from 33.513 Mt to 20.561 Mt CO2.
Considering that there is a significant gap between developed and developing countries, when it comes to how climate changes are reflected, the selection of the countries in our analysis is meant to investigate these differences, without forgetting that these countries are the most polluting ones. This significant gap is, on one side, a result of the differences in the development and implementation of climate change policies, and on the other side, the outcome of the disparity in measuring and interpreting the data collected, both in developed countries and developing ones.

4. Conclusions

First, the scenarios regarding the alignment of the EU, USA, China and India to implement sustainable policies that will lead to a reduction of CO2 emissions show an increase of only 21% compared to 1990, an aspect which is acceptable given the high industrialization.
Then, the results of applying measures that will limit and reduce the energy consumption and increase the consumption of renewable energy leads to the conclusion that the world could manage to return to the level it had in 1990, an aspect that is actually sustainable because there are several alternatives in terms of renewable energy. A solar panel nowadays is very potent compared to previous years, and the same stands for wind turbines. Even if the big industries will not easily accept this idea, in the long run, it will lead to less expensive industries because, nowadays, energy produced by a solar pannel or a wind turbine is three times cheaper compared to energy produced by conventional sources.
To conclude, it is obvious that the USA, the EU, China and India are the main drivers that could help reduce or stop climate change. A common endeavor will be necessary, effort which must start from an increase in energy efficiency. This increase will be determined from such factors as a reduction in energy consumption, together with the increase in energy coming from renewable sources. This will be followed by the decarbonization of the industrial sectors, which are the main energy-consuming sectors. In other words, alternatives must be found to make everything more energy efficient, starting from tourism, industry and so on. There are many such possibilities, namely the solar energy fields, the wind turbine farms or the sustainable tourism initiatives. A further solution will come from a sustainable infrastructure. Such are the incentives for electric cars. Also, several air companies managed to reduce their carbon footprint by replacing fuel with more eco-friendly alternatives, and big companies introduced making everything less consuming and more sustainable to their agenda.
There are, as well, several methods to store the carbon, and as many specialists consider, this can be the alternative. The world was formed with CO2 stored in the Earth, and many specialists believe that this is exactly how we can save the Earth, by returning the CO2-producing sources back where they once belonged.
A straightforward conclusion could be drawn that the most important economies, such as the EU, USA, China and India, are the ones that must act together in stopping the further deterioration of the world. Climate change is not just a threat for the environment itself, but also a threat for the national security of the polluting countries. China, the USA and India, as the top carbon emitters, have realised lately that their national security is tied to climate change because they witnessed floods, fires and extreme weather conditions. All these are forcing them to orient themselves toward a market-oriented emission abatement, either unilaterally or in coalition with others. There are a lot of divergences among them, but this is a field where they should cooperate immediately. These three countries, along with the EU, being dominant importers of goods and services, can and should influence low-carbon activities worldwide, and this could be done without jeopardizing the economic development.
As a final remark, we must state that this incipient analysis of the Kaya Identity equation offers the basis for future development of a model that could better predict the effects of all the major measures that could be implemented in order to decrease the negative impact of pollution and climate change issues. For this, an analysis based on the Climate Change Performance Index, which was recently developed as a weighted average of GHG Emissions (40% of overall score), Renewable Energy (20% of overall score), Energy Use (20% of overall score) and Climate Policy (20% of overall score), could be conducted to extend the scope of our future work.

Supplementary Materials

The following supporting information can be downloaded at: https://www.mdpi.com/article/10.3390/su15010565/s1, Table S1 Kaya Identity Decomposition–y-2-y- evolution, 1990–2018. Table S2 Kaya Identity Decomposition–y-2-y- evolution, 1990–2018, France, Italy, Germany and UK.

Author Contributions

Conceptualization, M.D.R., D.E.B., F.I.R. and A.V.R.; Formal analysis, M.D.R., D.E.B., F.I.R., A.V.R. and S.G.A.; Methodology, D.E.B. and S.G.A.; Resources, M.D.R., D.E.B. and F.I.R.; Supervision, S.G.A.; Validation, M.D.R., D.E.B., F.I.R., A.V.R. and S.G.A.; Visualization, A.V.R.; Writing—Original draft, M.D.R.; Writing—Review & editing, D.E.B. and S.G.A. All authors have read and agreed to the published version of the manuscript.

Funding

This research received no external funding.

Institutional Review Board Statement

Not applicable.

Informed Consent Statement

Not applicable.

Data Availability Statement

Data are available in a publicly accessible repository that does not issue DOIs. Publicly available datasets were analyzed in this study. This data can be found here: https://ourworldindata.org/grapher/kaya-identity-co2 (accessed on 12 May 2022).

Conflicts of Interest

The authors declare no conflict of interest.

References

  1. Huaman, R.N.E.; Xiu Jun, T. Energy related CO2 emissions and the progress on CCS projects: A review. Renew. Sustain. Energy Rev. 2014, 31, 368–385. [Google Scholar] [CrossRef]
  2. Robson, B.A.; MacDonell, S.; Ayala, A.; Bolch, T.; Nielsen, T.R.; Vivero, S. Glacier and rock glacier changes since the 1950s in the La Laguna catchment, Chile. Cryosphere 2022, 16, 647–665. [Google Scholar] [CrossRef]
  3. NASA. Available online: https://www.nasa.gov/vision/earth/environment/Sudden_Climate_Change.html (accessed on 12 May 2022).
  4. Emission Gap Report 2019. Available online: https://www.unep.org/resources/emissions-gap-report-2019 (accessed on 12 May 2022).
  5. Schipper, L.; Meyers, S.; Steiner, R. Energy Efficiency and Human Activity: Past Trends, Future Prospects; No. 1; Cambridge University Press: Cambridge, UK, 1992. [Google Scholar]
  6. Nakicenovic, N.; Alcamo, J.; Davis, G.; de Vries, B.; Fenhann, J.; Gaffin, S.; Gregory, K.; Grubler, A.; Jung, T.Y.; Kram, T.; et al. IPCC Special Report on Emissions Scenarios. 2000. Available online: https://escholarship.org/uc/item/9sz5p22f (accessed on 17 May 2022).
  7. P’erez-Lombard, L.; Ortiz, J.; Velazquez, D. Revisiting energy efficiency fundamentals. Energy Effic. 2013, 6, 239–254. [Google Scholar] [CrossRef]
  8. Ehrlich, P.R.; Holdren, J.P. A bulletin dialogue on “the closing circle”. Bull. At. Sci. 1972, 28, 16–27. [Google Scholar] [CrossRef]
  9. IPCC. Climate Change 2014: Mitigation of Climate Change. Contribution of Working Group III to the Fifth Assessment Report of the Intergovernmental Panel on Climate Change; Cambridge University Press: Cambridge, UK; New York, NY, USA, 2014; pp. 351–412. [Google Scholar]
  10. Allen, M.R.; Frame, D.J.; Huntingford, C.; Jones, C.D.; Lowe, J.A.; Meinshausen, M.; Meinshausen, N. Warming caused by cumulative carbon emissions towards the trillionth tonne. Nature 2009, 458, 1163–1166. [Google Scholar] [CrossRef] [PubMed]
  11. Niu, S.; Ding, Y.; Niu, Y.; Li, Y.; Luo, G. Economic growth, energy conservation and emissions reduction: A comparative analysis based on panel data for 8 Asian-Pacific countries. Energy Policy 2011, 39, 2121–2131. [Google Scholar] [CrossRef]
  12. Wu, Y.; Luo, J.; Shen, L.; Skitmore, M. The Effects of an Energy Use Paradigm Shift on Carbon Emissions: A Simulation Study. Sustainability 2018, 10, 1639. [Google Scholar] [CrossRef] [Green Version]
  13. Climate Change News, 17 May 2021. Available online: https://climatetrade.com/which-countries-are-the-worlds-biggest-carbon-polluters/ (accessed on 12 May 2022).
  14. Climate Change Programme. Available online: https://climate.ec.europa.eu/eu-action/european-climate-change-programme_en (accessed on 17 May 2022).
  15. United Nation Climate Change, Kyoto Protocol—Targets for the First Commitment Period. Available online: https://unfccc.int/process-and-meetings/the-kyoto-protocol/what-is-the-kyoto-protocol/kyoto-protocol-targets-for-the-first-commitment-period?fbclid=IwAR1Vgj8jO1747TlfpQE6rYD-Qha9m9YD20L2wFIwlRzFmc03s8SR2rZUjfM (accessed on 17 May 2022).
  16. National Atmospheric Emission Inventory, Overview of Greenhouse Gases. Available online: https://naei.beis.gov.uk/overview/ghg-overview (accessed on 2 March 2022).
  17. United Nation Climate Change, Doha Amendment to the Kyoto Protocol. Available online: https://unfccc.int/process/the-kyoto-protocol/the-doha-amendment?gclid=Cj0KCQiAnNacBhDvARIsABnDa6952zGXzCgukYUoyzQFgNdNXEvpnpBW4vl_LZnEyFv098-ETT5RJO0aAtWSEALw_wcB (accessed on 2 March 2022).
  18. Climate Change Programme, 2nd Report. Available online: https://climate.ec.europa.eu/system/files/2016-11/second_eccp_report_en.pdf (accessed on 17 May 2022).
  19. European Commission, (2020) Climate & Package. Available online: https://ec.europa.eu/clima/policies/strategies/2020_en (accessed on 14 May 2022).
  20. European Commission, (2030) Climate & Package. Available online: https://ec.europa.eu/clima/policies/strategies/2030_en (accessed on 14 May 2022).
  21. European Commission, 2050 Long-Term Strategy. Available online: https://climate.ec.europa.eu/eu-action/climate-strategies-targets/2050-long-term-strategy_en (accessed on 14 May 2022).
  22. Regulation (EU) 2018/1999 of the European Parliament and of the Council of 11 December 2018 on the Governance of the Energy Union and Climate Action. Available online: https://eur-lex.europa.eu/legal-content/EN/TXT/PDF/?uri=CELEX:32018R1999&from=EN (accessed on 15 May 2022).
  23. Directive 2009/28/EC of the European Parliament and of the Council. Available online: https://eur-lex.europa.eu/LexUriServ/LexUriServ.do?uri=OJ:L:2009:140:0016:0062:en:PDF (accessed on 15 May 2022).
  24. Directive 2012/27/EU. Available online: https://eur-lex.europa.eu/LexUriServ/LexUriServ.do?uri=OJ:L:2012:315:0001:0056:en:PDF (accessed on 15 May 2022).
  25. Directive (EU) 2018/2001. Available online: https://eur-lex.europa.eu/legal-content/EN/TXT/PDF/?uri=CELEX:32018L2001 (accessed on 15 May 2022).
  26. Directive 2009/31/EC of the European Parliament and of the Council on the Geological Storage of Carbon Dioxide (So-Called “CCS Directive”). Available online: https://eur-lex.europa.eu/LexUriServ/LexUriServ.do?uri=OJ:L:2009:140:0114:0135:EN:PDF (accessed on 15 May 2022).
  27. Green Deal. Available online: https://ec.europa.eu/info/strategy/priorities-2019-2024/european-green-deal_en (accessed on 15 May 2022).
  28. Paris Agreement. Available online: https://climate.ec.europa.eu/eu-action/international-action-climate-change/climate-negotiations/paris-agreement_en (accessed on 17 May 2022).
  29. European Climate Law. Available online: https://climate.ec.europa.eu/eu-action/european-green-deal/european-climate-law_en (accessed on 17 May 2022).
  30. European Climate Pact. Available online: https://climate.ec.europa.eu/eu-action/european-green-deal/european-climate-pact_en (accessed on 17 May 2022).
  31. 2030 Climate Target Plan. Available online: https://climate.ec.europa.eu/eu-action/european-green-deal/2030-climate-target-plan_en (accessed on 17 May 2022).
  32. EU Strategy on Climate Adaptation. Available online: https://climate.ec.europa.eu/eu-action/adaptation-climate-change/eu-adaptation-strategy_en (accessed on 17 May 2022).
  33. Kaya Identity Drivers of CO2 Emission, Our World in Data. Available online: https://ourworldindata.org/ (accessed on 17 May 2022).
  34. Ray, R.L.; Singh, V.P.; Singh, S.K.; Acharya, B.S.; He, Y. What is the impact of COVID-19 pandemic on global carbon emissions? Sci. Total Environ. 2022, 816, 151503. [Google Scholar] [CrossRef] [PubMed]
  35. What is Carbon Intensity? Available online: https://www.nationalgrideso.com/future-energy/net-zero-explained/what-carbon-intensity (accessed on 19 May 2022).
  36. Linnenluecke, M. What Is a Low Carbon Economy? Available online: https://lighthouse.mq.edu.au/article/please-explain/march-2019/what-is-a-low-carbon-ecomony (accessed on 19 May 2022).
  37. Lenaerts, K.; Tagliapietra, S.; Wolff, G.B. The Global Quest for Green Growth: An Economic Policy Perspective. Sustainability 2022, 14, 5555. [Google Scholar] [CrossRef]
  38. O’Mahony, T. Decomposition of Ireland’s carbon emissions from 1990 to 2010: An extended Kaya identity. Energy Policy 2013, 56, 573–581. [Google Scholar]
  39. Mavromatidis, G.; Orehounig, K.; Richner, P.; Carmeliet, J. A strategy for reducing CO2 emissions from buildings with the Kaya identity—A Swiss energy system analysis and a case study. Energy Policy 2016, 88, 343–354. [Google Scholar] [CrossRef]
  40. IEA. World_Energy_Balances_Highlights_2020_Edition.xls. Available online: https://www.iea.org/data-and-statistics/data-product/world-energy-balances-highlights (accessed on 19 May 2022).
Figure 1. Kaya Identity equation. Source: https://ourworldindata.org/grapher/kaya-identity-co2 [33].
Sustainability 15 00565 g001
Figure 2. The evolution of world Kaya Identity by components (1990–2018). Source: own calculation based on data provided by https://ourworldindata.org/ [33].
Sustainability 15 00565 g002
Figure 3. The evolution of the USA (a) and the EU (b) Kaya Identity by components (1990–2018). Source: own calculation based on data provided by https://ourworldindata.org/ [33].
Sustainability 15 00565 g003
Figure 4. The evolution of PR of China (a) and India (b) Kaya Identity by components (1990–2018). Source: own calculation based on data provided by https://ourworldindata.org/ [33].
Sustainability 15 00565 g004
Figure 5. The evolution of Germany (a) and UK (b) Kaya Identity by components (1990–2018). Source: own calculation based on data provided by https://ourworldindata.org/ [33].
Sustainability 15 00565 g005
Figure 6. The evolution of France (a) and Italy (b) Kaya Identity by components (1990–2018). Source: own calculation based on data provided by https://ourworldindata.org/ [33].
Sustainability 15 00565 g006
Table 1. CO2 * emission reported to 1990.
Country199020052005
Vs.
1990
20162016
Vs.
1990
20172017
Vs.
1990
20182018
Vs.
1990
EU 28402439222.54%320620.33%321420.13%315121.7%
EU—GUFI224421473.49%173921.84%171023.12%166924.96%
India5301075−102.78%2071−290.64%2191−313.27%2308−335.33%
P.R.of China20895408−158.87%9054−333.47%9246−342.61%9528−356.15%
USA48035703−18.74%4838−0.74%47610.87%4921−2.46%
World20,51627,078−31.98%32,375−57.80%32,837−60.06%33,513−63.35%
* CO2 emissions from fuel combustion (Mtonne). Source: own calculation based on data provided by IEA [40].
Table 2. Scenario for 2030—CO2 emissions from fuel combustion.
Target EU20% 40%
Country199020182018 vs.
1990
2020 2030
EU-284024315121.70%3219Less 20% vs. 19902415Less 40% vs. 1990
EU-GUFI2224166924.96%1780Less 20% vs. 19901335Less 40% vs. 1990
India5302308−335.33%2308Eq 20181846Less 20% vs. 1990
China20899528−356.15%9528Eq 20187623Less 20% vs. 1990
USA48034921−2,46%4323Less 10% vs. 19902882Less 40% vs. 1990
World20,51633,513−63.35%32,623−59%24,855−21%
Source: own calculation based on data provided by IEA [32].
Table 3. Scenario for 2030—the forecast of total final consumption in regard to the energy efficiency policy.
CountryFlow1990200520182018 vs. 20052030Target 20%
EU-GUFITotal final consumption (ktoe)635,559689,227621,86410%551,382less 20% vs. 2005
IndiaTotal final consumption (ktoe)243,053358,130606,580−69%485,264less 20% vs. 2018
ChinaTotal final consumption (ktoe)657,5941,227,1142,057,666−68%1,646,132less 20% vs. 2018
United StatesTotal final consumption (ktoe)1,293,5561,563,0791,594,130−2%1,250,463less 20% vs. 2005
WorldTotal final consumption (ktoe)6,267,1777,979,8519,937,703−25%8,009,04319%
WorldCO2 emissions from fuel combustion
(Mtonne)
20,51627,07833,513−24%27,00919%
Source: own calculation based on data provided by IEA [40].
Table 4. Scenario for 2030—energy from renewable sources in total final consumption.
CountryFlow19902005201820302030 Optimistic
EU-GUFIRenew Total final consumption (ktoe)14,27724,73241,745110,276110,276
EU-GUFITotal final consumption (ktoe)635,559689,227621,864551,382551,382
EU-GUFI% Renew in Total final consumption2.253.596.712032
IndiaRenew Total final consumption (ktoe)130,344152,693156,56197,05397,053
IndiaTotal final consumption (ktoe)243,053358,130606,580485,264485,264
India% Renew in Total final consumption53.6342.6425.812032
ChinaRenew Total final consumption (ktoe)200,477171,124113,861329,226329,226
ChinaTotal final consumption (ktoe)657,5941,227,1142,057,6661,646,1321,646,132
China% Renew in Total final consumption30.4913.955.532032
United StatesRenew Total final consumption (ktoe)22,93356,12389,897250,093250,093
United StatesTotal final consumption (ktoe)1,293,5561,563,0791,594,1301,250,4631,250,463
United States% Renew in Total final consumption1.773.595.642032
WorldRenew Total final consumption (ktoe)794,342952,9891,060,6971,601,8092,562,894
WorldTotal final consumption (ktoe)6,267,1777,979,8519,937,7038,009,0438,009,043
World% Renew in Total final consumption12.6711.9410.672032
WorldCO2 emissions from fuel combustion (Mt)20,51627,07833,51324,18920,561
Source: own calculation based on data provided by IEA [32].
Disclaimer/Publisher’s Note: The statements, opinions and data contained in all publications are solely those of the individual author(s) and contributor(s) and not of MDPI and/or the editor(s). MDPI and/or the editor(s) disclaim responsibility for any injury to people or property resulting from any ideas, methods, instructions or products referred to in the content.

