Article

Cost Analysis of Implementing In-Pipe Hydro Turbine in the United Arab Emirates Water Network

1
Department of Mechanical and Industrial Engineering, School of Engineering, American University of Ras Al Khaimah, Ras Al Khaimah 10021, United Arab Emirates
2
Department of Mechanical Engineering, School of Engineering, The University of Jordan, Amman 11942, Jordan
3
Institute for Technical Combustion, Leibniz Universität Hannover, 30823 Garbsen, Germany
4
Mechanical and Maintenance Engineering Department, German Jordanian University, Amman 35247, Jordan
*
Author to whom correspondence should be addressed.
Sustainability 2023, 15(1), 651; https://doi.org/10.3390/su15010651
Submission received: 29 September 2022 / Revised: 19 December 2022 / Accepted: 22 December 2022 / Published: 30 December 2022

Abstract

:
Water transmission lines have potential reserved energy, which is usually lost. Therefore, targeting this clean energy to produce electricity to power up the auxiliaries and utilities of water plants or consumers is financially and environmentally beneficial. This paper aims to investigate the feasibility of installing an inline hydropower system in an existing transmission water pipe. It analyzes the feasibility of implementing a mini-hydropower plant in the transmission line of Liwa’s reservoir in the UAE. The maximum possible power harvested is 218.175 kW at the given water flow rate and net head. The payback period and the return on investment are analyzed based on different scenarios related to capital investment, operation, maintenance cost, and plant capacity factor. It is found that the payback period ranges between one to six years, where the return on investment can be as high as 85%. Furthermore, the expected CO2 emissions saving for this project is calculated to be between 395 and 1939 tons per year.

1. Introduction

Electricity demand is increasing rapidly due to population growth and economic expansion [1]. There has been an annual growth rate of 8–9% in renewable energy since 2010 [2]. Thus, the world is looking for the most sustainable solutions to achieve a high level of quality power generation. The utilization of multiple renewable resources can support the grid, increase the sustainability of the electricity infrastructure, and enhance the energy security of the country [3,4,5],
Hydropower plays a vital role in power sectors in many countries where the natural flow of water such as dams and rivers is available. Hydroelectric power is generated from the water flow caused by pumping the water, gravity, or other factors. The unused energy in the water pipelines is a source of hydropower that can be economically and environmentally beneficial [6]. This can be achieved by installing hydropower turbines in line with the water transmission and distribution lines where the kinetic energy can be captured through the residual water pressure. The movement of water will cause the turbine to rotate, which will in turn rotate the generator, resulting in an electromechanical conversion. The rotation of the generator converts mechanical energy into electrical energy. The amount of the generated energy can be determined by the water flow, the size of the turbines, and many other factors [7].
Small hydropower plants and in-pipe hydropower plants offer a new way to generate power and reduce pipeline losses. A hydro-turbine installed at high pressure points can recover dissipated energy, producing power and reducing CO2 emissions at the same time [8]. Water pipeline systems differ in pressure, water flow rate, water head, and pipe diameter. It is therefore necessary for the in-pipe hydropower plants to be designed specifically for each water system, taking into account the appropriate hydro turbine [9].
Hydropower turbines installed in pipes around the world are in line with the concept of the water-energy nexus, which relates the energy generated by water to the energy required to collect, move, store, and dispose of water [10,11]. In the UK and Ireland, a study on installing hydropower turbines at wastewater treatment plants was carried out to determine the costs of seasonal flow fluctuations, turbine selection, and financial implications [12]. In Morocco, a case study was analyzed to maximize the net present value based on the size of the hydropower plant. In order to reduce implementation costs, the existing infrastructure of the water distribution system is being used [9]. A study in Saudi Arabia discussed a theoretical application to retrieve energy from the hotspots of the residual pressure of water transmission pipelines. The study proved the ability to produce 2 MW based on the available flow rate and the head [8]. Another study concerning quantifying the potential energy recovery in pressurized irrigation networks in Spain validated that installing traditional hydropower turbines in the water transmission pipelines is effective. The reason behind that is the water network has a steady flow almost all year round, as opposed to the irrigation system. The methodology used started with identifying the hotspots. It was followed by categorizing the velocities. Finally, the power generation and the electromechanical cost were related to turbine type selection, and the payback period ranged from 6 to 14 years depending on the water velocity scenarios [13]. A study by Meirelles Lima et al. [14] explored the optimization of water supply networks by using pump turbines to recover energy. Researchers have implemented various in-pipe hydro-turbine designs to study gravity-fed vertical pipelines. Microhydro turbines or pumps as turbines (PATs) have gained increasing attention as an alternative to dissipating excess energy from freshwater supply pipelines [15]. In Hong Kong, micro hydropower generation from the water supply system in high-rise buildings [16,17] was investigated, designed, and analyzed for application using in-pipe hydro-turbines for gravity-fed vertical water channels or pipelines for an Optimized Nearly Zero Energy Building. For valley cities and mountain areas with high-altitude water tanks, the in-pipe hydro system is very efficient [18]. The fluctuation and inconsistency of in-pipe hydro systems require a storage system [19].
An energy performance model for pump-driven turbines was developed by Liu et al. [20] as part of their ongoing research on hydropower generation. In Nigeria, four micro-hydropower plants were compared based on their performance characteristics: Turgo, Cross Flow, Francis, and Kaplan turbines [21]. Another study in Switzerland has discussed the Five Blade Tubular Propeller (5BTP) turbine. It has estimated the potential for hydropower in urban water supply networks by optimizing the power production in identified ideal spots and maximizing economic value [22]. Based on numerical and analytical analysis, Sani [23] designed a Pelton turbine impeller to recover part of the input power; exploring different types of turbines and designs revealed that the turbine selection could influence the ultimate profitability of a small hydro scheme, driven mainly by the original capital cost and the operation and maintenance costs. In the United States, utilizing existing wastewater and water infrastructure to develop distributed hydropower systems was analyzed [24] even the United Arab Emirates (UAE) is an energy exporter; the diversity of the local energy mix and shifting toward more sustainable resources is important for its energy security and sustainability [25,26]. The UAE energy strategy aims to increase the number of sustainable infrastructures in the total energy mix by up to 50% [27,28]). The strategy’s target is to combine various types of clean energy such as renewable and nuclear to meet the UAE’s economic and environmental goals by 2050. Therefore, the country is increasing the availability of green resources such as solar power. In addition, in-pipe hydropower technology could be implemented in the UAE’s transmission lines to enhance energy resource diversity. Small hydroelectric turbines could be installed in several locations, such as near pumping stations, in pipes with a slope, or near desalination plants.
In this context, this work quantifies the hydropower potential in a pressurized transmission water pipe with high flow rates and pressures based on an original design. In-pipe hydro-turbines are also evaluated for their economic feasibility. The feasibility of introducing a small hydropower plant into the existing water grid is analyzed through a cost analysis study. The payback period and the return on investment are analyzed based on different scenarios related to capital investment, operation and maintenance costs, and plant capacity factors.

2. Materials and Methods

Liwa Reservoir in Abu Dhabi, UAE, is the world’s most prominent artificial desalinated underground water reserve. It contains about 26 billion liters and it can provide about 100 million liters of water per day to the country’s residents. It stores the desalinated water produced in AlShuweihat Desalination Plant. The water is recovered, recharged, and observed through 315 wells. The paper examines an existing water transmission line in Abu Dhabi to study the feasibility of introducing in-pipe turbines. In-pipe hydropower plants are proposed to be installed in the vertical pipes used to fill Liwa reservoir. Figure 1 illustrates the network used in this study, where the distance is measured to be around 160 km. The desalinated water is transferred from the water desalination unit at 0 m above sea level to the Liwa reservoir at 130 m. The pumping stations used to overcome the elevation difference and the minor and major losses are marked as dots on the network. The transportation of the desalinated water is via large pipes with an approximate diameter of 1 m. The water is then pumped into 80 m underground aquifer through vertical perforated pipes [29]. In order to recharge the aquifer, desalinated water percolates underground through semi-perforated underground pipes using gravity alone as a driving force. The study presents a cost analysis for implementing in-pipe hydro turbine with six different scenarios based on three investment sizes and two values for operation and maintenance cost. The payback period and rate of return are calculated for the different scenarios. The effect of the capacity factor on the payback period was also analyzed.

2.1. In-Pipe Hydropower Plant Capacity

The head is an essential factor involved in the total generated power. The net head (HNet) is a result of the difference between the gross head (HG), which is the vertical distance from the reservoir upper to the turbine location, and the head losses (HL):
H N e t = H G H L
The head loss is calculated using Hazen–Williams equation
H L = 10.67   L   Q C 1.852 D 4.87
L is the main pipe segment length (m), C is Hazen–Williams Coefficient (dimensionless) and assumed as 140 for Carbon Steel Pipes, D is the pipe diameter (m), and Q is the volumetric flow rate (m3/s), which can be calculated as follows:
Q = V R e s t f u l l
V R e s is the reservoir volume (m3); t f u l l is the time required to fill up the reservoir (s). The kinetic energy is converted into mechanical energy by rotating the turbine and to electrical energy by the connected generator. The hydraulic power equation is expressed to be:
P H y d = ρ g Q H N e t
ρ is the water density (kg/m3), g is the gravitational acceleration (m/s2), Q is the water flow rate (m3/s), while the generation capacity can be calculated using the following:
P E l e c = ρ g Q H N e t η t η g
P E l e c is the generated electrical power, and η t   η g ,respectively, are the turbine and generator efficiency.

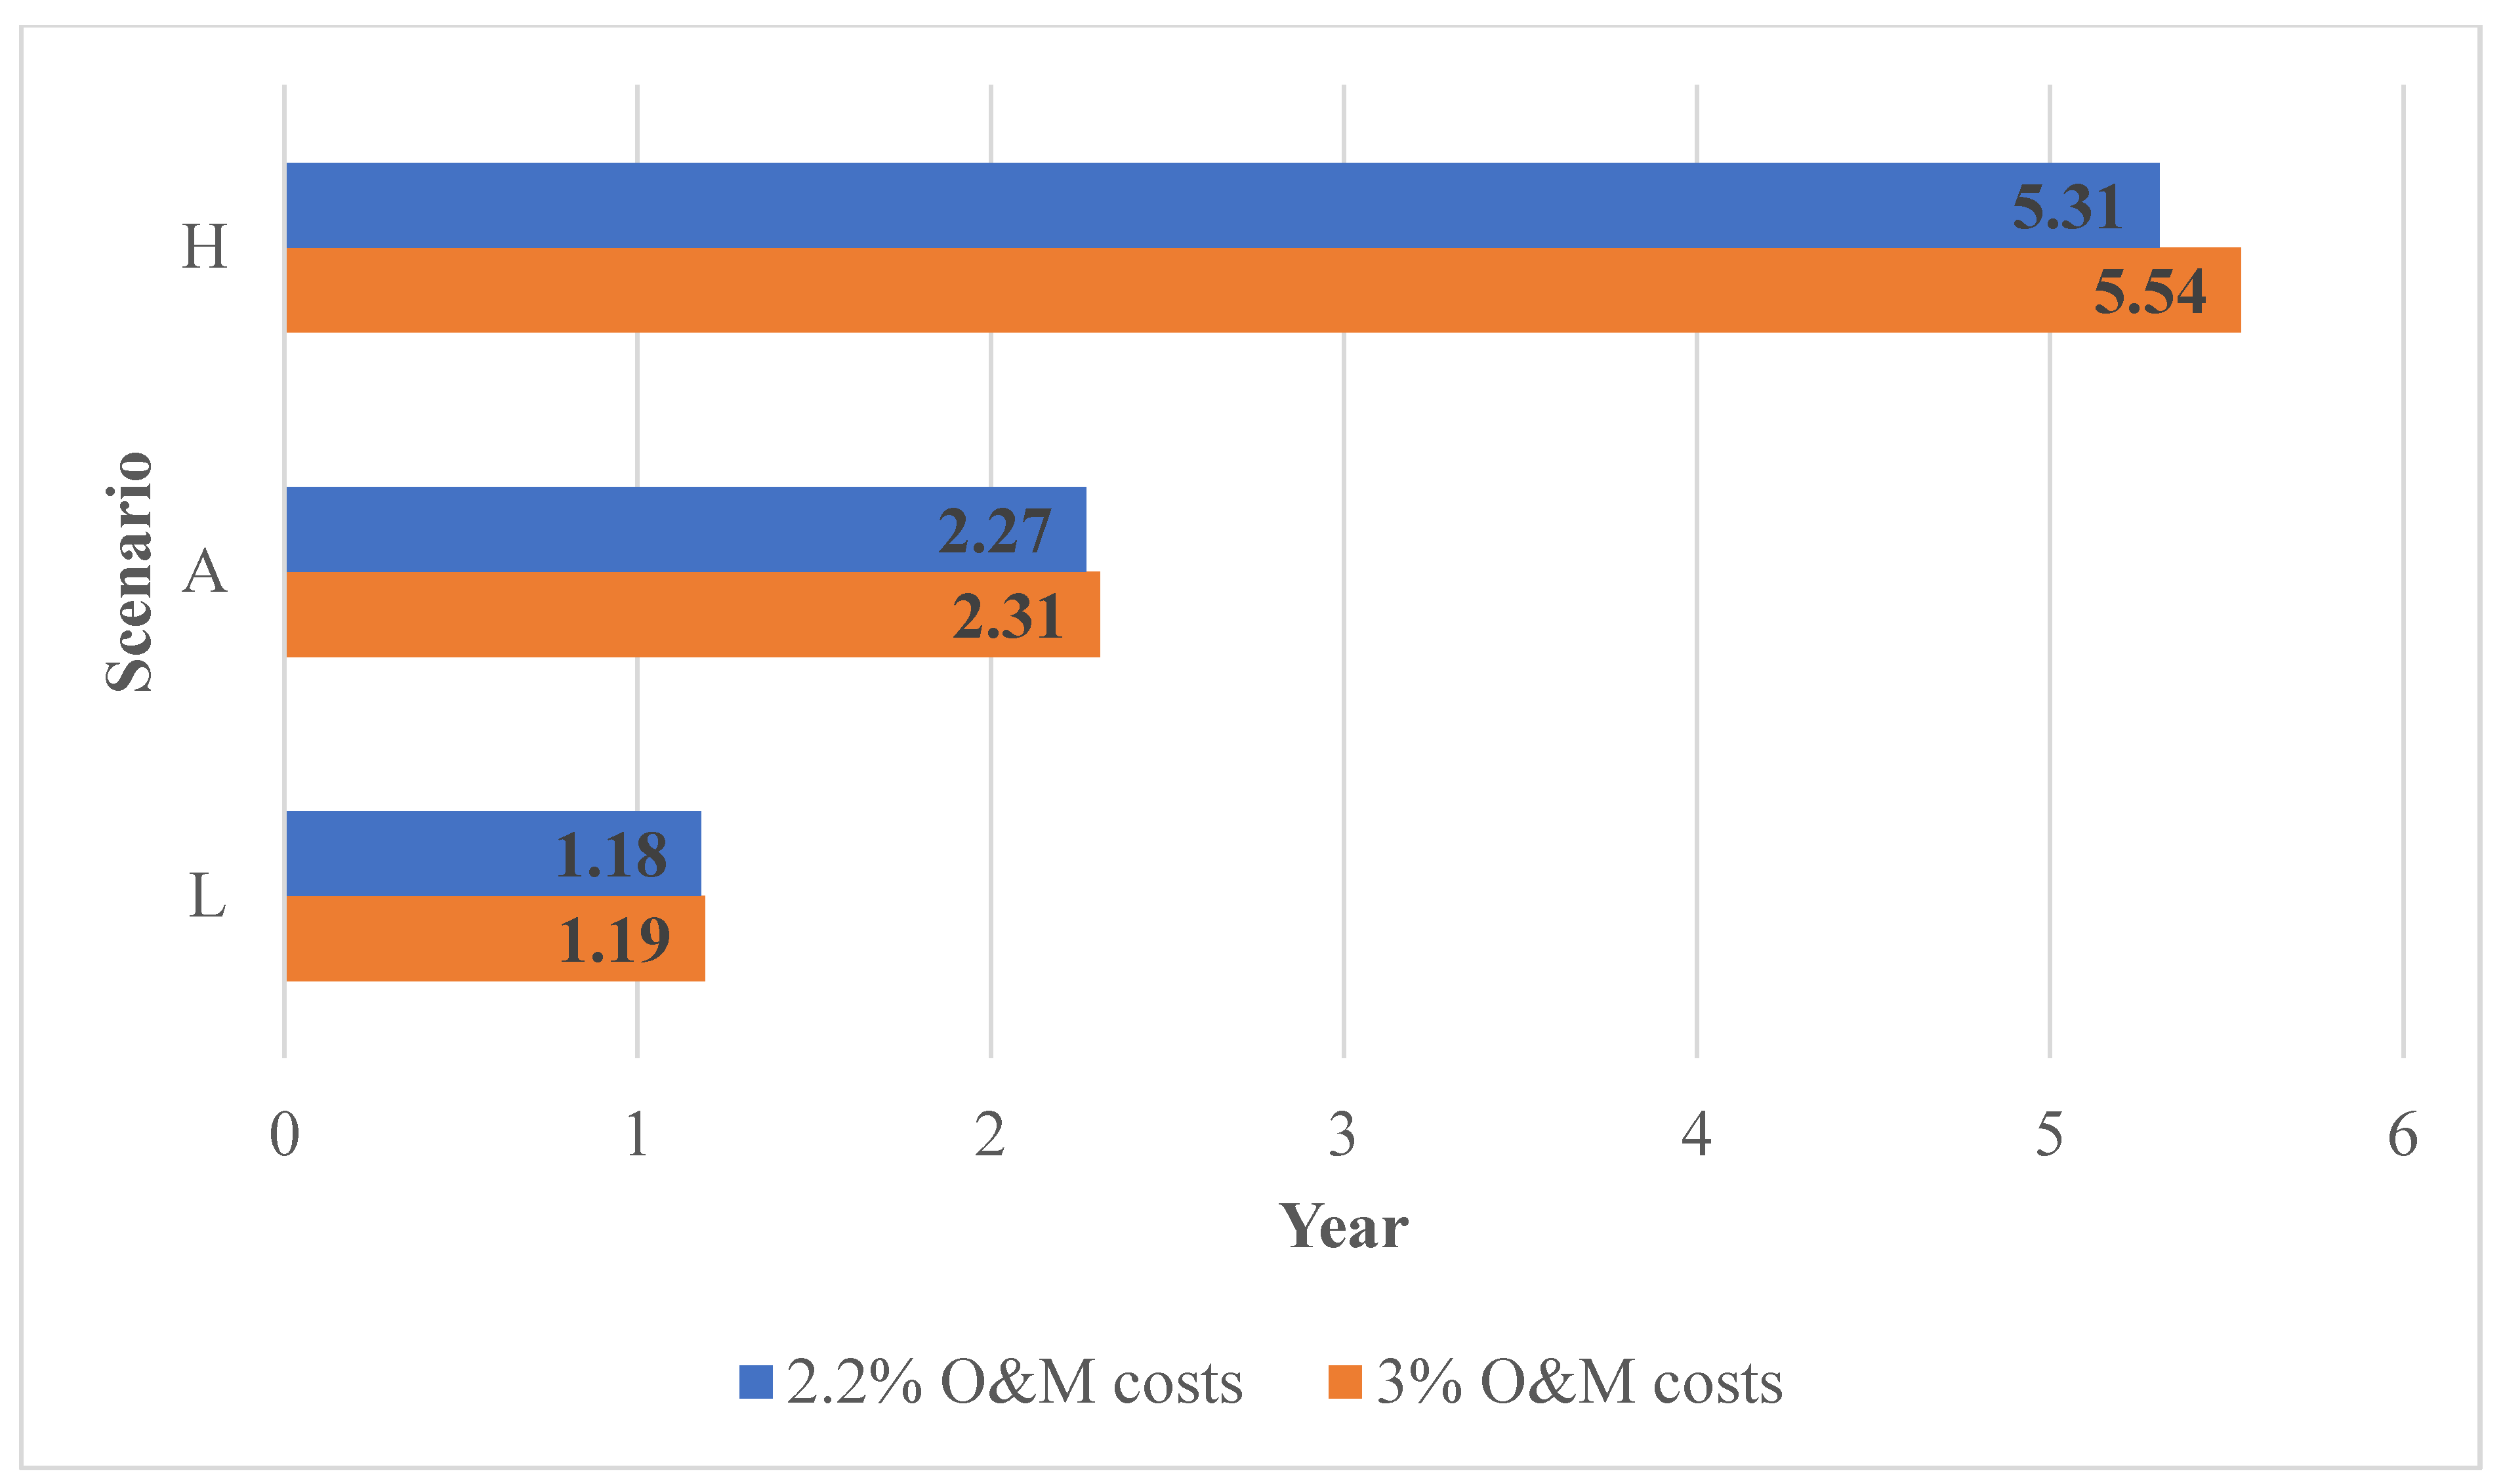
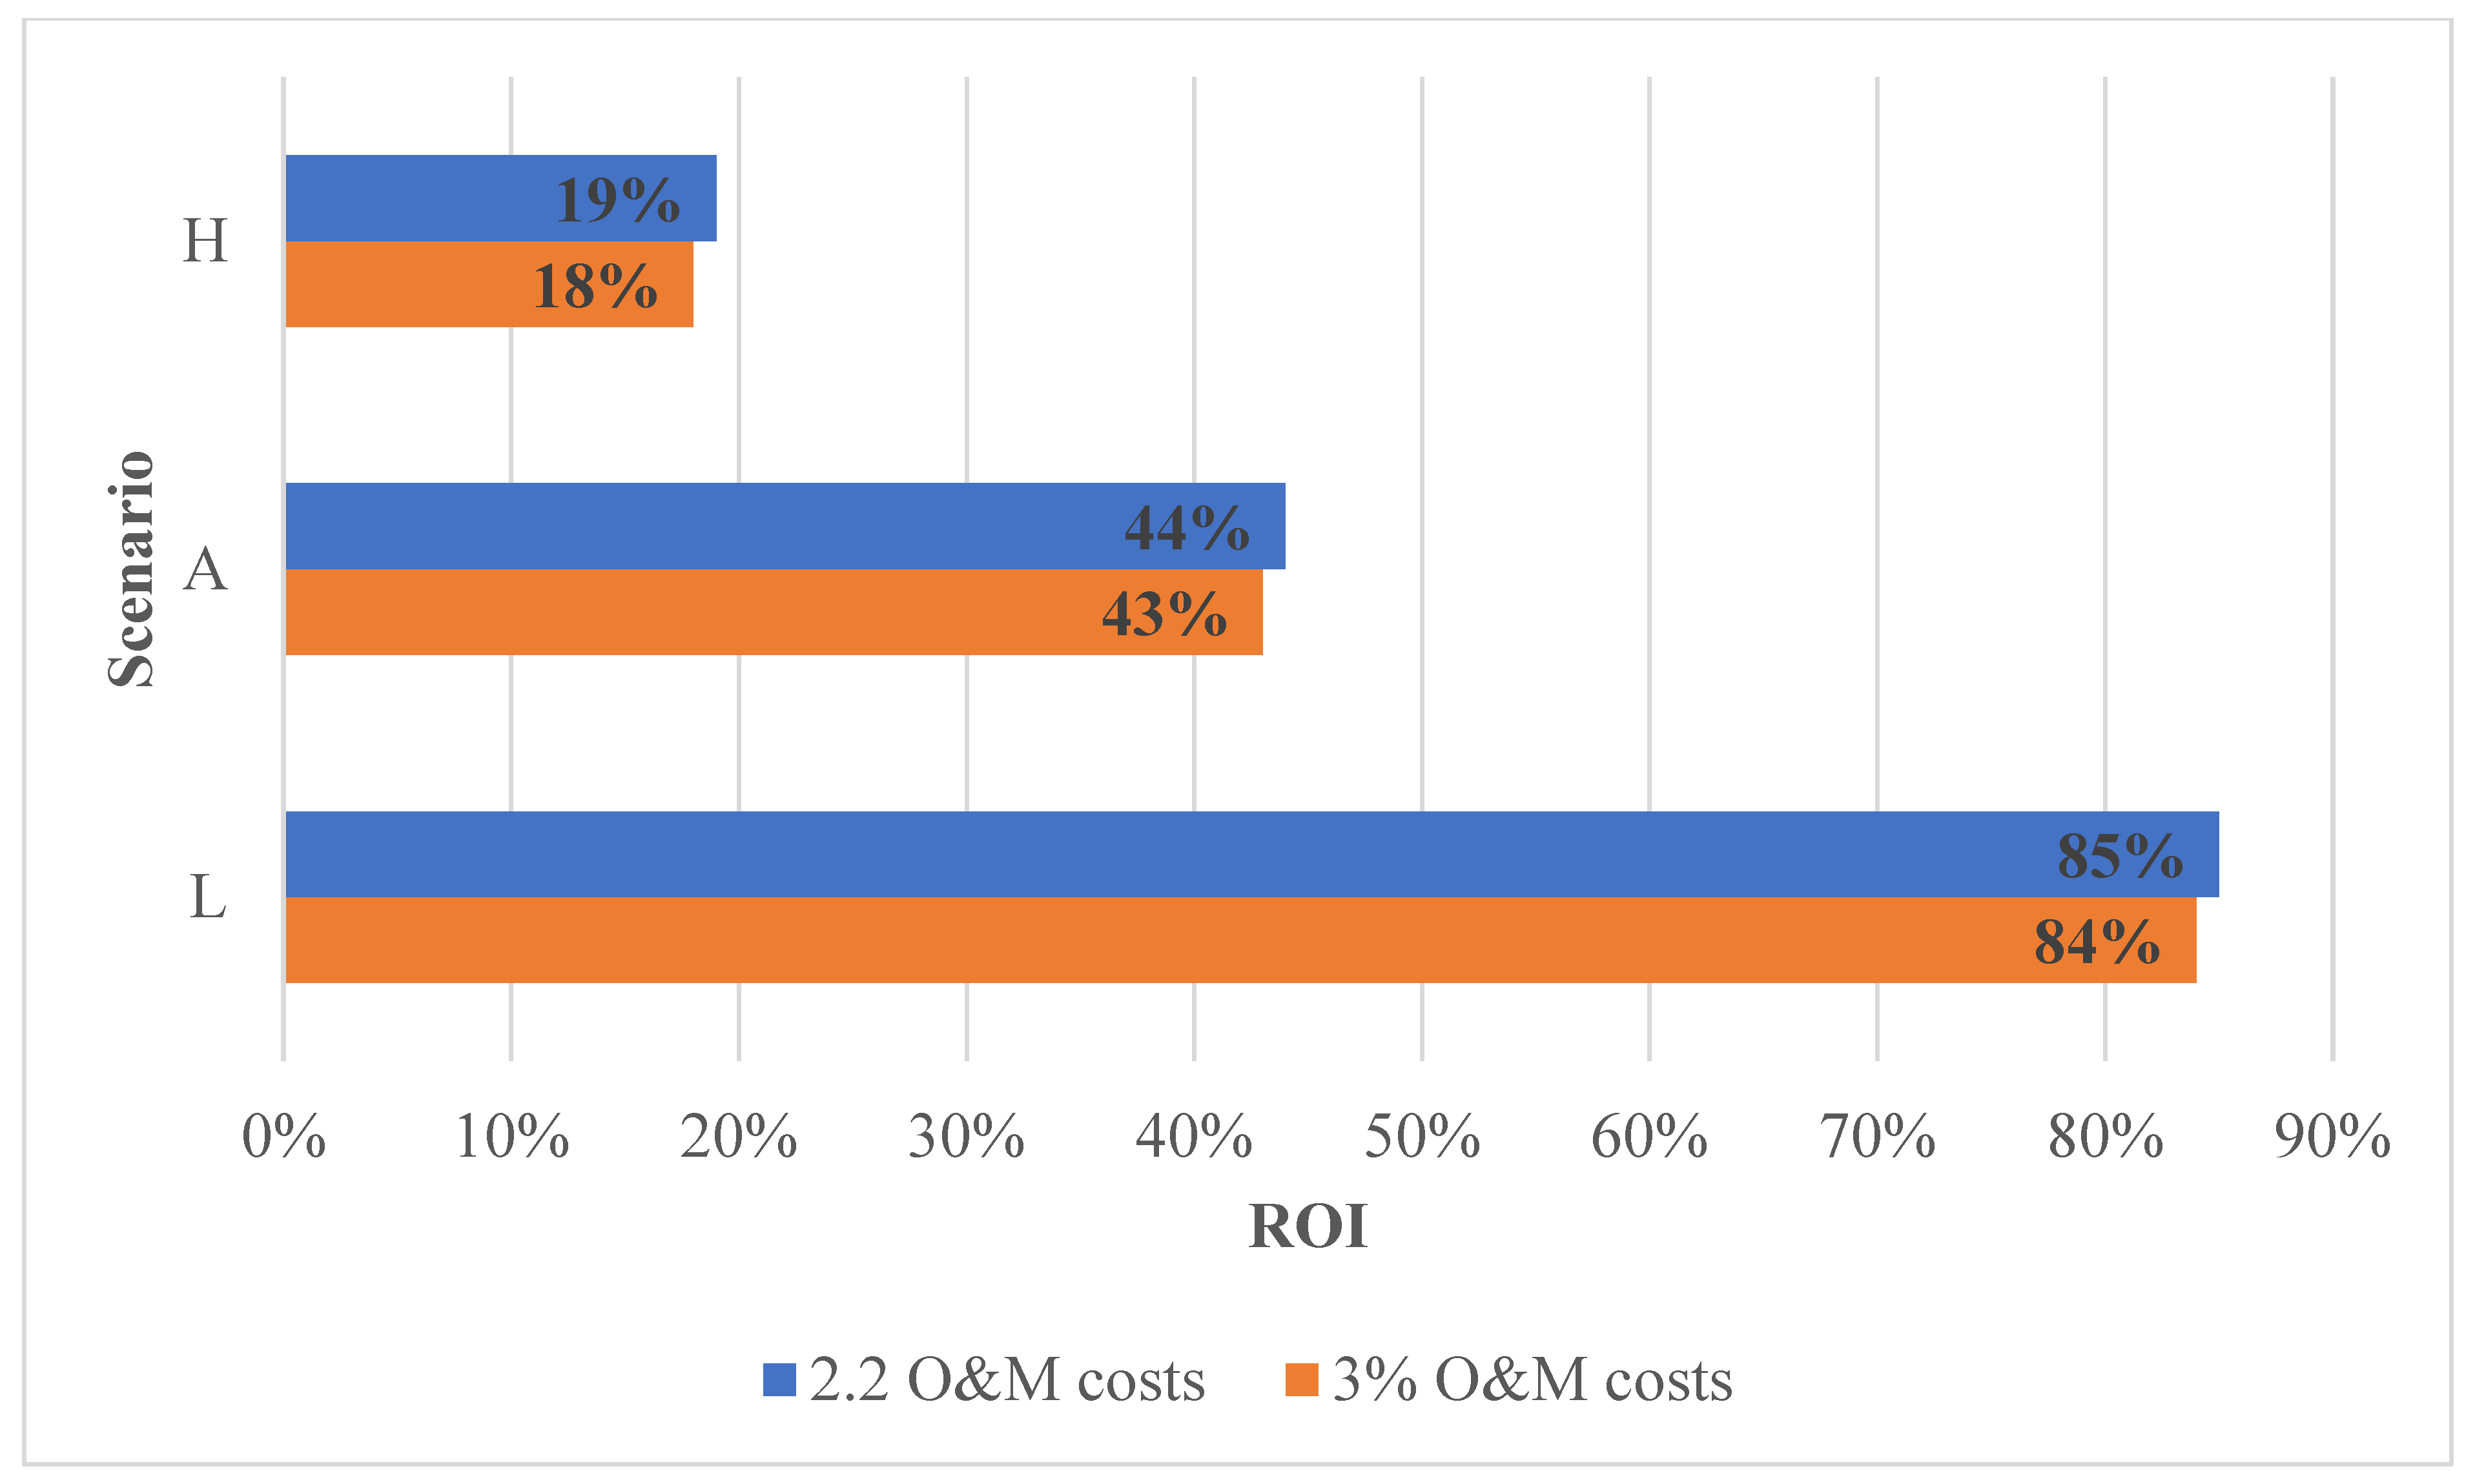
2.2. Economic Analysis

The cost analysis of hydropower projects differs from one location to another due to the site’s characteristics and the project’s requirements. There are two significant components of hydropower plant project installation costs: the electromechanical equipment costs and the civil work needed for the project. The electromechanical cost covers the equipment such as turbines, generators, transformers, cabling, and the controlling system. The civil work includes the mini-hydro power plant construction, grid connection, engineering procurement, construction, and development costs. According to the international renewable energy agency (IRENA), the total installation cost of the hydropower plant project varies between USD/kW 807 and USD/kW 3334 as shown in Table 1 [30].
The operation and maintenance (O and M) costs vary between 1% and 4% of the total investment cost of hydropower projects. The International Energy Agency (IEA) suggests that small projects (<10 MW) have operation and maintenance costs in the range of 2.2% to 3% of the total investment.
The payback period (PBP) and the return on investment (ROI) play a crucial role in selecting and measuring the success of any project. They can be found through the following equations:
R O I = P R I n v e s t m e n t   C o s t
P B P = I n v e s t m e n t   C o s t P R
PR is yearly profit of the project and can be found by:
P R = A R O & M
O and M are the operation and maintenance costs and AR is the annual revenue and is calculated by:
AR = E   ×   ECT
E stands for Annual Max Output Energy, and ECT is the electricity sold to the grid tariff. It is assumed that the selling tariff is the same as the buying from grid tariff, which equals 0.294 AED (0.08 USD) [31].
In this work, the payback period was calculated for three scenarios: low-investment project (L1); average investment project (L2); and high-investment project (L3). In addition, each scenario had two cases with different O and M costs (2.2% and 3.0%). The scenarios are presented in Table 2.

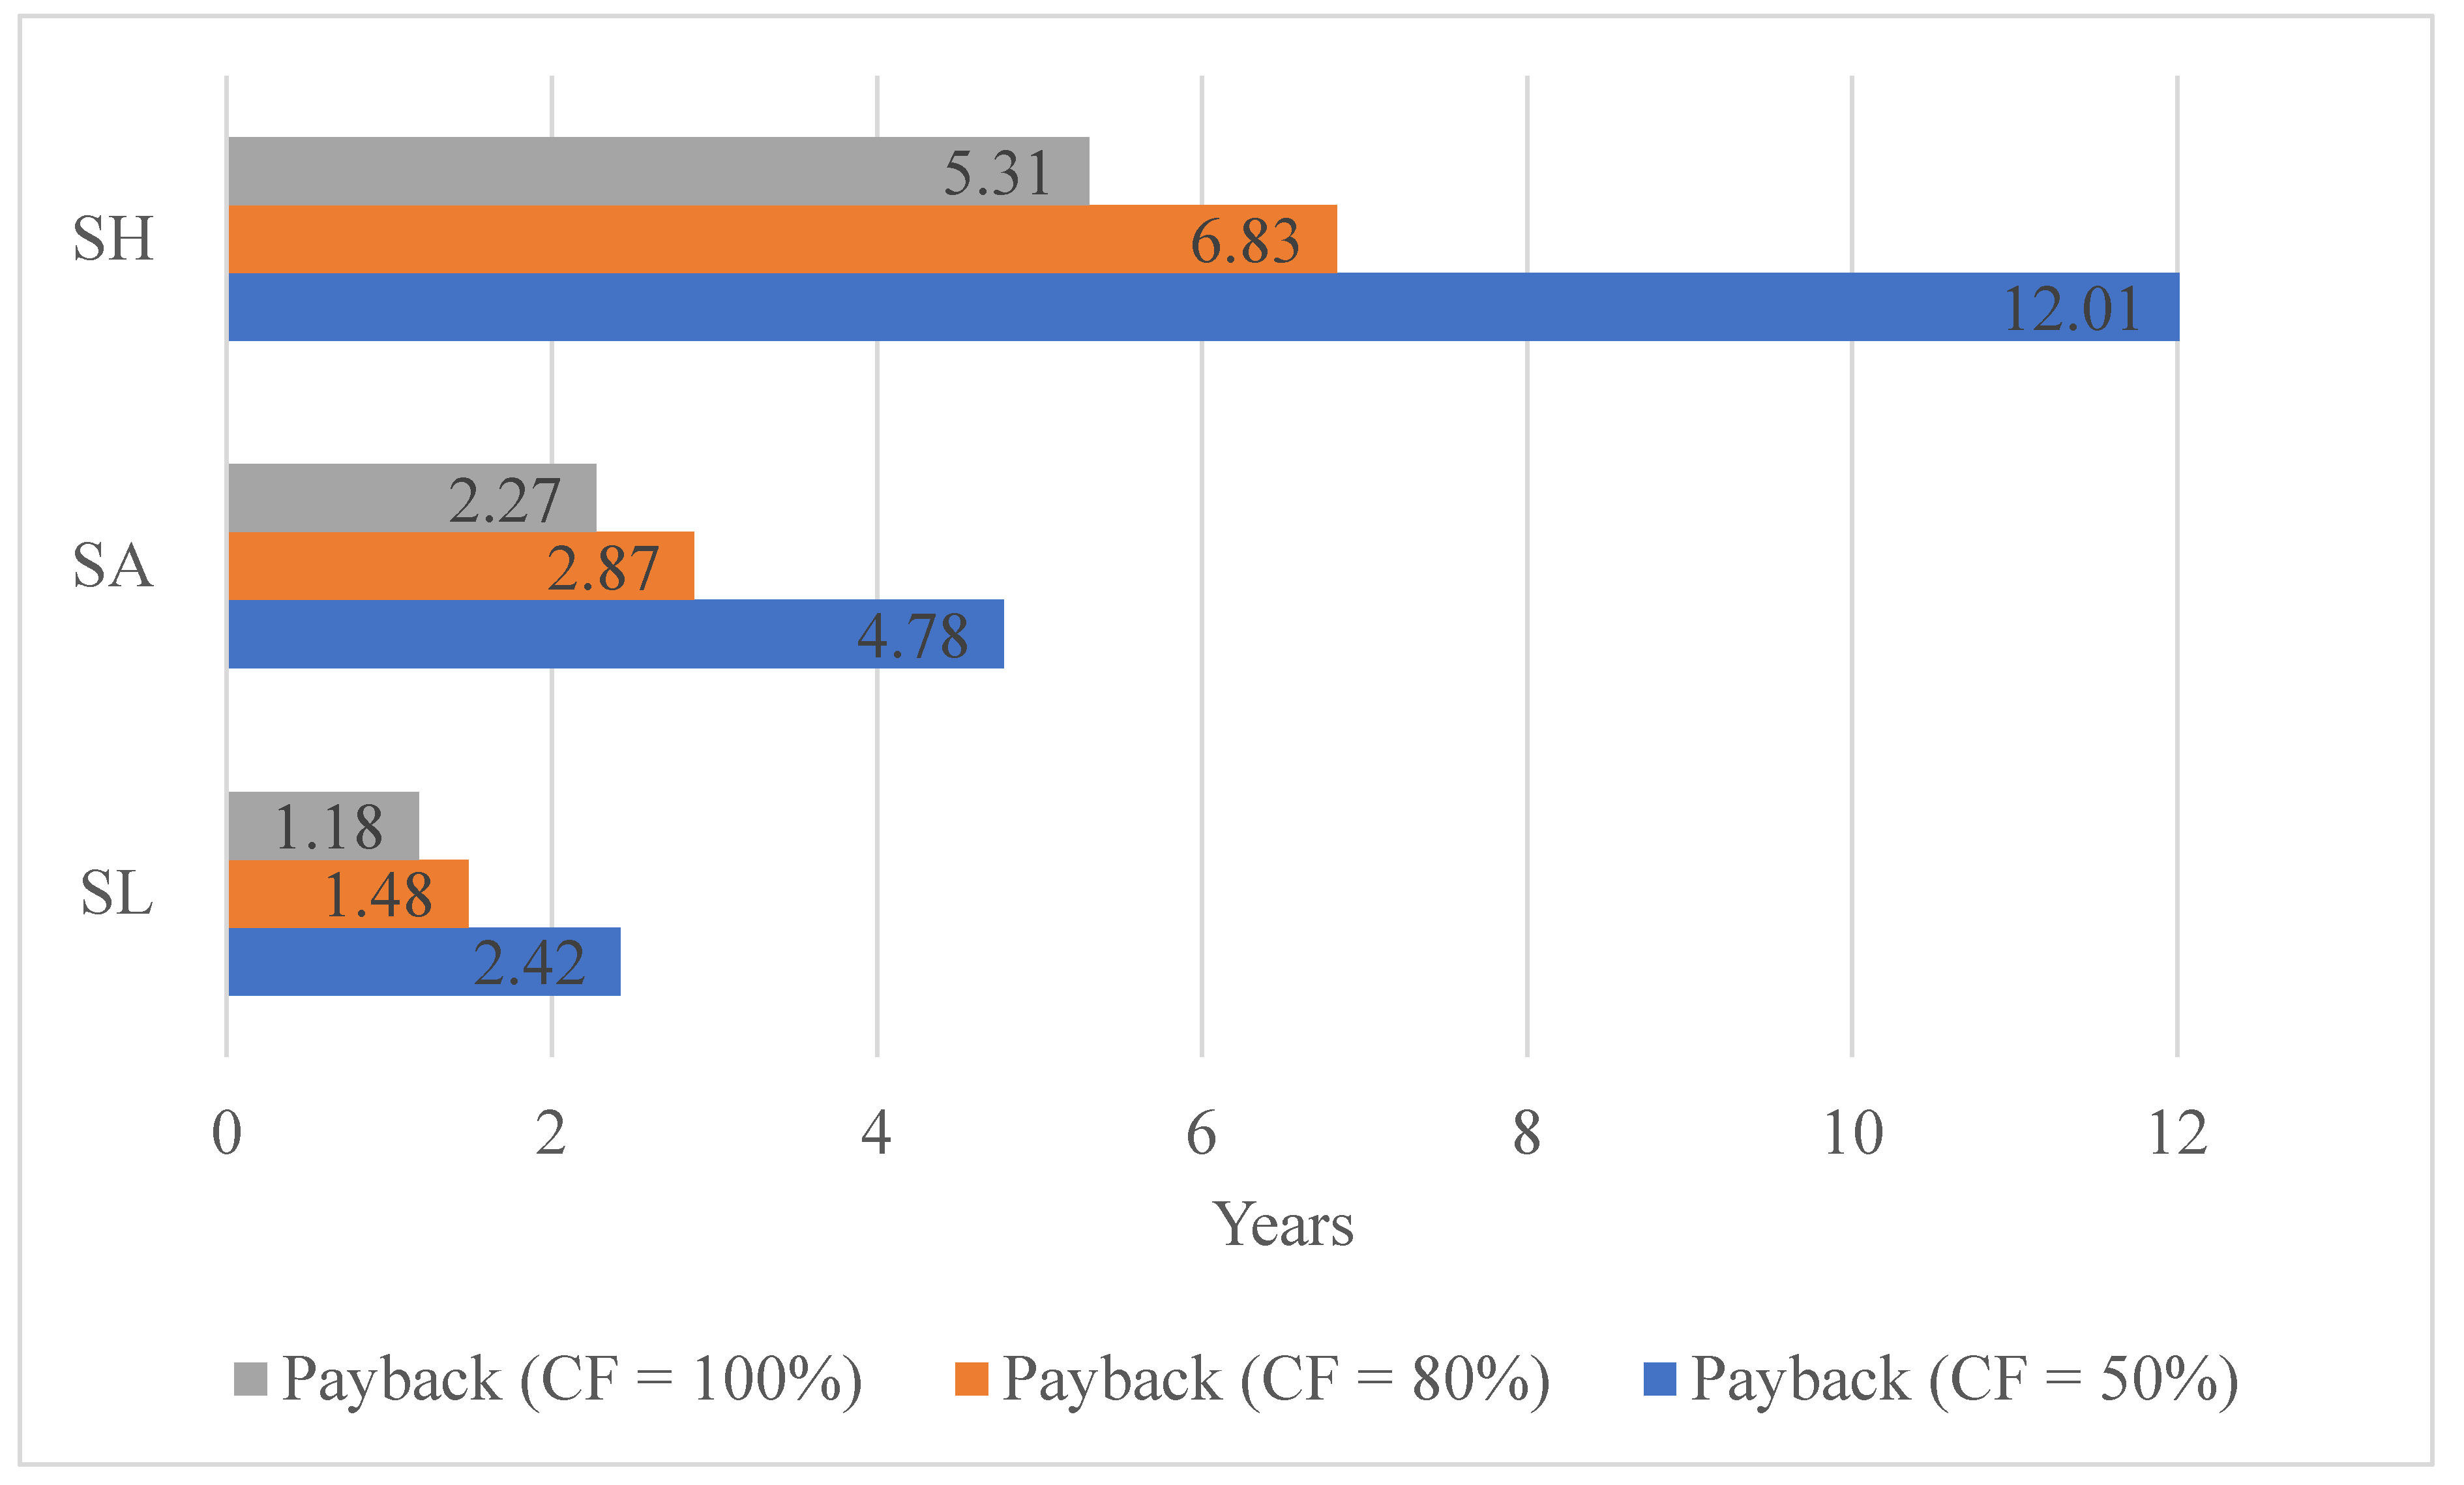
2.3. Plant Capacity Factor

Another critical factor that affects the investment in a power plant is the capacity factor (CF). It represents the ratio of actual output energy over time to the equipment’s maximum potential output energy.
C F = A c t u a l   E n e r g y 365   d a y s × 24   h o u r × m a x i m u m   p o w e r
In the previous sub-section, the CF was assumed to be 100%. However, this is an ideal situation where the power plant runs continuously all through the year without interruption. This could not be achieved, since the small hydropower plant depends on water flow. According to (IRENA, 2021), the average capacity factor of small hydropower plants commissioned between 2010 and 2020 is 52%, while it ranges between 23% and 80%. This lower capacity factor can be explained by site characteristics, turbine selection, and power demand.
To capture the effect of different capacity factors on the hydropower plant payback period, another six scenarios are analyzed based on the average CF of 50% and maximum CF of 80% as shown in Table 3. In these six scenarios, O and M costs are assumed to be 2.2%, where L stands for low investment scenario, A stands for average investment scenario, and H stands for high investment scenario while 50 and 80 correspond to 50% and 80% capacity factor.

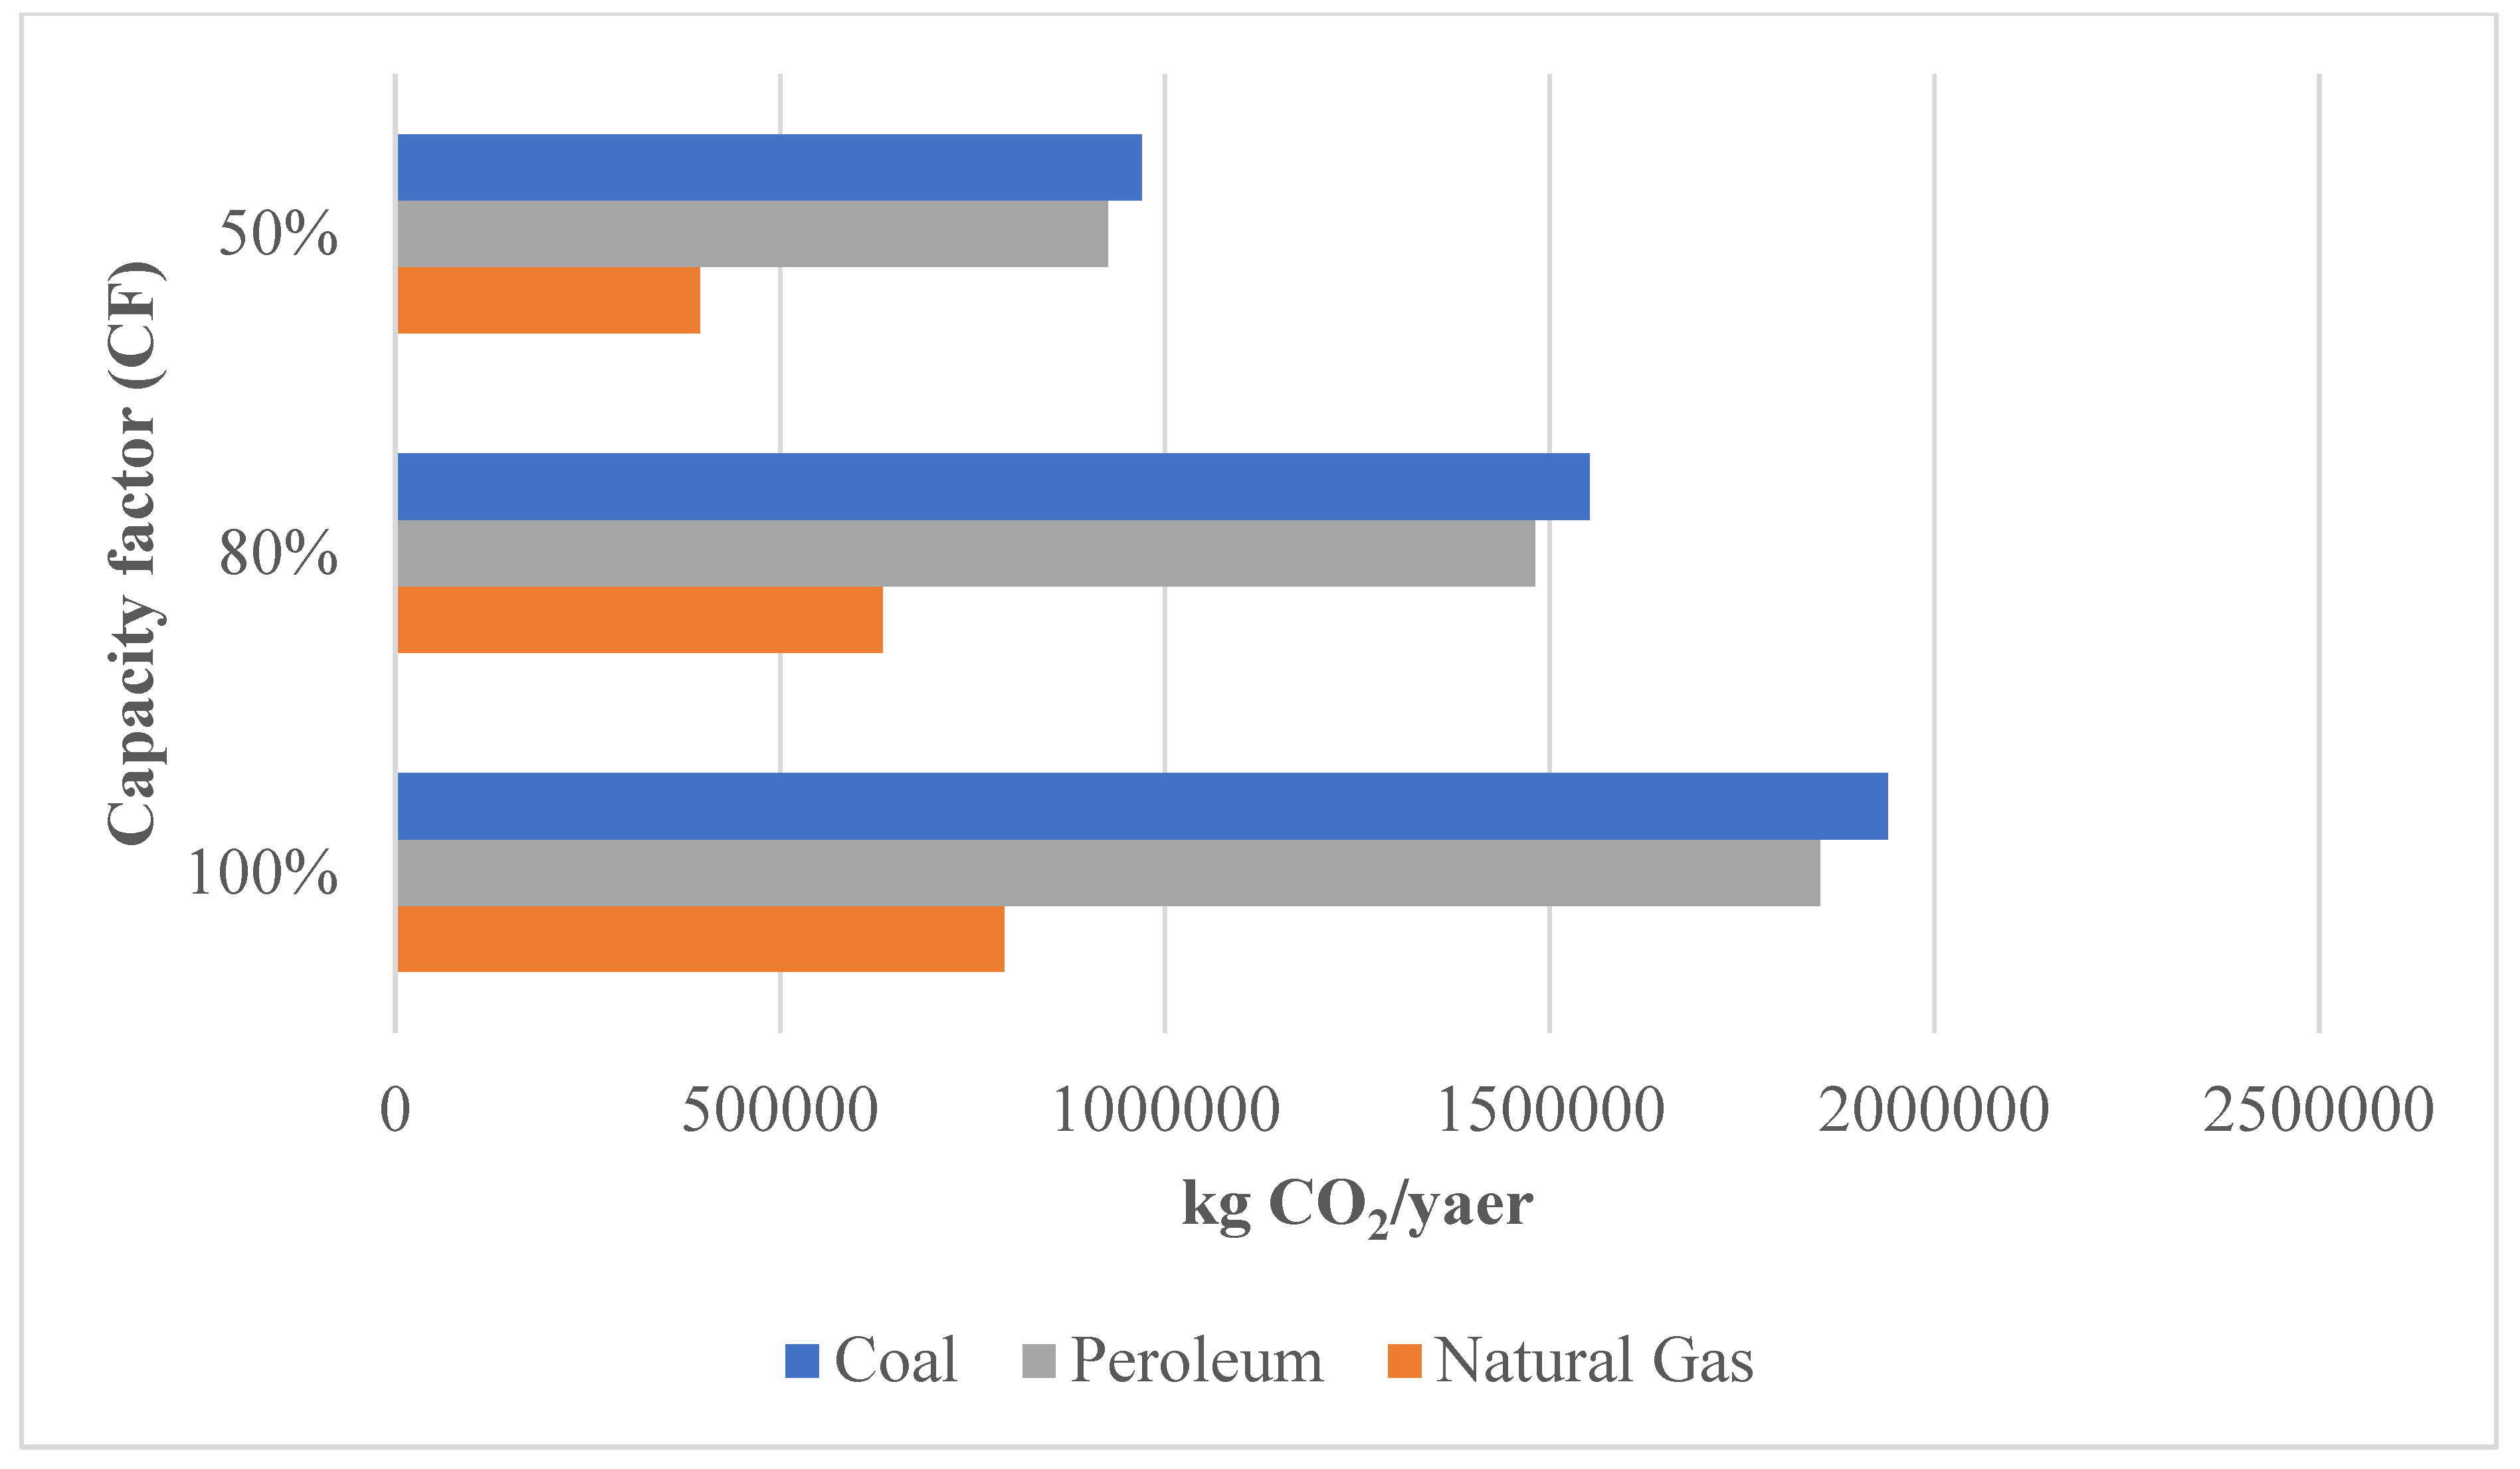
2.4. CO2 Emissions Reduction

Conventional energy resources produce power by burning fossil fuels, which results in emitting CO2 into the environment. Therefore, adopting renewable energy sources in the grid reduces the amount of carbon dioxide emissions. To evaluate the hydropower turbines’ impact on the environment, the amount of CO2 emission saving is found by calculating the CO2 emissions that would be produced if this electrical power is generated using conventional fossil fuel. CO2 emission usually ranges from 2.4-2.8 Kg/l of diesel consumption [32]. The analysis was performed for three different fossil fuels: coal, natural gas, and petroleum. According to the U.S. energy information administration, the CO2 emission factors for coal, natural gas, and petroleum in U.S. electric power plants are 1.012 kg/kWh, 0.413 kg/kWh, and 0.966 kg/kWh, respectively [33].

3. Results and Discussion

The research objective was about implementing mini in-pipe hydropower plants in the existing water transmission system in the United Arab Emirates. The case study discussed implementing the project on Liwa’s reservoir. The methodology first showed the location capability of generating maximum power based on its characteristics. The net head, water flow rate, velocity, and the selected turbine are critical output power factors.
However, the financial aspect of implementation is directly affected by the electromechanical rate, which varies based on the type of turbine. In contrast, the turbine type inversely depends on the power and the net head. For example, low power and low net head will insinuate a higher electromechanical rate. The electromechanical equipment rate of the Pelton turbine is determined following Ogayar and Vidal [34]:
P e l t o n c o s t = 17 , 693 P 0.3644 H n e t 0.281735   / kW
The system’s main parameters and the expected generation capacity are summarized in Table 4. The maximum expected generation capacity is around 218 kW. There is a wide range of small hydropower turbines that can meet this capacity. The Pelton turbine was chosen since it can be installed directly on high-pressure points and does not interrupt the transmission of water as traditional hydro turbines do. The generation capacity was calculated for a Pelton Turbine with a minimum efficiency of 85%. Pelton turbine efficiency can reach 95% [35,36].
It is possible to determine the viability of installing hydro-power plants along water transmission pipelines to harvest power by calculating the payback period. The payback period for installing hydro-turbines should be maintained by adopting a hybrid system that optimizes the design of the transmission water line and reduces the system’s cost.
Figure 2 and Figure 3 show the calculated payback periods and returns of investment for different scenarios. Naturally, the lower investment amount would imply a shorter payback period and a higher return on investment. However, the longest payback period, which was for scenario H2, is still less than six years with a return on investment 18%. This short payback period shows the economic feasibility of such an energy-harvesting technique. In low investment scenarios (L1 and L2), the payback period can be as short as one year. The change in O and M costs from 2.2% to 3% has a minor effect on the economic feasibility of the system since the investment cost is relatively low. This indicates that installing hydro turbines is considered viable since the payback period is less than six years.
Water supply scheme operations must not be affected by hydropower plant operations. It is therefore crucial for the turbine to be flexible with respect to the pressure and discharge available. To maintain the primary function of providing water at all times, the turbine must be connected in a bypass pipe to the main supply pipeline. The effect of different capacity factors on the hydropower plant payback period is presented in Figure 4. The capacity factor plays a crucial role when calculating the payback period of a project. Hence, the purpose of the in-pipe hydropower plant should be decided in advance. For in-pipe hydropower systems, the operation is tailored to meet the needs of the water supply rather than a water operator having to adjust the water to meet the needs of the turbine. This is essential to assure that turbine operation does not interrupt water transmission. As shown in Figure 4, in comparison with a 100% capacity factor, a 50% capacity factor will almost double the payback period. As expected, a capacity factor of 80% has a shorter payback period than 50%, but a longer one than 100%.
The environment is suffering from the world’s evolution. Hence, any reduction of CO2 emissions is critical and noticeable. In order to reduce carbon dioxide emissions by displacing the burning of fossil fuels, several international agencies are encouraging the development of hydropower. In-Pipe Hydro Turbines generate energy without emitting CO2 or other harmful gases. Figure 5 shows the amount of CO2 emissions that can be saved by the proposed project. The figure indicates that the capacity factor significantly affects the emitted gasses. A 100% capacity factor is better than 50% and 80% capacity factors in terms of CO2 emissions. With a 100% capacity factor, the expected annual CO2 emissions savings are 1939, 1851, and 791 tons of CO2 in the cases of coal, petroleum, and natural gas, respectively. This means a total saving in the range of 20,000 to 50,000 tons of CO2 over the project lifespan. This positive environmental impact, in addition to the high economic feasibility, makes such a type of energy-harvesting system very seductive.

4. Conclusions

This study was on the viability and cost analysis of implementing hydropower plants integrated into the existing water distribution system. The research focused on analyzing the economic and environmental aspects for such a system. In the case study, a proposed in-pipe hydropower plant to be installed on part of the transmission network located in Abu Dhabi between the AlShuweihat Desalination Plant and the Liwa Reservoir is discussed. The technical data show that the maximum expected generation capacity is 218.7 kW. This was calculated based on a commercial Pelton turbine with an efficiency of 85% and a generator also with an efficiency of 85%. The feasibility study shows that this project has a high return on investment and short payback periods. These values were studied for different scenarios related to the capital investment, operation and maintenance costs, and capacity factor.
It was noted that the operating and maintenance costs have a minimal impact on the economic feasibility of the project while the capacity factor is really important since these types of systems should be designed to meet the needs of the water supply rather than the needs of the turbine to assure the continuity of water transmission. Furthermore, the expected CO2 emissions saving could reach 1939 tons of CO2 per year depending on the type of the base fuel and the capacity factor. The numbers prove the environmental and economic feasibility of the case study.
Being feasible in a low electricity tariff country such as the UAE makes in-pipe hydropower technologies a competitive energy-harvesting option in countries with a higher electricity tariff, especially as the costs of renewable energy technologies decrease over time.

Author Contributions

Conceptualization, G.A., M.A. and A.S.; methodology, G.A., M.A. and A.S.; formal analysis, A.A. and J.A.A.; investigation, G.A. and M.A.; data curation, A.S., A.A. and J.A.A.; writing—original draft preparation, G.A., M.A. and A.A.; writing—review and editing, A.S. and J.A.A.; visualization, A.S.; supervision, A.S.; project administration, A.S. All authors have read and agreed to the published version of the manuscript.

Funding

The publication of this article was funded by the Open Access Fund of the Leibniz Universität Hannover.

Institutional Review Board Statement

Not applicable.

Informed Consent Statement

Not applicable.

Data Availability Statement

Not applicable.

Conflicts of Interest

The authors declare no conflict of interest.

References

  1. Almuhtady, A.; Alshwawra, A.; Alfaouri, M.; Al-Kouz, W.; Al-Hinti, I. Investigation of the trends of electricity demands in Jordan and its susceptibility to the ambient air temperature towards sustainable electricity generation. Energy Sustain. Soc. 2019, 9, 1–8. [Google Scholar] [CrossRef] [Green Version]
  2. IEA. Key World Energy Statistics 2018; International Energy Agency (IEA): Paris, France, 2018. [Google Scholar]
  3. Alshwawra, A.; Almuhtady, A. Impact of regional conflicts on Energy Security in Jordan. Int. J. Energy Econ. Policy 2020, 10, 45–50. [Google Scholar] [CrossRef]
  4. Sakhrieh, A.; Al Asfar, J.; Ghandour, A.; Adel, A. Improving Photovoltaic Systems in Jordan Using TRIZ Principle—Overview and Case Study. Int. J. Energy Econ. Policy 2022, 12, 73–78. [Google Scholar] [CrossRef]
  5. Hammad, A.; Batayneh, S. Design and installation of grid interactive solar system for building of ministry of energy and mineral resources. In Proceedings of the 13th International Conference on Clean Energy (ICCE-2014), Istanbul, Turkey, 8–12 June 2014. [Google Scholar]
  6. Rossi, M.; Renzi, M.; Štefan, D.; Muntean, S. Small-Scale Hydropower and Energy Recovery Interventions: Management, Optimization Processes and Hydraulic Machines Applications. Sustainability 2022, 14, 11645. [Google Scholar] [CrossRef]
  7. Bonthuys, G.J.; van Dijk, M.; Cavazzini, G. Optimizing the Potential Impact of Energy Recovery and Pipe Replacement on Leakage Reduction in a Medium Sized District Metered Area. Sustainability 2021, 13, 12929. [Google Scholar] [CrossRef]
  8. Itani, Y.; Soliman, M.R.; Kahil, M. Recovering energy by hydro-turbines application in water transmission pipelines: A case study west of Saudi Arabia. Energy 2020, 211, 118613. [Google Scholar] [CrossRef]
  9. Berrada, A.; Bouhssine, Z.; Arechkik, A. Optimisation and economic modeling of micro hydropower plant integrated in water distribution system. J. Clean. Prod. 2019, 232, 877–887. [Google Scholar] [CrossRef]
  10. Aster, N. What is the Water-Energy Nexus? TriplePundit. Available online: https://www.triplepundit.com/story/2012/what-water-energy-nexus/59796 (accessed on 2 October 2021).
  11. Misbah, M.; Gharbe, N. Renewable Energy from Great Man-Made River Generating Hydrokinetic Energy from Water movements through Pipes by using Lucid Pipe Power System. In Proceedings of the 5th Scientific Conference of Environment and Sustainable Development in the Arid and Semi- Arid Regions (ICESD), Ajdabiya, Libya, 23–25 July 2018; Volume 05, pp. 1188–1197. [Google Scholar]
  12. Power, C.; McNabola, A.; Coughlan, P. Development of an evaluation method for hydropower energy recovery in wastewater treatment plants: Case studies in Ireland and the UK. Sustain. Energy Technol. Assess. 2014, 7, 166–177. [Google Scholar] [CrossRef]
  13. Crespo Chacón, M.; Rodríguez Díaz, J.A.; García Morillo, J.; McNabola, A. Hydropower energy recovery in irrigation networks: Validation of a methodology for flow prediction and pump as turbine selection. Renew. Energy 2020, 147, 1728–1738. [Google Scholar] [CrossRef]
  14. Meirelles Lima, G.; Brentan, B.M.; Luvizotto, E. Optimal design of water supply networks using an energy recovery approach. Renew. Energy 2018, 117, 404–413. [Google Scholar] [CrossRef]
  15. Coelho, B.; Andrade-Campos, A. Efficiency achievement in water supply systems—A review. Renew. Sustain. Energy Rev. 2014, 30, 59–84. [Google Scholar] [CrossRef]
  16. Du, J.; Yang, H.; Shen, Z.; Chen, J. Micro hydro power generation from water supply system in high rise buildings using pump as turbines. Energy 2017, 137, 431–440. [Google Scholar] [CrossRef]
  17. Aziz, M.S.; Khan, M.A.; Jamil, H.; Jamil, F.; Chursin, A.; Kim, D.H. Design and Analysis of In-Pipe Hydro-Turbine for an Optimized Nearly Zero Energy Building. Sensors 2021, 21, 8154. [Google Scholar] [CrossRef]
  18. Saber, H.; Mazaheri, H.; Ranjbar, H.; Moeini-Aghtaie, M.; Lehtonen, M. Utilization of in-pipe hydropower renewable energy technology and energy storage systems in mountainous distribution networks. Renew. Energy 2021, 172, 789–801. [Google Scholar] [CrossRef]
  19. Chiaradia, T.; Mukulu, M.; Meder, K. Micro Hydro Power (MHP)—Pros and Cons. Energypedia. Available online: https://energypedia.info/wiki/Micro_Hydro_Power_(MHP)_-_Pros_and_Cons#Micro_Hydro_Cons_-_Disadvantages (accessed on 2 October 2021).
  20. Liu, M.; Tan, L.; Cao, S. Theoretical model of energy performance prediction and BEP determination for centrifugal pump as turbine. Energy 2019, 172, 712–732. [Google Scholar] [CrossRef]
  21. Uhunmwangho, R.; Odje, M.; Okedu, K.E. Comparative analysis of mini hydro turbines for Bumaji Stream, Boki, Cross River State, Nigeria. Sustain. Energy Technol. Assess. 2018, 27, 102–108. [Google Scholar] [CrossRef]
  22. Samora, I.; Manso, P.; Franca, M.; Schleiss, A.; Ramos, H. Energy Recovery Using Micro-Hydropower Technology in Water Supply Systems: The Case Study of the City of Fribourg. Water 2016, 8, 344. [Google Scholar] [CrossRef] [Green Version]
  23. Sani, A.E. Design and synchronizing of Pelton turbine with centrifugal pump in RO package. Energy 2019, 172, 787–793. [Google Scholar] [CrossRef]
  24. Zheng, Y.; Sahraei-Ardakani, M. Leveraging existing water and wastewater infrastructure to develop distributed pumped storage hydropower in California. J. Energy Storage 2021, 34, 102204. [Google Scholar] [CrossRef]
  25. Alshwawra, A.; Almuhtady, A. Impact of turmoil and gas resources in the Eastern Mediterranean on Jordanian Energy Security and foreign policy. Transformation of Turkey’s Defense Industry: Causes, Context and Consequences. Insight Turk. 2020, 22, 237–255. [Google Scholar] [CrossRef]
  26. Abu Raed, A.; Ahmed, A.; Abdelhamid, A. Biomimicry Approach Design of Petrol Stations with Integrating Renewable Energy in the UAE. In Eco-Architecture IX: Harmonisation between Architecture and Nature, Proceedings of the 9th International Conference on Harmonisation between Architecture and Nature, ARC 2022, Lisbon, Portugal, 12–14 July 2022; WITPres: Billerica, MA, USA; pp. 41–47.
  27. Sohail, M.; Afrouzi, H.N.; Ahmed, J.; Mehranzamir, K.; Tabassum, M.; Mobin Siddique, M.B. A comprehensive scientometric analysis on hybrid renewable energy systems in developing regions of the world. Results Eng. 2022, 16, 100481. [Google Scholar] [CrossRef]
  28. The United Arab Emirates’ Government Portal. UAE Energy Strategy 2050—The Official Portal of the UAE Government. Available online: https://u.ae/en/about-the-uae/strategies-initiatives-and-awards/federal-governments-strategies-and-plans/uae-energy-strategy-2050 (accessed on 28 November 2021).
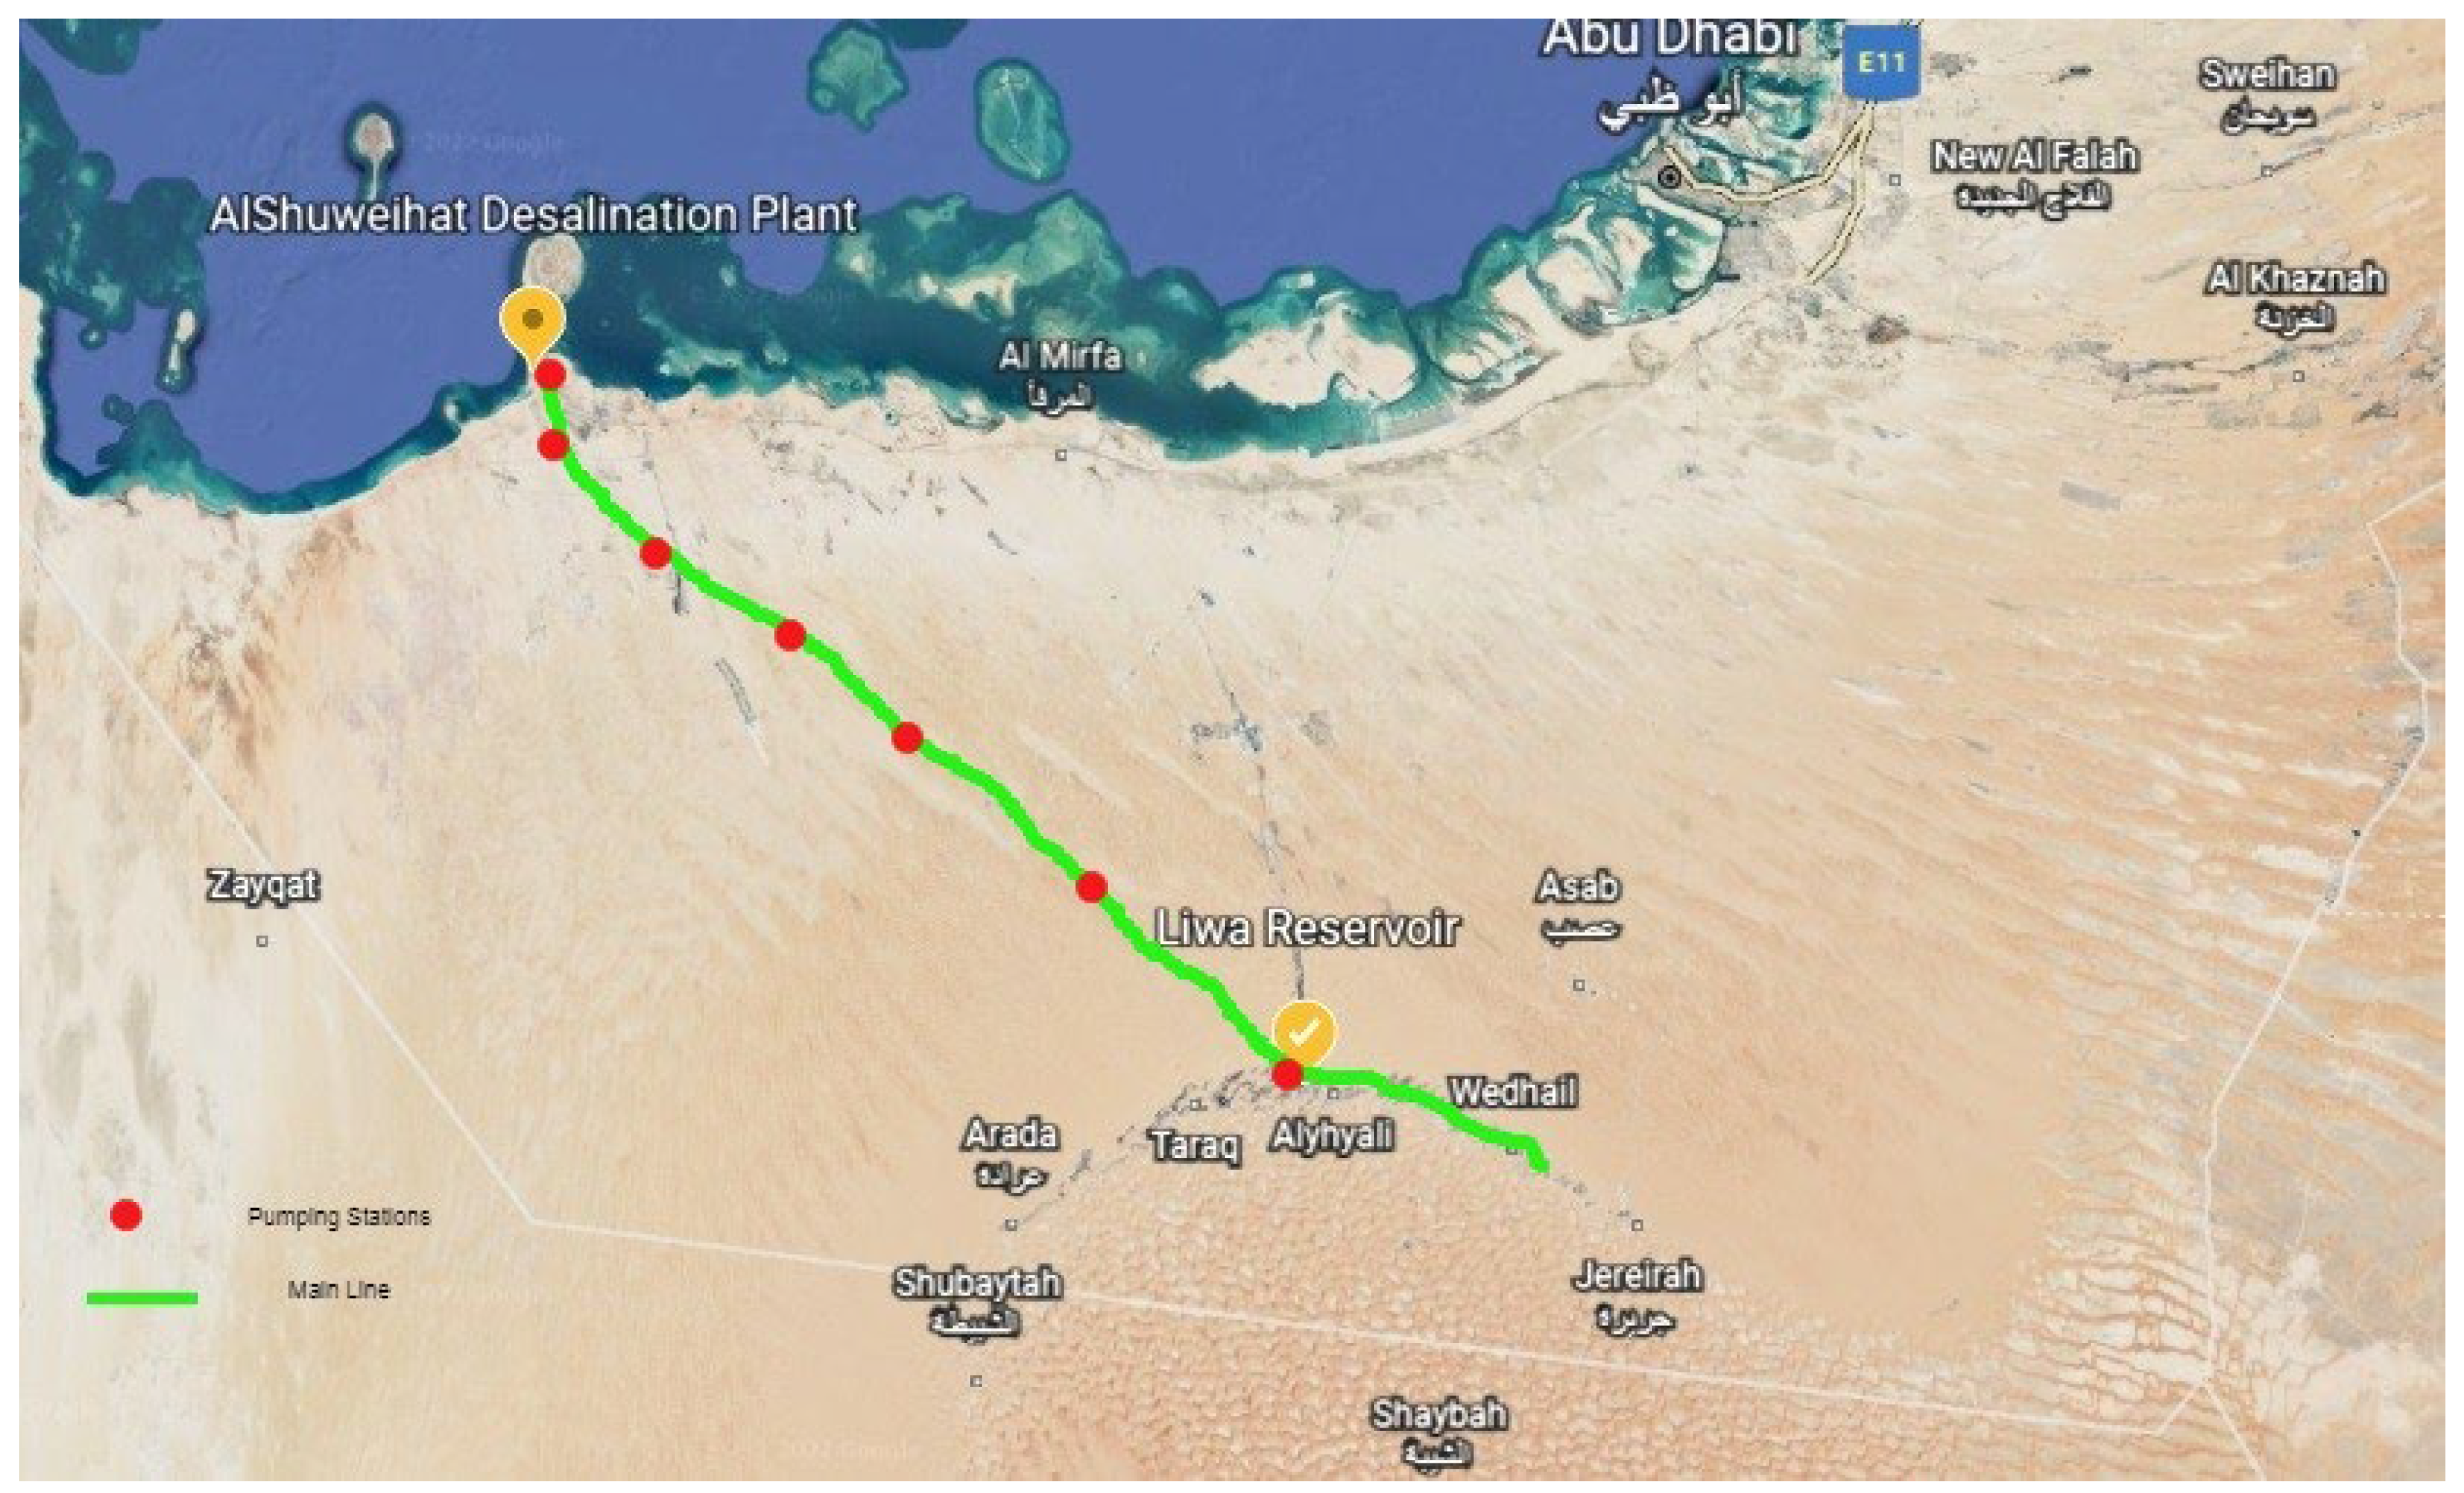
  29. Rathi, A. UAE Has Built the World’s Largest Water Reserve in Liwa Desert. Quartz. Available online: https://qz.com/1180035/uae-has-built-the-worlds-largest-water-reserve-in-liwa-desert/ (accessed on 19 January 2018).
  30. IRENA. Renewable Power Generation Costs in 2020. International Renewable Energy Agency: Abu Dhabi, United Arab Emirates. 2021. Available online: https://www.irena.org/publications/2021/Jun/Renewable-Power-Costs-in-2020 (accessed on 28 November 2021).
  31. Abu Dhabi Distribution Co. Water & Electricity Tariffs 2017. 2018. Available online: https://www.addc.ae/en-US/Business/Documents/02-English.pdf (accessed on 23 November 2021).
  32. Alsema, E.A. Environmental Life Cycle Assessment of Solar Home Systems (NWS-E-2000-15); Department of Science Technology and Society, Utrecht University: Utrecht, The Netherlands, 2000. [Google Scholar]
  33. EIA, Energy Information Agency—Frequently Asked Questions (Faqs)—U.S. Energy Information Administration (EIA). Available online: https://www.eia.gov/tools/faqs/faq.php?id=74&t=11 (accessed on 24 August 2022).
  34. Ogayar, B.; Vidal, P. Cost determination of the electro-mechanical equipment of a small hydro-power plant. Renew. Energy 2009, 34, 6–13. [Google Scholar] [CrossRef]
  35. Gudukeya, L.K.; Mbohwa, C. Improving the Efficiencies of Pelton Wheel in Micro-Hydro Power Plants. In Proceedings of the International Conference on Industrial Engineering and Operations Management, Rabat, Morocco, 11–13 April 2017; pp. 1089–1100. [Google Scholar]
  36. Purdue University. Lucidpipetm Power System. Emerging Construction Technologies; Purdue University: West Lafayette, IN, USA, 2016. [Google Scholar]
Figure 1. A schematic for part of TRANSCO Water Transmission Network showing AlShuweihat to Liwa transmission line.
Sustainability 15 00651 g001
Figure 2. Payback periods for different scenarios.
Sustainability 15 00651 g002
Figure 3. Return on investment for different scenarios.
Sustainability 15 00651 g003
Figure 4. The effect of capacity factor on payback period.
Sustainability 15 00651 g004
Figure 5. Expected annual CO2 emission reduction for various capacity factors and fuels.
Sustainability 15 00651 g005
Table 1. Total installation costs for hydropower in USD (Source: IRENA, 2021).
Investment CategoryCalculation MethodInstallation Costs (2020 USD/kW)
Low5th percentile807.00
AverageWeighted average1518.00
High95th percentile3334.00
Table 2. Investment scenarios.
NameInvestmentO and M Costs
L1Low2.2%
L2Low3.0%
A1Average2.2%
A2Average3.0%
H1High2.2%
H2High3.0%
Table 3. Investment scenarios with various capacity factors.
NameInvestmentO and M CostsCF
SL50Low2.2%50%
SL80Low2.2%80%
SA50Average2.2%50%
SA80Average2.2%80%
SH50High2.2%50%
SH80High2.2%80%
Table 4. System main Parameters.
ParameterValue
Reservoir volume26 billion liters
Time required to fill up the reservoir26 months
Hazen–Williams Coefficient140
Pipe segment length10 m
Pipe inside diameter1 m
Gross head80 m
Head loss1.938 × 10−3 m
Net head79.998 m
Water flow rate0.386 m3/s
Water density1000 kg/m3
Gravity9.810 m/s2
Turbine efficiency85%
Generator efficiency85%
Hydraulic Power302.775 kW
Generation capacity218.755 kW
Disclaimer/Publisher’s Note: The statements, opinions and data contained in all publications are solely those of the individual author(s) and contributor(s) and not of MDPI and/or the editor(s). MDPI and/or the editor(s) disclaim responsibility for any injury to people or property resulting from any ideas, methods, instructions or products referred to in the content.

