Article

Risk Assessment of Potentially Toxic Elements in Agricultural Soils of Al-Ahsa Oasis, Saudi Arabia

by
Talal Alharbi
and
Abdelbaset S. El-Sorogy
*
Geology and Geophysics Department, College of Science, King Saud University, Riyadh 11451, Saudi Arabia
*
Author to whom correspondence should be addressed.
Sustainability 2023, 15(1), 659; https://doi.org/10.3390/su15010659
Submission received: 28 November 2022 / Revised: 17 December 2022 / Accepted: 20 December 2022 / Published: 30 December 2022

Abstract

:
Contamination of soil with potentially toxic elements (PTEs) is receiving great attention worldwide due to its apparent toxicity and hazards to local residents. The assessments of soil PTE distribution, sources, and environmental risks are, therefore, the first steps of high-efficiency pollutant degradation and sustainable utilization. The current study used a variety of contamination indicators and multivariate methods to evaluate the environmental risk of As, Cd, Cr, Cu, Hg, Ni, Pb, and Zn in Al-Ahsa soils in eastern Saudi Arabia. For analysis, 30 surface soil samples were collected from palm fields irrigated with groundwater and treated sewage water. Landsat images of Al-Ahsa indicated an increase in the total vegetative area and the residential area, and a decrease in the bare land area from 1985 to 2021. The average concentrations of PTEs (mg/kg−1) were lower than the maximum admissible concentrations and had the following decreasing order: Zn (54.43) > Cr (28.67) > Ni (14.53) > Cu (10.83) > Pb (5.23) > As (2.27) > Hg (0.35) > Cd (0.26). The enrichment factor (EF) findings confirmed that the Al-Ahsa soil is significantly enriched with Hg, moderately to severely enriched with As, and moderately enriched with Cd. The potential ecological risk index (RI) demonstrates a moderate ecological risk, with only certain parts presenting a high risk. The different PTE levels in agricultural soils may be caused partly by the various qualities of groundwater that originate from various aquifers and sewage-treated water. The results of a multivariate analysis showed that most of the anthropogenic sources of Hg, As, and Cd may come from using a lot of fertilizers and insecticides. Levels of the remaining PTEs indicated natural sources from earth crust materials.

1. Introduction

Soil contamination refers to the excessive deposition of toxic elements, such as Hg, Cd, Pb, Cr, As, Zn, Cu, Ni, Sn, and V, into soil and water due to natural material or anthropogenic activities, causing severe environmental degradation [1,2]. Excessive PTEs in soil occur because of many factors including natural sedimentation and precipitation, irrigation using contaminated water from urban and industrial waste, and the usage of various fertilizers and pesticides in agriculture practices [1,3,4]. Potentially toxic elements from the soil can enter the human body through skin absorption and dust inhalation, potentially causing significant health problems, particularly for children [5].
Soil toxicity with PTEs kills microorganisms, which enhance fertility and the nutrition levels of soils. For human beings, arsenic toxicity causes liver, skin, blood, and prostate gland cancers [5,6,7,8]. Hg toxicity causes Minamata disease, several physiological effects, and carcinogenic effects on the brain, skin, and lung, while Pb is the reason for central nervous system, lung, and intestinal cancers [8,9]. Cadmium accumulates in soils due to the widespread intensive use of phosphate fertilizers and then enters food chains, causing Alzheimer’s disease and lung, gastrointestinal, breast, and renal cancer in humans [10,11].
The Kingdom of Saudi Arabia (KSA) is one of the Gulf region’s fastest-growing economies in a variety of sectors, including petrochemicals, oil and gas, agriculture, pharmaceuticals, and a variety of other industries. This development led to the growth of urbanization and population, with a direct impact on the country’s natural resources [12]. Most soils in Saudi Arabia could be considered immature or young soils due to the dearth of moisture [13]. Based on mineralogical properties and the parent rocks, Saudi Arabia is characterized by Torrifluvents and Gypsiorthids soil in the eastern region, Haplargids soil in the western region, and Torriorthents, Torrifluvents, and Torripsamments in the central region [14].
On the Arabian Peninsula, Al-Ahsa is distinguished as the most significant and oldest oasis. The distance of Al-Ahsa from Riyadh is roughly 320 km, and from the Arabian Gulf coast, it is about 75 km. Al-Ahsa includes Al-Hofuf and Al-Mubaraz cities, which are densely populated and industrialized, with more than fifty villages. Al-Ahsa is located on a sedimentary succession comprising carbonates, evaporates, and subordinate marl and shale, with a total thickness of 800–2500 m, which increases and slopes toward the Arabian Gulf. Three partially interconnected aquifers compose the groundwater system in this area [15]: the Neogene aquifer complex with a total thickness of 180 m, the Khobar aquifer beneath the Neogene with a depth between 180 and 250 m, and the Umm-er Radhuma at the base with a depth between 280 and 240 m.
Most of the soil in Al-Ahsa is sandy or sandy loam that has a lot of calcium carbonate and very little clay or organic matter [16,17]. Al-Ahsa Oasis is dominated by date palms with more than three million trees, as well as leafy green plants, vegetables, and fruits [17,18]. Furthermore, the Al-Ahsa region is well known for rice cultivation (Hassawi rice), which is resistant to salinity and drought [19,20]. Groundwater levels in Al-Ahsa have decreased significantly over time due to excessive irrigation of vast farmlands. Consequently, portions of the sewage water from the Hofuf, Al-Ayoun, Al-Omran, and Saudi Aramco wastewater treatment facilities are used to meet the water requirements of agriculture and industry. These plants treat residential and industrial sewage as well as agricultural drainage water.
There are very few studies in the literature, particularly those examining the risk assessment of PTEs and their associated human health hazards. Mohammed et al. [21] discovered a high enrichment in Cu, Zn, Pb, and Ni in the cultivated soil of Al-Ahsa Oasis and attributed the pollution to agriculture production and using varying irrigation water quality. AlMulla et al. [22] investigated the health concerns related to As, Cd, Ni, Pb, Cr, and Sb in Hassawi Brown Rice and reported that the As and Pb concentrations in all samples exceeded the FAO and WHO maximum allowed limits. The contamination of soil with PTEs and their hazardous effects to the soil and human beings need a periodic and continuous evaluation. Thus, the primary objectives of the current work are to document the agricultural soil land use patterns in the Al-Ahsa, investigate the hazardous levels of As, Cd, Cr, Cu, Hg, Ni, Pb, and Zn in Al-Ahsa soil, and explore the possible sources of PTEs in the examined area utilizing various contamination metrics and multivariate analytical techniques.

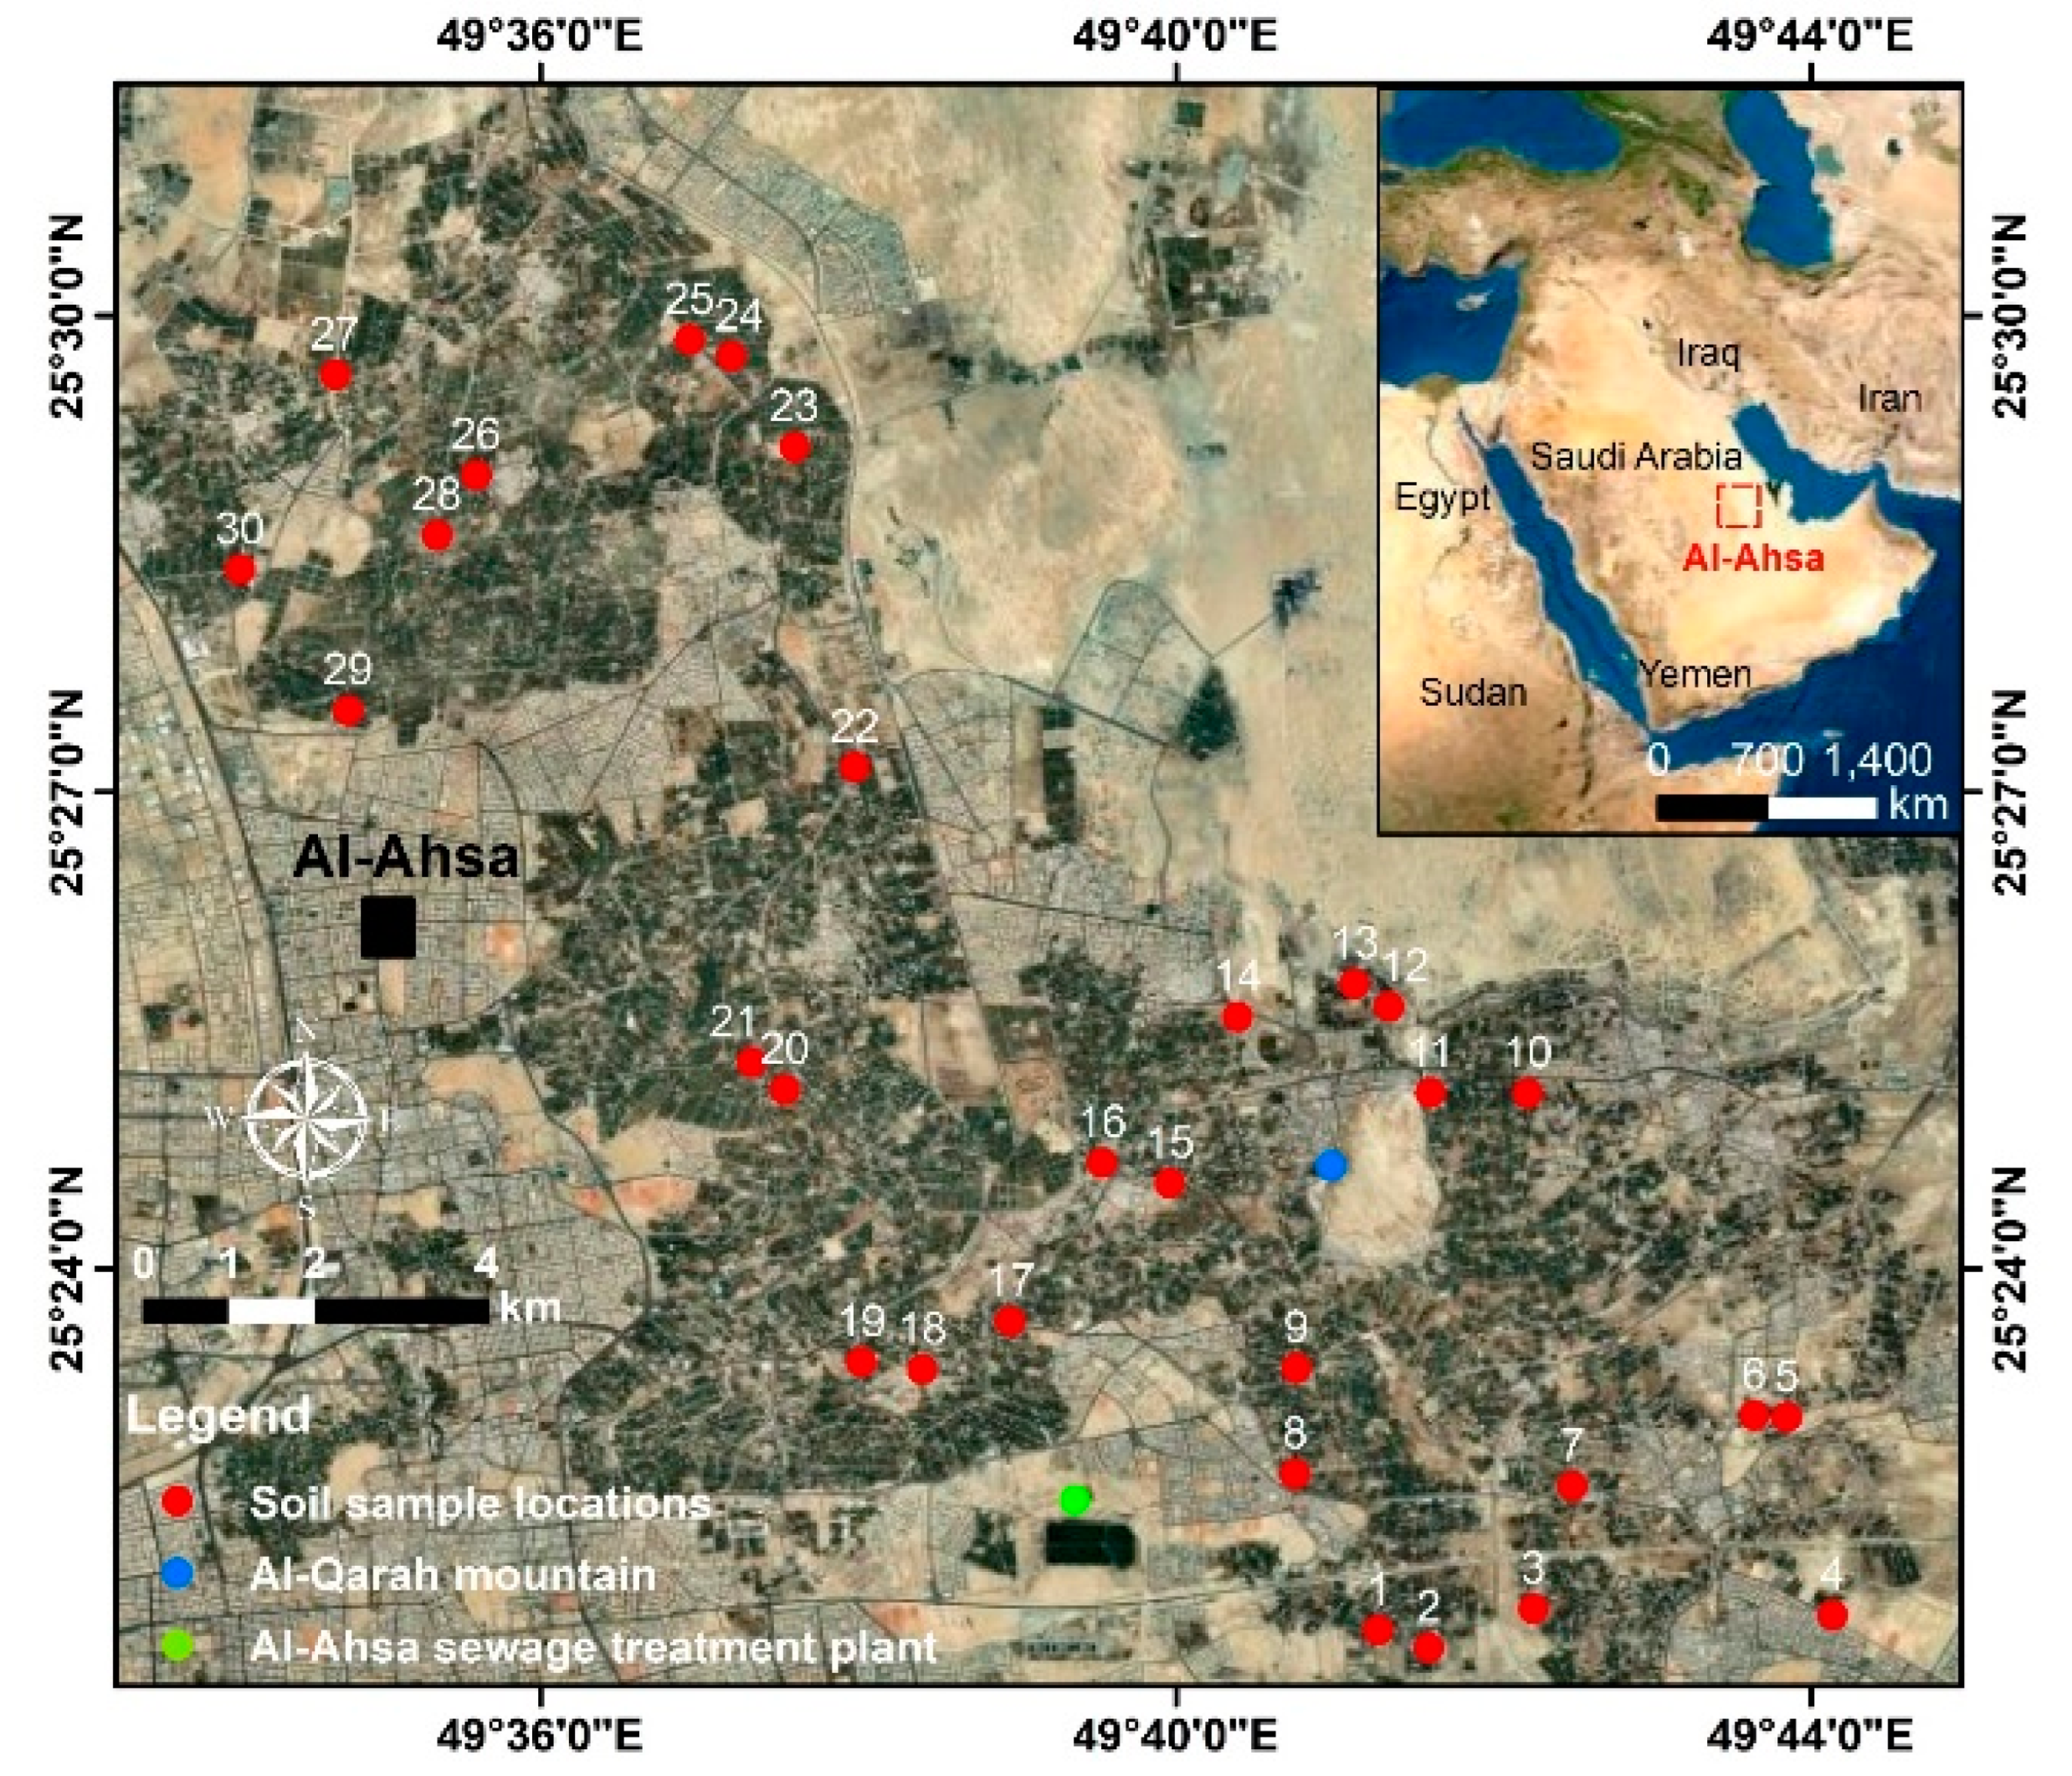
2. Materials and Methods

In 2022, 30 surface soil samples were taken from palm farms in Al-Ahsa Oasis between 25°21′00″ and 25°37′00″ North and 49°33′00″ and 49°46′00″ East (Figure 1) to evaluate the soil contamination with PTEs. The samples were collected at a depth less than 10 cm using a hard plastic hand trowel. At each station, a composite sample consisting of four subsamples was mixed to have a representative sample, and then placed in plastic bags and stored in an ice box. Then, the samples were air-dried and sieved. In the laboratory, the samples were air-dried and manually disaggregated by an agate mortar after removing large rocks and organic debris. The samples were size-fractionated using a nest of sieves of >500 μm, 500–250 μm, 250–125 μm, 125–63 μm, and <63 μm (Table S1). Inductively coupled plasma-atomic emission spectrometry (ICP-AES) was used at the ALS Geochemistry Laboratory in Jeddah, Saudi Arabia, to analyze As, Cd, Cr, Cu, Hg, Ni, Pb, and Zn. An amount of 0.50 g of each sample with a fraction of <63 μm was incubated with HNO3–HCl aqua regia for 45 min in a graphite heating block. After cooling, the resultant solution was diluted to 12.5 mL using deionized water, mixed, and analyzed. To avoid the adsorption of Hg on the Teflon surface of the digestion vessels, specific concentrations of HNO3 and HCl were used. However, a high chloride concentration was used in As analysis. The ICP-AES method was tested for linearity, limits of detection (LODs), limits of quantification (LOQs), and accuracy and precision. Three samples were analyzed in duplicate to verify the precision of analysis. ALS Geochemistry Laboratory used a standard analytical batch including a reagent blank to measure the background and Certified Reference Material (CRM) to assure the accuracy of data prior to release. Table S2 summarizes the land use pattern of the study area, coordinates of sampling sites, and results of PTE analysis.
The land use pattern in Al-Ahsa was determined by a comparison between the Landsat-5 TM image (Path 164, Row 042) obtained on 6 January 1985 and the Landsat-8 image (Path 164, Row 042) acquired on 9 November 2021. The overall accuracy of Landsat-5 and Landsat-8 image classifications was 86% and 88%, respectively. Cloud-free Landsat images that covered the entire study area were selected for the highest-quality appearance. The concentration of a given PTE in the soil was calculated using the enrichment factor, EF; contamination factor, CF; pollution load index, PLI; potential ecological risk index, RI [23]. The aforementioned indices are classified in Table 1 and were calculated based on the following equations [24,25,26,27,28]:
EF = (M/X) sample/(M/X) background,
Igeo = Log2 (Cm sample/1.5 × Cm background),
CF = Co/Cb,
PLI = (CF1 × CF2 × CF3 × CF4….. × CFn)1/n,
Eri = Tri × Cfi,
RI = Ʃ (Tri × Cfi),
where M, Co, and Cm sample represent the analyzed metal; X, Cb, and Cm background denote the level of the normalizing element (Fe in this study); CFn denotes the CF for metal n; Eri is each element’s potential ecological risk; Tri is the biological toxic response factor. The origin of PTEs in the soil was traced using multivariate statistical methods such as principal component analysis (PCA), the correlation coefficient (Pearson’s r), and hierarchical cluster analysis (HCA).

3. Results and Discussion

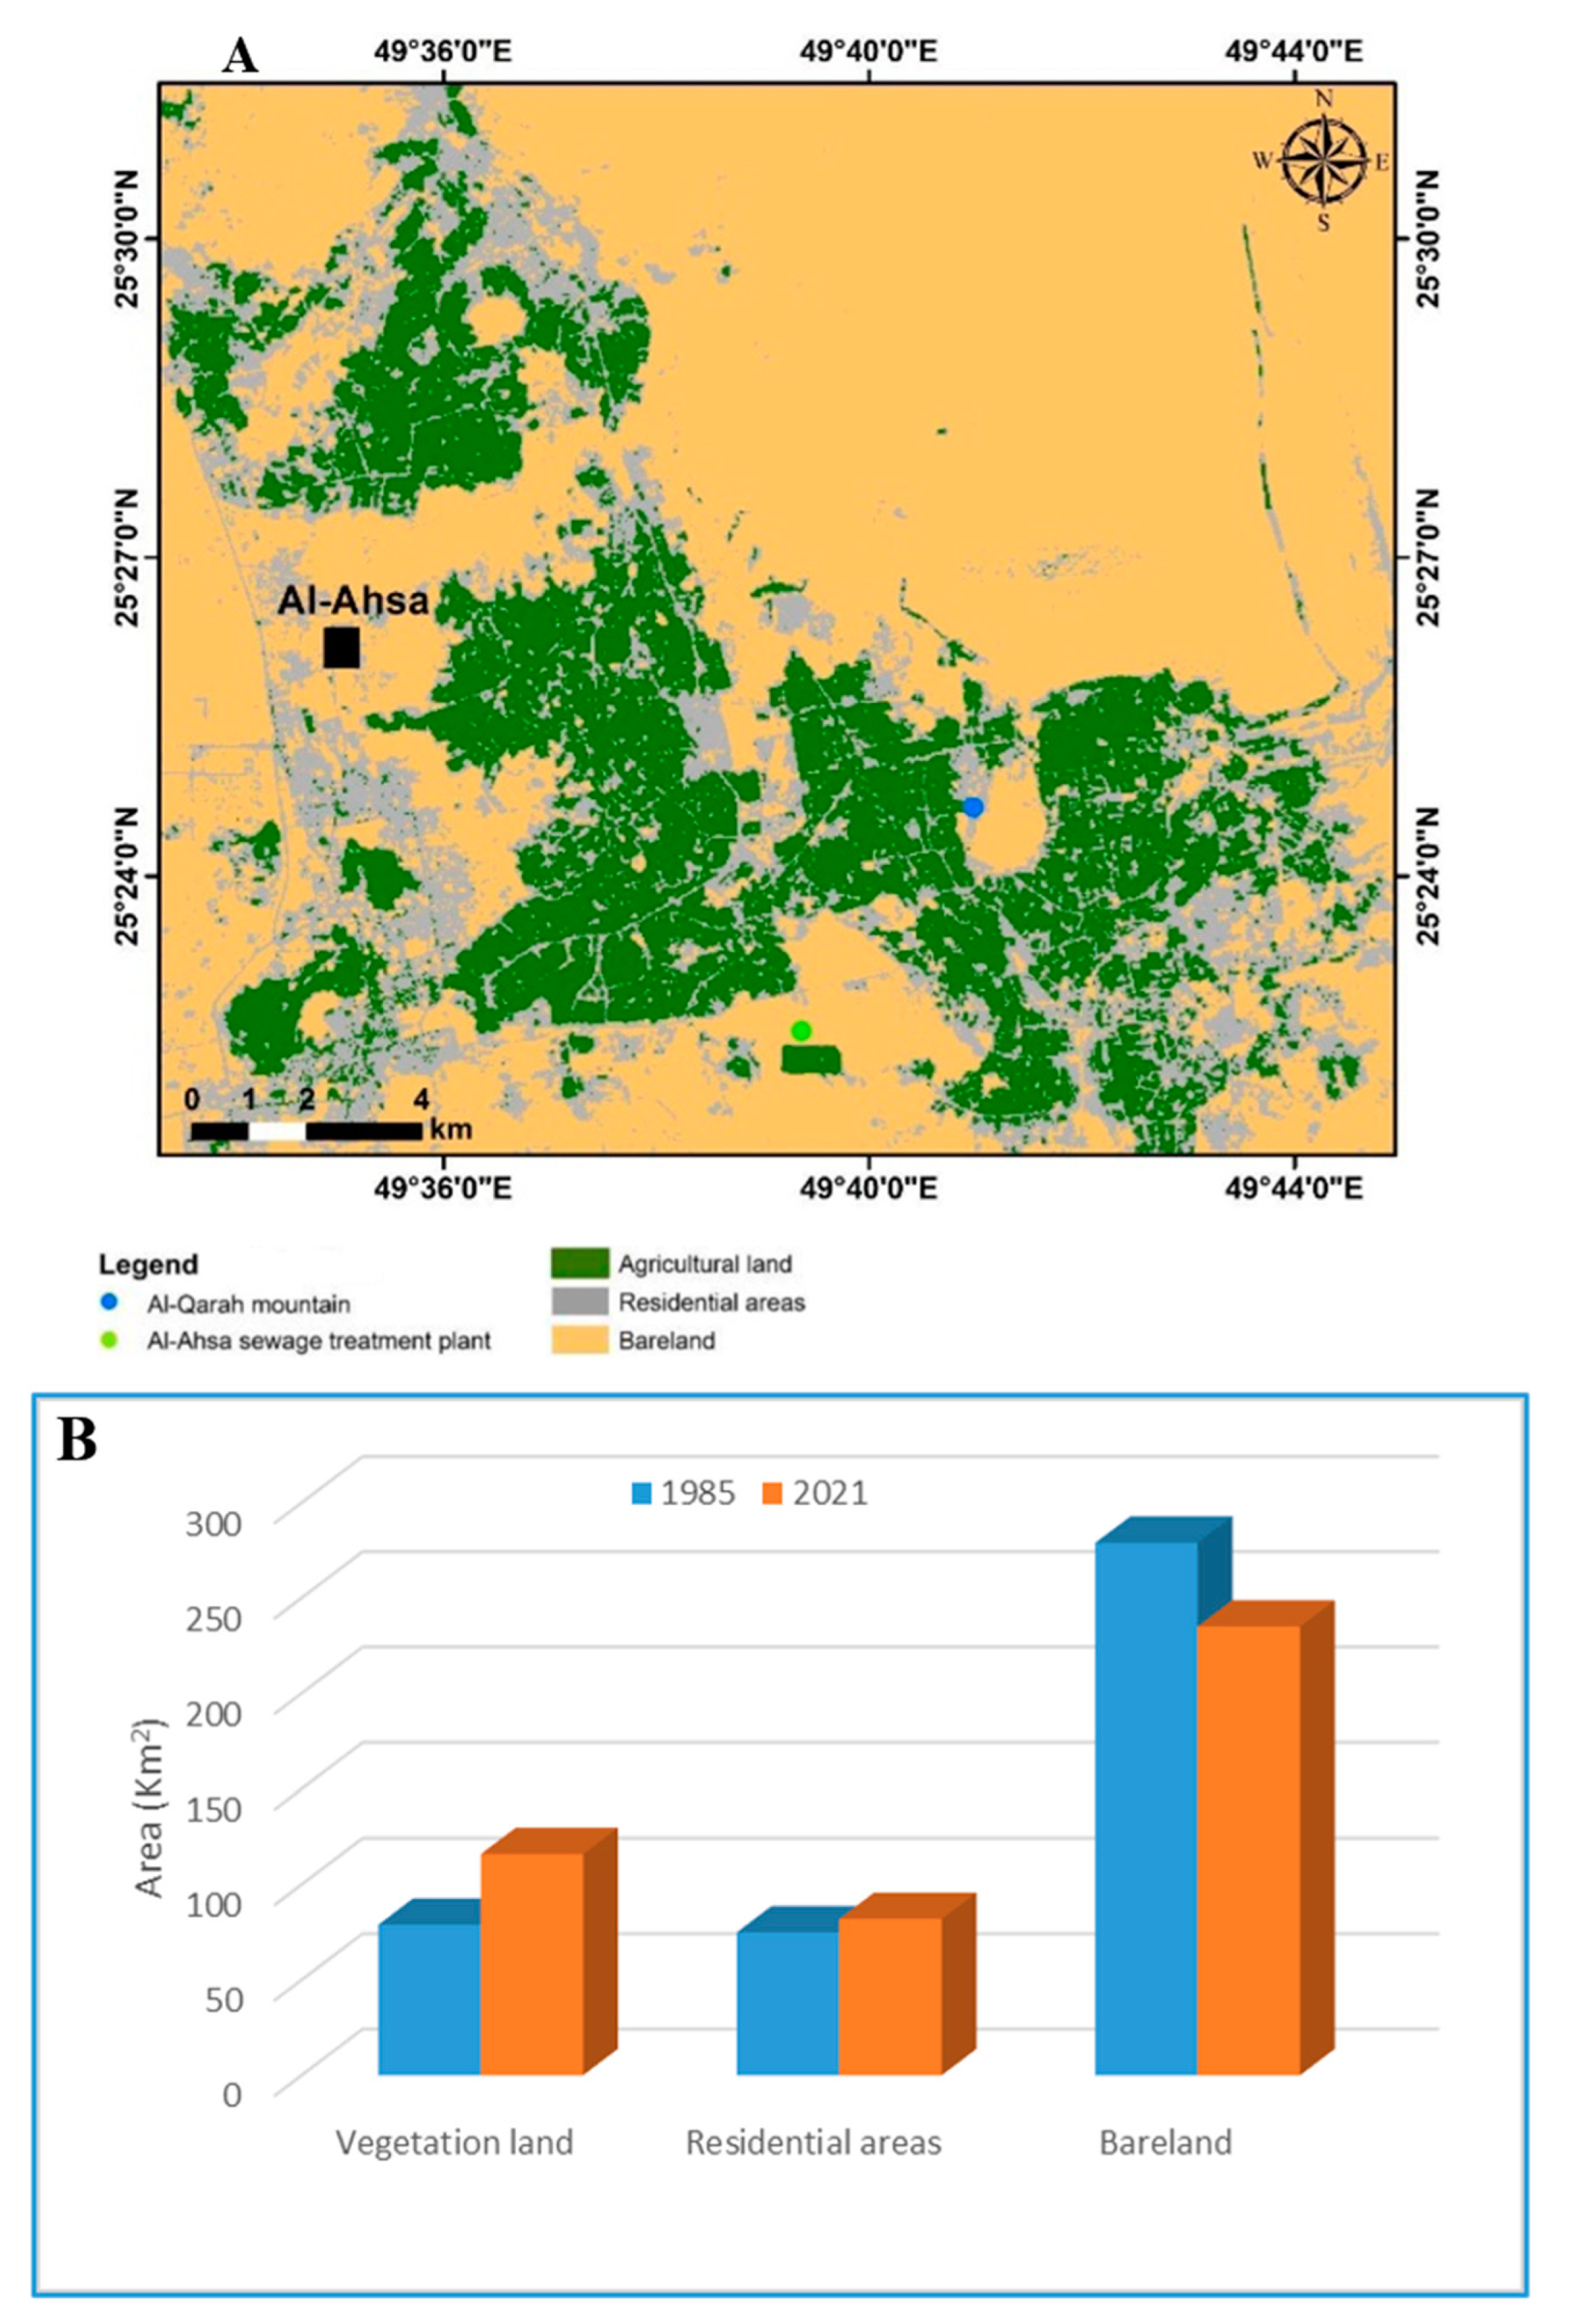
3.1. Land Use Pattern

Al-Ahsa is the largest agricultural area in Saudi Arabia’s Eastern Province, covering ~12,000 hectares. Karrar et al. [29] mentioned deep, non-saline, homogenized loamy soils (Eutrochrepts) in a low plain watered by many fresh-water springs in Al-Ahsa plain, some patches have a high water-table, where the soils are wet (Haplaquepts). The Al-Ahsa oasis is an arid area and shows diverse variations in temperatures, humidity, evaporation, and precipitation throughout the year, with long and extremely hot summers. The average temperature and evaporation rates are extremely high at 43 °C and 12 mm, respectively, and the humidity decreases to a minimum of 20%. Alternatively, winters are very cold with daytime and nighttime temperatures of 20–28 °C and 8–10 °C, respectively. The average annual rainfall amount, average humidity, and evaporation rate are 147 mm, 71%, and 5 mm, respectively. Landsat data have been available for a long time and are archived more frequently than other types of remote sensing data [30]. The comparison between the Landsat-8 image acquired on 09 November 2021 (Figure 1) and the Landsat-5 TM image obtained on 06 January 1985 (Figure 2) clarifies that vegetation, residential, and barren lands are the primary land use pattern in Al-Ahsa (Figure 2A,B). During 1985–2021, the evolution of the study area for these main classes was examined. In 1985, the main LULC classes in Al-AHsa were 79 km2 of vegetation, 75 km2 of residential, and 279 km2 of barren land. The total vegetative area in 2021 was 116 km2 (a 32% increase), the residential area was 82 km2 (a 9% increase), and the bare land area was 235 km2 (a 16% decrease).

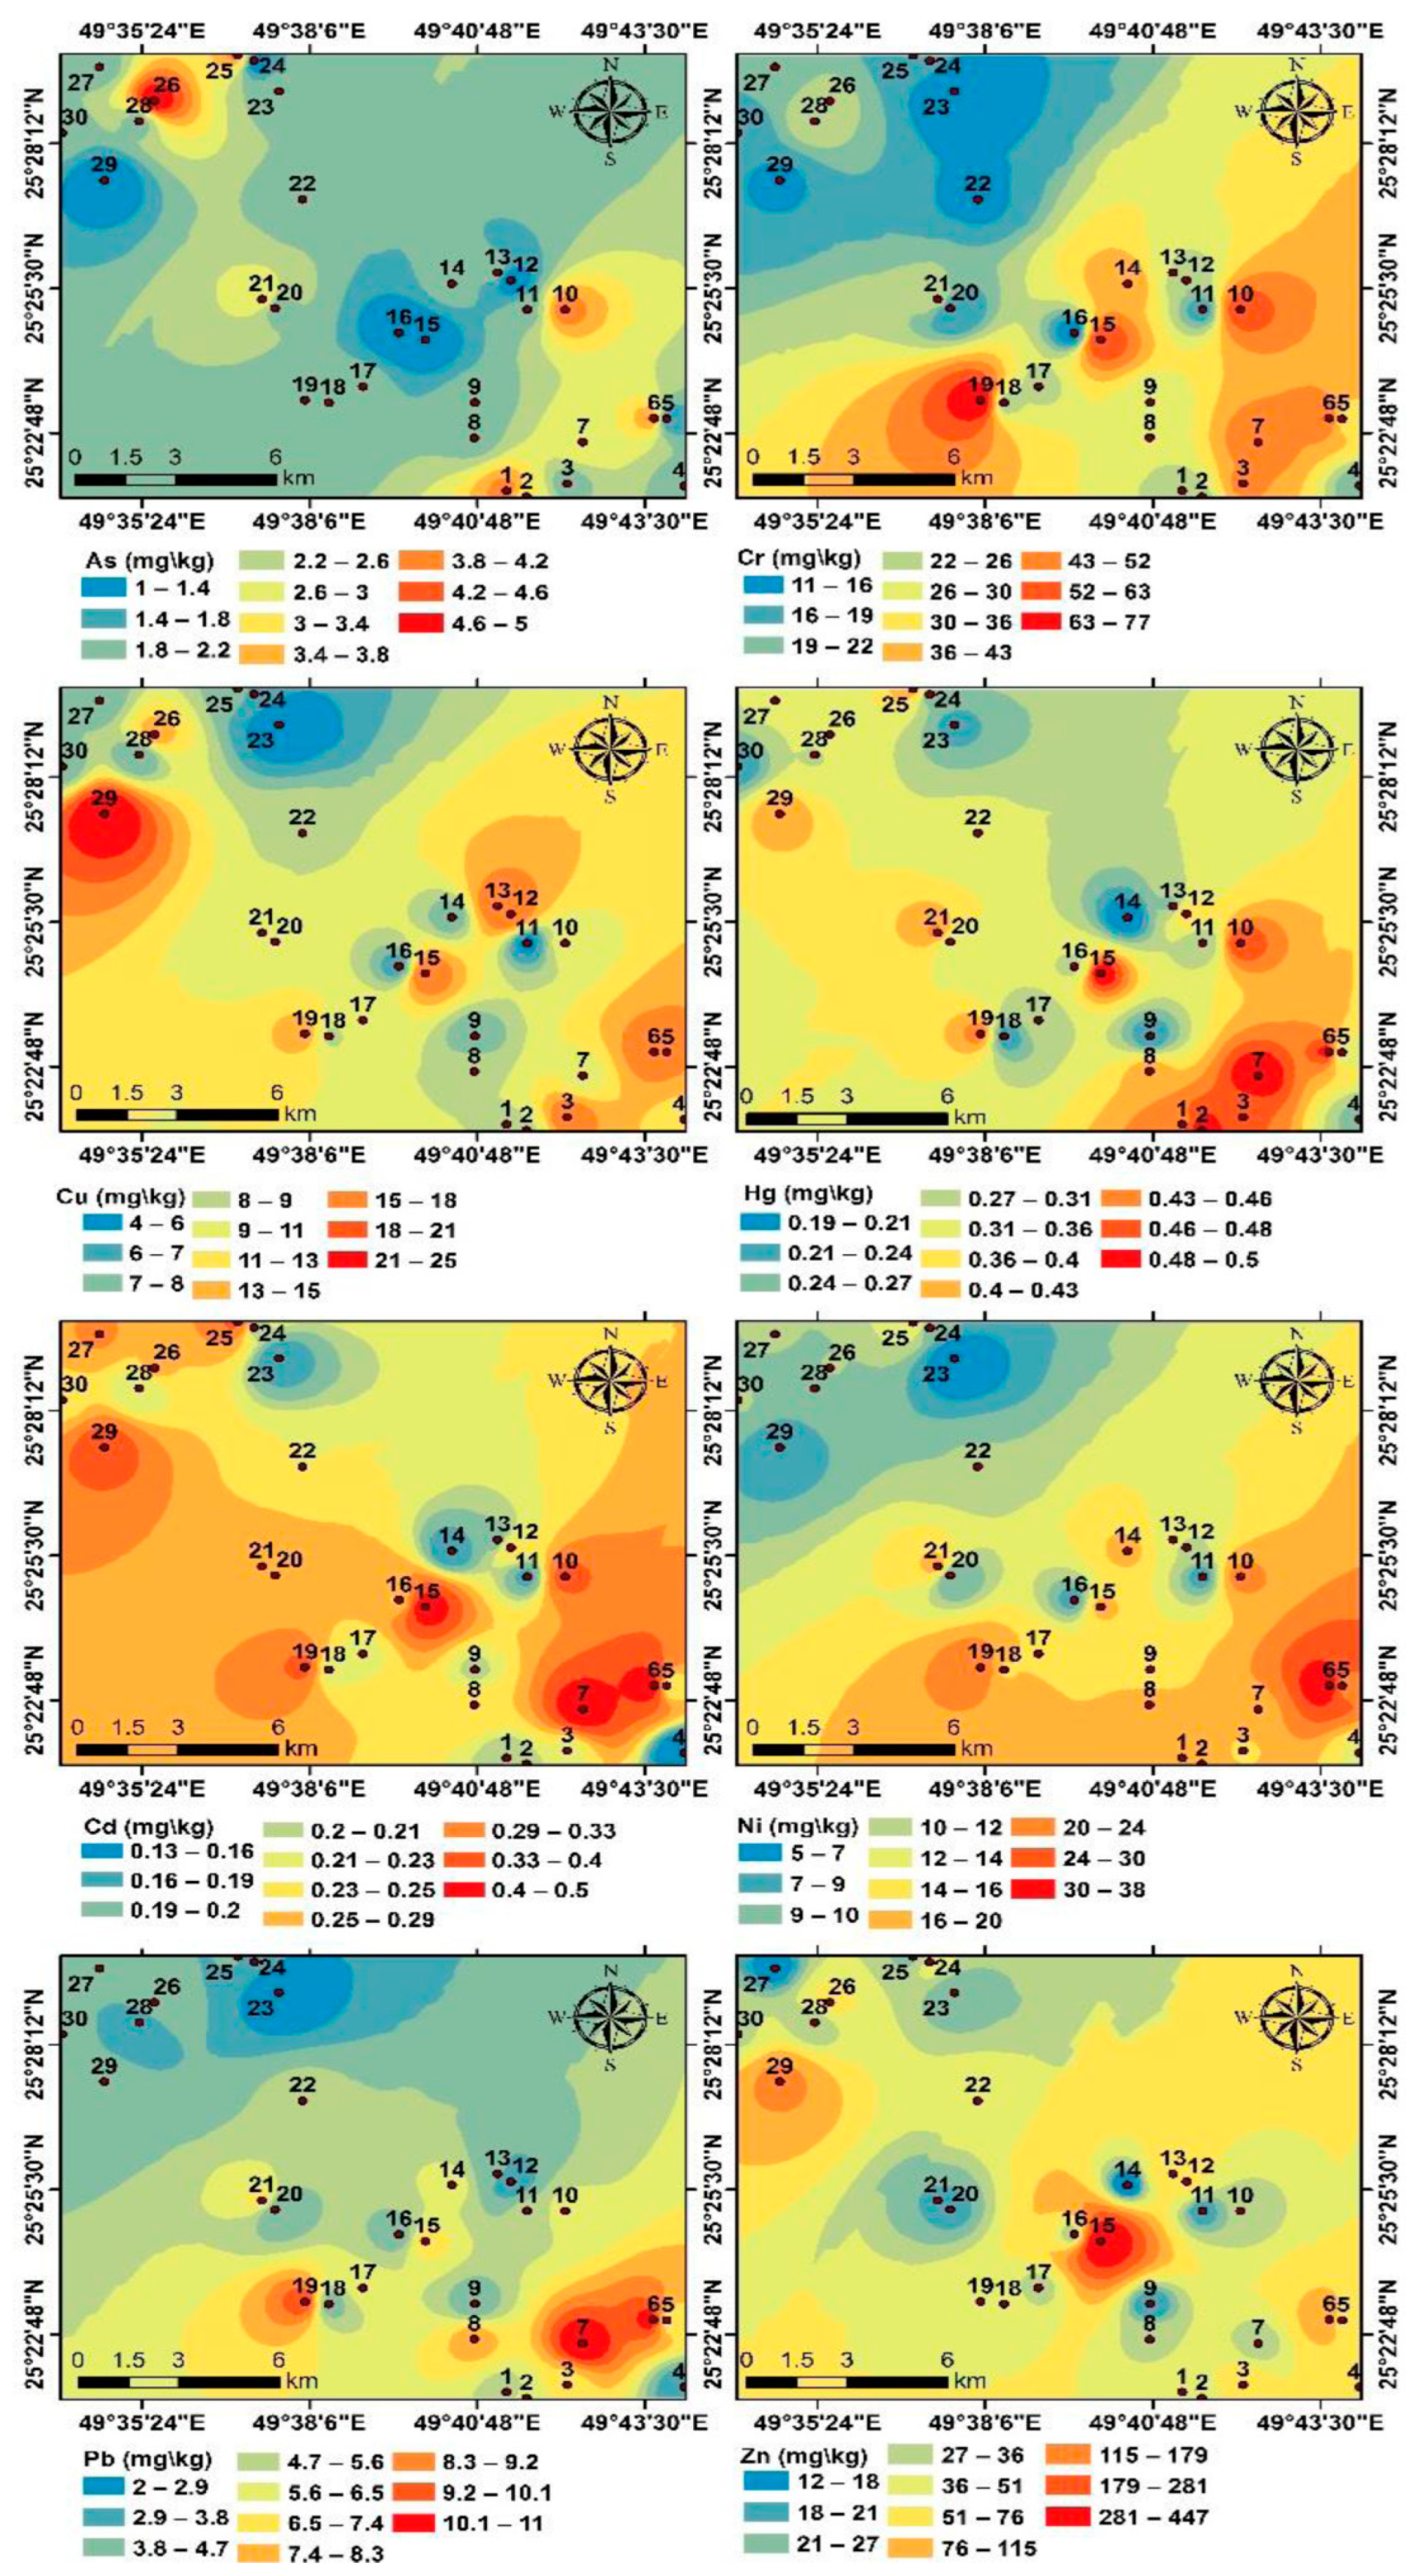
3.2. Distribution and Contamination of Potentially Toxic Elements

Soil samples S3, S7, S9, S14, and S27 were collected from farms irrigated using treated sewage water, while the remaining samples were collected from farms irrigated with groundwater. The average PTE concentrations (mg kg−1) are listed in the following descending order: Zn (54.43) > Cr (28.67) > Ni (14.53) > Cu (10.83) > Pb (5.23) > As (2.27) > Hg (0.35) > Cd (0.26). S6 reported the highest concentrations of Pb, Cd, Hg, and Ni (11.0, 0.49, 0.50, and 38.0 mg/kg, respectively). S15 and S26 reported the highest concentrations of Zn and As, respectively (447 and 5.00 mg/kg−1, respectively). The highest recorded Cr and Cu levels were seen in S19 and S25 (77.0 and 25.0 mg/kg, respectively). S14, S16, and S23 reported the lowest PTE concentrations (Table S2). The PTEs in the soil samples were examined using the Q-mode HCA, a classification method for identifying clusters of variables with similar features [31]. Q-mode HCA grouped the soil samples into three clusters (Figure 3). The first cluster included S6 and S29, which reported the highest values of Cu, Pb, Cd, Hg, and Ni. The second cluster comprised S15, which reported the highest values of Zn. The third cluster comprised the remaining soil samples. Samples of the third cluster reported the lower values of the PTEs, except As in S26 and Cr in S19.
Figure 4 shows the spatial distribution of the PTEs in the study area. The lowest PTEs were recorded in farms located in the central and northern parts of the area (S14, S16, and S23). By contrast, farms in the southeast part showed higher concentrations of Pb, Cd, Hg, and Ni, while As and Cu increased in the northwestern part of the study area. Table 2 displays the average PTE concentrations found in the soil samples, along with a comparison to other soil types in Saudi Arabia and the maximum admissible concentrations. The average levels of PTEs were below the maximum admissible concentrations [32]. Furthermore, the average values of Ni, Zn, As, Cu, and Cr in our samples were lower than those found in the case of palm farm soils from Al Uyaynah-Al Jubailah [33] and Wadi Jazan, Saudi Arabia [34]. Overall, the average Hg value in the study area was higher than in Al Uyaynah soil [33], but lower than in Al-Ammariah soil [35].

3.3. Risk Assessment of Potentially Toxic Elements

Pollution indices can provide a better geochemical assessment of environmental soil conditions [36,37,38]. Results of the EF (Table 3) indicated that the Al-Ahsa soils are significantly enriched with Hg (average EF = 17.27), moderately severe enriched with As (average EF = 5.41), moderately enriched with Cd (average EF = 3.56), and minorly to negligibly enriched with the remaining PTEs (average EF less than 3). Some individual samples exhibited high enrichment; for example, S10 showed very high Hg enrichment (EF = 26.50) and S15 had significant Zn enrichment (EF = 20.01). The high EF values indicated anthropogenic activities in the case of these PTEs, mostly from the extensive use of fertilizers and insecticides [32,39,40].
The Igeo values were used to assess PTEs in the Al-Ahsa soil. The soil was moderately polluted with Hg (average Igeo = 1.68), and unpolluted to moderately polluted with Cd (average Igeo = 0.10). The soil samples were unpolluted with the remaining PTEs (average Igeo ˂ zero). The Al-Ahsa soil’s quality and the existence of PTEs were described using the CF. The CF results in the study area indicated a considerable contamination with Hg (average CF = 4.24), moderate contamination with As (average CF = 1.32), and low contamination with the rest PTEs (average Cf < 1). However, S15 and S25 yielded CF values of 4.71 for Zn, suggesting considerable contamination of the two PTEs. The PLI was used to assess PTEs at a particular site [41,42]. The mean PLI results suggested that the investigated area was not contaminated with PTEs (PLI < 1).
The potential ecological risk index is applied to assess the impact of PTE contamination on a site’s environment [42,43]. The RI ranged from 125.53 in S14 to 325.42 in S6, with an average of 215.13, indicating moderate ecological risk for the Al-Ahsa soil (Table S2). S6, S7, and S15 showed a considerable ecological risk (RI greater than 300). The average values of the risk factor (Eri) suggest that Hg presents a considerable ecological concern (Eri = 169.58) and low potential ecological risk for the other PTEs (Eri = 40). Hg showed a high ecological risk in S1–S3, S6–S8, S10, S12, S15, S19, S21, S25, S26, and S29.
Pearson’s correlation coefficient is most frequently used for determining a linear relation between two variables. This study measured the correlation between PTEs using Pearson’s coefficient so that their possible sources might be determined [44,45]. Table 4 lists the correlation coefficient matrix. The positive correlations between several pairs of the PTEs, such as Pb–Cr, Pb –Hg, Pb –Cd, Pb –Ni, and Cu-Zn, indicated similar sources for these PTEs, mostly of natural sources owing to the weathering of clay minerals (hydrous aluminum silicates) in the soil [46,47]. Alternatively, Cu and Zn showed weak and negative correlations with the remaining HMs, indicating different sources [48].
PCA enables researchers to summarize large datasets with many variables into fewer principal components that can be easily visualized and analyzed. This method contributes to our understanding of the main processes involved in soil contamination and its possible sources [49]. Herein, PCA revealed two principal components that cumulatively explained 71.32% of the total data variance (Table 5, Figure 5). The first component accounted for 51.85% of the total variance. It is strongly associated with Cr, Cu, Hg, Cd, Ni, and Pb. In comparison, the second component accounted for 19.48% of the total variance and was strongly associated with Zn and Cu. Results of PCA indicated mixed natural and anthropogenic sources for the investigated PTEs. Agricultural chemicals and overuse of fertilizers might be the potential anthropogenic sources of Hg, As, Cd, and Zn (average EF values >2) [50,51,52]. Moreover, the use of groundwater from different aquifers for soil irrigation, with their differences in the composition, might cause a difference in PTE concentrations among studied soil samples.

4. Conclusions

The land use pattern and hazardous concentrations of PTEs in agriculture soil of the Al-Ahsa oasis were examined using Landsat images and several pollution indices and multivariate tools. The assessment revealed that the investigated soil was severely enriched, highly contaminated, and had a high environmental risk with Hg. The findings of the RI indicated that the soil samples suggested a moderate PTE risk. Cu, As, Cd, and Pb enrichment ranged from moderate to negligible in the study area. Multivariate statistical methods indicated combined natural and human effects for the PTE sources, primarily originating from the weathering of earth materials and atmospheric deposition, as well as sewage and agricultural activities. No fundamental difference was observed between soil samples collected from farms irrigated using treated sewage water and those irrigated using groundwater with respect to PTE contamination. The concentration levels of PTEs in the soil of Al-Ahsa need to be checked regularly to measure the accumulation of HM and prevent their increase, specifically Hg, As, and Sr. Moreover, farmers should use biofertilizers and manure and reduce their dependency on chemical fertilizers and pesticides.

Supplementary Materials

The following supporting information can be downloaded at: https://www.mdpi.com/article/10.3390/su15010659/s1, Table S1: Percentage of the size fraction for the different mangrove sediment samples; Table S2: Land use pattern, coordination of the sample sites, the concentrations of the analyzed metals, and the results of PLI and RI.

Author Contributions

Conceptualization, T.A. and A.S.E.-S.; methodology, T.A. and A.S.E.-S.; software, T.A. and A.S.E.-S.; writing—original draft preparation, T.A. and A.S.E.-S.; writing—review and editing, T.A. and A.S.E.-S. All authors have read and agreed to the published version of the manuscript.

Funding

This research was funded by Deputyship for Research & Innovation, Ministry of Education in Saudi Arabia, project no. (IFKSURG-2-449).

Informed Consent Statement

Not applicable.

Data Availability Statement

All data generated or analyzed during this study are included in this published article and its Supplementary Information Files.

Acknowledgments

The authors extend their appreciation to the Deputyship for Research & Innovation, Ministry of Education in Saudi Arabia for funding this research work through the project no. (IFKSURG-2-449). Moreover, the authors thank the anonymous reviewers for their valuable suggestions and constructive comments.

Conflicts of Interest

The authors have no relevant financial or non-financial interest to disclose.

References

  1. Su, C.; Jiang, L.; Zhang, W.J. A review on heavy metal contamination in the soil worldwide: Situation, impact and remediation techniques. Environ. Skept. Crit. 2014, 3, 24–38. [Google Scholar]
  2. Nour, H.E.; El-Sorogy, A.S. Heavy metals contamination in seawater, sediments and seashells of the Gulf of Suez, Egypt. Environ. Earth Sci. 2020, 79, 274. [Google Scholar] [CrossRef]
  3. Zhang, W.J.; Jiang, F.B.; Ou, J.F. Global pesticide consumption and pollution: With China as a focus. Proc. Int. Acad. Ecol. Environ. Sci. 2011, 1, 125–144. [Google Scholar]
  4. Alfaifi, H.J.; El-Sorogy, A.S.; Qaysi, S.; Kahal, A.; Almadani, S.; Alshehri, F.; Zaidi, F.K. Evaluation of heavy metal contamination and groundwater quality along the Red Sea coast, southern Saudi Arabia. Mar. Pollut. Bull. 2021, 163, 111975. [Google Scholar] [CrossRef] [PubMed]
  5. IARC. Monographs on the Evaluation of Carcinogenic Risks to Humans. Arsenic, Metals, Fibers and Dusts. A Review of Human Carcinogens; World Health Organization: Lyon, France, 2012; Volume 100C.
  6. Shahid, M.; Niazi, N.K.; Dumat, C.; Naidu, R.; Khalid, S.; Rahman, M.M.; Bibi, I. A metal analysis of the distribution, sources and health risks of arsenic contaminated groundwater in Pakistan. Environ. Pollut. 2018, 242, 307–319. [Google Scholar] [CrossRef]
  7. Ahmed, S.A.; Faruquee, M.H.; Khan, M.H. Twenty years of arsenic contamination and Arsenicosis patients in a village of Bangladesh. Am. J. Public Health Res. 2020, 8, 190–196. [Google Scholar] [CrossRef]
  8. Jyothi, N.R. Heavy Metal Sources and Their Effects on Human Health. In Heavy Metals—Their Environmental Impacts and Mitigation; IntechOpen: London, UK, 2020; pp. 1–12. [Google Scholar] [CrossRef]
  9. Jyothi, N.R.; Mohamed Farook, N.A. Heavy Metal Toxicity in Public Health; IntechOpen: London, UK, 2020. [Google Scholar] [CrossRef] [Green Version]
  10. Suzzi, C.V.; Kruse, D.; Harrington, J.; Levin, K.; Meliker, J.R. Is urinary cadmium a biomarker of long-term exposure in humans? A review. Curr. Environ. Health Rep. 2016, 3, 450–458. [Google Scholar] [CrossRef]
  11. Bakulski, K.M.; Hu, H.; Park, S.K. Chapter 51: Lead, cadmium and Alzheimer’s disease. Neurosci. Dement. 2020, 2, 813–830. [Google Scholar]
  12. Ali, I.; Hasan, M.A.; Alharbi, O.M.L. Toxic metal ions contamination in the groundwater, Kingdom of Saudi Arabia. J. Taibah Univ. Sci. 2020, 14, 1571–1579. [Google Scholar] [CrossRef]
  13. Ashraf, A.M. The National Soil Survey and Land Classification Projects; PAO/Ministry of Agriculture and Water: Riyadh, Saudi Arabia, 1991.
  14. Shadfan, H.; Mashhady, A.; Eter, A.; Hussen, A.A. Mineral Composition of Selected Soils in Saudi Arabia. J. Soil Nutr. Soil Sci. 1984, 147, 649–802. [Google Scholar] [CrossRef]
  15. Assubaie, F.N. Assessment of the levels of some heavy metals in water in Alahsa Oasis farms, Saudi Arabia, with analysis by atomic absorption spectrophotometry. Arab. J. Chem. 2015, 8, 240–245. [Google Scholar] [CrossRef]
  16. Al-Barrak, S.A.; Al-Badawi, M. Properties of some salt affected soil in Al-Hassa. Saudi Arabia. Arid. Soil Res. Rehabil. 1988, 2, 85–95. [Google Scholar]
  17. Al-Saeedi, A.H. Characterizing physical and hydraulic properties of soils in Al-Ahsa, Kingdom of Saudi Arabia. Saudi J. Biol. Sci. 2022, 29, 3390–3402. [Google Scholar] [CrossRef] [PubMed]
  18. Al Tokhais, A.S.; Rausch, R. The hydrogeology of Al Hassa Springs. In Proceedings of the 3rd International Conference on Water Resources and Arid Environments and the 1st Arab Water Forum, Riyadh, Saudi Arabia, 16–19 November 2008. [Google Scholar]
  19. Al-Turki, T.A.; Basahi, M.A. Assessment of ISSR Based Molecular Genetic Diversity of Hassawi Rice in Saudi Arabia. Saudi J. Biol. Sci. 2015, 22, 591–599. [Google Scholar] [CrossRef] [PubMed] [Green Version]
  20. Almeida, D.M.; Gregorio, G.B.; Oliveira, M.M.; Saibo, N.J.M. Five Novel Transcription Factors as Potential Regulators of OsNHX1 Gene Expression in a Salt Tolerant Rice Genotype. Plant Mol. Biol. 2017, 93, 61–77. [Google Scholar] [CrossRef] [PubMed]
  21. Mohammed, M.S.; Sallam, A.A.M.; Aleid, S.M. Assessment of soil heavy metal hazards of cultivated soil irrigated with different irrigation water qualities in Al-Hassa Oasis, Kingdom of Saudi Arabia. World Rural Observ. 2014, 6, 12–22. [Google Scholar]
  22. AlMulla, A.A.; Dahlawi, S.; Randhawa, M.A.; Zaman Qu Chen, Y.; Faraj, T.K. Toxic Metals and Metalloids in Hassawi Brown Rice: Fate during Cooking and Associated Health Risks. Int. J. Environ. Res. Public Health 2022, 19, 12125. [Google Scholar] [CrossRef]
  23. Kowalska, J.B.; Mazurek, R.; Gąsiorek, M.; Zaleski, T. Pollution indices as useful tools for the comprehensive evaluation of the degree of soil contamination–A review. Environ. Geochem. Health 2018, 40, 2395–2420. [Google Scholar] [CrossRef] [Green Version]
  24. Muller, G. Index of geoaccumulation in sediments of the Rhine River. GeoJournal 1969, 2, 108–118. [Google Scholar]
  25. Hakanson, L. An ecological risk index for aquatic pollution control. A sedimentological approach. Water Res. 1980, 14, 975–1001. [Google Scholar] [CrossRef]
  26. El-Sorogy, A.S.; Youssef, M.; Al-Kahtany, K. Integrated assessment of the Tarut Island coast, Arabian Gulf, Saudi Arabia. Environ. Earth Sci. 2016, 75, 1336. [Google Scholar] [CrossRef]
  27. El-Sorogy, A.S.; Youssef, M.; Al-Kahtany, K.; Al-Otaibi, N. Distribution of intertidal molluscs along Tarut Island coast, Arabian Gulf, Saudi Arabia. Pakistan J. Zool. 2016, 48, 611–623. [Google Scholar]
  28. Harikrishnan, N.; Ravisankar, R.; Chandrasekaran, A.; Suresh Gandhi, M.; Kanagasabapathy, K.V.; Prasad, M.V.R.; Satapathy, K.K. Assessment of heavy metal contamination in marine sediments of East Coast of Tamil nadu affected by different pollution sources. Mar. Pollut. Bull. 2017, 121, 418–424. [Google Scholar] [CrossRef] [PubMed]
  29. Karrar, G.; Batanouny, K.H.; Mian, M. A Rapid Assessment of the Impacts of the Iraq-Kuwait Conflict on Terrestrial Ecosystems; Part Three: Kingdom of Saudi Arabia, a Report Prepared for the United Nations Environment Programme; United Nations Environment Programme: Nairobi, Kenya, 1991; p. 67. [Google Scholar]
  30. Hansen, M.C.; Potapov, P.V.; Pickens, A.H.; Tyukavina, A.; Hernandez-Serna, A.; Zalles, V.; Kommareddy, A. Global land use extent and dispersion within natural land cover using Landsat data. Environ. Res. Lett. 2022, 17, 034050. [Google Scholar] [CrossRef]
  31. Hussin, N.H.; Yusoff, I.; Wan Muhd Tahir, W.Z.; Mohamed, I.; Ibrahim, A.I.N.; Rambli, A. Multivariate statistical analysis for identifying water quality and hydrogeochemical evolution of shallow groundwater in Quaternary deposits in the Lower Kelantan River Basin, Malaysian Peninsula. Environ. Earth Sci. 2016, 75, 1081. [Google Scholar] [CrossRef]
  32. Kabata-Pendias, A. Trace Elements of Soils and Plants, 4th ed.; CRC Press: Boca Raton, FL, USA; Taylor & Francis Group, LLC: Abingdon, UK, 2011; p. 505. [Google Scholar]
  33. Alharbi, T.; El-Sorogy, A.S. Spatial distribution and risk assessment of heavy metals pollution in soils of marine origin in central Saudi Arabia. Mar. Pollut. Bull. 2021, 170, 112605. [Google Scholar] [CrossRef] [PubMed]
  34. Al-Boghdady, A.A.; Hassanein, K.M.A. Chemical analysis and environmental impact of heavy metals in soil of wadi Jazan area, southwest of Saudi Arabia. Appl. Ecol. Environ. Res. 2019, 17, 7067–7084. [Google Scholar] [CrossRef]
  35. Alarifi, S.S.; El-Sorogy, A.S.; Al-kahtany, K.; Alotaibi, M. Contamination and environmental risk assessment of potentially toxic elements in soils of palm farms in Northwest Riyadh, Saudi Arabia. Sustainability 2022, 14, 15402. [Google Scholar] [CrossRef]
  36. Caeiro, S.; Costa, M.H.; Ramos, T.B.; Fernandes, F.; Silveira, N.; Coimbra, A.; Medeiros, G.; Painho, M. Assessing heavy metal contamination in Sado estuary sediment: An index analysis approach. Ecol. Indic. 2005, 5, 151–169. [Google Scholar] [CrossRef]
  37. Kowalska, J.; Mazurek, R.; Gasiorek, M.; Setlak, M.; Zaleski, T.; Waroszewski, J. Soil pollution indices conditioned by medieval metallurgical activity: A case study from Krakow (Poland). Environ. Pollut. 2016, 218, 1023–1036. [Google Scholar] [CrossRef]
  38. Weissmannová, H.D.; Pavlovský, J. Indices of soil contamination by heavy metals –methodology of calculation for pollution assessment (minireview). Environ. Monit. Assess. 2017, 189, 616. [Google Scholar] [CrossRef] [PubMed]
  39. Kitagishi, K.; Yamane, I. Heavy Metal Pollution in Soils of Japan; Japan Science Society Press: Tokyo, Japan, 1981; p. 302. [Google Scholar]
  40. Al-Kahtany, K.; El-Sorogy, A.S.; Al-Kahtany, F.; Youssef, M. Heavy metals in mangrove sediments of the central Arabian Gulf shoreline, Saudi Arabia. Arab. J. Geosci. 2018, 11, 155. [Google Scholar] [CrossRef]
  41. Rabee, A.M.; Al-Fatlawy, Y.F.; Nameer, M. Using Pollution Load Index (PLI) and geoaccumulation index (I-Geo) for the assessment of heavy metals pollution in Tigris River sediment in Baghdad Region. Al-Nahrain. J. Sci. 2011, 14, 108–114. [Google Scholar]
  42. Hossain, M.S.; Ahmed, M.K.; Liyana, E.; Hossain, M.S.; Jolly, Y.N.; Kabir, M.J.; Akter, S.; Rahman, M.S. A case study on metal contamination in water and sediment near a coal thermal power plant on the eastern coast of Bangladesh. Environments 2021, 8, 108. [Google Scholar] [CrossRef]
  43. Nour, H.N.; Alshehri, F.; Sahour, H.; El-Sorogy, A.S.; Tawfik, M. Assessment of heavy metal contamination and health risk in the coastal sediments of Suez Bay, Gulf of Suez, Egypt. J. Afr. Earth Sci. 2022, 195, 104663. [Google Scholar] [CrossRef]
  44. El-Sorogy, A.S.; Attiah, A. Assessment of metal contamination in coastal sediments, seawaters and bivalves of the Mediterranean Sea coast, Egypt. Mar. Pollut. Bull. 2015, 101, 867–871. [Google Scholar] [CrossRef]
  45. Liu, J.; Tang, W.; Chen, G.; Lu, Y.; Feng, C.; Tu, X.M. Correlation and agreement: Overview and clarification of competing concepts and measures. Shanghai Arch. Psychiatry 2016, 28, 115–120. [Google Scholar] [CrossRef]
  46. Alharbi, T.; Al-Kahtany Kh Nour Hamdy, H.E.; Giacobbe, S.; El-Sorogy, A.S. Contamination and health risk assessment of arsenic and chromium in coastal sediments of Al-Khobar area, Arabian Gulf, Saudi Arabia. Mar. Pollut. Bull. 2022, 185, 114255. [Google Scholar] [CrossRef]
  47. El-Sorogy, A.S.; Youssef, M.; Al-Kahtany, K.; Saleh, M.M. Distribution, source, contamination, and ecological risk status of heavy metals in the Red Sea-Gulf of Aqaba coastal sediments, Saudi Arabia. Mar. Pollut. Bull. 2020, 158, 111411. [Google Scholar] [CrossRef]
  48. Alharbi, T.; Alfaifi, H.; Almadani, S.; El-Sorogy, A. Spatial distribution and metal contamination in the coastal sediments of Al-Khafji area, Arabian Gulf, Saudi Arabia. Environ. Monit. Assess. 2017, 189, 634. [Google Scholar] [CrossRef]
  49. Jolliffe, I.T.; Cadima, J. Principal component analysis: A review and recent developments. Philos. Trans. A Math. Phys. Eng. Sci. 2016, 374, 20150202. [Google Scholar] [CrossRef] [PubMed] [Green Version]
  50. Alharbi, T.; El-Sorogy, A. Assessment of metal contamination in coastal sediments of Al-Khobar area, Arabian Gulf, Saudi Arabia. J. Afr. Earth Sci. 2017, 129, 458–468. [Google Scholar] [CrossRef]
  51. Javed, T.; Ahmad, N.; Mashiatullah, A. Heavy metals contamination and ecological risk assessment in surface sediments of Namal Lake, Pakistan. Pol. J. Environ. Stud. 2018, 27, 675–688. [Google Scholar] [CrossRef] [PubMed]
  52. Kahal, A.; El-Sorogy, A.S.; Qaysi, S.; Almadani, S.; Kassem, O.M.; Al-Dossari, A. Contamination and ecological risk assessment of the Red Sea coastal sediments, southwest Saudi Arabia. Mar. Pollut. Bull. 2020, 154, 111125. [Google Scholar] [CrossRef]
Figure 1. Location map of the study area and soil sampling sites in Al-Ahsa Oasis. Source: Landsat-5 TM image obtained on 9 November 2021.
Sustainability 15 00659 g001
Figure 2. (A) Land use pattern of the Al-Ahsa area using Landsat-image obtained in 1985. (B) Histogram summarizing a comparison of the land use pattern during 1985 and 2021.
Sustainability 15 00659 g002
Figure 3. A dendrogram of the Al-Ahsa soil samples.
Sustainability 15 00659 g003
Figure 4. The maps represent the distribution of the PTEs in the Al-Ahsa soil.
Sustainability 15 00659 g004
Figure 5. Factor analysis and distribution of HMs in two component plots.
Sustainability 15 00659 g005
Table 1. Pollution indices and their classifications.
EFEF < 1No enrichmentCFCf < 1
Low contamination
EF < 3Minor enrichment1 ≤ Cf <3
Moderate contamination
EF = 3–5Moderate enrichment3 ≤ Cf < 6
Considerable contamination
EF = 5–10 Moderately severe enrichmentCf ≥ 6Very high contamination
EF = 10–25Severe enrichmentPLIPLI < 1Unpolluted
EF = 25–50Very severe enrichmentPLI > 1Polluted
EF > 50Extremely severe enrichmentEri and RIEri < 40 and Ri < 150low ecological risk
IgeoI-geo < 0Unpolluted40 ≤ Eri < 80 and 150 ≤ RI < 300Moderate ecological risk
0 < Igeo < 1Unpolluted to moderately polluted80 ≤ Eri < 160 and 300 ≤ Ri < 600Considerable ecological risk
1 < Igeo < 2Moderately polluted160 ≤ Eri < 320High ecological risk
2 < Igeo < 3Moderately to strongly pollutedEri > 320 and RI ≥ 600Very high ecological risk
3 < Igeo > 4Strongly polluted
4 < Igeo < 5Strongly to very strongly polluted
Igeo > 5Very strongly polluted conditions
Table 2. Average PTE concentration (mg/kg) in the study area and other local and national sediment quality guidelines.
Location and ReferencesNiZnCuAsCdHgPbCr
Al-Ahsa, Eastern Saudi Arabia (present study)14.5354.4310.832.270.260.355.2328.67
Maximum allowable concentrations [32]603001502055300200
Al Uyaynah soil, Saudi Arabia [33]19.2564.3310.5613.80.380.1128.4830.18
Wadi Jazan, Saudi Arabia [34]48.6675.8072.8514.1320.97 19.4177.22
Al-Ammariah area, northwest Riyadh [35]26.9452.1611.363.780.250.505.0819.97
Table 3. Minimum, maximum, and average values of EF, Igeo, CF, and Eri.
EFIgeoCFEri
Min.Max.Avg.Min.Max.Aver.Min.Max.Aver.Min.Max.Aver.
Pb0.452.241.05−2.01−0.31−1.160.100.550.260.502.751.33
Cd1.896.383.56-0.550.800.100.431.670.8813.0050.0026.38
Zn0.6320.012.19−1.781.84−0.690.134.710.550.134.710.69
Ni0.391.711.00−2.16−0.14−1.210.090.660.250.523.931.55
Cu0.401.700.93−4.08−1.43−2.840.090.560.230.442.781.23
As1.7812.295.41−1.350.97−0.330.592.941.325.8829.4113.60
Hg8.4126.5017.271.122.081.682.296.024.2491.57240.96169.58
Cr0.553.771.37−1.730.21−0.950.130.930.330.271.860.71
Table 4. Correlation matrix for PTEs of the soil samples.
AsCrCuHgCdNiPbZn
As1
Cr0.1821
Cu−0.1050.3441
Hg0.383 *0.550 **0.463 *1
Cd0.2750.594 **0.410 *0.704 **1
Ni0.396 *0.718 **0.2930.556 **0.514 **1
Pb0.3020.768 **0.2720.634 **0.650 **0.813 **1
Zn−0.2210.403 *0.531 **0.3590.467 **0.1600.1881
* Correlation is significant at the 0.05 level (2-tailed). ** Correlation is significant at the 0.01 level (2-tailed).
Table 5. Principal components for the investigated PTEs.
Component
12
As0.355−0.724
Cr0.840−0.007
Cu0.5420.588
Hg0.829−0.023
Cd0.8290.084
Ni0.816−0.305
Pb0.864−0.242
Zn0.4840.727
% of Variance51.84619.475
Cumulative %51.84671.321
Disclaimer/Publisher’s Note: The statements, opinions and data contained in all publications are solely those of the individual author(s) and contributor(s) and not of MDPI and/or the editor(s). MDPI and/or the editor(s) disclaim responsibility for any injury to people or property resulting from any ideas, methods, instructions or products referred to in the content.

