Abstract
Farmer households in tourist villages have been severely impacted by the COVID-19 pandemic, and the recovery of livelihood is proving difficult. In order to improve farmer households’ ability to cope with external shocks, we have applied the theoretical framework of resilience to study farmer households’ livelihood in ethnic tourism villages. Based on the survey data of 480 farmer households from 10 ethnic tourism villages in the Wuling Mountain area, this study constructs a livelihood resilience evaluation index system from three of the following dimensions: buffer capacity, adaptive capacity, and transformation capacity. These households are classified into three types: government-led, company-led, and community-led. In addition, the livelihood resilience and its influencing factors of each type is quantitatively assessed. The results show that the livelihood resilience of farmer households administered by the government, companies, and communities is 0.2984, 0.3250, and 0.2442, respectively. Government-led farmer households have the greatest transformation capacity, company-led farmer households have the largest buffer capacity and adaptive capacity, and community-led farmer households have the least capacity across the board. The results indicated that the company-led management of tourism development is currently the most appropriate mode of management for the local area. Four factors, namely, the number of family members engaged in tourism, the training opportunities for the development of professional skills, the education level of core family members, and the type of assistance subsidy available to a family, are the dominant obstacle factors with respect to the livelihood resilience of different types of farmer households. Finally, some recommendations are made to improve the farmer households’ livelihood resilience in ethnic tourism villages based on two aspects of organization management and farmer households’ behavior. The findings of this study can be used as a theoretical foundation for future research on farmer households’ resilience to poverty in underdeveloped ethnic tourism villages.
1. Introduction
China actively encourages rural revitalization. Rural tourism is a key driving force and starting point for implementing China’s rural revitalization strategy, but it also encounters unprecedented opportunities and challenges as a “sunrise industry” and an “environmental protection green industry” with respect to promoting rural economic prosperity and increasing farmer households’ income. Farmer households are central to rural tourism and increasing farmer households’ income is both the starting point and the result of China’s rural revitalization strategy. Rural tourism, as a broader industry, has the potential to create jobs, entice migrant workers to return home to start businesses, and encourage farmer households to increase their incomes and become wealthy by participating in rural tourism. The global COVID-19 outbreak in 2019, however, has had a significant impact on domestic and international political, economic, and social development, particularly with respect to the thriving tourism industry, which is facing new challenges [1]. At the same time, the local farmer households’ livelihood system has been severely damaged, and the vulnerability of livelihood has obviously increased, which has become an important factor restricting the sustainable development of the region. Regarding the background of the normalization of epidemic prevention and control in the context of COVID-19, the recovery of farmer households’ livelihood has faced great challenges [2].
Many scholars believe that in the face of an uncertain future and external interference, resilience is the most effective way to improve livelihood and promote sustainable development [3,4,5]. Resilience theory originated from ecology and was put forward by Holling in 1973. It describes the ability of an ecosystem to return to its original state when disturbed and stressed by the system’s response to extreme disturbance and continuous pressure [6,7]. Later, many scholars introduced resilience into people’s livelihood research, thereby broadening the research field of resilience [8,9], and first put forward the concept of livelihood resilience in the early 1990s [10]. With the rapid development of research on livelihood resilience, various scholars have proposed various concepts of livelihood resilience, but they have reached a preliminary consensus that livelihood resilience refers to the ability of a community or family’s livelihood system to cope with environmental changes and recover from and transform adverse effects [11,12].
The research on livelihood resilience mainly focuses on the construction of analytical frameworks, the measurement of resilience levels, and the analysis of influencing factors. In previous studies, many scholars revealed that residents’ livelihood was affected by major external changes and challenges such as ecologically fragile areas [13,14], resettlement [15,16], and climate change [5,9]. The majority of the preceding studies are qualitative studies concerning the aforementioned concept’s explanation, theoretical discussion, and livelihood resilience construction strategies, which cannot reveal the level of livelihood resilience intuitively. As a result, some researchers have attempted to develop a suitable analytical framework for quantitatively measuring and evaluating the level of livelihood resilience. The typical ones are the livelihood resilience evaluation framework of Quandt et al. based on the five livelihood capitals of farmer households [17]; the framework of Speranza et al., which is divided into three dimensions, namely, buffer capacity, self-organization capacity, and learning capacity [8]; the analysis framework of Sina et al., which includes personal coping ability, personal well-being, access to livelihood resources, and social–material stability [10]; and the Resilience Index (RCI) resilience evaluation framework proposed by Monirul et al. [18]. Among them, the analytical framework of Speranza et al. considered the importance of people’s management and learning behavior to livelihood resilience based on previous studies’ emphasis on livelihood capital and provided an operable index system. Aside from emphasizing the stability of farmer households’ livelihood systemic function, it also emphasized this parameter’s potential ability to recover from a fragile environment, which has been widely recognized by academia and has served as the foundation for the construction of new analysis framework criteria layers and index layers in many studies conducted worldwide [8]. However, it still has some shortcomings, such as neglecting the role of managers in promoting farmer households’ livelihood resilience. Therefore, based on the original analysis framework, it is extremely important to further improve the analytical framework of livelihood resilience in accordance with the actual situation. In terms of the method used to measure resilience levels, the comprehensive index method [14,19], the Topsis method [20], and the set pair analysis method [21] are currently the mainly used methods, among which the comprehensive index method is the most widely used.
The goal of developing a framework for assessing and measuring livelihood resilience is to analyze the various factors and mechanisms that influence livelihood resilience in the face of various external shocks and to propose livelihood optimization strategies in response. As a result, this section of the study is also the study’s final foothold on livelihood resilience. Scholars often consider the factors influencing livelihood resilience from many perspectives, such as the economy, society, the environment, and culture, and use methods such as grey correlation analysis [22,23], the obstacle model [24], and regression analysis [14] to analyze the influencing factors of livelihood resilience. According to the influencing factors, this paper employs optimization strategies of livelihood resilience from different levels. For example, Forster [25] and Marshke et al. [26] have measured fishermen’s livelihood resilience and its influencing factors and found that diversified livelihood is an important strategy with which to cope with environmental impacts and enhance livelihood resilience, while dependence on resources will correspondingly weaken livelihood resilience. As a result, resource management should be strengthened, and users’ self-organization skills should be developed in order to cope with external impacts and maintain their livelihood resilience. Among these influencing factors, the impact of government management and regulation on livelihood resilience should be highlighted. For example, Cooper pointed out that the adaptive policies and management implemented by the Ugandan government in response to climate change can effectively help farmer households to restore their livelihood [27]; Waaben et al. pointed out that state intervention plays an important role in family livelihood restoration, and the access to family livelihood capital and livelihood diversity are the key factors that affect the livelihood resilience of rural families in mountainous areas of Vietnam [4]; and Noralene et al. pointed out that local planning and the formulation of appropriate adaptation strategies are extremely important to improving the resilience of livelihoods through analyzing the resilience of farmer households in coastal villages of the Philippines [28].
There are 56 ethnic groups in China, 55 of which are ethnic minorities, resulting in numerous ethnic tourism villages. The Wuling Mountain area is one of China’s largest “concentrated contiguous destitute areas” in inland province border areas, and is also an economic cooperation area supported by China. However, the Wuling Mountain area is rich in natural resources and typical minority cultural tourism resources, providing excellent conditions and a solid foundation for rural tourism development [29]. As a result, various ethnic tourism villages, such as historical and cultural villages, traditional villages, ethnic minority villages, scenic tourism villages, and red tourism destinations, have been built in recent years based on local advantages. In the Wuling Mountain area, rural tourism has grown rapidly, becoming an important industry for local economic development and rural revitalization. In order to address the issues faced by farmer households living in the Wuling Mountain area, scholars have primarily conducted the following research: First, the poverty characteristics of Wuling Mountain farmer households have been considered. Poverty-stricken areas have been discussed in terms of livelihood [30]. Second, the farmer households’ livelihood response index system was developed to investigate farmer households’ urbanization livelihood response [31]. Finally, the sustainable livelihood analysis framework has been used to examine the status of livelihood capital in some areas [32,33]. However, no scholars have examined farmer households’ self-resistance ability in the face of external interference from the standpoint of resilience.
To summarize, the COVID-19 pandemic is having a significant impact on farmer households’ livelihood in tourist villages, and livelihood recovery is proving difficult. To improve farmer households’ capacity to cope with external shocks, this paper incorporates livelihood resilience into the research on farmer households’ livelihood, and focuses on solving the following three questions: first, how can farmer households’ livelihood resilience in ethnic tourism villages be accurately evaluated; second, which type of farmer household has the greatest livelihood resilience; and third, what are the main factors affecting farmer households’ livelihood resilience in ethnic tourism villages? Based on the above questions, 480 farmer households were selected from 10 typical Ethnic Tourism Villages in the Wuling Mountain area, and they were categorized into three types based on their modes of development management. According to the analytical framework of livelihood resilience developed by Speranza et al., a livelihood resilience evaluation index system was constructed with respect to three dimensions, namely, buffer capacity, adaptive capacity, and transformation capacity, and the comprehensive index method was used to quantitatively evaluate the livelihood resilience of farmer households. Thus, we have provided an in-depth analysis of farmer households’ livelihood resilience in ethnic tourism villages under various development management modes in the face of the COVID-19 pandemic. The obstacle degree model was then used to examine the factors that influence farmer households’ lifetime resilience. Finally, relevant countermeasures and suggestions were proposed to improve the livelihood resilience of farmer households in ethnic tourism villages in the Wuling Mountains under different development management modes. This will promote the sustainable development of ethnic tourism villages in the Wuling Mountain area and contribute to the revitalization of the countryside, as well as provide a theoretical reference for research on the livelihood resilience of farmer households in less-developed tourism villages around the world.
2. Study Areas, Data, and Methods
2.1. Study Area
Wuling Mountain area in China spans Hunan, Hubei, Chongqing, and Guizhou provinces, including 71 counties (cities, districts), with a total area of 171,800 km2 and a population of more than 36 million [34,35]. The area contains 9 indigenous minorities, including Tujia, Miao, Dong, Bai, Hui and Gelao, and the minority population accounts for about 12.5% of China. Wuling Mountain area has distinctive ethnic characteristics and rich rural tourism resources. In the Plan of Regional Development and Poverty Alleviation in Wuling Mountain Area (2011–2020), the tourism industry has been positioned as the key industry and pillar industry in Wuling Mountain area. In 2016, China Tourism Administration, National Development and Reform Commission, the State Council Poverty Alleviation Office, and more than 10 other departments and units jointly formulated and issued the Action Plan of Rural Tourism Poverty Alleviation Project, which listed 2106 villages in the Wuling Mountain area as key villages for the alleviation of poverty in areas of rural tourism.
In this study, 10 ethnic tourism villages, including Maliuxi Village in Xianfeng, Wujiatai Village in Xuanen, Disun Village in Jingzhou, Huangdu Village in Tongdao, Zhushan Village in Fenghuang, Shibadong Village in Huayuan, Dehang Village in Jishou, Luochehe Village in Longshan, Luotan Village in Cili, and Maershan Village in Yongding, were selected as the research objects (Figure 1). The selected farmer households belong to a variety of modes of tourism development management; thus, their incorporation can comprehensively reflect the livelihood resilience of local farmer households under different tourism development management modes and offer good typicality and representativeness.
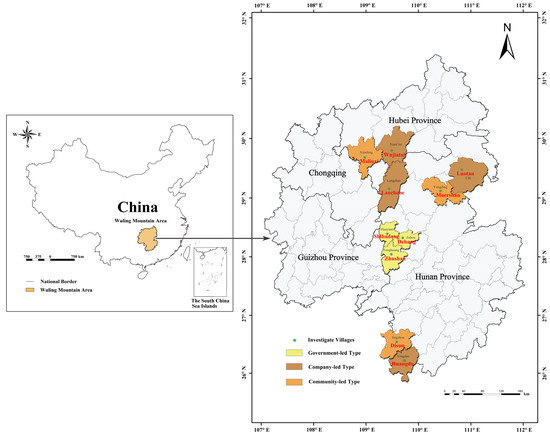
Figure 1.
Map of the research region in Wuling Mountain area.
2.2. Data
2.2.1. Index System Construction and Variable Description
Referring to the previous studies [8,17], based on the reality of tourist villages in Wuling Mountain; integrating the interaction of external disturbance, government management, and farmer households’ behavior; and considering that all selected villages are ethnic tourism villages and farmer households’ psychological capital can significantly affect their initiative to respond to external disturbances [22], cultural capital and psychological capital are included in the construction scope of the index system. The evaluation index system of farmer households’ livelihood resilience of ethnic tourism villages in Wuling Mountain area is constructed from three aspects: buffer capacity, adaptive capacity, and transformation capacity (Table 1). Buffer capacity refers to the maximum capacity of external interference on the premise of keeping a system’s structure and function unchanged. Adaptive capacity refers to farmer households’ response to and adaptive capacity towards external disturbances by virtue of their existing experience and cognitive level. Transformation capacity refers to the capacity of farmer households to create new development paths on their own terms or with the help of the government.

Table 1.
Farmer households’ livelihood resilience measurement index system.
2.2.2. Data Sources
Farmer households’ data were mainly obtained through semi-structured interviews and questionnaires, and the data collection mainly proceeded through two stages [14]:
- (1)
- Pre-investigation stage: Four traditional ethical tourism villages in Xiangxi and Zhangjiajie were chosen for pre-investigation in December 2021. The research team went to villages and tourism businesses to gather information about tourism development, farmer households’ production and life, and folk culture. Furthermore, each village pre-investigated several typical characters (such as the village committee, the person in charge of the tourism company, the competent people, and the ordinary farmer households). The questionnaire and interview outline were then constantly revised and improved based on the results of the pre-survey.
- (2)
- Formal investigation stage: A questionnaire survey was conducted in August 2022 along the route of “Xianfeng, Hubei-Enshi, Hubei-Huaihua, Hunan-Xiangxi, Hunan-Zhangjiajie, Hunan”. Data were collected using participatory rural assessment (PRA). To understand the farmers’ main mode of tourism development management, in-depth interviews were conducted at the village headquarters with the village clerk or other village committee members; then, a quota-sampling method was used to select some farmers for the household questionnaire survey. First, 10 representative ethnic tourism villages under different development management modes from north to south in the Wuling Mountain area were selected; then, more than 35 farmer households in each village were randomly selected [19].
Finally, a total of 500 questionnaires were obtained, of which 480 were valid, with an effective rate of 96.0%.
2.3. Data Analysis Methods
2.3.1. Data Standardization and Index Weight Calculation
Before measuring the farmer households’ livelihood resilience, the extreme value method is used to standardize the original data of each measurement index so as to eliminate the dimension and order of magnitude’s influence among each measurement index. All indicators in this study are positive indicators, and the processing equation is as follows [23]:
where Yij is the data of the jth index of the ith sample after standardization, max(xj) is the maximum value of the data of the jth index, and min(xj) is the minimum value of the data of the jth index.
Entropy weight method is used to determine the weight of farmer households’ livelihood resilience measurement index, and the calculation equations are as follows [32]:
where pij is the proportion of the ith sample value to the index under the j index, Ej is the entropy value of the j index, and ωj is the weight of the j index. See Table 1 for the weight results regarding the indices of the sample livelihood resilience test.
2.3.2. Reliability and Validity Test
By using SPSS 24.0 statistical analysis software, the reliability and validity of the original data obtained from the survey are tested. The results show that the Cronbach’s α coefficient is 0.752. It is generally believed that when the Cronbach’s α coefficient reaches 0.7–0.8, the scale has considerable reliability. The KMO test coefficient (0.800) is greater than 0.5, and the Bartlett test coefficient (Sig.) is 0.000, which indicates that the validity of the measurement index is well tested.
2.3.3. Comprehensive Index Method
According to the definition of the concept of livelihood resilience, livelihood resilience is understood as the combination of three dimensions: buffer capacity, adaptive capacity, and transformation capacity [19]. The comprehensive index method is adopted to calculate farmer households’ livelihood resilience levels in ethnic tourism villages with the following equations [32]:
RI stands for livelihood resilience index, while BI, AI, and TI stand for buffer capacity index, adaptive capacity index, and transformation capacity index respectively. WB, WA, and WT represent the weights of buffer capacity, adaptive capacity, and transformation capacity, respectively, in the three dimensions, and they are regarded as equally important here, accounting for 1/3 of each. ωj represents the weight of the jth index layer, and Yij represents the standardized value of the ith index of jth research units.
2.3.4. One-Way ANOVA and Post Hoc Multiple Comparison
The significant differences of the livelihood resilience index and index average under different tourism development management modes are examined using one-way ANOVA and post hoc multiple comparisons [36,37]. Among them, when the variance is homogeneous, the Student–Newman–Keuls (SNK) method is selected for multiple comparison; when the variance is uneven, Tamhane’s T2 method is selected for multiple comparison.
2.3.5. Obstacle Degree Model
In order to further identify the main obstacle factors that affect the improvement of farmer households’ livelihood resilience index in ethnic tourism villages, the obstacle degree model is used to calculate the impact of each evaluation index on farmer households’ livelihood resilience. The calculation equations are as follows [38]:
where Pij represents index deviation, indicating the gap between single index and optimal target value; Ij stands for obstacle degree, indicating the obstacle degree of the jth index towards livelihood resilience; and ωj represents the weight of a single factor with respect to the overall goal, that is, the weight of the jth index relative to the livelihood resilience.
3. Results
3.1. Division of Different Tourism Development Management Mode
Based on the existing research results [39,40], according to the different investment and business entities, the 10 case villages investigated were divided into three tourism development management modes: Government-led, Company-led, and Community-led. According to the tourism development management mode of the farmer household case villages, these villages were also divided into Government-led, Company-led, and Community-led, as shown in Table 2.
Table 2.
Comparison of three tourism development management modes.
3.2. Evaluation and Analysis of Farmer Households’ Livelihood Resilience under Different Tourism Development Management Modes
The buffer capacity, adaptive capacity, transformation capacity, and livelihood resilience indices can be obtained from Equations (1)–(8) (Figure 2). They were classified by K-means cluster analysis. The results show corresponding values for buffer capacities that are low (0.0156–0.0910), medium (0.0910–0.1530), and high (0.1530–0.2688); adaptive capacities that are low (0.0085–0.0910), medium (0.0910–0.1690), and high (0.1690–0.2966); transformation capacities that are low (0–0.0750), medium (0.0750–0.1450), and high (0.1450–0.2667); and resilience values that are low (0.0893–0.2580), medium (0.2580–0.4275), and high (0.4275–0.7553).
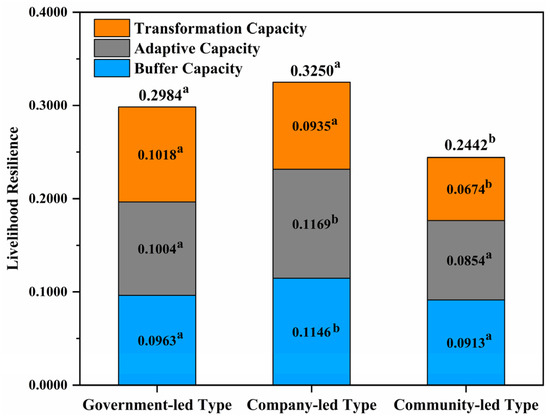
Figure 2.
Capacity index and livelihood resilience index of farmer households in different dimensions under different tourism development management modes. Different letters after the provided values for an indicator indicates that there is a significant difference between groups at p < 0.05.
The capacity performance of farmer households in three dimensions under the three modes is generally balanced with respect to each attribute’s dimension. Among them, the government-led transformation capacity is the strongest, while the buffer capacity is slightly weaker; the buffer capacity and adaptive capacity of the company-led farmers are the strongest, but their transformation capacity is slightly weaker; and the community-led farmers’ transformation capacity is obviously lower than the other two dimension layers. Therefore, government-led farmer households should focus on improving their buffer capacity, whereas company-led and community-led households should focus on improving their transformation capacity. The column scatter diagrams of each dimension and the livelihood resilience index of the farmer households under different tourism development management modes have been developed to further investigate the index’s internal differences (Figure 3, Figure 4, Figure 5 and Figure 6). To investigate the causes of these disparities, descriptive statistics were developed and significant analysis were performed concerning the standard values of farmer households’ livelihood resilience indicators under various management modes.
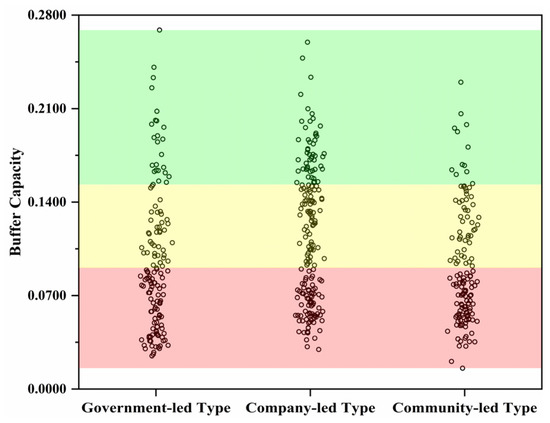
Figure 3.
Buffer capacity index of farmer households under different tourism development management modes.
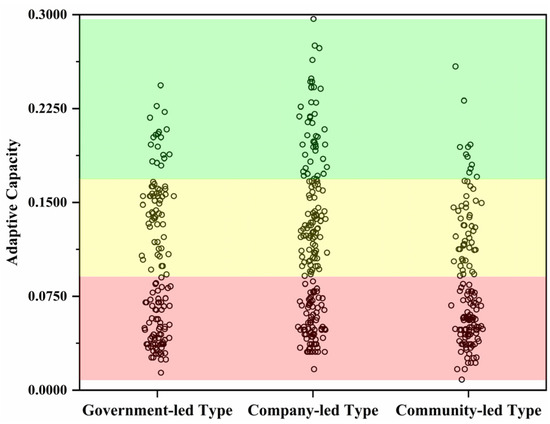
Figure 4.
Adaptive capacity index of farmer households under different tourism development management modes.
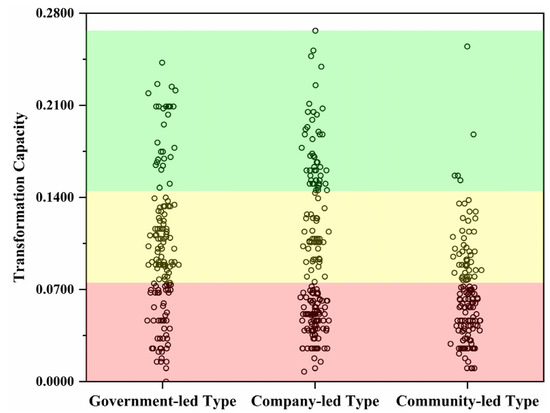
Figure 5.
Farmer households’ transformation capacity index under different tourism development management modes.
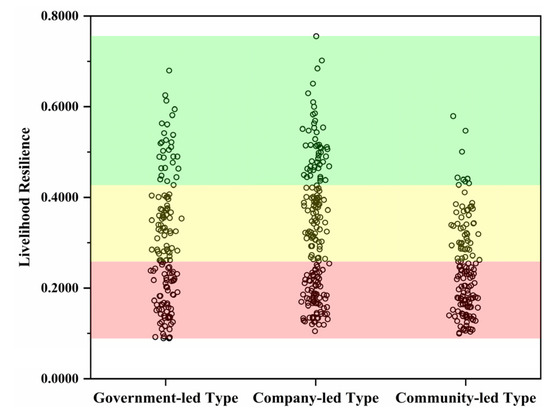
Figure 6.
Farmer households’ livelihood resilience under different tourism development management modes.
3.2.1. Buffer Capacity
In descending order, the farmer households’ buffer capacity under different tourism development management modes is as follows: company-led (0.1146), government-led (0.0963), and community-led (0.0913) (Figure 2)—all of which correspond to the middle level. There is a significant internal difference concerning the farmer households’ buffer capacity across the three modes, which is graded as low, medium, and high. Government-led and community-led farmer households are mostly of the middle and low grades, whereas company-led farmer households are mostly of the middle and high grades; thus, company-led farmer households have a higher buffer capacity than the other two types.
The difference in the farmer households’ buffer capacities under different tourism development management modes is mainly due to the differences regarding their livelihood capital and cultural capital. As shown in Table 3, among the indicators with large weights with respect to buffer capacity, the mastery of folk arts (C9) and the folk culture awareness categories (C8) of the farmer households under company-led management are significantly higher than those of the other two types, and the annual human expenditure (C6) is also at a high level; thus, this type of farmer household has the highest buffer capacity.
Table 3.
Characteristics of farmer households’ livelihood resilience index under different tourism development management modes.
3.2.2. Adaptive Capacity
Under different tourism development management modes, the adaptive capacity of the farmer households in descending order is as follows: company-led (0.1169), government-led (0.1004), and community-led (0.0854) (Figure 2). Among them, the adaptive capacity indices of the company-led and government-led farmer households are evenly distributed in three grades, and their average value is intermediate; however, the community-led households are dominated by middle and low grades, and exhibit a low-value aggregation trend, so the average value of its adaptive capacity index is low (Figure 4).
The reason for the above finding is that the education levels of the core family members (C13), the levels of rural policy awareness (C16), and the mobile phone communication costs (C17) of the community-led farmer households were the lowest, while the annual family education expenses (C18) were low and the training opportunities for the development of professional skills (C15) were the least (Table 3), resulting in the poor adaptive capacity of this type of farmer household and their low overall adaptive capacity. Comparatively speaking, all the adaptive capacity indicators of the company-led households were at the highest or higher levels; thus, their adaptive capacity was the highest.
3.2.3. Transformation Capacity
Under different tourism development management modes, the transformation capacity of farmer households in descending order is as follows: government-led (0.1018), company-led (0.0935), and community-led (0.0674) (Figure 2). Among them, the transformation capacity indices of the government-led and company-led farmer households have a large number distribution in three grades, and the average values were all intermediate, but the company-led households show a partial low-value focusing trend, resulting in their average value being slightly lower than that of the government-led households; however, the community-led households are dominated by middle and low grades, and show a low-value aggregation trend, so the average value of their transformation capacity index is low (Figure 5).
Transformation capacity is determined by the number of family members engaged in tourism (C22) and policy support (C19), the income diversity index (C20), and the proportion of non-agricultural income (C21) according to its weight. The government-led farmer households’ C19 and C20 indicators were at the highest levels, and their C22 and C21 indicators were at a high level, with little difference compared to the company-led households (Table 3); thus, the government-led households’ transformational capacity was the highest. However, all the indicators of community-led farmer households were at a lower or the lowest level (Table 3); thus, these households’ transformation capacity was the lowest.
3.2.4. Livelihood Resilience
Under different modes of tourism development management, the order of farmer households’ livelihood resilience is as follows: company-led (0.3250), government-led (0.2984), and community-led (0.2442) (Figure 2). Among them, the livelihood resilience index of company-led and government-led farmer households is basically distributed in three grades, and the average value is medium, with no significant difference between them; however, the community-led households mainly corresponded to middle and low grades, and these households show a low-value aggregation trend, so their average livelihood resilience index is low—significantly lower than the other two types (Figure 6).
Livelihood resilience is the sum of the buffer capacity, adaptive capacity, and transformation capacity. The indices of the buffer capacity and adaptive capacity of the company-led farmer households were significantly higher than those of the other two types. In addition, the company-led households’ transformation capacity index was slightly lower than that of the government-led households, so the company-led farmer households’ livelihood resilience index was the highest. The community-led farmer households’ indexes of all dimensions were the lowest, especially with respect to their transformation capacity, which was significantly lower than the other two types; thus, their livelihood resilience index was also the lowest.
3.3. Influencing Factors of Livelihood Resilience
The obstacle degrees of each index were calculated by Equations (9) and (10), the obstacle factors of farmer households’ livelihood resilience were further judged, and targeted strategies for improving farmer households’ livelihood resilience in ethnic tourism villages were put forward. Considering that a cumulative contribution rate exceeding 50% is judged to be the dominant obstacle factor [38], in order to fully reflect the actual situation, this study extracted the top seven obstacle factors of three types of farmer households, and the cumulative obstacle degree exceeded 80% (Table 4). It can be seen in this paper that extracting the first seven obstacle factors as the main influencing factors can fully explain the main influencing factors of farmer households’ livelihood resilience.
Table 4.
Degree of obstacle factors concerning farmer households’ livelihood resilience index layers in different tourist villages’ development management modes.
The results show that the obstacle factors affecting farmer households’ livelihood resilience under different management modes are converging. From Table 4, the top four obstacle factors of the three types of farmer households’ livelihood resilience are the education level of core family members (C13), training opportunities for the development of professional skills (C15), the number of family members engaged in tourism (C22), and the type of assistance subsidy available to the family (C7). Among them, C13 and C15 belong to adaptive capacity dimension indicators, C22 belongs to the group of transformation capacity dimension indicators, and C7 belongs to the group of buffer capacity dimension indicators. The cumulative degrees of the four obstacle factors in the government-led, company-led, and community-led farmer households’ livelihood resilience reached 58.16%, 59.42%, and 57.94%, respectively, all exceeding 50%. Therefore, these four factors are the leading obstacle factors to livelihood resilience [38]. In addition, the mastery of folk arts (C9), the degree of policy support (C19), and the folk culture awareness categories (C8) are the important influencing factors with respect to farmer households’ livelihood resilience under different management modes.
Firstly, the number of family members engaged in tourism (C22) constitutes the most significant impediment to farmer households’ livelihood resilience under different management modes in ethnic tourism villages. The obstacle degrees for the government-led, company-led, and community-led farmer households’ livelihood resilience are 20.50%, 20.87%, and 21.69%, respectively. The participation of farmer households in the development of rural tourism can not only address unemployment and generate income for families but also allows farmers to complete farm work and care for their families during busy farming seasons. However, according to the survey results, 43.75%, 53.85%, and 75.18% of farmer households’ families in the government-led, company-led, and community-led households, respectively, are involved in the rural tourism industry. In this context, the number of family members who can participate in tourism has emerged as the most significant impediment to improving livelihood resilience.
Secondly, the second obstacle with respect to farmer households’ livelihood resilience under different management modes constitutes training opportunities for the development of professional skills (C15). The obstacle degrees of the government-led, company-led, and community-led farmer households’ livelihood resilience are 14.98%, 15.53%, and 14.99%, respectively. The survey results show that management organizations at all levels have insufficiently implemented vocational skills training. More than 70% of the respondents said they had not received any vocational skills training, and more than 10% of the farmer households said that they had only received one training session that had had little effect on their employment. Participating in vocational and technical training and improving working skills play an important role in improving the livelihood stability and the income level of farmer households. However, the lack of vocational skills training has seriously restricted farmer households’ ability to find work and obtain employment stability and has become the second biggest obstacle to the improvement of farmer households’ livelihood resilience in ethnic tourism villages.
Furthermore, the education level of a household’s core family members (C13) constitutes another important obstacle factor with respect to farmer households’ livelihood resilience under different management modes. The obstacle factors of the government-led, company-led, and community-led farmer households’ livelihood resilience are 11.60%, 10.39%, and 11.23%, respectively. The higher the education level of a household’s core family members, the easier it is to address all kinds of external interference, quickly adapt to the new environment, and obtain new employment opportunities. The survey results show that the education levels of the main labor force of all the respondents’ families were generally low, and the average standard value was 0.2799 (that is, the level from primary school to junior high school), which greatly hinders the improvement of livelihood levels.
In addition, in areas where the old and the young are bordered by mountains and poor, under the influence of a pandemic, the type of assistance subsidy available to families (C7) is the main factor restricting farmer households’ livelihood resilience under different management modes. The obstacle degrees of the government-led, company-led, and community-led farmer households’ livelihood resilience are 11.08%, 12.63%, and 10.03%, respectively.
Finally, the villages studied are mostly traditional folk-culture tourist villages, and traditional folk culture and folk skills have become a major feature of tourism development. Therefore, the degrees of farmer households’ mastery of folk arts (C9) and the folk-culture awareness category (C8) have also become important factors affecting farmer households’ livelihood resilience in ethnic tourism villages. Additionally, the Wuling Mountain area is an underdeveloped ethnic area that requires the strong support of the government and the introduction of corresponding protection policies applied to intangible cultural heritage. Therefore, the support of relevant policies (C19) is another important factor.
In order to directly reflect the similarities and differences of farmer households’ livelihood resilience and this parameter’s obstacle factors under different development management modes more, the main results of this study have been summarized, as shown in Table 5.
Table 5.
A summary and comparison of the research results of farmer households’ livelihood resilience under different tourism development management modes.
4. Discussion
The Wuling Mountain area is not only underdeveloped, but it is also a minority area. This study uses typical, local, ethnic tourism-village farmer households as a research object, which constitutes a novel approach in terms of research areas and research objects. Furthermore, this study’s research into livelihood resilience provides new ideas that farmer households can adopt to cope with risk interference and improve their livelihoods, and it plays a critical role in consolidating poverty alleviation and promoting the effective implementation of rural revitalization strategies in the new period. The majority of the existing research results have evaluated and analyzed the livelihood resilience of farmer households using objective data, but research on farmer households’ livelihood-related responses to and subjective perceptions of external interference is lacking [22]. Based on a foundation of farmer households’ livelihood, participation in tourism, and psychological characteristics, this paper supplements the index dimension of farmer households’ livelihood resilience evaluation and improves the subjective and objective evaluation methods of farmer households’ livelihood. In addition, this study also divides the types of farmer households according to their tourism development management mode and analyzes the livelihood resilience and influencing factors of different types of farmer households, which constitutes an innovation in the research into resilience.
Farmer households under different tourism development management modes have different levels of livelihood resilience, which are determined by the advantages and disadvantages of each mode. Under the government-led development management mode, the government administers overall planning and, at the same time, provides corresponding funds and policy support [39]. Therefore, in this mode, the indicators of training opportunities for the development of professional skills, policy awareness, and policy support are the highest. However, under this mode, farmer households’ participation in tourism development is low, and their profits in the distribution of benefits are small; this model lacks market characteristics, its product development is limited, it places too much emphasis on political achievements, and its development is slow [39]. Therefore, the other indicators with respect to government-led households are average, and their livelihood resilience is not high. However, the company-led development management mode not only provides scientific and reasonable operation and management schemes, pays attention to market demand, has strong innovation ability, provides fast information transmission, has strong adaptive capacity, and can fully and reasonably optimize resource allocation, but it can also potentiate the enthusiasm of some residents [39]. Therefore, under the company-led development management mode, tourism develops rapidly, and tourism-based income increases rapidly. Among the three modes, many indicators of farmer households’ livelihood resilience are the highest for this mode, and its livelihood resilience is the greatest. However, the company-led development management mode also has some disadvantages, such as an unreasonable distribution of interests, which results in conflicts of interests, the casting of residents as victims of characteristic culture, and the provision of an unclear status of village residents [39]. Therefore, the impact of these factors on livelihood resilience, especially on psychological and cultural capital, should be considered in the later stage. Regarding the community-led development management mode, its advantage is that it can fully retain a region’s rural characteristics, and it is conducive to coordinating the contradictions among all parties and solving the conflicts between goals related to tourism development and residents [40]. However, its disadvantage is a lack of strong macro-level control and scientific and rational planning, and the nature of its tourism development has a certain degree of unpredictability and disorder. Furthermore, this mode suffers from a lack of capital, information, talent and management experience, and the infrastructure investment in the early stage is often short of funds, with relatively low efficiency, slow business development, limited reception capacity, a lack of marketing ability, and weak anti-risk ability [39]. Therefore, community-led farmer households’ livelihood resilience indicators are the lowest among the three models, and their livelihood resilience is the weakest. Studies have shown that for underdeveloped areas, a company’s optimal management system and government support are more important for tourism development [41], so although the community-led tourism development management mode is widely respected, it fails to optimally exploit its advantages in underdeveloped areas such as the Wuling Mountain area; thus, its farmer households’ livelihood resilience is inferior to that of the company-led and government-led management modes.
The obstacle factors to farmer households’ livelihood resilience under different development management modes in ethnic tourism villages tend to converge, and they are similar to those expressed by Liu et al. [6], He et al. [22], and other scholars regarding ex situ poverty alleviation for immigrants and farmer households’ livelihood resilience in poor mountainous areas. The limited educational opportunities available to farmer households, as well as their enthusiasm for participation, are important factors impeding the improvement of farmer households’ livelihood resilience. However, the livelihood of farmer households is closely related to government leadership, which is consistent with the findings of other scholars’ research, namely, that government management and regulation play important roles in the recovery of farmer households’ livelihood [2,4,27]. For traditional folk-culture tourism villages, cultural factors are also factors that cannot be ignored in order to promote the farmer households’ livelihood resilience of ethnic tourism villages.
This study also has some limitations, such as only analyzing the farmer households’ livelihood resilience and its influencing factors in the context of the COVID-19 pandemic, while being unable to provide a comparison to a context outside of a pandemic, constituting a limitation that needs to be further improved after the pandemic. Furthermore, farmer households’ livelihood resilience is a continuous and dynamic developmental process. With the implementation of China’s rural revitalization strategy and the normalization of the COVID-19 pandemic, the development and transformation of farmer households’ livelihood will encounter new disturbances and obstacle factors. The influence of farmer households’ livelihood resilience is becoming increasingly complex, so it is necessary to further improve the research into the dynamic change behaviors and influence mechanisms of farmer households’ livelihood resilience.
5. Conclusions and Recommendations
5.1. Conclusions
In this study, 480 typical ethnic tourism villages in the Wuling Mountain area were chosen as the research object. The livelihood resilience evaluation index system was built from three dimensions, namely, buffer capacity, adaptive capacity, and transformation capacity, which were based on the framework of Speranza et al. The comprehensive index method was used to quantitatively assess the resilience of farmer households in tourism villages under various development management modes. The obstacle degree model was used to examine the factors that influence farmer households’ livelihood resilience. The following conclusions have been obtained:
- (1)
- The degrees of livelihood resilience of the farmer households in ethnic tourism villages in the Wuling Mountain area corresponded to the following order: company-led, government-led, and community-led, with values of 0.3250, 0.2984, and 0.2442, respectively. Under the current circumstances, company-led tourism development management is the most appropriate mode of management for the local area.
- (2)
- The capacity performance of farmer households in three dimensions was generally balanced under the tourism development management mode. Government-led farmer households should focus on improving their buffer capacity, whereas company-led and community-led farmer households should focus on improving their transformation capacity. Among all the types of farmer households, government-led farmer households have the highest transformation capacity, company-led farmer households have the highest buffer capacity and adaptive capacity, and community-led farmer households have the lowest capacity in all dimensions.
- (3)
- The obstacle degrees with respect to the farmer households’ livelihood resilience converged in different tourism development management modes. The education level of core family members (C13), training opportunities for the development of professional skills (C15), the number of family members engaged in tourism (C22), and the type of assistance subsidy available to families (C7) are the dominant obstacle factors whose deficiency can impede the promotion of farmer households’ livelihood resilience in ethnic tourism villages.
- (4)
- In addition to the preceding main obstacle factors, the Wuling Mountain region, as a typical underdeveloped ethnic area, was also influenced by the mastery of folk arts (C9), policy support (C19), and folk-culture awareness categories (C8).
5.2. Recommendations
Based on the above analysis and with respect to the managers and farmer households, the following countermeasures and suggestions are proposed to improve farmer households’ livelihood resilience in ethnic tourism villages in the Wuling Mountain area:
- (1)
- In terms of increasing the number of family members engaged in tourism, managers should encourage young migrant workers to return to their hometowns to start businesses, create more job opportunities, and promote the employment of farmer households in their villages. Farmers should actively participate in the development and construction of rural tourism.
- (2)
- In terms of obtaining training opportunities for the development of professional skills, managers should increase the quantity, quality, and practicality of professional skills training in ethical tourism villages. Farmers should actively participate in skills training based on their own needs.
- (3)
- In terms of the various types of assistance subsidies available to families, managers should fully attend to policy adjustment; moderately improve the coverage, support, and awareness of rural inclusive policies; and provide appropriate subsidies to farmer households based on local economic development. Farmers should pay attention to national support policies concerning time, and actively seek corresponding assistance subsidies based on their own circumstances.
- (4)
- In terms of the educational level of family members, managers should rationally allocate urban and rural educational resources to improve educational conditions. Farmers should devote full attention to education, make effective use of educational resources, and increase investment in education.
- (5)
- In terms of the folk culture and policy support, managers should pay attention to the inheritance and protection of non-legacy culture, encourage farmers to learn folk skills, and increase the cultivation of rural tourism products. Farmers should strengthen their study and consolidation of local traditional folk skills, and actively seek governmental support for the characteristic projects regarding rural cultural heritage.
Author Contributions
Conceptualization, Y.X.; methodology, S.L.; software, J.Z. and N.Y.; formal analysis, S.L.; investigation, Y.X., J.Z. and N.Y.; writing—original draft preparation, Y.X.; writing—review and editing, Y.X., J.W. and W.X.; supervision, W.X. and J.W.; funding acquisition, J.W. All authors have read and agreed to the published version of the manuscript.
Funding
This research was funded by the National Natural Science Foundation (Grant Number: 42061036), Research Foundation of Hunan Provincial Education Department (Grant Number: 18A283) and Graduate Research Innovation Project of Jishou University (Grant Number: JGY2022078).
Institutional Review Board Statement
The study was conducted in accordance with the Declaration of Helsinki, and approved by the Biomedical Ethics Committee of Jishou University (protocol code: JSDX-2021-0062, approved on 5 July 2021).
Informed Consent Statement
Informed consent was obtained from all subjects involved in the study.
Data Availability Statement
Data can be supplied by the corresponding author upon plausible demand.
Acknowledgments
The authors would like to acknowledge the questionnaire respondents who gave their time to share their insights with us.
Conflicts of Interest
The authors declare no conflict of interest.
References
- Abbas, J.; Mubeen, R.; Iorember, P.T.; Raza, S.; Mamirkulova, G. Exploring the impact of COVID-19 on tourism: Transformational potential and implications for a sustainable recovery of the travel and leisure industry. Curr. Res. Behav. Sci. 2021, 2, 100033. [Google Scholar] [CrossRef]
- Gombodorj, G.; Peto, K. What type of households in Mongolia are most hit by COVID-19? Sustainability 2022, 14, 3557. [Google Scholar] [CrossRef]
- Worku, A.; Pretzsch, J.; Kassa, H.; Auch, E. The significance of dry forest income for livelihood resilience: The case of the pastoralists and agro-pastoralists in the drylands of southeastern Ethiopia. Forest Policy Econ. 2014, 41, 51–59. [Google Scholar] [CrossRef]
- Thulstrup, A.W. Livelihood resilience and adaptive capacity: Tracing changes in household access to capital in central Vietnam. World Dev. 2015, 74, 352–362. [Google Scholar] [CrossRef]
- Poelma, T.; Bayrak, M.M.; Nha, D.V.; Tran, T.A. Climate change and livelihood resilience capacities in the Mekong Delta: A case study on the transition to rice-shrimp farming in Vietnam’s Kien Giang Province. Clim. Change 2021, 164, 1–20. [Google Scholar] [CrossRef]
- Liu, W.; Li, J.; Ren, L.; Xu, J.; Li, S. Exploring livelihood resilience and its impact on livelihood strategy in rural China. Soc. Indic. Res. 2020, 150, 977–998. [Google Scholar] [CrossRef]
- Holling, C.S. Resilience and stability of ecological systems. Annu. Rev. Ecol. Syst. 1973, 4, 1–23. [Google Scholar] [CrossRef]
- Speranza, C.I.; Wiesmann, U.; Rist, S. An indicator framework for assessing livelihood resilience in the context of social-ecological dynamics. Global Environ. Change 2014, 28, 109–119. [Google Scholar] [CrossRef]
- Ayeb-Karlsson, S.; Geest, K.; Ahmed, I.; Huq, S.; Warner, K. A people-centred perspective on climate change, environmental stress, and livelihood resilience in Bangladesh. Sustain. Sci. 2016, 11, 679–694. [Google Scholar] [CrossRef] [PubMed]
- Sina, D.; Chang-Richards, A.Y.; Wilkinson, S.; Potangaroa, R. A conceptual framework for measuring livelihood resilience: Relocation experience from Aceh, Indonesia. World Dev. 2019, 117, 253–265. [Google Scholar] [CrossRef]
- Tanner, T.; Lewis, D.; Wrathall, D.; Bronen, R.; Cradock-Henry, N.; Huq, S.; Lawless, C.; Nawrotzki, R.; Prasad, V.; Rahman, M.A.; et al. Livelihood resilience in the face of climate change. Nat. Clim. Change 2015, 5, 23–26. [Google Scholar] [CrossRef]
- Liu, W.; Li, J.; Xu, J. Effects of disaster-related resettlement on the livelihood resilience of rural households in China. Int. J. Disaster Risk Reduct. 2020, 49, 101649. [Google Scholar] [CrossRef]
- Tan, S.; Tan, Z. Grassland tenure, livelihood assets and pastoralists’ resilience: Evidence and empirical analyses from western China. Econ. Polit. Stud. 2017, 5, 381–403. [Google Scholar] [CrossRef]
- Zhao, X.; Chen, H.; Zhao, H.; Xue, B. Farmer households’ livelihood resilience in ecological-function areas: Case of the Yellow River water source area of China. Environ. Dev. Sustain. 2022, 24, 9665–9686. [Google Scholar] [CrossRef]
- Wilmsen, B.; Webber, M. What can we learn from the practice of development-forced displacement and resettlement for organised resettlements in response to climate change? Geoforum 2015, 58, 76–85. [Google Scholar] [CrossRef]
- Liu, W.; Xu, J.; Li, J. The influence of poverty alleviation resettlement on rural household livelihood vulnerability in the western mountainous areas, China. Sustainability 2018, 10, 2793. [Google Scholar] [CrossRef]
- Quandt, A. Measuring livelihood resilience: The Household Livelihood Resilience Approach (HLRA). World Dev. 2018, 107, 253–263. [Google Scholar] [CrossRef]
- Alam, G.M.M.; Alam, K.; Mushtaq, S.; Filho, W.L. How do climate change and associated hazards impact on the resilience of riparian rural communities in Bangladesh? Policy implications for livelihood development. Environ. Sci. Policy 2018, 84, 7–18. [Google Scholar] [CrossRef]
- Zheng, D.; Huang, X.; Wang, C. Farmers’ livelihood resilience and its optimization strategy in Loess Plateau of north Shaanxi province. J. Arid Land Resour. Environ. 2020, 34, 9–16. [Google Scholar]
- Li, T.; Cai, S.; Singh, R.K.; Cui, L.; Fava, F.; Tang, L.; Xu, Z.; Li, C.; Cui, X.; Du, J.; et al. Livelihood resilience in pastoral communities: Methodological and field insights from Qinghai-Tibetan Plateau. Sci. Total Environ. 2022, 838, 155960. [Google Scholar] [CrossRef]
- Su, F.; Luo, J.; Zhu, X.; Tong, L.; Zheng, Y.; Xie, Y. Study on measurement and influencing factors of livelihood resilience in rural areas of Hubei Province. Adv. Earth Sci. 2021, 36, 1117–1126. [Google Scholar]
- He, Y.; Zhang, J.; Qiao, X.; Zhang, Q. Rural households’ livelihood resilience in poor mountainous areas under the background of targeted poverty alleviation: A case study of Qinba mountain areas in Henan province. J. Arid Land Resour. Environ. 2020, 34, 53–59. [Google Scholar]
- Sun, S.; Geng, Y. Livelihood resilience and its influencing factors of worker households in the face of state-owned forest areas reform in China. Sustainability 2022, 14, 1328. [Google Scholar] [CrossRef]
- Wu, Z.; Zeng, T.; Huang, J. Sustainable livelihood security in the Poyang Lake eco-economic zone: Ecologically secure, economically efficient or socially equitable? J. Resour. Ecol. 2022, 13, 442–457. [Google Scholar]
- Forster, J.; Lake, I.R.; Watkinson, A.R.; Gill, J.A. Marine dependent livelihoods and resilience to environmental change: A case study of Anguilla. Mar. Policy 2014, 45, 204–212. [Google Scholar] [CrossRef]
- Marschke, M.J.; Berkes, F. Exploring strategies that build livelihood resilience: A case from Cambodia. Ecol. Soc. 2006, 11, 709–723. [Google Scholar] [CrossRef]
- Cooper, S.J.; Wheeler, T. Adaptive governance: Livelihood innovation for climate resilience in Uganda. Geoforum 2015, 65, 96–107. [Google Scholar] [CrossRef]
- Uy, N.; Takeuchi, Y.; Shaw, R. Local adaptation for livelihood resilience in Albay, Philippines. Environ. Hazards 2011, 10, 139–153. [Google Scholar] [CrossRef]
- Ye, M.; Wang, Z. Analysis on the influence mechanism of transportation network for the spatial structure of regional tourism: Case of Wuling Mountain Area. Econ. Geogr. 2017, 37, 213–219. [Google Scholar]
- Ding, J.; Ning, Y. The Characteristics and influence on poverty of farmers’ income diversity in Wuling Mountain area of Hunan province. Sci. Geogr. Sin. 2016, 36, 1027–1035. [Google Scholar]
- Ding, J.; Jin, N.; Jia, W.; Yi, X.; Wang, Y. The livelihood response of rural households to urbanization and its influencing factors in Wuling Mountain area: With the survey data of 355 households in three typical towns. Geogr. Res. 2019, 38, 2027–2043. [Google Scholar]
- Zhang, Q.; Liu, S.; Liu, J.; Wen, J.J. Sustainable livelihood of households in tourism destination: Evidence from in the Wulingyuan world heritage site. Randwick Int. Soc. Sci. J. 2022, 3, 244–255. [Google Scholar]
- Li, W.; Shuai, C.; Shuai, Y.; Cheng, X.; Liu, Y.; Huang, F. How livelihood assets contribute to sustainable development of smallholder farmers. J. Int. Dev. 2020, 32, 408–429. [Google Scholar] [CrossRef]
- Li, G.; Hu, W. A network-based approach for landscape integration of traditional settlements: A case study in the Wuling Mountain area, southwestern China. Land Use Policy 2019, 83, 105–112. [Google Scholar] [CrossRef]
- Li, Z.; Wang, D. Temporal and spatial differentiation of tourism economy-ecological efficiency and its influencing factors in Wuling Mountain area. Econ. Geogr. 2020, 40, 233–240. [Google Scholar]
- Alassaf, M.; Qamar, A.M. Improving sentiment analysis of arabic tweets by One-way ANOVA. J. King Saud Univ.-Com. 2020, 34, 2849–2859. [Google Scholar] [CrossRef]
- Lee, S.; Lee, D.K. What is the proper way to apply the multiple comparison test? Korean J. Anesthesiol. 2018, 71, 353–360. [Google Scholar] [CrossRef]
- He, Y.; Huang, X.; Yang, X. Adaptation of land-lost farmers to rapid urbanization in urban fringe: A case study of Xi’an. Geogr. Res. 2017, 36, 226–240. [Google Scholar]
- Zhang, J. New mode of development and management of ethnic village tourism. Resour. Dev. Mark. 2015, 31, 117–120. [Google Scholar]
- Chen, J.; Zhang, L.; Yang, X.; Li, G. The impact of tourism development on changes of households’ livelihood and community tourism effect: A case study based on the perspective of tourism development mode. Geogr. Res. 2017, 36, 1709–1724. [Google Scholar]
- Zou, T.; Huang, S.; Ding, P. Toward a community-driven development model of rural tourism: The Chinese Experience. Int. J. Tour. Res. 2014, 16, 261–271. [Google Scholar] [CrossRef]
Disclaimer/Publisher’s Note: The statements, opinions and data contained in all publications are solely those of the individual author(s) and contributor(s) and not of MDPI and/or the editor(s). MDPI and/or the editor(s) disclaim responsibility for any injury to people or property resulting from any ideas, methods, instructions or products referred to in the content. |
© 2022 by the authors. Licensee MDPI, Basel, Switzerland. This article is an open access article distributed under the terms and conditions of the Creative Commons Attribution (CC BY) license (https://creativecommons.org/licenses/by/4.0/).