Abstract
The research represents the ongoing investigation of the welded joints behavior made of low-carbon low-alloyed steel in the presence of different multiple defects. Following the initial experimental and numerical analyses performed on low-grade steel, a set of experiments were performed with specimens made of steel EN 1.0044 (commercial designation S275JR), along with development of new numerical models. Four combinations were made, including defects like undercuts, excess weld metal, misalignment, weld face sagging and incomplete root penetration, considering that these defects are often encountered in practice, and can appear simultaneously. The finite element method (FEM) was used to simulate the experiments. Tensile properties of the HAZ and weld metal were calculated using strain measurements by the digital image correlation (DIC) method. The finite element method (FEM) results were in good agreement with the experimental ones.
1. Introduction
Various types of defects in welded joint, caused by welding, can lead to failure. These defects represent an important factor to take into account when assessing the integrity of various types of structures, since welded joints often represent the most critical parts of structures [1,2,3,4,5,6,7]. The main reason for this lies in reduced structural integrity due to a stress concentration caused by their presence. Different approaches, such as various mechanical testing, in combination with FEM analysis, can provide a comprehensive insight to welded structures integrity. Due to many factors and influences on the welded joint quality, special attention was often paid to defects occurrence, detection and general impact [8,9,10,11,12]. Their general influence on structural integrity was investigated with the aim of prevention of catastrophic events. Beside the aforementioned factors, the lack of sufficient information in relevant standards, for example regarding the presence of multiple defects, could also lead to structural failures. The presence of defects in critical areas can lead to failure of sub-assemblies and, in the case of lack of structural redundancy, even to the collapse of the entire structure. Following the post-event assessments, most of the time [13], the conclusion of the post event technical reports stated that the main cause of failure was the presence of defects in the welded joint areas.
The topic of the research is highly relevant in civil engineering applications under fatigue loading—Low Cycle Fatigue (LCF) or High Cycle Fatigue Loading (HCF), in which the approach is usually different from the mechanical engineering field—the defect is revealed following the inspection which occurs in the manufacturing phase (following EN1090-2 requirements) and more often following the service interval inspection (Figure 1). Thus, the design in civil engineering is considered without the defect taken into account—only the standard/normative requirements.
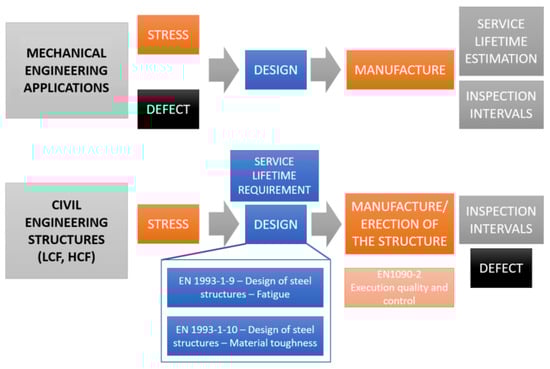
Figure 1.
Different approaches in mechanical and civil engineering.
The presence of crack or any defect in welded joint could affect the stress distribution and concentration in ways that could significantly compromise the welded joint integrity. FEM analysis is used widely in a variety of scientific and engineering fields. It is most effective at predicting the behavior of models under specific loading conditions, providing insight into the most critical locations within a structure or a component, such as a welded joint. A study of Cerit et al. [14] emphasized that phenomena consider the effect of two types of defects and their mutual influence. It is known that excess weld metal has an influence on stress concentration under uniaxial loading, but by using FEM analysis, the authors of this study discovered that this phenomenon is increased even more in the simultaneous presence of undercut in the welded joint, since both types of defects represent stress concentrators. The conclusion of this study was that the geometry of excessive reinforcement metal in combination with undercut represents a critical spot in the welded joint, causing concentration of stress concentration higher than in each case separately. Kozak et al. [15] considered the influence of weld misalignment on the stress state on tank cylindrical parts, and thus structural integrity in overall. In their study, Dimić et al. [16] analyzed the influence of incomplete root penetration in the welded joint on the integrity of pipe elbows exposed to internal pressure, as well as load carrying capacity of the welded joints. The designed geometry of the welded joint usually differs from the real one to a certain extent due to the thermal and dynamic effect during welding process itself, shown by Ottersbock et al. [17]. Using FEM analysis, they showed that in places with pronounced undercut in the weld, the stress concentration was greatly underestimated. They proposed an improved equation for consideration of the local undercut depth that affects stress concentration. Petrovic et al. [18] proposed a methodology for determining the load that causes the stress concentration in gusset plate (i.e., crack occurrence) of bucket wheel excavator.
Some studies used a fracture mechanics approach along with FEM, such in the case study of Bošnjak et al. [19]. They performed an integrity assessment of the bucket wheel tie-rod, i.e., the remaining fatigue life has been determined based on the stress-state characteristics in the welded joint and defined by experimental tests in real working conditions. Jallouf et al. [20] performed an assessment of undercut defect in welded joint using probabilistic domain Failure Assessment Diagrams (FAD). The FAD could be used for structural integrity analysis in general of pressure vessel equipment, as in the case of the cracked pressure vessel investigated by Milovanović et al. [21]. Jeremić et al. [22] used FAD to calculate the crack length in welded joint corresponding to the limit curve, or pipeline welded joint, with the aim of assessment of the remaining service life [23,24]. Radu et al.’s [25] case study revealed the importance of the defects in welded joints by means of FAD. This research involves different types of defects (through thickness and edge crack near steel elements welded joints), and their implications on structural integrity and behavior, considering fatigue assessment and remaining service life. Some studies used the classic fracture mechanics approach to examine fracture performance of weld metal in the presence of crack, such as [4,7,26] or the study of Yang et al. [27], where the strain capacity of welded joints under different crack mouth opening displacement was analyzed.
Recent studies proposed some novel methods for determining stress state in heterogeneous welded joints and influence of single stress concentrator (or defect) on welded joint integrity, as shown by Milošević et al. [28,29] based on analytical equations, in combination with numerical and experimental data. They concluded that the actual value of the tensile strength of a welded joint is significantly higher than the value obtained by the standard tensile testing, presented by engineering stress–strain curves [28], which is the consequence of cross-section contraction and stress concentration in the most deformed zone. Molski et al. [30] have investigated the problem of stress concentration at the weld toe of a plate T-joint subjected to axial, bending and shearing loading modes using FEM. Their proposed solutions may be applied as a computer aided assessment in fatigue design of welded T-joints. Some researchers proposed use of artificial neural network (ANN) approach in order to link metallurgical phenomena, chemical composition and mechanical properties of material, such as in the studies of Khalaj et al. [31,32], whose approach applied on API X70 [33] with the aim of prediction the ultimate tensile strength after thermomechanical treatment. The authors of this method emphasized strong potential for prediction of relations between chemical compositions and mechanical properties.
However, the investigation of multiple defects presence in welded joints has not yet been fully researched in detail. Defects in welded joints very often belong to several different types of defects, threated by relevant standard EN ISO 5817 individually, and do not take their mutual impact on structural integrity into account. Figure 2a shows defects, such as overlap, spatter, undercuts and lack of fusion (after applying surface and volumetric NDT methods) in butt welds caused by arc instability during the welding. Inappropriate atmospheric protection resulted in an unstable welding arc, which causes other surface defect occurrences besides deviation of the welded joint geometry, and also some volumetric defects. Figure 2b shows the weld example with undercut and lack of fusion discovered by Non-Destructive Testing (NDT), caused by misalignment, inadequate welding speed and current amperage. This problem also occurs during welding of austenitic steels (example shown in Figure 1c), where misalignment is usually followed by weld sagging and overlapping onto the parent material.
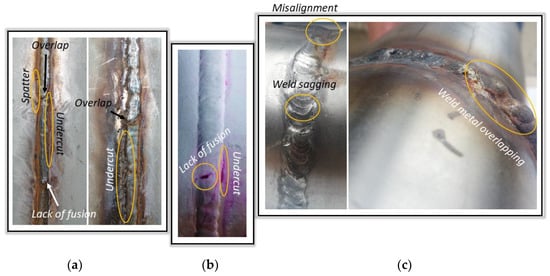
Figure 2.
Defects in butt-welded joint: (a) lack of fusion, overlap, undercut and spatter; (b) lack of fusion and undercut; (c) misalignment, weld sagging and weld metal overlapping.
Analyses and results shown in this paper represent a part of an extensive investigation of multiple defects in welded joint, partly presented in [34,35,36,37,38,39,40]. One of them, Aranđelović et al. [38], introduced methodology to analyze behavior of a welded joint in the presence of several different defects, where experimental and numerical investigation were performed on low grade steel, S235JR. One of the conclusions was that welding defects combinations consisting of incomplete root penetration and lack of fusion result in an adverse effect, whereas the presence of excess weld metal reinforcement was irrelevant during tensile loading [38], providing a solid basis for further analysis of problems concerning multiple defects in welded joint.
For this purpose, welded plates made of low-alloyed steel EN 1.0044 (commercial marking of S275JR) with four different combinations of commonly encountered welded joint defects imposed, were investigated with the purpose of discovering their mutual influences on welded structure accurately on tensile properties. Specimens prepared according to relevant standards were then subjected to tensile testing, hardness measuring and microstructure analysis. Tensile testing provided the tensile properties of welded joint regions, while detailed strain and stress fields were obtained by using DIC. Obtained results become an input for FEM analysis, which were performed with the aim of predicting the behavior of material with imposed defects under tensile loading in terms of stress concentration and crack initiation locations. After analyzing the differences in terms of behavior of specimens and numerical models, certain adjustments and assumptions were made and later confirmed experimentally, thus providing the basis for the next series of experiments/numerical analysis which will provide a more detailed insight into welded joint behavior with multiple defects. This FEM improvement included a more detailed representation of the welded joint itself by including the HAZ as a part of the model.
The additional goal of this research was to accurately determine the tensile properties of the HAZ of welded joint at room temperature using FEM analysis on models that have several different combinations of commonly encountered welded joint defects (which will be explained in further chapter). Yield stress and tensile strength (in further text, Re and Rm, respectively), as two of the most important input parameters for FEM analysis for each group specimen, were determined based on the previously known properties of the parent material and weld metal. Once the tensile properties were determined, they were compared to the results obtained by DIC, which confirmed their accuracy, thus verifying the methodology developed by this analysis.
2. Materials and Methods
2.1. Welding Procedure
Parent material used in this research is S275JR steel, which is commonly used in civil engineering and industrial applications, especially in pressure equipment and piping. Its chemical composition is given in Table 1, while tensile properties are given in Table 2. VAC60 was used as filler material, due to its more than satisfactory mechanical properties and general availability. Its chemical composition is given in Table 3, while the mechanical properties of the weld metal is given in Table 4.

Table 1.
Chemical composition of steel EN 1.0044 (commercial marking of S275JR)—wt %.
Table 2.
Tensile properties of S275JR.
Table 3.
Chemical composition of steel VAC60 (manufacturer Jesenice)—wt %.
Table 4.
Mechanical properties of pure weld VAC60 (manufacturer Jesenice).
MAG technique of welding is used for getting welding plates, which would have the defect combinations as followed:
- Excess weld metal, weld face undercut and incomplete root penetration, which represent plates for Group 1 specimens;
- Incomplete root penetration and weld face sagging, which represent plates for Group 2 specimens;
- Excess weld metal, weld face undercut and misalignment, which represent plates for Group 3 specimens;
- Incomplete root penetration, misalignment and weld face undercut, which represent plates for Group 4 specimens.
Welding parameters for each plate are given in Table 5.
Table 5.
Welding parameters for each plate.
2.2. Specimen Preparation (for Tensile Testing)
The next step involved cutting of the specimens from the aforementioned plates, with each group having two specimens which would be later used for tensile testing. The result from experimental testing stage were used as the base ground for development of new set of numerical models, whose geometry was taken from the specimens themselves. Examples of specimens’ weld metal geometry (and their groups denoted in the upper left corner of each image) are given in Figure 3.
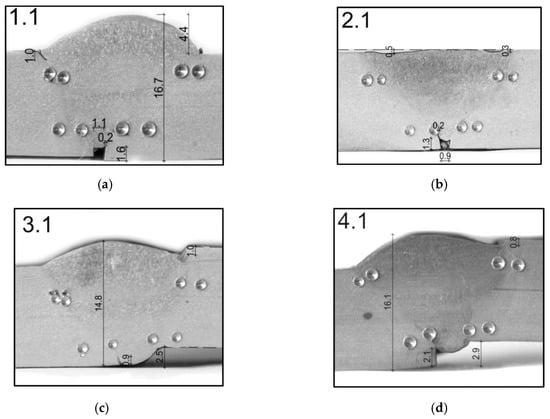
Figure 3.
Weld metal and defects geometry for (a) Group 1; (b) Group 2; (c) Group 3; (d) Group 4.
Specimens were etched using standard 10% Nital solution, so that each individual welded joint region (parent material, weld metal and HAZ) can be easily distinguished on the specimen surface. This was performed so that the numerical models could be accurately divided into these regions, with each of them having its own combination of mechanical properties (i.e., yield strength, ultimate tensile strength and strain).
2.3. Tensile Testing
Test specimens were then used for tensile testing, and a total of eight force-displacement diagrams were obtained for all eight specimens. Based on these diagrams, stress-strain diagrams were drawn and can be seen in Figure 4. These were used in order to determine the indicative/initial values of stress and strain to be used in the further FEM analysis. It should be noted that, before yield strength (Re) and ultimate tensile strength (Rm) and strain are input into the numerical models, they need to be converted to their “true” values. This is a requirement for all plasticity analyses in ABAQUS, and these values are determined according to the procedure shown in [38].
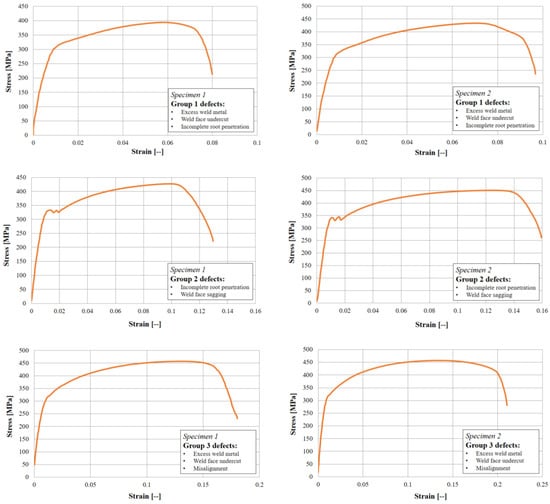
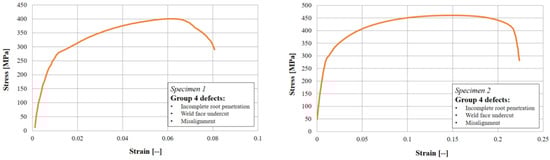
Figure 4.
Stress-strain diagrams of tensile test specimens.
All tensile tests were carried out on an INSTRON tensile test machine with a 250 kN capacity. Testing rate for all four group specimens was 5 mm/min. The number of specimens was selected for each group in accordance to the recommendation of standard EN ISO 15614-1:2017 (Specification and qualification of welding procedures for metallic materials—Welding procedure test-Part 1: Arc and gas welding of steels and arc welding of nickel and nickel alloys). This standard defines two specimens as the minimum amount needed for tensile tests. Similarity of results between each specimen pair justified this approach.
The global strains of the test specimens were
- group 1: from 8–10%;
- group 2: from 13–16%;
- group 3: from 18–21%;
- group 4: from 8–23%.
A large range of strain values was only found in the Group 4 of specimens, where the deformation ranged from 8 to 23%. This phenomenon was caused by the specific geometry of the welded joint, due to which strain hardening of the material occurs. For this reason, the deformation is transferred to different location in the cross-section, which leads to a fracture in the parent material.
2.4. Strain Measuring Using Digital Image Correlation
Measurement by Digital Image Correlation (DIC) played an important role in this analysis, since these results were used as a basis for establishing a reliable FEM computational model. The goal was to determine the mechanical properties of HAZ weld region in such a way that the strain in this region (and the rest of the welded joint) would correspond to the strain magnitudes and distribution obtained by DIC. In that way, experimental results would improve the numerical computational model. For that reason, the results of strain measurement via DIC method are shown in this section of the paper, in Figure 5. Experimental stages at which first signs of plastic strain began to occur are shown in the left side of Figure 5, as can be seen from the strain values for each group specimen, while the right side shows the final stage of specimen fracture. For all specimens, plastic strain began at around 1%. Mechanical properties of the HAZ in the welded joint models are determined based on the similar strain values/distribution on the specimen in the vicinity of the defects, which were the most critical and important locations for this analysis. In order to achieve this, mechanical properties (Re and Rm) were chosen iteratively, i.e., until a combination of values that would provide sufficiently accurate agreement was achieved between the FEM analysis and DIC results.
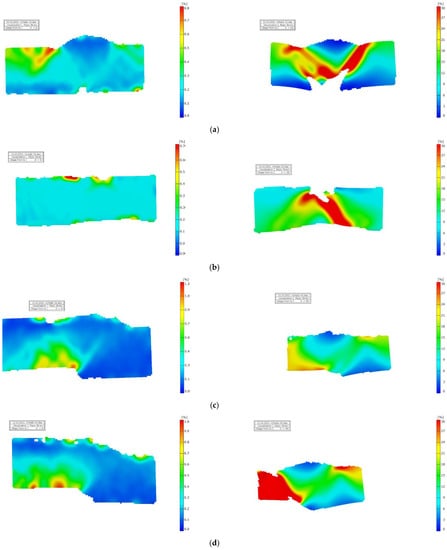
Figure 5.
Strain distribution of (a) Group 1 specimen (excess weld metal, weld face undercut and incomplete root penetration); (b) Group 2 specimen (incomplete root penetration and weld face sagging); (c) Group 3 specimen (excess weld metal, weld face undercut and misalignment); (d) Group 4 specimen (incomplete root penetration, misalignment, weld face undercut) (Left: plastic strain began; Right: specimen fracture).
The parent material properties were noticeably lower in this case since the used filler material caused considerable weld overmatching. For all four models, it was initially assumed that Re would be between 300 and 460 MPa, while the Rm would be between 440 and 600 MPa. As for the fracture, different zones of maximum strain can be observed for each specimen group depending on defects combination. This depends mainly on the stress concentration factor caused by welded joint and defects geometry.
3. FEM Analysis
3.1. Setup and Boundary Condition
FEM analysis was carried out using the ABAQUS software package. All of the models in this case were 2D in order to simplify the calculations. The 2D simulations were chosen due to the geometry of the specimens whose thickness resulted in a plane strain state throughout the cross-sections. Hence, there was no need to include the third dimension in this case. Geometries of the welded joints specimens with multiple defects were made based on the geometries shown in Figure 3, while the some of the initial developed of 2D FE model examples are presented in Figure 6. Dimensions of defects in all four models were identical to ones shown in Figure 3. It can be seen that in certain cases (such as specimen groups with misalignment of welded plates), the edges of the specimens are slightly sloped in accordance with their corresponding real specimen geometry. This was performed in order to depict influence of weld defect combinations in a manner as realistic as possible.
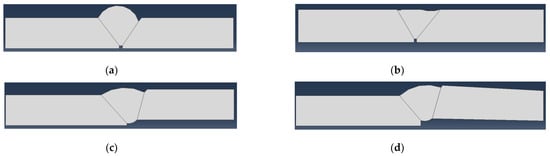
Figure 6.
Numerical models geometries for 4 specimens’ groups: (a) Group 1 FE model—defects: excess WM, undercut and incomplete root penetration; (b) Group 2 FE model—defects: sagging and incomplete root penetration; (c) Group 3 FE model—defects: misalignment, undercut and excess WM; (d) Group 4 FE model—defects: misalignment, undercut, incomplete root penetration.
Defining of mechanical properties for each specimen group was also an important part of the analysis and was done as follows:
- Yield stress (Re) values for the parent material ranged from 275 MPa (Group 3) to 330 MPa (Group 2);
- Tensile strength (Rm) values for the parent material ranged from 400–460 MPa, with both limit values taken from group 4 specimens;
- Yield stress for the weld metal was assumed to be 460 MPa in all four cases, since it was much higher due to overmatching and a more detailed approach to defining its values would not have any noticeable effect on the calculations;
- Tensile strength for the weld metal was adopted as 600 MPa for all four groups, following the same logic as in the case or Re.
After defining the input parameters, loads and boundary conditions were set, along with the FE mesh. The load in this stage was defined simply as 100 MPa for all models since the calculations were performed for mutual comparison purposes. A more detailed analysis, which will follow these experiments/FE analysis, will used loads calculated according to the real forces from the tensile testing. Boundary conditions were simply defined by fixing the end of the specimen opposite of where the load was acting, and can be seen in Figure 7 for one of the specimen group models.
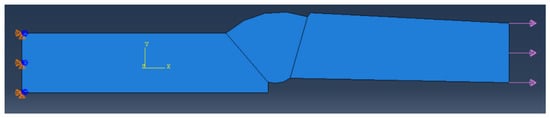
Figure 7.
Boundary conditions (fixed, left) and loads (arrows on the right) on one of the models.
Finite element meshes were defined in a way which ensures result convergence, i.e., several iterations with different sizes were first made for each group model, until satsifying levels of convergence were achieved. FE meshes for each group can be seen in Figure 8, whereas Table 6 shows the number of elements and nodes for each model. It should be noted that only parts of the mesh in the most critical areas (near the weld), where result accuracy was crucial, are shown in Figure 8. Elements on either end of each specimen were much larger, since there was no need for a refined mesh in those areas.
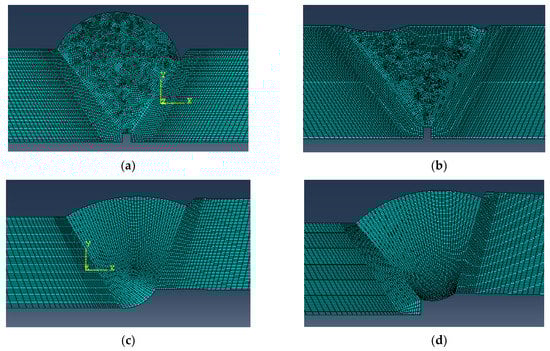
Figure 8.
Finite element meshes for all models: (a) first group, (b) second group, (c) third group, (d) fourth group.
Table 6.
Number of finite elements and nodes for each model.
3.2. Results
While the accuracy of the results was confirmed by their similarity to the DIC method that was used, it was concluded that additional verification would be needed, since this is a methodology that was not attempted before by any authors.
Tensile properties of the HAZ were assumed based on the properties of the weld metal, but calculations performed with these values as input data were not accurate, since there was a noticeable difference in HAZ deformation obtained by numerical calculations and the experimental measuring by DIC. Hence, few iterations were needed until the HAZ mechanical properties provided results which were close to DIC, and this method is described in detail in [40].
Final values of tensile properties that were obtained are shown in Table 7 and have confirmed one of the initial assumptions: that they would have similar values for all four welded joint defect combinations. Re values for the HAZ of all four groups, determined in the aforementioned manner, ranged from 395–419 MPa, whereas Rm was between 484 and 505 MPa, both differing by around 5% between their maximum and minimum values.
Table 7.
Tensile properties of the HAZ zone for all four groups of specimens, obtained by numerical simulation.
Strain distribution for all four groups of specimens with defects is shown in Figure 9. The results indicate that at same loading and boundary conditions the Group 2 model (for recall, the model with incomplete root penetration and weld face sagging) provides higher stress concentration in comparison to other ones, but does not represent the most dangerous case from the aspect of the structural integrity. It can be seen that defects in the Group 4 model, for recall, incomplete root penetration and misalignment (in the first row), along with weld face undercut, may represent most dangerous case, since this case consists of two critical locations where the stresses can reach very high values which are sufficient for the welded joint to pass into the plastic region. A detailed overview of all critical areas is presented in Table 8, which shows the stress concentration for each individual defects based on defects free model under the corresponding uniaxial tensile loading.
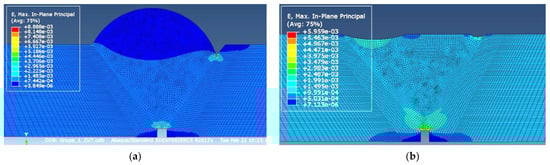
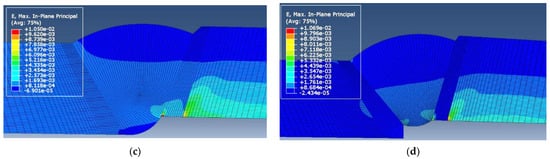
Figure 9.
Strain distribution of: (a) Group 1 model; (b) Group 2 model; (c) Group 3 model; (d) Group 4 model.
Table 8.
Overview of the stress concentration factor for all four defects combination groups.
By comparing the strain results obtained by FEM and DIC, it can be seen that there is good agreement in terms of maximum values and distribution around the welded joint defects, which was the ultimate goal of this analysis. Interestingly, the biggest difference was observed in the most symmetrical of the models, the one representing the second group of defects (weld metal sagging and incomplete root penetration). Stress distribution around the remote areas of the models (further away from the welded joint) also had shown good agreement with each other, but the emphasis in this case was on the defects themselves, since this is where most of the strain was concentrated, as expected.
4. Validation of Proposed Method for Determining Tensile Properties of HAZ
4.1. Hardness Measuring
Hardness measuring in the HAZ zone and weld metal on real specimen were conducted with the aim of validating proposed method for getting tensile properties. For the material such as low-carbon low-alloyed steels, it was expected that the hardness of the HAZ would be slightly lower than that of the weld metal and above those of the parent material. In fact, comparison of FEM results and the DIC results were the main reason for measuring hardness in this case. Since low-carbon low-alloyed structural steels (such as material used in this research) typically having the most basic chemical composition (carbon, manganese, silicone), they are always expected to have relatively low hardness values, which tend to be evenly distributed along each welded joint region. However, the validation of numerically obtained tensile properties of the HAZ provided a sufficient reason for this experiment.
In this particular case, hardness measuring was performed using a standard Vicker’s method, i.e., HV5 method on one of the prepared samples in order to obtain more accurate results (since there was a need to measure the hardness in a very small area, near HAZ zone). The specimen used for hardness measuring as well as the measuring locations (white, green and yellow colors) are shown in Figure 10. Hardness measuring results on weld face, weld root and near the fusion line and the middle of weld itself are shown in Table 9, Table 10 and Table 11, respectively. It should be mentioned that these are the average values for each measuring point, calculated based on the values obtained for all four specimen groups. This was done since the results for each individual group had shown very little difference, and hardness in the HAZ was always in the 150–165 HV range. Average values of hardness are given for a set of measuring points along the upper edge of the welded joint (weld face), along the lower part (weld root) as well as near the fusion line and in middle of the weld.
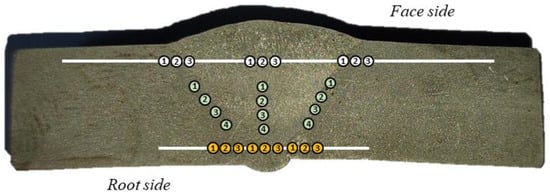
Figure 10.
Specimen used for hardness measuring and measuring locations.
Table 9.
Average hardness values for welded joint; face side.
Table 10.
Average hardness values for welded joint: root side.
Table 11.
Average hardness values for welded joint: near the fusion line and in middle of weld.
Hardness values obtained in this case correspond to the expected values for this material, and as can be seen, HAZ hardness is lower than the weld metal on both sides (with the difference being more prominent at the root side). However, some of these values were a bit lower than expected. This can be explained by the decreased heat input during the root pass, which was necessary in order to ensure the occurrence of relevant defects in this region.
Lower values of hardness in the HAZ compared to the weld metal agreed with the relationship between tensile properties of both regions, with the weld metal Re and Rm values being noticeably higher than in the HAZ zone. It should be noted that in the FE models, tensile properties were defined uniformly across the HAZ region and the other regions as well, whereas the above tables indicate that there was considerable variation of it (especially in terms of weld metal). This suggests that the methodology can be further improved by dividing the HAZ itself into subregions.
4.2. Microstructural Analysis
Microstructure analysis can be used for mechanical properties assessment and evaluation of material, which represent common practice used for steels and welds, such as in the following studies [41,42,43].
The microstructure of the parent metal, shown in Figure 11a, is predominantly ferritic with small amount of perlite colonies, which is considered to be an equilibrium microstructure. In HAZ, (fine-grained) microstructure consists of equiaxed ferritic grains with some amount of pearlite (Figure 11b). Ferrite grains in HAZ are smaller than ferrite grains in the parent metal. Grain refinement in HAZ is a consequence of the heat input generated during welding, which have caused a normalization of the microstructure in HAZ. Obtained differences of microstructures in parent material and HAZ are in compliance with the obtained hardness values. This phenomenon can be explained by the slightly decreased heat input during welding, especially in the weld root area. Metallographic analysis of HAZ does not show any significant difference observing from face to root side of the weld. Significantly different microstructure within the weld region were observed in weld metal. The main difference was the occurrence of bainitic phases in the face zone of weld metal (Figure 11c), caused by accelerated cooling. Microstructure of weld metal in the root zone (Figure 11d), normalized ferritic-pearlitic, is similar to one of HAZ which is a consequence of reheating during multi-pass welding and lower cooling rate. Observed microstructures are in compliance with the hardness of weld metal form face to root zone.
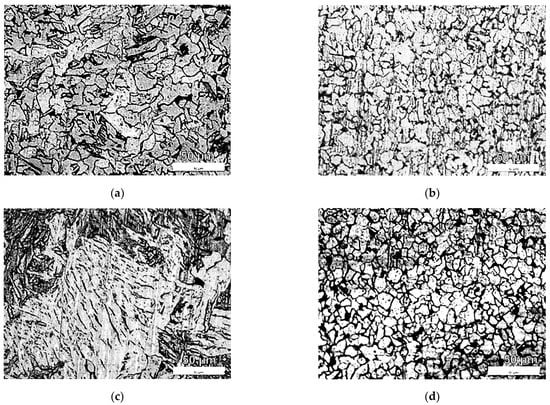
Figure 11.
Microstructures: (a) parent material S275JR steel; (b) HAZ; (c) weld face; (d) weld root.
The results of hardness measuring and microstructure analysis showed homogeneous microstructures in the HAZ region of welded joint for low-carbon low-alloyed steel and these welding parameters. In this particular case, the welding procedure had to be performed in a way that would ensure the presence of defects, which in turn resulted in irregular heat input during the welding passes. Due to this, the HAZ was subjected to a heat input lower than usual, and the growth of grains in the coarse-grain HAZ was not as prominent, resulting in lower tensile properties.
5. Conclusions
It was shown that different combinations of weld defects have significant impacts on the welded joint integrity. The results of tensile testing showed that plates with misalignment, along with other defects, were the most critical for structural integrity of welded joints. Analysis of the stress concentration factor values for all four combinations of defects confirmed that the combinations of defects with misalignment represent the most dangerous case that compromises integrity of the welded joint, i.e., Group 4 defects combination is the most extreme case, having two critical locations with potential stresses concentration sufficient for causing plastic strain. On the other hand, Group 1 (with excess weld metal) was determined to be the least dangerous. It should be emphasized that the nature of defects combinations also has great importance, in the sense that misalignment affected the stress/strain values by "redistributing" them to a completely different section of the welded joint, compared to models without misalignments. Due to noticeable overmatching of the welded joint, the fractures in all cases initiated from defects in the HAZ region, primarily at or near the fusion line.
In terms of stress distribution/concentration, the aforementioned “redistribution” resulted in very different effects of certain defect, namely, undercuts, which had far higher stress concentrations in models without misalignment: 1.66 compared to 0.95. This also implies that in certain cases, stress values in defects actually decreased due to geometric asymmetries which resulted in non-uniaxial loads, which produced compressive stresses in some regions of the model.
On the other hand, the defect with highest stress concentration factor was incomplete root penetration, with stresses being 1.5–2.5 times greater than in the defect-free model. However, most of these stresses were in the WM, and as such did not compromise the integrity. For this reason, the maximum stress value in Group 1 models (461.2 MPa) was not the most dangerous one—the undercut and excess weld metal values, while lower, were still above the yiels stress of the material that contained them. In the case of group 4, the maximum value of 470 MPa was the critical one, since it was located in the fusion line near the root, and not in the weld metal itself.This approach provides a quick and reliable method for determining the mechanical properties of (any) HAZ region of welded joint (Re and Rm) with sufficient accuracy.
Based on the presented research, the following conclusions can be drawn as well:
- It was concluded that different defect combinations can cause significant stress concentration which could lead to occurrence of plastic strain in welded joints, even at lower load levels;
- Iterative method for determining the mechanical tensile properties of the HAZ by comparison with DIC strain results showed satisfying levels of accuracy, with strain values ranging from 0.6 to 1.07%, which correspond to the moment when both real specimens and numerical models started showing plastic behaviour;
- The presented approach is universally applicable to different types of steels, whereas the other method uses varying empirical equations which depend on the type of steel.
Further work will involve improvements of developed FEM models by dividing the HAZ region into several subregions (e.g., the fine-grain and coarse-grain regions), and then comparing them to experimentally obtained results. This approach should be applied to more demanding types of steels (demanding in terms of welding), as well as in the wide range of temperature, in order to confirm observed relationship (in overall), regardless of the material properties.
Author Contributions
Conceptualization, M.A and B.Đ.; methodology, S.S. and A.P.; validation, A.S.; formal analysis, M.A., A.P. and S.S.; investigation, S.D.; resources, M.A.; data curation, B.Đ.; writing—original draft preparation, B.Đ.; writing—review and editing, D.R.; visualization, A.P. and S.S.; supervision, A.S. and D.R. All authors have read and agreed to the published version of the manuscript.
Funding
This research was supported by the Ministry of Education, Science, and Technological Development of the Republic of Serbia (Contract No. 451-03-68/2020-14/200135, 451-03-68/2022-14/200105 and 451-03-68/2020-14/200213).
Institutional Review Board Statement
Not applicable.
Informed Consent Statement
Not applicable.
Data Availability Statement
Not applicable.
Conflicts of Interest
The authors declare no conflict of interest.
References
- Đorđević, B.; Sedmak, S.; Tanasković, D.; Gajin, M.; Vučetić, F. Failure analysis and numerical simulation of slab carrying clamps. Frat. Ed Integrità Strutt. 2021, 55, 336–344. [Google Scholar] [CrossRef]
- Sedmak, S.; Grabulov, V.; Momcilovic, D. Chronology of lost structural integrity initiated from manufacturing defects in welded structures. Struct. Integr. Life 2009, 9, 39–50. [Google Scholar]
- Milovanović, N.; Sedmak, A.; Arsic, M.; Sedmak, S.A.; Božić, Ž. Structural integrity and life assessment of rotating equipment. Eng. Fail. Anal. 2020, 113, 104561. [Google Scholar] [CrossRef]
- Li, G.; Cai, Q.; Lu, X.; Zhu, X.; Xu, S. Failure analysis of cracking in the welded joints of hydrogen reformer outlet pigtail tubes. Eng. Fail. Anal. 2022, 137, 106257. [Google Scholar] [CrossRef]
- Jeremić, L.; Sedmak, A.; Petrovski, B.; Đorđević, B.; Sedmak, S. Structural integrity assessment of welded pipeline designed with reduced safety. Tech. Gaz. 2020, 27, 1461–1466. [Google Scholar] [CrossRef]
- Bošnjak, S.; Arsić, M.; Savićević, S.; Milojević, G.; Arsić, D. Fracture analysis of the pulley of a bucket wheel boom hoist system. Eksploat. I Niezawodn.—Maint. Reliab. 2016, 18, 155–163. [Google Scholar] [CrossRef]
- Soret, C.; Madi, Y.; Gaffard, V.; Besson, J. Local approach to fracture applied to the analysis of a full size test on a pipe containing a girth weld defect. Eng. Fail. Anal. 2017, 82, 404–419. [Google Scholar] [CrossRef]
- Rizvi, S.; Alib, W. Welding defects, Causes and their Remedies: A Review. Teknomekanik 2019, 2, 39–47. [Google Scholar] [CrossRef]
- Popović, O.; Prokić-Cvetković, R.; Radović, L.; Burzić, Z.; Arsić, D. The effect of heat input on the fracture behavior of surface weld metal of rail steel. Struct. Integr. Life 2020, 20, 77–81. [Google Scholar]
- Tanasković, D.; Đorđević, B.; Gajin, M.; Aranđelović, M.; Gostović, N.; Milovanović, N. Repair welding procedure and techno-economic analysis of burner pipe. Struct. Integr. Life 2021, 21, 85–90. [Google Scholar]
- Hariprasath, P.; Sivaraj, P.; Balasubramanian, V.; Pilli, S.; Sridhar, K. Effect of welding processes on high cycle fatigue behavior for naval grade HSLA joints: A fatigue strength prediction. Eng. Fail. Anal. 2022, 142, 106783. [Google Scholar] [CrossRef]
- Madhvacharyula, A.S.; Pavan, A.V.S.; Gorthi, S.; Chitral, S.; Venkaiah, N.; Kiran, D.V. In situ detection of welding defects: A review. Weld World 2022, 66, 611–628. [Google Scholar] [CrossRef]
- Hao, S. I-35W bridge collapse. J. Bridge Eng. 2010, 15, 608–614. [Google Scholar] [CrossRef]
- Cerit, M.; Kokumer, O.; Genel, K. Stress concentration effects of undercut defect and reinforcement metal in butt-welded joint. Eng. Fail. Anal. 2010, 17, 571–578. [Google Scholar] [CrossRef]
- Kozak, D.; Konjatić, P.; Matejiček, F.; Damjanović, D. Weld misalignment influence on the structural integrity of cylindrical pressure vessel. Struct. Integr. Life 2010, 10, 153–159. [Google Scholar]
- Dimić, I.; Arsić, M.; Međo, B.; Stefanović, A.; Grabulov, V.; Rakin, M. Effect of welded joint imperfection on the integrity of pipe elbows subjected to internal pressure. Teh. Vjesn. 2013, 20, 285–290. [Google Scholar]
- Ottersböck, M.J.; Leitner, M.; Stoschka, M. Characterisation of actual weld geometry and stress concentration of butt welds exhibiting local undercuts. Eng. Struct. 2021, 240, 112266. [Google Scholar] [CrossRef]
- Petrović, A.; Maneski, T.; Trišović, N.; Ignjatović, D.; Dunjić, M. Identification of crack initiation cause in pylons construction of the excavator SchRs630. Tech. Gaz. 2018, 25, 486–491. [Google Scholar]
- Bošnjak, S.M.; Arsić, M.A.; Zrnić, N.Đ.; Rakin, M.P.; Pantelić, M.P. Bucket wheel excavator: Integrity assessment of the bucket wheel boom tie-rod welded joint. Eng. Fail. Anal. 2011, 18, 212–222. [Google Scholar] [CrossRef]
- Jallouf, S.; Casavola, K.; Pappalettere, C.; Pluvinage, G. Assessment of undercut defect in a laser welded plate made of Ti–6Al–4V titanium alloy with probabilistic domain failure assessment diagram. Eng. Fail. Anal. 2016, 59, 17–27. [Google Scholar] [CrossRef]
- Milovanović, A.M.; Mijatović, T.; Diković, L.; Trumbulović, L.; Drndarević, B. Structural Integrity Analysis of a Cracked Pressure Vessel. Struct. Integr. Life 2021, 21, 285–289. [Google Scholar]
- Jeremić, A.; Sedmak, N.; Milovanović, N.; Milošević, N.; Sedmak, S. Assessment of integrity of pressure vessels for compressed air. Struct. Integr. Life 2021, 21, 3–6. [Google Scholar]
- Kirin, S.; Jeremić, L.; Sedmak, A.; Martić, I.; Sedmak, S.; Vučetić, I.; Golubović, T. Risk based analysis of RHPP penstock structural integrity. Frat. Ed Integrità Strutt. 2020, 14, 345–352. [Google Scholar] [CrossRef]
- Kozak, D.; Damjanović, D.; Katinić, M. Integrity assessment of the butt weld joint with defect according to EN ISO 6520-1, series 400. Struct. Integr. Life 2016, 16, 120–124. [Google Scholar]
- Radu, D.; Sedmak, A.; Sedmak, S.; Li, W. Engineering critical assessment of steel shell structure elements welded joints under high cycle fatigue. Eng. Fail. Anal. 2020, 114, 104578. [Google Scholar] [CrossRef]
- Li, Y.; Lu, P.; Wang, B.; Hu, X.; Song, X.; Xiang, Q. Fracture performance testing and modeling of butt weld metal. Eng. Fail. Anal. 2022, 139, 106489. [Google Scholar] [CrossRef]
- Yang, Y.; Liu, X.; Wu, K.; Sui, Y.; Feng, Q.; Wang, D.; Zhang, H. Full-scale experimental investigation of the fracture behaviours of welding joints of APL X80 wide plate based on DIC technology. Eng. Fail. Anal. 2022, 131, 105832. [Google Scholar] [CrossRef]
- Milosevic, N.; Younise, B.; Sedmak, A.; Travica, M.; Mitrovic, A. Evaluation of true stress–strain diagrams for welded joints by application of Digital Image Correlation. Eng. Fail. Anal. 2021, 128, 105609. [Google Scholar] [CrossRef]
- Milošević, N.; Sedmak, A.; Bakić, G.; Lazić, V.; Milošević, M.; Mladenović, G.; Maslarević, A. Determination of the actual stress–strain diagram for undermatching welded joint using DIC and FEM. Materials 2021, 14, 4691. [Google Scholar] [CrossRef]
- Molski, K.L.; Tarasiuk, P. Stress concentration factors for welded plate T-Joints subjected to tensile, bending and shearing Loads. Materials 2021, 14, 546. [Google Scholar] [CrossRef]
- Khalaj, G.; Pouraliakbar, H.; Mamaghani, K.R.; Khalaj, M.J. Modeling the correlation betweenheat treatment, chemicalcomposition and bainite fractionof pipeline steels by means ofartificial neural networks. Neural Netw. World 2013, 23, 351–367. [Google Scholar] [CrossRef]
- Khalaj, G.; Khoeini, M.; Khakian-Qom, M. ANN-based prediction of ferrite fraction in continuous cooling of microalloyed steels. Neural Comput. Appl. 2013, 23, 769–777. [Google Scholar] [CrossRef]
- Khalaj, G.; Azimzadegan, T.; Khoeini, M.; Etaat, M. Artificial neural networks application to predict the ultimate tensile strength of X70 pipeline steels. Neural Comput. Appl. 2012, 23, 2301–2308. [Google Scholar] [CrossRef]
- Jovičić, R.; Sedmak, S.; Tatić, U.; Lukić, U.; Walid, M. Stress state around imperfections in welded joints. Struct. Integr. Life 2015, 15, 27–29. [Google Scholar]
- Sedmak, S.A.; Burzić, Z.; Perković, S.; Jovičić, R.; Aranđelović, M.; Radović, L.; Ilić, N. Influence of welded joint microstructures on fatigue behaviour of specimens with a notch in the heat affected zone. Eng. Fail. Anal. 2019, 106, 104162. [Google Scholar] [CrossRef]
- Aranđelović, M.; Sedmak, S.; Jovičić, R.; Kozak, D.; Đorđević, B. Numerical simulation of crack growth in a welded joint with defects. Procedia Struct. Integr. 2021, 33, 850–857. [Google Scholar] [CrossRef]
- Aranđelović, M.; Sedmak, S.; Jovičić, R.; Perković, S.; Burzić, Z.; Đorđević, B.; Radaković, Z. Numerical simulation of welded joint with multiple various defects. Struct. Integr. Life 2021, 21, 103–107. [Google Scholar]
- Aranđelović, M.; Sedmak, S.; Jovičić, R.; Perković, S.; Burzić, Z.; Radu, D.; Radaković, Z. Numerical and experimental investigations of fracture behaviour of welded joints with multiple defects. Materials 2021, 14, 4832. [Google Scholar] [CrossRef]
- Aranđelović, M.; Jeremić, L.; Đorđević, B.; Sedmak, S.A.; Opačić, M. Integrity assessment of ammonia storage tank by non-destructive testing. Struct. Integr. Life 2021, 21, 295–300. [Google Scholar]
- Aranđelović, M. Influence of Multiple Defects on Structural Integrity of Welded Joints. Doctoral Thesis, Faculty of Mechanical Engineering, University of Belgrade, Belgrade, Serbia, 2022. [Google Scholar]
- Jovanović, G.; Glišić, D.; Dikić, S.; Radović, N.; Patarić, A. Cleavage fracture of the air cooled medium carbon microalloyed forging steels with heterogeneous microstructures. Materials 2022, 15, 1760. [Google Scholar] [CrossRef]
- Dikić, S.; Glišić, D.; Fadel, A.; Jovanović, G.; Radović, N. Structure and strength of isothermally heat-treated medium carbon Ti-V microalloyed steel. Metals 2021, 11, 1011. [Google Scholar] [CrossRef]
- Kumar, S.; Sirohi, S.; Pandey, S.M.; Bhatt, D.; Pandey, C. Effect of Single Bevel Groove Geometry on the Impact Strength of Dissimilar Welded Joint of P22 and P91 Steel. Sustainability 2022, 14, 11739. [Google Scholar] [CrossRef]


Disclaimer/Publisher’s Note: The statements, opinions and data contained in all publications are solely those of the individual author(s) and contributor(s) and not of MDPI and/or the editor(s). MDPI and/or the editor(s) disclaim responsibility for any injury to people or property resulting from any ideas, methods, instructions or products referred to in the content. |
© 2022 by the authors. Licensee MDPI, Basel, Switzerland. This article is an open access article distributed under the terms and conditions of the Creative Commons Attribution (CC BY) license (https://creativecommons.org/licenses/by/4.0/).