Article

Drought Analysis Based on Standardized Precipitation Evapotranspiration Index and Standardized Precipitation Index in Sarawak, Malaysia

by
Ismallianto Isia
1,
Tony Hadibarata
1,*,
Muhammad Noor Hazwan Jusoh
1,
Rajib Kumar Bhattacharjya
2,
Noor Fifinatasha Shahedan
1,
Aissa Bouaissi
3,
Norma Latif Fitriyani
4 and
Muhammad Syafrudin
5,*
1
Environment Engineering Program, Curtin University Malaysia, CDT 250, Miri 98009, Sarawak, Malaysia
2
Department of Civil Engineering, Indian Institute of Technology Guwahati, North Guwahati, Guwahati 781039, Assam, India
3
United Kingdom School of Engineering, University of Plymouth, Plymouth PL4 8AA, UK
4
Department of Data Science, Sejong University, Seoul 05006, Republic of Korea
5
Department of Artificial Intelligence, Sejong University, Seoul 05006, Republic of Korea
*
Authors to whom correspondence should be addressed.
Sustainability 2023, 15(1), 734; https://doi.org/10.3390/su15010734
Submission received: 23 November 2022 / Revised: 24 December 2022 / Accepted: 27 December 2022 / Published: 31 December 2022
(This article belongs to the Special Issue Climate Change Adaptation and Disaster Risk Assessments)

Abstract

:
Drought analysis via the Standardized Precipitation Index (SPI) and the Standardized Precipitation Evapotranspiration Index (SPEI) is necessary for effective water resource management in Sarawak, Malaysia. Rainfall is the best indicator of a drought, but the temperature is also significant because it controls evaporation and condensation. This study examined drought periods in the state of Sarawak using the SPI and SPEI based on monthly precipitation and temperature data from thirty-three rainfall stations during a forty-year period (1981–2020). This analysis of drought conditions revealed that both the SPI and SPEI were able to detect drought temporal variations with distinct time scales (3, 6, 9, and 12 months). Taking precipitation and evapotranspiration data into account, the SPEI was able to identify more severe-to-extreme drought in the study area over longer time periods and moderate droughts over shorter time periods than the standard drought index. According to Pearson correlation coefficients, a substantial association existed between the SPI and SPEI during hydrological dryness. Based on the results, the temperature is a decisive factor in drought classification, and the SPI should only be used in the absence of temperature data.

1. Introduction

Floods and droughts are frequently viewed as high-risk natural disasters. It is difficult to describe “drought” because it has diverse meanings in different regions and to different individuals [1]. However, in general, it means a deficiency in precipitation over an extended period of time, resulting in a water shortage. It is a slow process, so it is hard to tell where it starts and how it is going to end [2]. Cycles of drought are a component of the climate that is both essential and complicated. Today, they are happening more often and for longer periods of time in all climate zones [3]. Their consequences are thought to be the most expensive [4] and the second most widespread after floods [5]. They also pose a significant threat in terms of economic, social, and environmental aspects [5,6]. Depending on their characteristics, such as severity and frequency, those impacts could range from short-term (i.e., months) to long-term (i.e., years), and they could be economic, environmental, agricultural, or just felt through water resource depletion [7,8,9].
Water scarcity, combined with an ever-increasing demand for water, exacerbates the issue, and the effects of a long drought can change from one thing to another [10]. Therefore, drought preparedness is required to maintain a sufficient food supply and effective water management. Water scarcity and drought have a significant economic impact, and any change in drought characteristics (i.e., intensity and frequency) as a result of global warming is predicted to impair water supplies [11]. There is a lot of evidence in the literature that global warming is making droughts worse; hence, the temperature is thought to be a very important factor in assessing drought [7].
Drought is a natural hazard that can cause difficulties for people trying to perform their activities, produce crops, and obtain water. Droughts are linked to how hard it rains, how much rain falls, and how long it takes for the next wet season to start [12,13]. According to the Sarawak Meteorology Department’s analysis, Sarawak has the most rainfall and the highest surface temperatures in Malaysia. However, over the past 30 years, the temperature has risen from 26 to 32 °C, and the amount of rain has gone from 3000 to 4000 mm per year. The strong El Niño Southern Oscillation event in 1998 was linked to the severe drought that year. This event affected millions of people in Sarawak, Malaysia; caused high temperatures around the world; cut off water supplies in some areas; started forest fires; and hurt irrigated agriculture [13]. The strong El Niño caused six droughts in Sarawak during the years 1982–1983, 1986–1988, 1991–1992, 1997–1998, 2009–2010, and 2014–2016 according to the World Meteorological Organization (WMO).
This result is consistent with the most recent research, which shows that El Niño is contributing to an increase in the frequency with which extremely hot years occur and with the observation that it is becoming increasingly common for extremes of drought and flood to occur in the same year [14]. Consistent with other researchers of climate change in Malaysia, the authors of the aforementioned study highlighted agriculture as one of the most vulnerable sectors owing to climate change impacts, as well as forestry, biodiversity, water resources, and coastal and marine resources [14,15]. Agriculture, forestry, and fishing are still the most important industries in Sarawak, in which one-fourth of the people make a living. There is a direct link between these resources and the availability of water sources. Thus, understanding and dealing with drought are very important.
Hence, there is no direct method for measuring drought; instead, it is typically computed based on its effects using several indices [16]. There are many indices that can be used for this, but it is very important to choose the right one because they are all different for each area and depend on how many data are available. When monitoring and diagnosing drought, it is also crucial to consider the timescale [17]. For instance, a drought that lasts for one month may be considered a meteorological drought; a drought that lasts for three to six months may be considered an agricultural drought; a drought that lasts for one year may be classified as a hydrological drought; and, lastly, socio-economic drought is a category that may be applied to a drought that has lasted for longer than one year [18]. Therefore, in this study, droughts lasting 1, 3, 6, 9, and 12 months were taken into account.
According to a study on Malaysian droughts [13], the best indices for Sarawak are the SPI [19] and the SPEI [20]. In this study, the SPI and SPEI indices were used because they are standard, flexible, and easy to compare and analyze across a variety of time ranges. The SPI only uses rainfall data as input variables, while the SPEI also looks at how temperature affects water needs and takes global warming into account. Global warming could increase evaporation more than precipitation [19,20,21]. Drought severity can be determined using the SPI or SPEI value, which can be categorized into seven groups (Table 1). Since the SPI/SPEI value is constantly negative until it reaches a value of −1.0 or more, a drought can happen at any time. The drought ends when the value becomes positive. Droughts change the amount and quality of water, which has a significant effect on the economy as well as the food supply [1,13,22]. Therefore, it is crucial to learn about the drought conditions in Sarawak.
In this study, we compared and assessed the drought monitoring performance of the SPI and SPEI at 33 meteorological stations at 3-, 6-, and 12-month timeframes in different regions of Sarawak from 1980 to 2020. The main goals of the study were (1) to identify the trends, conditions, intensity, and severity of droughts using the SPI and SPEI indicators over a specified time scale and (2) to investigate the consistency of the SPI and SPEI as well as their applications in monitoring drought conditions throughout different regions of Sarawak. The results of our research are expected to be useful in future comparisons and selections of drought indices.

2. Materials and Methods

2.1. Study Area

Sarawak is the largest state in Malaysia in terms of land area (Figure 1). It has an area of 124,450 km2 and is located immediately north of the Equator between latitudes 0°50′ and 5° N and longitudes 109°36′ and 115°40′ E, as shown in Figure 1. Sarawak has an equatorial climate and weather. For most of the year, the temperature remains relatively consistent, ranging from 23 °C early in the morning to 32 °C during the day. The temperature in highland areas such as Bario varies between 16 °C and 25 °C during the day, and it can be as low as 11 °C at night. Sarawak also experiences two monsoon seasons. The northeast monsoon (NE), which occurs from November to March, is known for its heavy rainfall, whereas the southwest monsoon (SW), which occurs between May and September, is usually milder. In addition, there are two short inter-monsoon (INT) seasons in April (Int-April) and October (Int-Oct). The NE monsoon is the wettest season, defined by easterly or northeasterly winds of 10–20 knots, whereas the SW monsoon is comparatively dry, marked by light southwesterly winds (below 15 knots) [7,8,9,10,11,12]. During the active monsoon months, the NE monsoon is more noticeable because of the sudden increase in rainfall. The SW monsoon, on the other hand, is linked to a relatively dry time [22,23].
Sarawak is divided into three different areas: the coastal lowlands, which have peat swamps and narrow deltaic and alluvial plains; a large area of rolling hills, which reach up to 300 m; and the mountain highlands, which go all the way to the border with Kalimantan. It is where Malaysia’s longest river, the Batang Rajang, starts in the Iran Mountains and flows southwest to Kapit, where it turns west and flows 563 km to the South China Sea. Agriculture is the mainstay economy of Sarawak, which is mostly focused on cash crop production. Paddy, sago, rubber, and pepper are examples of commodities that have made significant contributions to the economy of Sarawak [24,25,26,27]. Thus, any change in the rainfall pattern as a result of climate variability will impact agriculture production activities.

2.2. Precipitation Data Analysis

The precipitation, maximum and minimum temperatures, and statistical data from a period of 40 years (1981–2020) were analyzed. The monthly precipitation and temperature data were obtained from the Drainage and Irrigation Department (DID) of Sarawak. Table 2 shows descriptions of the 33 rainfall stations, and Figure 1 shows all the rainfall stations in the different regions of Sarawak. However, it is important to note that these meteorological stations are not evenly distributed, and the length of time that their rain records were kept was not sufficient in monitoring how rainfall has changed over time in all of Sarawak. The data from these 33 stations were used to calculate the SPI and SPEI in order to understand the district’s drought occurrence rate. Figure 2 shows a graph of the average precipitation for each month and season at all stations. To calculate the trend of the precipitation, the XLSTAT 2018 software from AddinSoft was used.

2.3. Drought Indices

A comparison of the SPI and SPEI was conducted to find out if potential evapotranspiration influences the drought index. The analyses were conducted at several time scales for the period between 1981 and 2020. The various time scales (1, 3, 6, and 12 months) indicate agricultural, meteorological, and hydrological droughts, respectively. The SPI and SPEI were calculated using the SPEI package [1] and the R software package, which is a free software environment for statistical computing and graphics. This package offers different ways to calculate the SPI and SPEI.

2.4. Standardized Precipitation Index (SPI)

The SPI is a simple index used to measure drought conditions in any place and at any time because of its normal distribution [1,28,29]. Furthermore, the SPI is recommended by the World Meteorological Organization (WMO) as the principal meteorological drought indicator for countries to monitor and investigate drought circumstances [16]. The WMO recommends the SPI as the primary meteorological drought index for countries to monitor and research drought situations [17]. The SPI is a simple index that is easy to calculate on different timescales, such as 3, 6, 9, or 12 months, by using only the amount of rain. In the SPI, the rainfall data are changed into a command unit and normalized. The normalized number is the number of standard deviations by which the observed rainfall differs from the long-term average for a random variable with a normal distribution, as determined by Equation (1):
SPI = X X m σ
where
  • X = recorded rainfall at the station,
  • X m = mean of rainfall,
  • σ = standard deviation.
The SPI was estimated in this study using the RStudio application and SPI package version 3.0. “Precinct on package” version 1.7.0 is user-friendly because it is computed solely through the utilization of monthly precipitation data [2]. Meanwhile, the gamma distribution transforms the precipitation into a normal variable. Table 1 shows that when the SPI is above zero or below zero precipitation is above or below the long-term mean, respectively.

2.5. Standardized Precipitation Evaporation Index (SPEI)

The SPEI is calculated in the same way as the SPI, but to use the SPEI, rainfall and temperature are used as inputs in the calculation. The researchers in [30] developed the Standardized Precipitation Evapotranspiration Index, which is known as the SPEI. The difference between potential evapotranspiration (PET) and rainfall is used to figure out the climatic water balance. PET was calculated using the Penman–Monteith method [30]. This method employs various climate change variables, such as temperature, rainfall, wind speed, and amount of sunlight [30]. The SPEI is used to assess water levels as well as the severity of a drought scenario at various time scales [31]. Therefore, the log-logistic distribution was selected for SPEI research because it fits the extremely negative values better [32]. The SPEI and SPI both have the same drought severity values. Thus, SPEI is calculated as
Di = PPET
where D i   is the difference between precipitation (P) and PET for the month (i), and the calculated D values at different timescales are as follows:
D n k = i 0 k 1 P n 1 ( P E T ) n 1
where k is the number of months over which the sum is taken, and n is the month for which the sum is taken. D and a log-logistic probability density can be determined using Equations (4) and (5):
f ( x ) = [ 1 + ( α x y ) β ] 1
f ( x ) = β α ( x γ α ) β 1 [ 1 + ( x γ α ) β ] 2
where α , β , and γ are the scale, shape, and origin parameters, respectively, for γ >D <∞. The computed f(x) has been turned into a Z-standardized value, and the formula of the SPEI can be represented as
S P E I = W C O + C 1 W + C 2 W 2 1 + d 1 W + d 2 w 2 + d 3 w 3
where
W = 2 ln ( P )     for   P     0.5
The probability of going over a certain D i   value is provided by P = 1 f ( x ) , while the values of the constants in Equation (6) are as follows [1]:
C0 = 2.515517, C1 = 0.802853, C2 = 0.010328, d1 = 1.432788, d2 = 0.189269, and d3 = 0.001308.
The SPEI can be used to compare droughts at various regional and temporal scales because it is a standardized variable. Similar to the SPI, a drought period is described by constantly negative SPEI values depending on the severity, duration, intensity, and magnitude [1,3].

2.6. Trend Analysis of Drought

The Mann–Kendall (MK) test is used to analyze hydrological, meteorological, and climatic trends. The MK test was used to detect the historical pattern of rainfall in Sarawak from 1980 to 2020. The MK test statistic (S) is in Equation (8):
S = k = 1 n 1 j = k + 1 n s g n ( x j x k )
where x j and x k are the ranks of the k th ( k = 1 ,   2 ,   3 , , n ) and j th   ( j = k + 1 ,   2 ,   3 , , n ) observations, respectively [19,20].
Sen’s slope estimator is a nonparametric test used to determine the magnitude of the trend in the dataset and, consequently, the magnitude of the drought index values [33,34]. The trend magnitude values of drought indices were calculated as follows:
T i = x j x k j k
where the data values at times j and k   ( j > k ) are denoted by X j and X k , respectively.
At a 95% confidence level, Pearson correlation coefficients (R) were found between the SPI and SPEI indices using RStudio at the different timescales used by the 33 stations. R was computed using Equation (10):
R x y = i = 1 n ( x i x ) ( y i y ) i = 1 n ( x i x ) 2 ( y i y ) 2
where “n” indicates the number of observations, and “x” and “y” represent the SPI and SPEI, respectively.

3. Results

3.1. Rainfall Trend Analysis

The nonparametric tests were conducted using the XLSTAT 2018 software from Addinsoft. The Mann–Kendall test was used to analyze annual precipitation at 33 selected locations from 1981 to 2020. With a level of confidence of 95%, the Mann–Kendall test (MK-test) and Sen’s slope estimator were applied in order to evaluate the significance of the trend as well as the magnitude of the change. The trend analysis results are shown in Table 3. Among the 33 stations, 12 stations showed results with no significant trend in the monthly rainfall with a p-value greater than the significance level (0.05). Except for Sungai Lebai, almost all rainfall stations show a significant increasing trend. According to the analysis of the results, the average annual monthly rainfall showed a decreasing trend at most of the stations. Consequently, there was a sign of a mild increase in precipitation over this minimal 40-year study period, which could lead to severe drought in the future. These results were corroborated by another researcher [35], who discovered the long-term annual rainfall and temperature in west Malaysia, specifically in the states of Kelantan, Terengganu, and Pahang, which were the most severely affected by extreme northeast monsoon events linked to climate change [36]. Meanwhile, in the long-term trends for seasonal rainfall, the west coast of peninsular Malaysia, Perak State, showed a decrease of 0.29 mm/year during the southwest monsoon, while the northeast and inter-monsoon seasons showed minor increases [37].

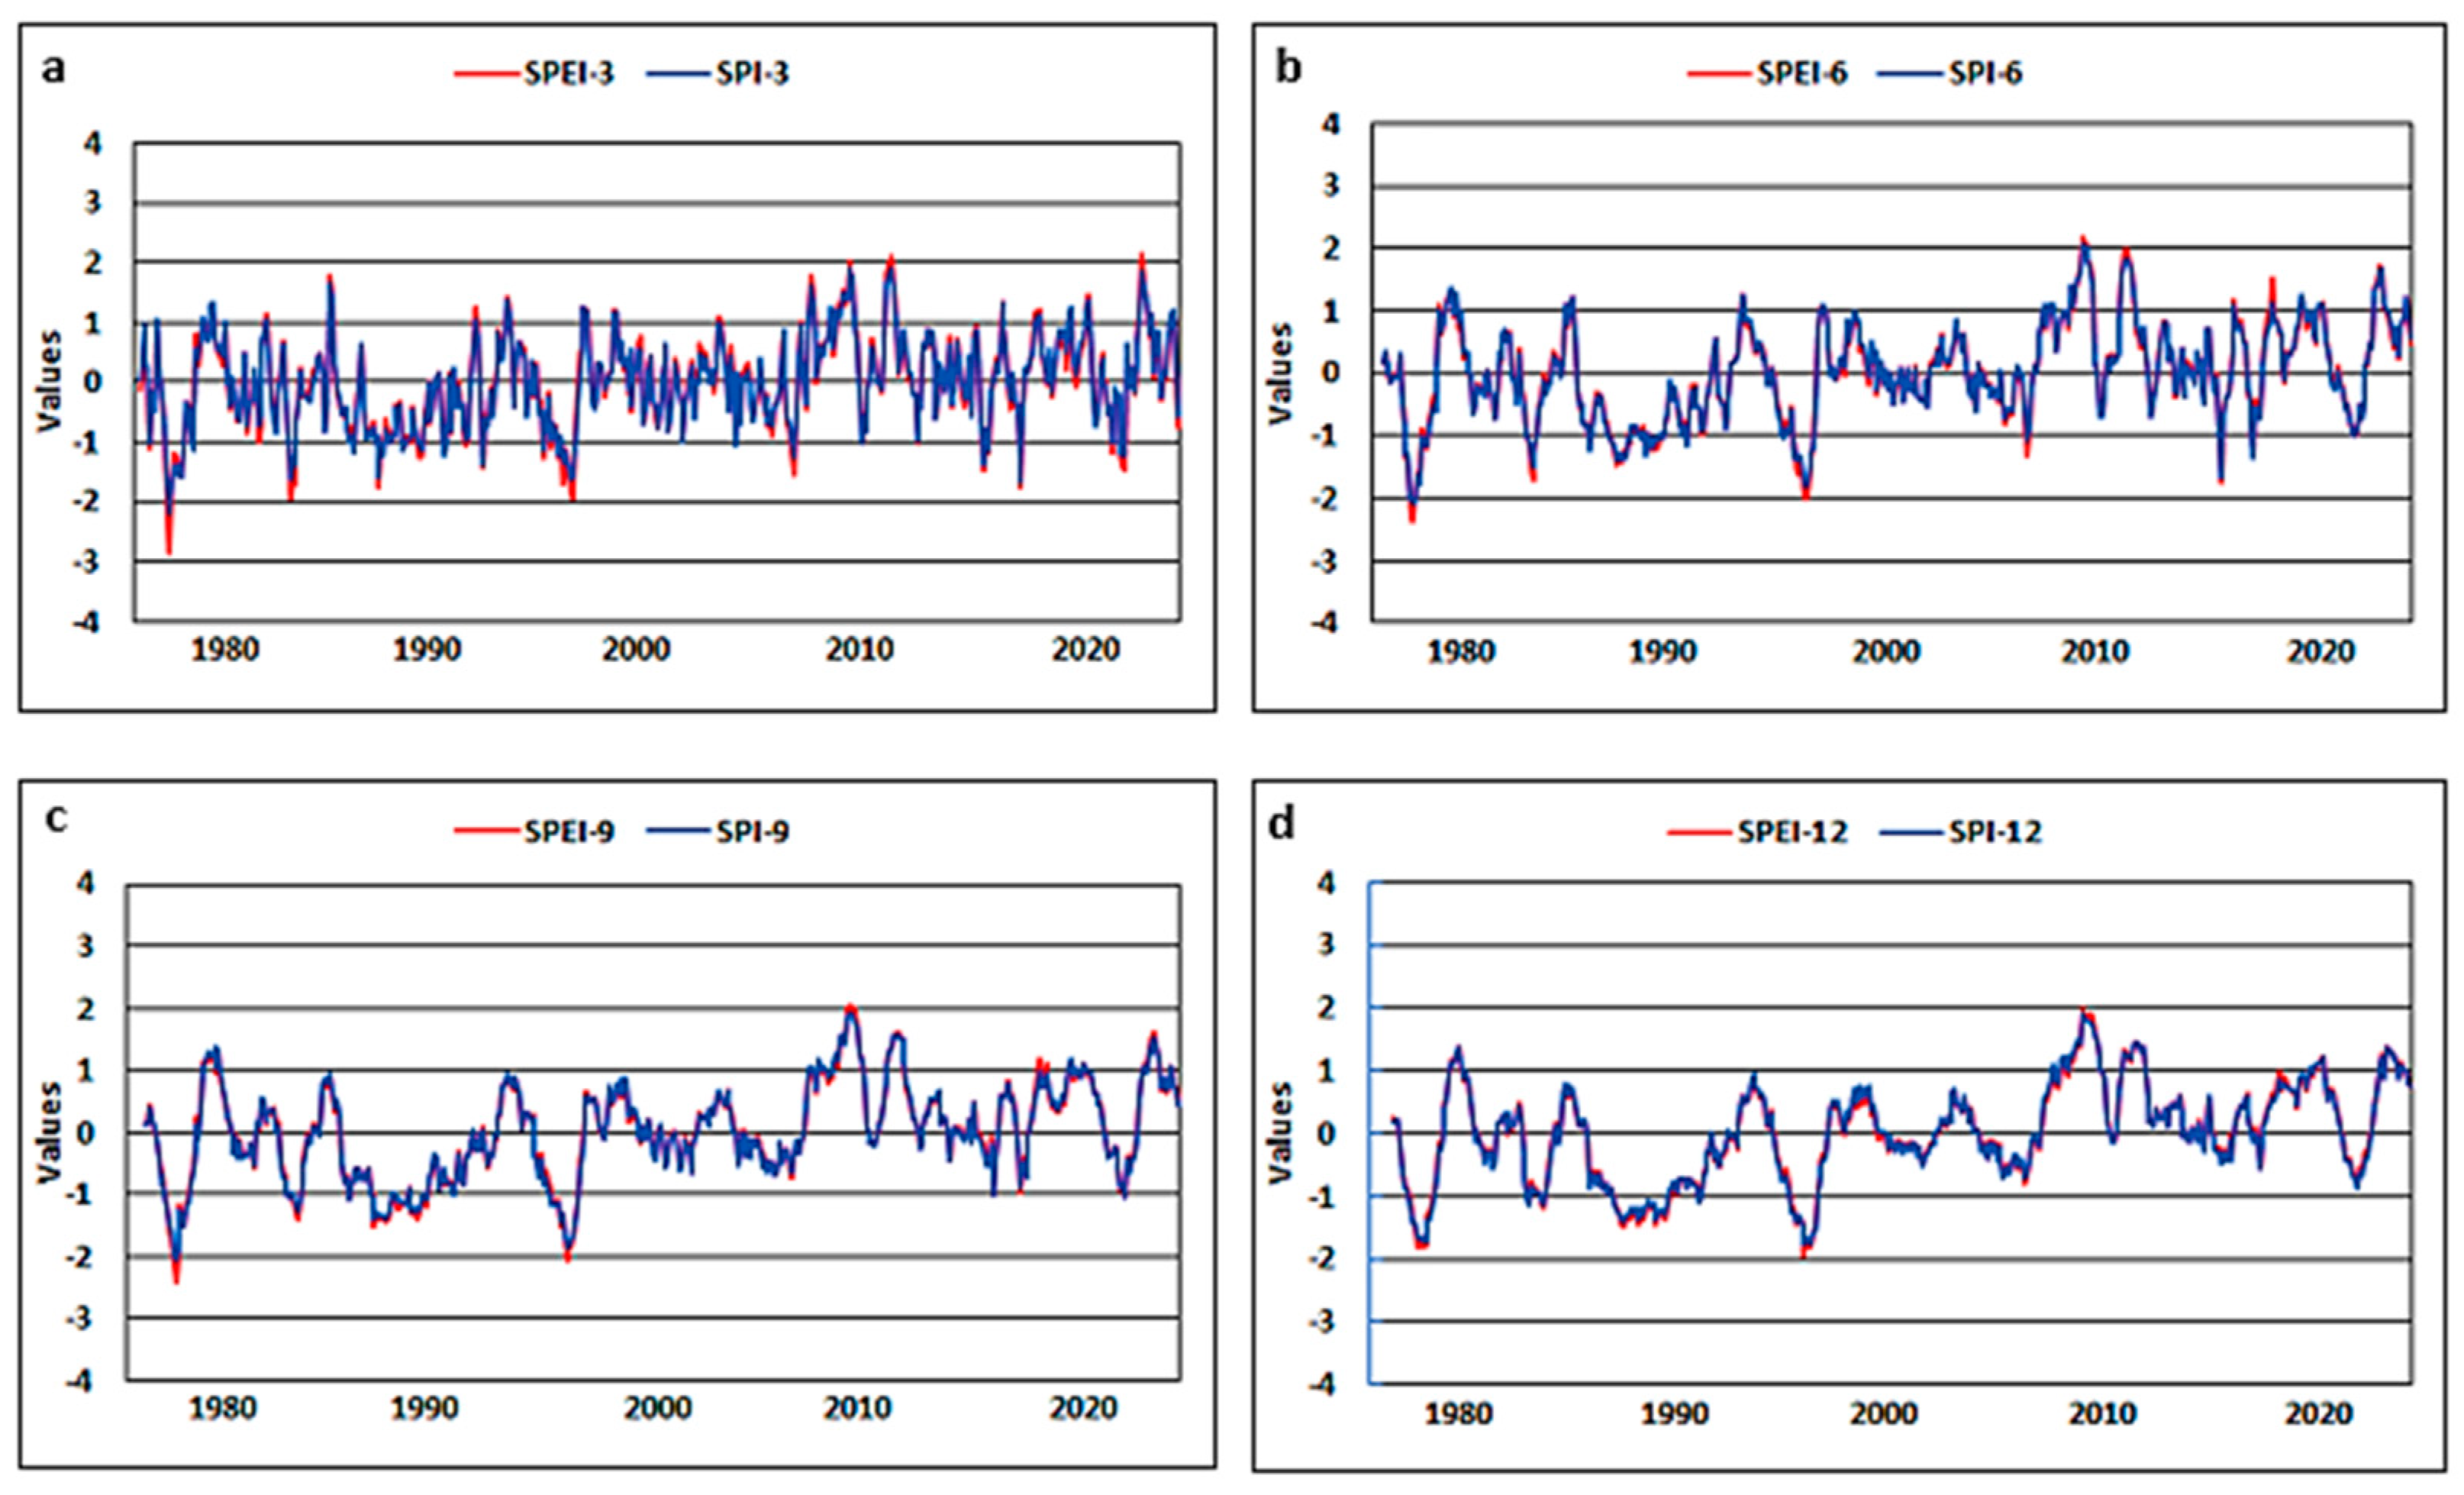
3.2. Variability of SPI and SPEI Timeseries

Most of our drought studies were generally focused on one to twelve months. Different indices’ (SPI and SPEI) timescales showed different draught durations and magnitudes. Drought studies at 1-month intervals revealed a high frequency of meteorological droughts at all stations, whereas 3-month intervals were used to analyze moisture conditions for short- and medium-term timescales, allowing for seasonal precipitation estimations [17,30]. The three-month indices were a comparison between the amount of precipitation during a particular three-month period and the total amount of precipitation during the same three-month period for all the years in the historical record. The 6-month scales make a comparison between the amount of rainfall that occurred during the specified period and the amount of rainfall that occurred during the same 6-month period in the historical report. The 6-month indices identify medium-term trends in rainfall and are an extremely useful tool for displaying the variation in precipitation that occurs throughout the year [17,30]. The 9-month SPI and SPEI values are hydrological drought indices and have been proven to help in the process of monitoring surface water supplies [21]. The devaluation trend in the SPI and SPEI indicates the strong probability of an increase in drought incidence across the basin. The determination of the most dominant trend components can be obtained by using 12-month SPI and SPEI indices.

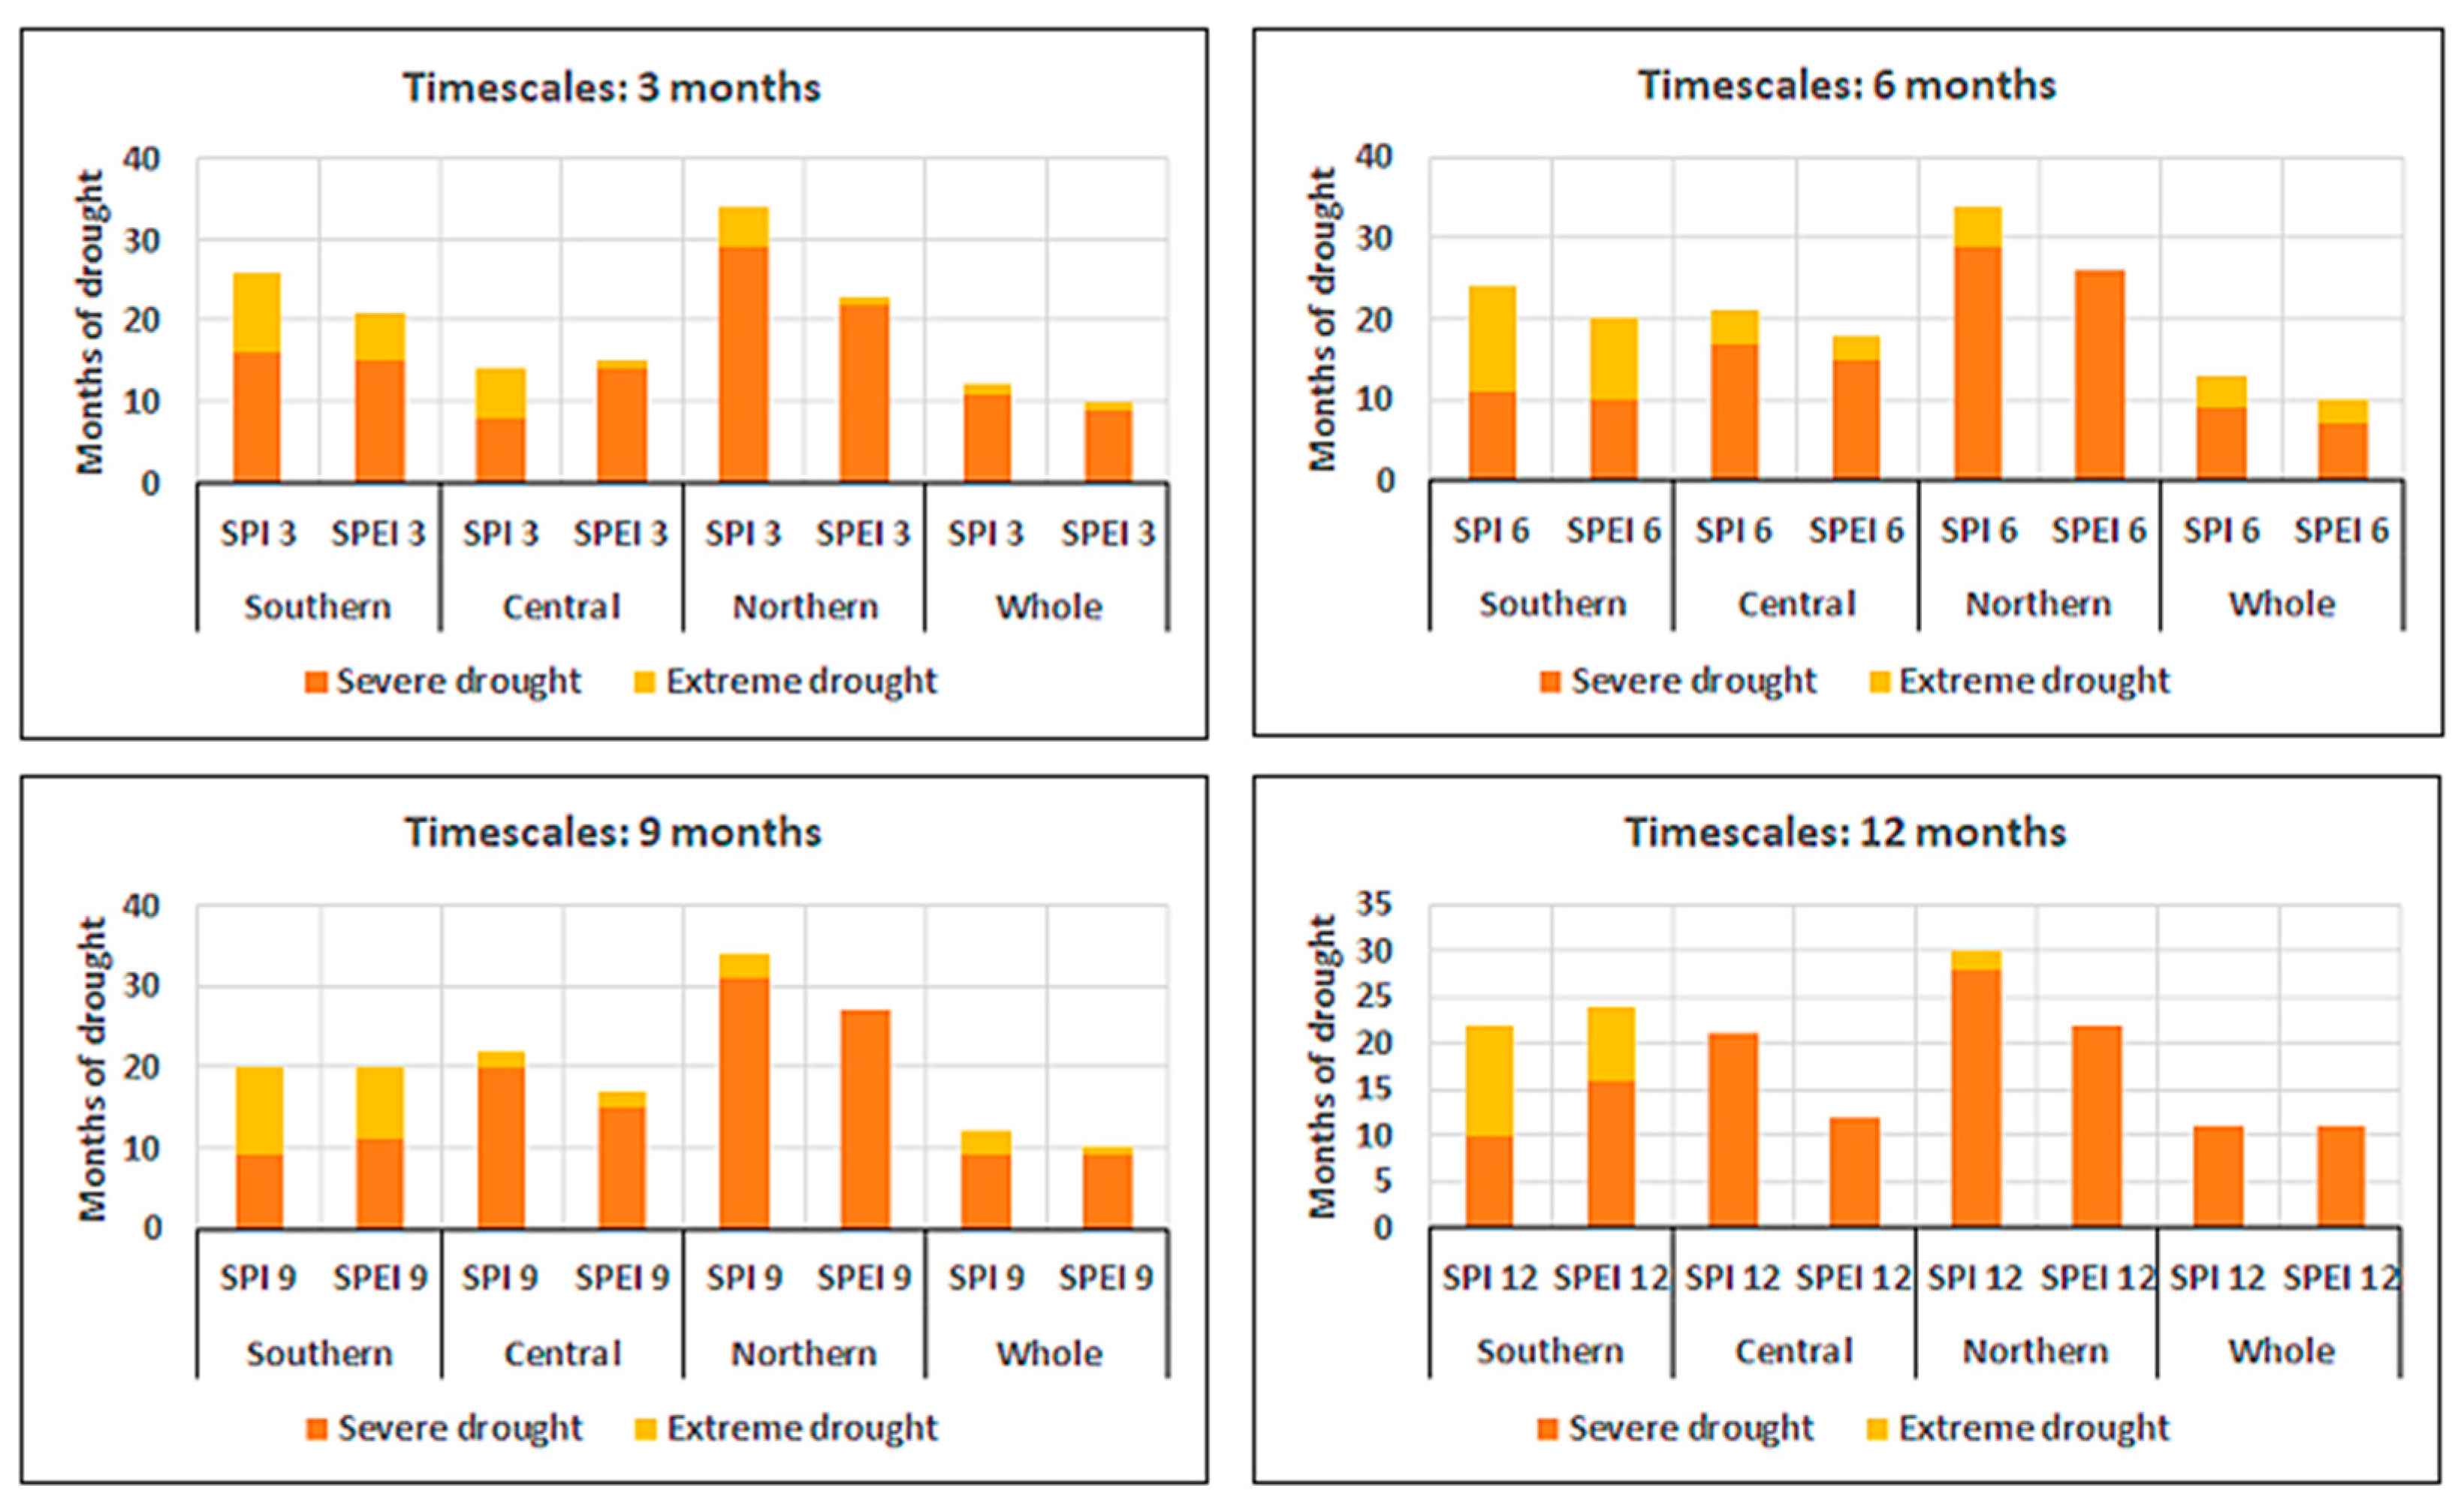
3.3. Comparison of SPI and SPEI

The values of the SPI and SPEI over the southern, central, northern, and entire region of Sarawak from 1980 to 2020 are depicted in Figure 3, Figure 4, Figure 5 and Figure 6 at 3-, 6-, 9-, and 12-month timescales. The SPI detected extreme droughts in the southern region in 1981, 1982, 1990, 1993, 1994, 2013, and 2017 based on short-term drought conditions but was unable to identify long-term droughts in 1981, 1983, 1997, 1998, 2011, 2014, and 2018. It is evident that the SPEI identified droughts in this region more clearly than the SPI (see Figure 4). According to the WMO, the severe droughts in 1998, 2014, and 2018 were connected to a strong El Niño Southern Oscillation event, which affected millions of residents in Sarawak, Malaysia, and caused high global temperatures [16].
The central region was affected by severe droughts in 1981, 1990, 1997, 2007, 2016, and 2017 (see Figure 4). However, the SPI did not find any severe droughts in this area in 1987, 1989, 1997, 2004, or 2009. Both the SPI and SPEI accurately recognized short-term droughts in the central region. This is consistent with the work of the researchers in [13,15], who found that a severe and extensive drought episode occurred across the majority of Southeast Asia during the years 1999–2002. This drought affected the whole region. On the other hand, the SPI was unable to identify long-term exceptional droughts in 1993, 1995, 2010, 2014, or 2016 and instead categorized these years as having moderate droughts (see Figure 5).
For the whole of Sarawak, severe droughts happened in 1982, 1986, 1987, 1990, 1993, 1994, 1998, 2009, 2011, 2014, 2015, and 2016 (See Figure 6). The SPEI was capable of recognizing these years as periods of significant drought, whereas the SPI was unable to do so. In this study, we found droughts that happened in the 1980s, 1990s, 2000s, and 2010s. Our results can be compared with those of the researchers in [17,38,39]. Using precipitation alone as an input variable in the SPI calculation could lead to overestimation or underestimation. The SPEI performed effectively in detecting previous droughts in Sarawak because it has a potential evapotranspiration (PET) parameter as an additional input, as compared with the SPI [30]. This discovery has been reported by other researchers, who found that the SPEI represents real-life scenarios of drought [28]. The reason for this is that greater air temperatures and lower rainfall lead to increased evaporation.
While Vicente-Serrano et al. [18] demonstrated that the SPEI can also disclose the effect that evaporation and precipitation have on drought conditions, Uddin et al. [19] highlighted that the application of PET demonstrates a high degree of concordance with the hydrometeorological index. Both of these studies were published in the Water Resources Research journal. As a result of our research, we found that the amount of precipitation and PET both have a different effect on how bad droughts are. This statement validates the findings of a previous study conducted by other researchers [17,38,39]. They discovered that PET is an essential component of the hydrological cycle in Sarawak and that the variation in its concentration is mostly determined by the amount of rainfall [17,38,39,40,41].
Figure 7 presents the number of severe and extreme drought events that have occurred at different timescales in Sarawak. In terms of severe drought, it is clear that the SPEI number is higher than the SPI number at every timescale. Except for the central part, the SPEI finds more severe droughts than the SPI over a 3-month period (about 12 months). In the case of a severe drought, the SPEI identified almost 70 months, but SPI detects less than 60 months. On a 6-month timescale, patterns of severe drought were the same for both the SPI and SPEI, but patterns of extreme drought changed except in the north. Both the SPI and SPEI agree that Sarawak has been in a severe and extreme drought for almost 22 months because of a long-term drought. The finding was similarly supported by researchers who assessed the drought in the Sarawak River Basin using the SPI [13].

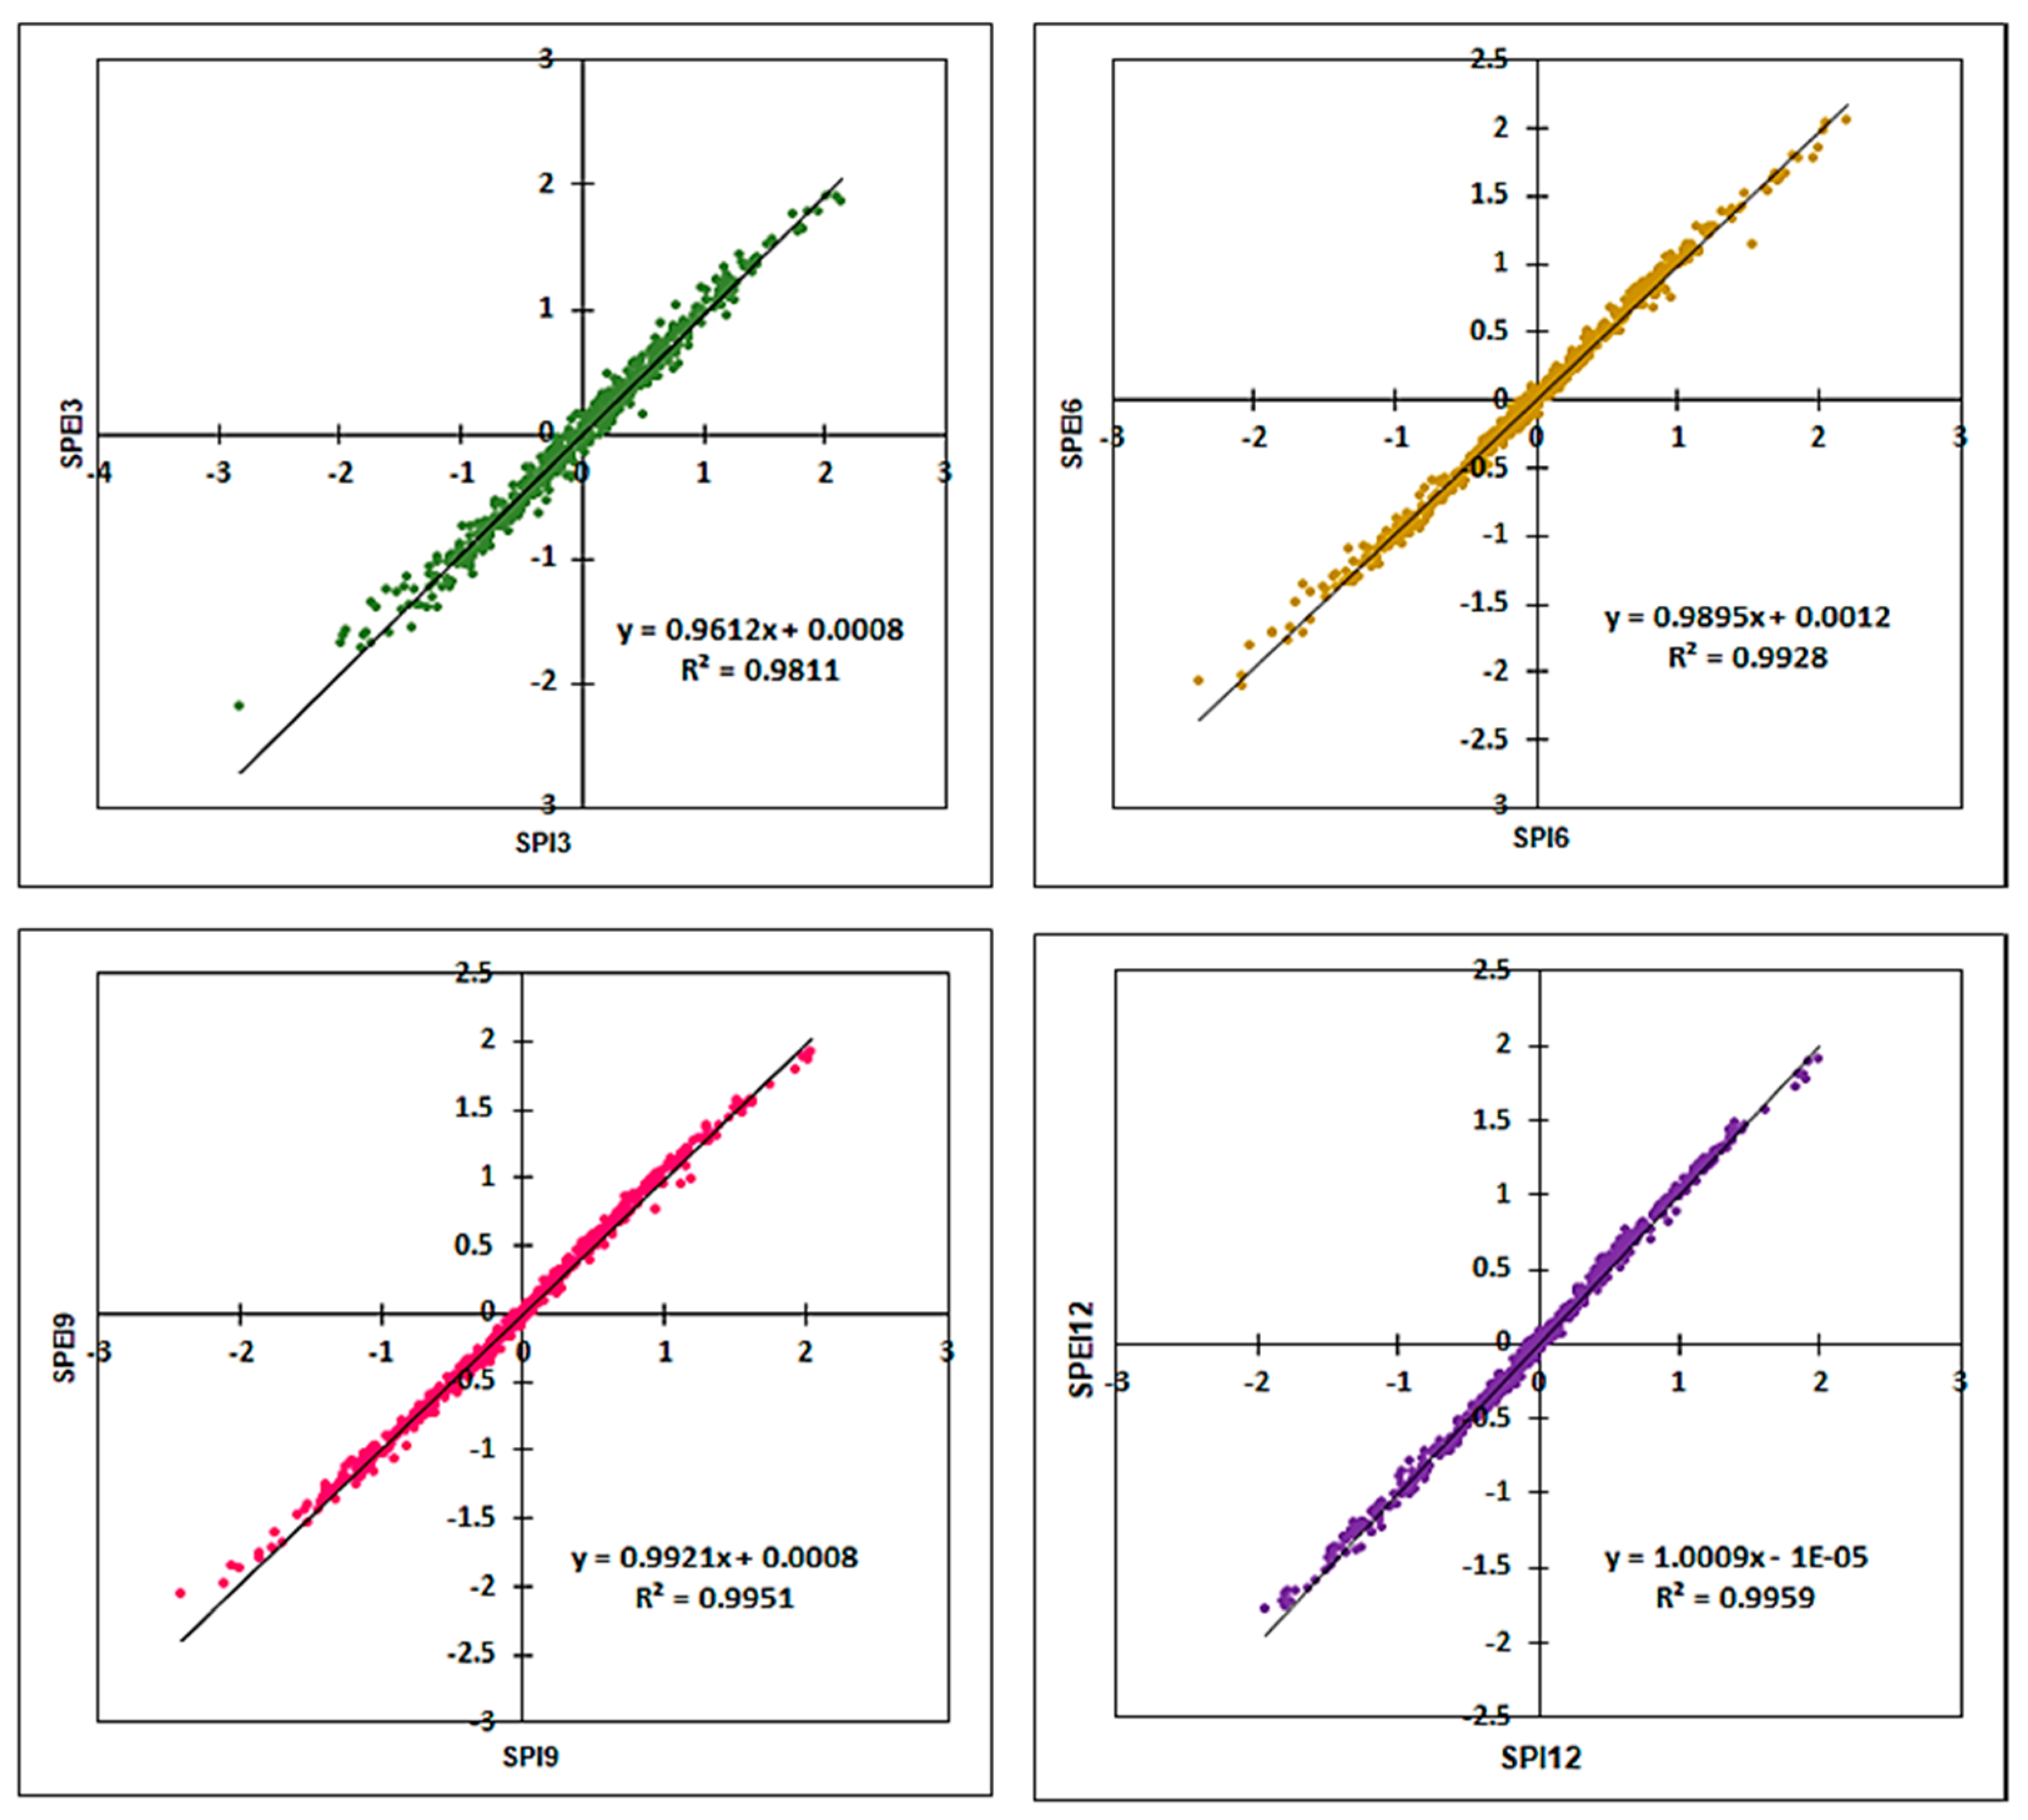
3.4. Correlation Analysis of SPI and SPEI

Figure 8 shows Pearson’s correlation coefficient between the SPI and SPEI over different amounts of time. For 6-, 9-, and 12-month timescales, there was a linearly significant Pearson’s correlation coefficient between the SPI and SPEI (r = 0.99 at p < 0.0001), but for a 3-month timescale, the correlation was r = 0.99 at p < 0.0001. Both the SPI and the SPEI demonstrated an upward trend, and there was a significant connection between the two indices. Some researchers [33] also discovered that the SPEI shows excellent capability in detecting extreme drought in Sabah. The finding is in good agreement with what Uddin et al. [31] found in the western, eastern, and central regions of Bangladesh. Other researchers found that the first- and second-best drought monitoring indices in South Africa were the SPI and the EDI (Effective Drought Index), which contradicts this study [34]. On the other hand, they showed that the EDI is better than the SPI for tracking both long-term and short-term droughts in the semi-arid river basin in India [16]. This difference could be caused by the flat, low-lying terrain of our study area, which makes it possible for oceanic and atmospheric circulation patterns to be different.

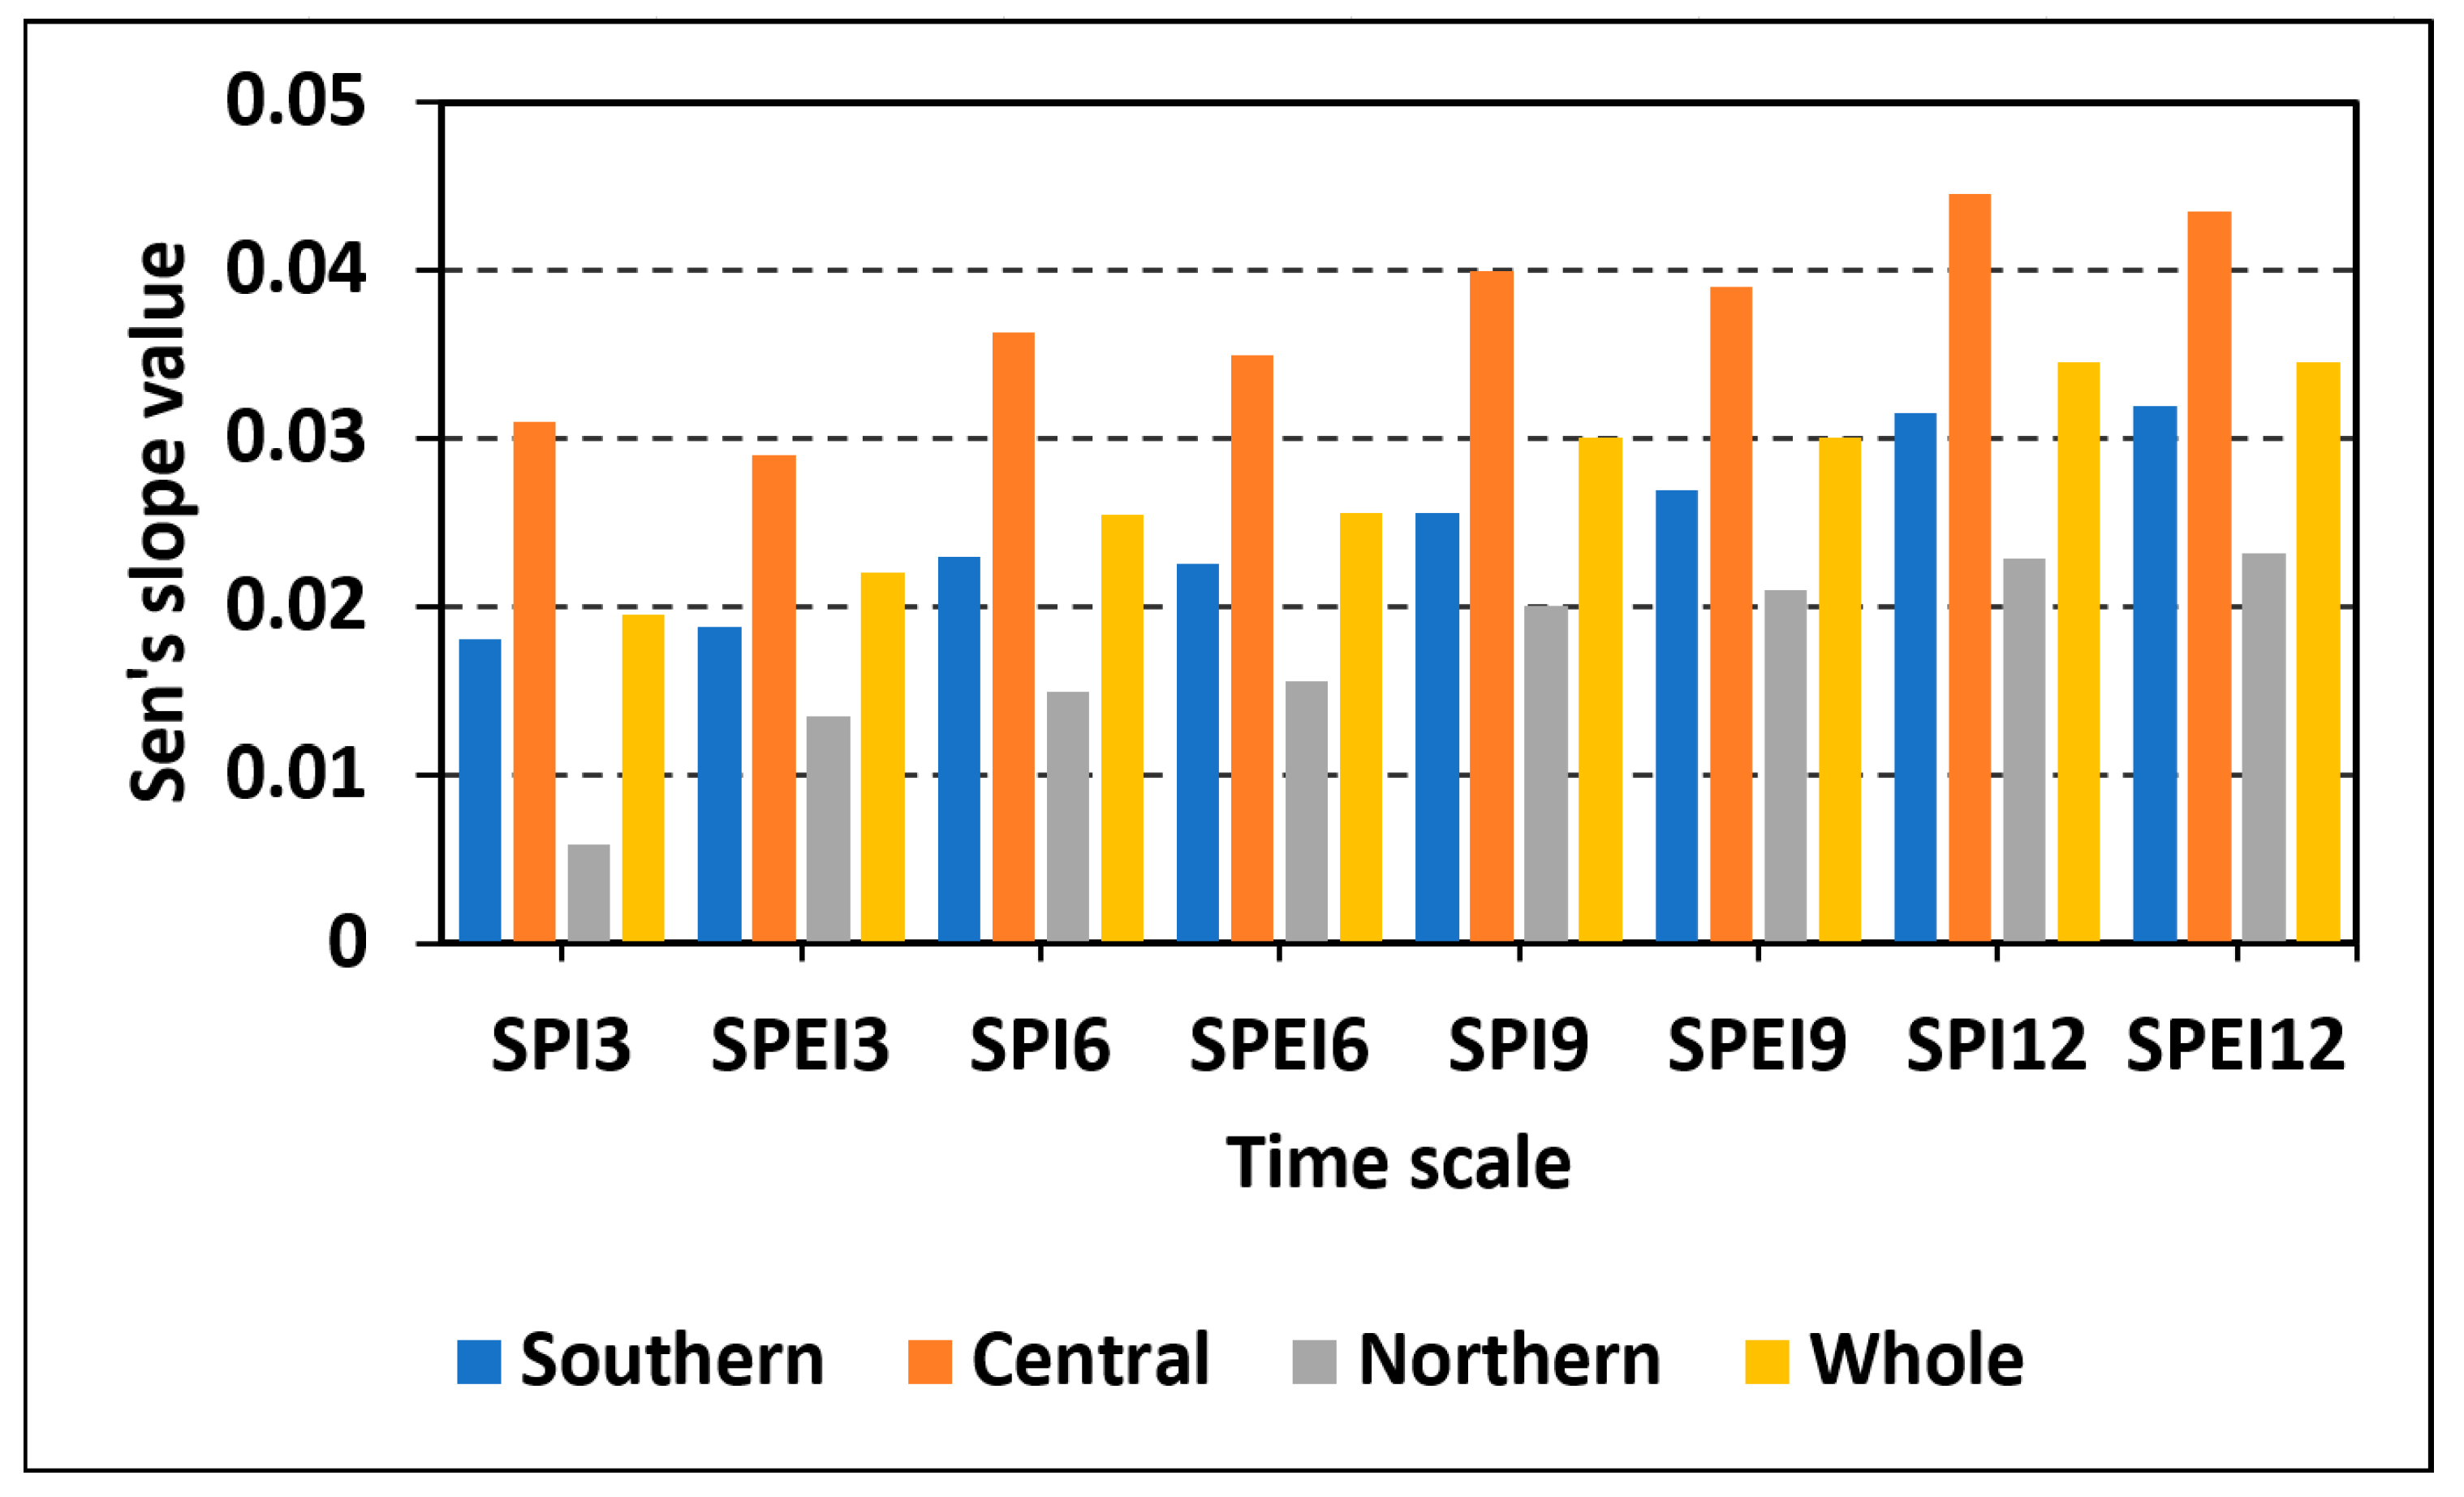
3.5. Sen’s Slope Estimation Results

A trend analysis on four different timescales and annual data series utilizing the SPI and SPEI was undertaken using a modified Mann–Kendall trend test in the RStudio tool, as described by the researcher in [35]. Figure 9 shows that, based on the estimated size of Sen’s slope trend, there were positive trends in all regions of Sarawak. All SPI and SPEI values showed a gradual increase from 1 to 12 months. The findings of this study are consistent with those obtained in earlier research conducted by [2,18], who showed all positive values of Sen’s slope in a different area of study.

4. Discussion

Drought is a creeping climatic phenomenon that is hard to forecast in terms of occurrence, severity, intensity, and return periods. In this study, it was important to investigate and identify the drought occurrence rate, magnitude, probable return period, and severity as well as extreme drought events so that preparations can be made for the proper management of water resources [42,43,44]. The operational definition of “drought” begins with the establishment of the beginning and ending dates, as well as the intensity of drought episodes [45]. According to the operational definition, there are four primary types of droughts: (1) meteorological, representing a lack of precipitation; (2) agricultural, representing a lack of moisture following a drop in crop yields that has nothing to do with surface water resources; (3) hydrological, representing a lack of flows, either in terms of subsurface or surface water; and (4) socioeconomic, representing an inability to meet water needs due to a shortage of available water [46]. The best technique to operationally describe drought is using drought indices. Various drought indices have been developed by researchers from all over the world in order to determine the magnitude, severity, and frequency of droughts. Some of these drought indices include the Standardized Precipitation Index, SPI [19], the Standardized Precipitation Evapotranspiration Index, SPEI [20], the PDSI (Palmer Drought Severe Index) [47,48,49,50,51,52], the SWSI (Surface Water Supply Index), the Standardized Water Level Index (SWLI), the Standardized Hydrological Index (SHI) [31], the RDI (Reclamation Drought Index) [47], and the EDI (Effective Drought Index) [48]. Furthermore, the Crop Moisture Index (CMI), the Moisture Adequacy Index (MAI), and the Crop Water Stress Index (CWSI) are agricultural drought monitoring indices.
The WMO recommends using the SPI and SPEI indicators to measure the size, severity, and length of droughts [17]. In the last few decades, these two indices have become the most important ones for measuring drought [49,50,51,52,53]. These two drought indicators—with the SPI being based on precipitation data and the SPEI being based on precipitation and evaporation data—have tremendous significance for gauging agricultural productivity, determining the occurrence of wildfires, determining water levels, and identifying precipitation accumulation, among other applications [5]. While the SPI is able to define the many types of droughts, it does not take into account how evaporation contributes to drought. However, the SPEI takes potential evapotranspiration (PET) into account as well as precipitation, making it better suited for drought monitoring in all regions in the context of global warming. The potential evapotranspiration (PET) is a measurement of the amount of water that evaporates from bodies of water, and the impact that PET has on groundwater systems is indirect and significantly more complicated.
Most studies have shown many distinctions between the SPI and the SPEI when it comes to regional drought monitoring [16,29,54]. From a timeseries standpoint, fluctuations in the SPI and SPEI were quite similar across all timescales. The most frequent changes occurred on the shorter timescale, and the gap between the two indices was the widest at this point. Although the fluctuations of the SPI and SPEI tended to be mild over extended timescales and the discrepancies between them decreased, there were still some minor differences in the severity of the droughts. Because the SPI and SPEI values were different, the droughts that the SPI and SPEI detected were in different places, which was also shown in the study. However, it is still important to discuss whether or not the use of SPI and SPEI levels can be consistent when identifying drought [10,35,36,54].
Due to climate change and different weather conditions in different regions, the SPI and SPEI will always be different. We compared and analyzed how the SPI and SPEI changed over time and space on different timescales so that we could learn more about how the two indices work in different parts of Sarawak and make it easier to perform a follow-up study. The SPI and SPEI have also been talked about for a while in terms of how they can be used to monitor drought [10,35,37]. Even though the SPI is able to define the many types of droughts, it does not take into account how evaporation contributes to drought. The SPEI, on the other hand, takes into account both precipitation and evapotranspiration, making it better suited for drought monitoring in the context of global warming [10,36,38]. During the analysis, it was found that the monsoon months of November, December, and January bring the most rain to the south and center of the country [38]. On the other hand, the northern region receives less precipitation overall. Drought is not a random event in the environment; it is a hydrological extreme that happens over and over again.
Finding trends and making predictions about drought in dry areas is an important part of water resource management planning. This study accurately evaluated the trend of drought occurrence, providing a visual depiction of the severity and intensity of the droughts in the region. Using different drought indices to figure out how bad droughts are is another important part of studying climate extremes. The main focus of this study is on finding the characteristics, magnitude, and severity of the effects by using the SPI and SPEI indices. Another researcher used SPI as a measurement tool to find and track droughts in the Sarawak River Basin over 40 years, and the results showed that the SPI values decreased over the three timescales, which is indicative of a greater propensity for drought events across the basin [13]. Meanwhile, Fung et al. [46] found that there was a good correlation between the SPI/SPEI and El Niño drought events in Malaysia. During El Niño periods, the effect of the sea surface temperature is more important, to the point that it affects the air temperature in coastal regions.
Drought occurrences differ between the southern, central, and northern regions of Sarawak. Between the years 1990 and 2020, this region was affected by a range of drought conditions, ranging from severe to extreme, as shown by the many statistical approaches used to determine drought. Significant extreme drought conditions were identified in 2017 and extended into 2018. A similar extreme and severe drought was also detected by the Standardized Precipitation Evapotranspiration Index within the same timeframe. Due to the strong El Niño, there were different severe and extreme droughts from 1982 to 1983, 1986 to 1988, 1991 to 1992, 1997 to 1998, 2009 to 2010, and 2014 to 2016 [2]. As the temperatures rise, the SPEI becomes more significant than the SPI in terms of drought detection. The importance of PET becomes clear when comparing SPEI and SPI readings over time [38]. The increasing PET seems to affect the southern and northern regions more than the central region. High precipitation throughout the year in the central region seems to be the reason why SPI and SPEI drought events happen less often and last for shorter amounts of time [55]. The northern region shows more than 70 droughts by using the SPEI but for fewer than 60 months using the SPEI method in different timescales (3, 6, 9, and 12 months). The results of this study were similar to what other research has found [2,25,39]. In order to better understand the performance of the two indices in Sarawak and to assist the follow-up study, we compared and examined the fluctuations of the SPI and the SPEI in time and space from the perspective of multiple timelines. However, the SPEI may be better suited to analyzing drought event features in the Sarawak region since it takes more precipitation and evapotranspiration data into consideration than the conventional drought index.

5. Conclusions

The primary objective of this research was to determine the severity of drought conditions in Sarawak regions by analyzing the temporal patterns, spatial characteristics, and operational accuracy provided by the SPI and the SPEI indices at 3-, 6-, 9-, and 12-month timescales for the period from 1980 to 2020. The temporal assessment of drought frequency and fluctuation for both the SPI and the SPEI showed that both were significantly affected by short-term rainfall (3 months) in a significant way. However, as the timescale increased, the variations were less frequent, and the differences between dry and wet circumstances became more distinct, which reflected the characteristics of medium-term (3-month) and long-term (6- and 12-month) droughts. Though the SPI and SPEI showed similar changes in moisture responsiveness over increasing timescales, the results of the Mann–Kendall trend tests and the Sen’s slope estimate for the number of dry months showed that they followed different trends in their estimates of dry months due to the influence adduced to temperature. On the other hand, because of the similarities in their spatial fluctuations, both of these datasets were able to be used interchangeably for the spatial depiction of drought features in Sarawak. In terms of POD (probability of detection), FAR (false alarm duration), and onset detection error, their occurrence, duration, and onset detection accuracy were analyzed, and the results showed that the SPI has a slight advantage for short-term drought monitoring over a period of 1 month. However, the SPEI performed better on higher timescales, specifically, for mid-term drought monitoring over a period of 3 months and long-term drought monitoring over a period of 6 to 12 months. This was mostly due to the growing impact of temperature. During the El Niño-caused droughts of 1997–1998 and 2015–2016, the SPEI provided a more accurate depiction of long-term drought severity, further emphasizing the role of temperature in drought creation. Therefore, temperature must be considered as a potential factor. Thus, it was decided that the SPEI, which includes the effect of temperature in its estimation process, is better for drought monitoring in Sarawak regions. However, in the case of a short-term drought worsened by rain, this does not hold true.
In this study, we compared the SPI to the SPEI as means of evaluating drought, finding that, while both indices can inferably depict agricultural droughts on different timescales, the SPEI is more effective in the modern period of global warming. Nevertheless, we suggest that indices that include soil moisture content should be used for future assessments due to their capacity to indicate the direct effect of drought on crops. However, using soil moisture may limit the spatial comparability of the indicators. Therefore, more and better-distributed soil moisture content monitoring stations are required for future research. The implementation of drought indices may have a strong connection to natural traits and seasonality in the Sarawak region, and with improvements in drought prediction and data projection, it will be easier to keep track of droughts in the future.

Author Contributions

Conceptualization, I.I., T.H. and M.S.; methodology, I.I., T.H., N.L.F. and M.S.; validation, M.N.H.J., R.K.B., N.F.S. and A.B.; formal analysis, I.I., M.N.H.J., N.F.S. and N.L.F.; investigation, M.N.H.J., R.K.B. and A.B.; resources, M.N.H.J., R.K.B., N.F.S. and A.B.; data curation, I.I. and N.F.S.; writing—original draft preparation, I.I. and N.F.S.; writing—review and editing, T.H., N.L.F. and M.S.; visualization, I.I., N.L.F. and M.S.; supervision, T.H. and M.S.; project administration, T.H. and N.L.F.; funding acquisition, T.H. and M.N.H.J. All authors have read and agreed to the published version of the manuscript.

Funding

The authors gratefully acknowledge the Curtin Malaysia Postgraduate Research Scholarship (CMPRS) for financial support.

Institutional Review Board Statement

Not applicable.

Informed Consent Statement

Not applicable.

Data Availability Statement

Not applicable.

Acknowledgments

The authors are grateful to the Sarawak Meteorological Department for providing the data necessary to complete this research. We greatly appreciate the support of Amirah, Meteorological Officer, Department of Meteorology Sarawak, Malaysia for providing the data. This research was supported by the Higher Research Degree Scholarship (HRD) of Curtin University, Miri, Sarawak, Malaysia.

Conflicts of Interest

The authors declare no conflict of interest.

References

  1. Tirivarombo, S.; Osupile, D.; Eliasson, P. Drought Monitoring and Analysis: Standardised Precipitation Evapotranspiration Index (SPEI) and Standardised Precipitation Index (SPI). Phys. Chem. Earth Parts A B C 2018, 106, 1–10. [Google Scholar] [CrossRef]
  2. Mondol, M.A.H.; Zhu, X.; Dunkerley, D.; Henley, B.J. Observed Meteorological Drought Trends in Bangladesh Identified with the Effective Drought Index (EDI). Agric. Water Manag. 2021, 255, 107001. [Google Scholar] [CrossRef]
  3. Malik, A.; Kumar, A.; Kisi, O.; Khan, N.; Salih, S.Q.; Yaseen, Z.M. Analysis of Dry and Wet Climate Characteristics at Uttarakhand (India) Using Effective Drought Index. Nat. Hazards 2021, 105, 1643–1662. [Google Scholar] [CrossRef]
  4. Xu, X.; Wang, L.; Sun, M.; Fu, C.; Bai, Y.; Li, C.; Zhang, L. Climate Change Vulnerability Assessment for Smallholder Farmers in China: An Extended Framework. J. Environ. Manag. 2020, 276, 111315. [Google Scholar] [CrossRef] [PubMed]
  5. Alam, A.S.A.F.; Begum, H.; Masud, M.M.; Al-Amin, A.Q.; Filho, W.L. Agriculture Insurance for Disaster Risk Reduction: A Case Study of Malaysia. Int. J. Disaster Risk Reduct. 2020, 47, 101626. [Google Scholar] [CrossRef]
  6. Leal Filho, W.; Azeiteiro, U.M.; Balogun, A.-L.; Setti, A.F.F.; Mucova, S.A.R.; Ayal, D.; Totin, E.; Lydia, A.M.; Kalaba, F.K.; Oguge, N.O. The Influence of Ecosystems Services Depletion to Climate Change Adaptation Efforts in Africa. Sci. Total Environ. 2021, 779, 146414. [Google Scholar] [CrossRef]
  7. Rahman, H.A. Climate Change Scenarios in Malaysia: Engaging the Public. Int. J. Malay-Nusant. Stud. 2018, 1, 55–77. [Google Scholar]
  8. Kumar, D.; Kumar Bhattacharjya, R. Study of Integrated Social Vulnerability Index SoVI int of Hilly Region of Uttarakhand, India. Environ. Clim. Technol. 2020, 24, 105–122. [Google Scholar] [CrossRef] [Green Version]
  9. Grigorescu, I.; Mocanu, I.; Mitrică, B.; Dumitraşcu, M.; Dumitrică, C.; Dragotă, C.-S. Socio-Economic and Environmental Vulnerability to Heat-Related Phenomena in Bucharest Metropolitan Area. Environ. Res. 2021, 192, 110268. [Google Scholar] [CrossRef]
  10. Maharjan, A.K.; Wong, D.R.E.; Rubiyatno, R. Level and Distribution of Heavy Metals in Miri River, Malaysia. Trop. Aqua. Soil Pollut. 2021, 1, 74–86. [Google Scholar] [CrossRef]
  11. Aksha, S.K.; Juran, L.; Resler, L.M.; Zhang, Y. An Analysis of Social Vulnerability to Natural Hazards in Nepal Using a Modified Social Vulnerability Index. Int. J. Disaster Risk Sci. 2019, 10, 103–116. [Google Scholar] [CrossRef]
  12. Sa’adi, Z.; Shahid, S.; Ismail, T.; Chung, E.-S.; Wang, X.-J. Trends Analysis of Rainfall and Rainfall Extremes in Sarawak, Malaysia Using Modified Mann–Kendall Test. Meteorol. Atmos. Phys. 2019, 131, 263–277. [Google Scholar] [CrossRef]
  13. Frichot, J.J.H.; Rubiyatno; Talukdar, G. Water Quality Assessment of Roof-Collected Rainwater in Miri, Malaysia. Trop. Aqua. Soil Pollut. 2021, 1, 87–97. [Google Scholar] [CrossRef]
  14. Kemarau, R.A.; Eboy, O.V. The Impact of El Niño–Southern Oscillation (ENSO) on Temperature: A Case Study in Kuching, Sarawak. MJSSH 2021, 6, 289–297. [Google Scholar] [CrossRef]
  15. Tang, K.H.D. Climate Change in Malaysia: Trends, Contributors, Impacts, Mitigation and Adaptations. Sci. Total Environ. 2019, 650, 1858–1871. [Google Scholar] [CrossRef] [PubMed]
  16. Sobral, B.S.; de Oliveira-Júnior, J.F.; de Gois, G.; Pereira-Júnior, E.R.; Terassi, P.M.D.B.; Muniz-Júnior, J.G.R.; Lyra, G.B.; Zeri, M. Drought Characterization for the State of Rio de Janeiro Based on the Annual SPI Index: Trends, Statistical Tests and Its Relation with ENSO. Atmos. Res. 2019, 220, 141–154. [Google Scholar] [CrossRef]
  17. Bera, B.; Shit, P.K.; Sengupta, N.; Saha, S.; Bhattacharjee, S. Trends and Variability of Drought in the Extended Part of Chhota Nagpur Plateau (Singbhum Protocontinent), India Applying SPI and SPEI Indices. Environ. Chall. 2021, 5, 100310. [Google Scholar] [CrossRef]
  18. Qaisrani, Z.N.; Nuthammachot, N.; Techato, K. Asadullah Drought Monitoring Based on Standardized Precipitation Index and Standardized Precipitation Evapotranspiration Index in the Arid Zone of Balochistan Province, Pakistan. Arab. J. Geosci. 2021, 14, 1–13. [Google Scholar] [CrossRef]
  19. McKee, T.B.; Doesken, N.J.; Kleist, J. The relationship of drought frequency and duration to time scales. In Proceedings of the 8th Conference on Applied Climatology, Anaheim, CA, USA; 1993; Volume 17, pp. 179–183. [Google Scholar]
  20. Vicente-Serrano, S.M.; Beguería, S.; López-Moreno, J.I. A Multiscalar Drought Index Sensitive to Global Warming: The Standardized Precipitation Evapotranspiration Index. J. Clim. 2010, 23, 1696–1718. [Google Scholar] [CrossRef] [Green Version]
  21. Sarkar, M.S.K.; Begum, R.A.; Pereira, J.J.; Jaafar, A.H.; Saari, M.Y. Impacts of and Adaptations to Sea Level Rise in Malaysia. Asian J. Water Environ. Pollut. 2014, 11, 29–36. [Google Scholar]
  22. Tan, M.L.; Juneng, L.; Tangang, F.T.; Chung, J.X.; Radin Firdaus, R.B. Changes in Temperature Extremes and Their Relationship with ENSO in Malaysia from 1985 to 2018. Int. J. Clim. 2021, 41, E2564–E2580. [Google Scholar] [CrossRef]
  23. Rosly, M.H.; Mohamad, H.M.; Bolong, N.; Harith, N.S.H. An Overview: Relationship of Geological Condition and Rainfall with Landslide Events at East Malaysia. Trends Sci. 2022, 19, 3464. [Google Scholar] [CrossRef]
  24. Sa’adi, Z.; Shahid, S.; Ismail, T.; Chung, E.-S.; Wang, X.-J. Distributional Changes in Rainfall and River Flow in Sarawak, Malaysia. Asia-Pac. J. Atmos. Sci. 2017, 53, 489–500. [Google Scholar] [CrossRef]
  25. Jones, S.E.; Barton, H.; Hunt, C.O.; Janowski, M.; Lloyd-Smith, L.; Barker, G. The Cultural Antiquity of Rainforests: Human–Plant Associations during the Mid-Late Holocene in the Interior Highlands of Sarawak, Malaysian Borneo. Quat. Int. 2016, 416, 80–94. [Google Scholar] [CrossRef]
  26. Khew, C.Y.; Koh, C.M.M.; Chen, Y.S.; Sim, S.L.; Augustine Mercer, Z.J. The Current Knowledge of Black Pepper Breeding in Malaysia for Future Crop Improvement. Sci. Hortic. 2022, 300, 111074. [Google Scholar] [CrossRef]
  27. Nodin, M.N.; Mustafa, Z.; Hussain, S.I. Assessing Rice Production Efficiency for Food Security Policy Planning in Malaysia: A Non-Parametric Bootstrap Data Envelopment Analysis Approach. Food Policy 2022, 107, 102208. [Google Scholar] [CrossRef]
  28. Olaniyi, O.N.; Szulczyk, K.R. Estimating the Economic Impact of the White Root Rot Disease on the Malaysian Rubber Plantations. For. Policy Econ. 2022, 138, 102707. [Google Scholar] [CrossRef]
  29. Yerdelen, C.; Abdelkader, M.; Eris, E. Assessment of Drought in SPI Series Using Continuous Wavelet Analysis for Gediz Basin, Turkey. Atmos. Res. 2021, 260, 105687. [Google Scholar] [CrossRef]
  30. Vicente-Serrano, S.M.; Beguería, S.; Lorenzo-Lacruz, J.; Camarero, J.J.; López-Moreno, J.I.; Azorin-Molina, C.; Revuelto, J.; Morán-Tejeda, E.; Sanchez-Lorenzo, A. Performance of Drought Indices for Ecological, Agricultural, and Hydrological Applications. Earth Interact. 2012, 16, 1–27. [Google Scholar] [CrossRef] [Green Version]
  31. Wable, P.S.; Jha, M.K.; Shekhar, A. Comparison of Drought Indices in a Semi-Arid River Basin of India. Water Resour. Manag. 2019, 33, 75–102. [Google Scholar] [CrossRef]
  32. Hernandez, E.A.; Uddameri, V. Standardized Precipitation Evaporation Index (SPEI)-Based Drought Assessment in Semi-Arid South Texas. Environ. Earth Sci. 2014, 71, 2491–2501. [Google Scholar] [CrossRef]
  33. Liu, Z.; Wang, Y.; Shao, M.; Jia, X.; Li, X. Spatiotemporal Analysis of Multiscalar Drought Characteristics across the Loess Plateau of China. J. Hydrol. 2016, 534, 281–299. [Google Scholar] [CrossRef]
  34. Sen, P.K. Estimates of the Regression Coefficient Based on Kendall’s Tau. J. Am. Stat. Assoc. 1968, 63, 1379–1389. [Google Scholar] [CrossRef]
  35. Gadedjisso-Tossou, A.; Adjegan, K.I.; Kablan, A.K.M. Rainfall and Temperature Trend Analysis by Mann–Kendall Test and Significance for Rainfed Cereal Yields in Northern Togo. Sci 2021, 3, 17. [Google Scholar] [CrossRef]
  36. Wahab, N.; Kamarudin, M.; Toriman, M.; Juahir, H.; Gasim, M.; Rizman, Z.; Adiana, G.; Saudi, A.; Sukono, S.; Subartini, B. Climate Changes Impacts towards Sedimentation Rate at Terengganu River, Terengganu, Malaysia. J. Fundam. Appl. Sci. 2018, 10, 33–51. [Google Scholar]
  37. Hanif, M.F.; Mustafa, M.R.U.; Liaqat, M.U.; Hashim, A.M.; Yusof, K.W. Evaluation of Long-Term Trends of Rainfall in Perak, Malaysia. Climate 2022, 10, 44. [Google Scholar] [CrossRef]
  38. Danandeh Mehr, A.; Sorman, A.U.; Kahya, E.; Hesami Afshar, M. Climate Change Impacts on Meteorological Drought Using SPI and SPEI: Case Study of Ankara, Turkey. Hydrol. Sci. J. 2020, 65, 254–268. [Google Scholar] [CrossRef]
  39. Pei, Z.; Fang, S.; Wang, L.; Yang, W. Comparative Analysis of Drought Indicated by the SPI and SPEI at Various Timescales in Inner Mongolia, China. Water 2020, 12, 1925. [Google Scholar] [CrossRef]
  40. Uddin, M.J.; Hu, J.; Islam, A.R.M.T.; Eibek, K.U.; Nasrin, Z.M. A Comprehensive Statistical Assessment of Drought Indices to Monitor Drought Status in Bangladesh. Arab. J. Geosci. 2020, 13, 1–10. [Google Scholar] [CrossRef]
  41. Byakatonda, J.; Parida, B.P.; Kenabatho, P.K.; Moalafhi, D.B. Modeling Dryness Severity Using Artificial Neural Network at the Okavango Delta, Botswana. Glob. NEST J. 2016, 18, 463–481. [Google Scholar] [CrossRef]
  42. Payus, C.; Ann Huey, L.; Adnan, F.; Besse Rimba, A.; Mohan, G.; Kumar Chapagain, S.; Roder, G.; Gasparatos, A.; Fukushi, K. Impact of Extreme Drought Climate on Water Security in North Borneo: Case Study of Sabah. Water 2020, 12, 1135. [Google Scholar] [CrossRef]
  43. Adisa, O.M.; Masinde, M.; Botai, J.O. Assessment of the Dissimilarities of EDI and SPI Measures for Drought Determination in South Africa. Water 2021, 13, 82. [Google Scholar] [CrossRef]
  44. Bhunia, P.; Das, P.; Maiti, R. Meteorological Drought Study Through SPI in Three Drought Prone Districts of West Bengal, India. Earth Syst. Environ. 2019, 4, 43–55. [Google Scholar] [CrossRef]
  45. Wilhite, D.A.; Glantz, M.H. Understanding: The Drought Phenomenon: The Role of Definitions. Water Int. 1985, 10, 111–120. [Google Scholar] [CrossRef] [Green Version]
  46. Fung, K.F.; Huang, Y.F.; Koo, C.H. Assessing Drought Conditions Through Temporal Pattern, Spatial Characteristic and Operational Accuracy Indicated by SPI and SPEI: Case Analysis for Peninsular Malaysia. Nat. Hazards 2020, 103, 2071–2101. [Google Scholar] [CrossRef]
  47. Tsakiris, G.; Vangelis, H.J.E.W. Establishing a Drought Index Incorporating Evapotranspiration. Eur. Water 2005, 9, 3–11. [Google Scholar]
  48. Byun, H.R.; Wilhite, D.A. Objective Quantification of Drought Severity and Duration. J. Clim. 1999, 12, 2747–2756. [Google Scholar] [CrossRef]
  49. Nedealcov, M.; Răileanu, V.; Sîrbu, R.; Cojocari, R. The Use of Standardized Indicators (SPI and SPEI) in Predicting Droughts Over The Republic of Moldova Territory. Present Environ. Sustain. Dev. 2015, 9, 149–158. [Google Scholar] [CrossRef]
  50. Tan, M.L.; Chua, V.P.; Li, C.; Brindha, K. Spatiotemporal Analysis of Hydro-Meteorological Drought in The Johor River Basin, Malaysia. Theor. Appl. Climatol. 2019, 135, 825–837. [Google Scholar] [CrossRef]
  51. Liu, X.; Zhu, X.; Pan, Y.; Bai, J.; Li, S. Performance of Different Drought Indices for Agriculture Drought In The North China Plain. J. Arid. Land 2018, 10, 507–516. [Google Scholar] [CrossRef] [Green Version]
  52. Palmer, W.C. Meteorological Drought; US Department of Commerce, Weather Bureau: Silver Spring, MD, USA, 1965; p. 30.
  53. Annual 2021 Global Climate Report. Available online: https://www.ncdc.noaa.gov/news/drought-importance-drought-indicators (accessed on 23 January 2022).
  54. Mayowa, O.O.; Pour, S.H.; Shahid, S.; Mohsenipour, M.; Harun, S.B.; Heryansyah, A.; Ismail, T. Trends in Rainfall and Rainfall-Related Extremes in the East Coast of Peninsular Malaysia. J. Earth Syst. Sci. 2015, 124, 1609–1622. [Google Scholar] [CrossRef] [Green Version]
  55. Ojha, S.S.; Singh, V.; Roshni, T. Comparison of Meteorological Drought Using SPI and SPEI. Civ. Eng. J. 2021, 7, 2130–2149. [Google Scholar] [CrossRef]
Figure 1. Location of rainfall stations on a map of Sarawak.
Sustainability 15 00734 g001
Figure 2. Average precipitation during the different monsoon seasons (NE: northeast, INT: inter-monsoon, SW: southwest) for 33 meteorological stations in the study area based on the southern, central, northern, and whole regions of Sarawak.
Sustainability 15 00734 g002
Figure 3. The values of the SPI and SPEI for the southern region on different timescales (a) 3-month, (b) 6-month, (c) 9-month, (d) 12-month.
Sustainability 15 00734 g003
Figure 4. The values of the SPI and SPEI for the central region on different timescales (a) 3-month, (b) 6-month, (c) 9-month, (d) 12-month.
Sustainability 15 00734 g004
Figure 5. The values of the SPI and SPEI for the northern region on different timescales (a) 3-month, (b) 6-month, (c) 9-month, (d) 12-month.
Sustainability 15 00734 g005
Figure 6. The values of the SPI and SPEI for the whole region on different timescales (a) 3-month, (b) 6-month, (c) 9-month, (d) 12-month.
Sustainability 15 00734 g006
Figure 7. The months of drought in Sarawak (1980–2020) on different timescales of the SPI and SPEI.
Sustainability 15 00734 g007
Figure 8. Pearson’s correlation between the SPI and SPEI.
Sustainability 15 00734 g008
Figure 9. Sen’s slope estimation values for the southern, central, northern, and whole Sarawak regions.
Sustainability 15 00734 g009
Table 1. SPI/SPEI values with descriptions.
Moisture CategoriesSPI or SPEI
Extremely wet≥2.0
Severe wet1.5 to 1.99
Moderately wet1.0 to 1.49
Normal−0.99 to 0.99
Moderately drought−1.00 to −1.49
Severe drought−1.50 to −1.99
Extremely drought≤−2.00
Table 2. List of weather stations in different regions.
Station IDStation NameRegionLatitudeLongitude
1897016SematanSouthern1°48′36.5″ N109°46′19.7″ E
1401005BauSouthern1°25′5.60″ N110°08′58.4″ E
1503012Kampung NelayanSouthern1°32′36.4″ N110°23′27.40″ E
1102002Aman 5 BridgeSouthern1°10′56.900″ N110°15′22.200″ E
1503014PadunganSouthern1°33′18.1″ N110°21′57.00″ E
1105027SerianSouthern1°09′37.2″ N110°33′58.6″ E
1611001JPS BeladinSouthern1°38′17.90″ N111°11′57.00″ E
1214001Sri AmanSouthern1°14′33.2″ N111°27′25.03″ E
1415001Nanga LubauSouthern1°29′46.3″ N111°35′14.80″ E
2115008Sarikei DIDCentral2°07′36″ N111°31′43″ E
2818002Dalat Sago PlantationCentral2°50′15.55″ N111°49′54.982″ E
2219001Sibu New AirportCentral2°15′32.1″ N111°58′54.2″ E
2021036Kanowit Water WorksCentral2°5′59.10″ N112°9′5.806″ E
2523001Selangau BCentral2°31′24.5″ N112°19′14.4″ E
1624001Rumah AndauCentral1°40′57.1″ N112°25′7.4″ E
1628001Upper Sungai AyatCentral1°36′38.4″ N112°48′50.5″ E
2727001Ulu Sungai MuangCentral2°46′25.7″ N112°42′12.2″ E
3132001SebauhCentral3°06′44.47″ N113°15′53.23″ E
2134001Nanga TiauCentral2°6′56.7″ N113°26′36.8″ E
1737001Nanga MerurungCentral1°42′57.20″ N113°44′37.50″ E
2141048Long JaweCentral2°7′0.5″ N114°11′13.7″ E
2843001Long JekNorthern2°48′33.1″ N114°18′56.3″ E
3342032Long SubingNorthern3°19′38.3″ N114°16′22.2″ E
3737045Sungai LebaiNorthern3°43′56.4″ N113°47′6.9″ E
4038006BekenuNorthern4°03′24.20″ N113°50′30.00″ E
4440002Permai JayaNorthern4°27′11.2″ N114°01′46.4″ E
4043059BenawaNorthern4°01′13.70″ N114°20′46.60″ E
3950020Long SeridanNorthern3°58′38.4″ N115°3′55.7″ E
4650023PandaruanNorthern4°41′17.5″ N115°1′7.5″ E
4752022TrusanNorthern4°47′6.6″ N115°16′19.1″ E
4954001Kuala LawasNorthern4°57′22.20″ N115°25′40.10″ E
4354001Long MerarapNorthern4°21′36.5″ N115°27′32.2″ E
3754007BarioNorthern3°44′12.90″ N115°28′32.10″ E
Table 3. Trend analysis results.
Total Monthly Rainfall
Station IDStation NameRegionKendall’s TauSp-Value (Two-Tailed)Sen’s Slope (mm/year)
1897016SeamanSouthern0.229−1830.041−9.927
1401005BauSouthern0.131120.2127.258
1503012Kampung NelayanSouthern0.195−1600.074−9.779
1102002Aman 5 BridgeSouthern0.112−920.307−5.881
1503014PadunganSouthern0.228−1870.037−11.761
1105027PadunganSouthern0.2281870.03711.761
1611001JPS BeladinSouthern0.259−2120.018−16.286
1214001Sri AmanSouthern0.311−2550.004−19.073
1415001Nanga LubauSouthern0.3511180.00121.375
2115008Sarikei DIDCentral0.2462020.02414.768
2818002Dalat Sago PlantationCentral0.427−3500−28.37
2219001Sibu New AirportCentral0.272−2230.013−18.677
2021036Kanowit Water WorksCentral0.2712220.01318.153
2523001Selangau BCentral0.349−2680.001−23.136
1624001Rumah AndauCentral0.407−3340−32.14
1628001Upper Sungai AyatCentral0.432−2540−35.821
2727001Ulu Sungai MuangCentral0.354−2900.001−21.973
3132001SebauhCentral0.2562100.01917.768
2134001Nanga TiauCentral0.407334028.994
1737001Nanga MerurungCentral0.437358038.099
2141048Long JaweCentral0.354−2660.003−21.179
2843001Long JekNorthern0.1451190.1858.205
3342032Long SubingNorthern0.133−1090.225−7.703
3737045Sungai LebaiNorthern−0.015−120.902−0.887
4038006BekenuNorthern0.049−400.661−3.165
4440002Permai JayaNorthern0.027220.8412.148
4043059BenawaNorthern0.195−1600.074−12
3950020Long SeridanNorthern0.181−1480.099−10.397
4650023PandaruanNorthern0.243−1990.026−17.53
4752022TrusanNorthern0.282−2310.01−22.412
4954001Kuala LawasNorthern0.254−2080.02−19.807
4354001Long MerarapNorthern0.251−2060.021−20.424
3754007BarioNorthern0.1711400.11811.865
Disclaimer/Publisher’s Note: The statements, opinions and data contained in all publications are solely those of the individual author(s) and contributor(s) and not of MDPI and/or the editor(s). MDPI and/or the editor(s) disclaim responsibility for any injury to people or property resulting from any ideas, methods, instructions or products referred to in the content.

