Article

Shuttle-Based Storage and Retrieval Systems Designs from Multi-Objective Perspectives: Total Investment Cost, Throughput Rate and Sustainability

1
Cranfield School of Management, Cranfield University, Bedford MK43 0AL, UK
2
Department of Industrial Engineering, Yasar University, Bornova, Izmir 35100, Turkey
3
Yapi Kredi Bank, Izmir 35100, Turkey
*
Author to whom correspondence should be addressed.
Sustainability 2023, 15(1), 762; https://doi.org/10.3390/su15010762
Submission received: 2 November 2022 / Revised: 26 December 2022 / Accepted: 27 December 2022 / Published: 31 December 2022
(This article belongs to the Special Issue The Future of Industry Seen from the Perspective of Sustainability)

Abstract

:
This paper studies performance comparison of two shuttle-based storage and retrieval system (SBS/RS) configurations developed on flexible or non-flexible travel policies of shuttles in the system. In the non-flexible SBS/RS, a shuttle is dedicated to a tier so that it cannot travel out of its dedicated aisle and tier. A lifting mechanism is installed in each aisle to provide vertical travel for loads. In flexible SBS/RS, shuttles can travel between tiers by a separate lifting mechanism installed on the other edge point of each aisle. The advantage of that flexible design is that there might be decreased number of shuttles settling in the system compared to the non-flexible design. We simulate the two system configurations and conduct an experimental design for the comparison purpose. Based on the three-performance metrics: total investment cost, throughput rate and energy consumption per transaction, the results show that mainly the flexible system provides better results which might be considered as future system investment for SBS/RS.

1. Introduction

Within the globalized world, technological and financial advancements have led to extraordinary improvements in marketing and inventory management. With the increased use of the internet and smartphones, e-commerce practices have increased significantly leading to changed customer order expectations. For instance, recent customers ask for more product variety options with shorter delivery times [1]. Thus, retailers may want to seek ways to meet those expectations with a higher process rate and reduced cost operations. Utilization of automation technologies may provide a significant advantage in meeting those targets. Recently, industries have been investing in automation technologies heavily, for instance, in which Figure 1 shows one of the recent statistics from the automation market estimating a continuous growth in the future. The biggest issue in adopting automation technologies is their high initial investment costs. Hence, a system design analysis developed on cost benefit trade-offs might help to facilitate such investment decisions, where in this paper, we focus on such a research study. In particular, we study two SBS/RS designs by evaluating their performances from their initial investment cost, transaction process rate and energy consumption. Here, by considering transaction process rate as an objective function, we aim to explore increased process rate design which would also help to decrease transaction delivery times in the systems. By considering energy consumption per transaction as another objective function, we aim to seek designs providing decreased energy consumption per transaction in the system, which would also contribute to both sustainability concerns and decreased operational costs.
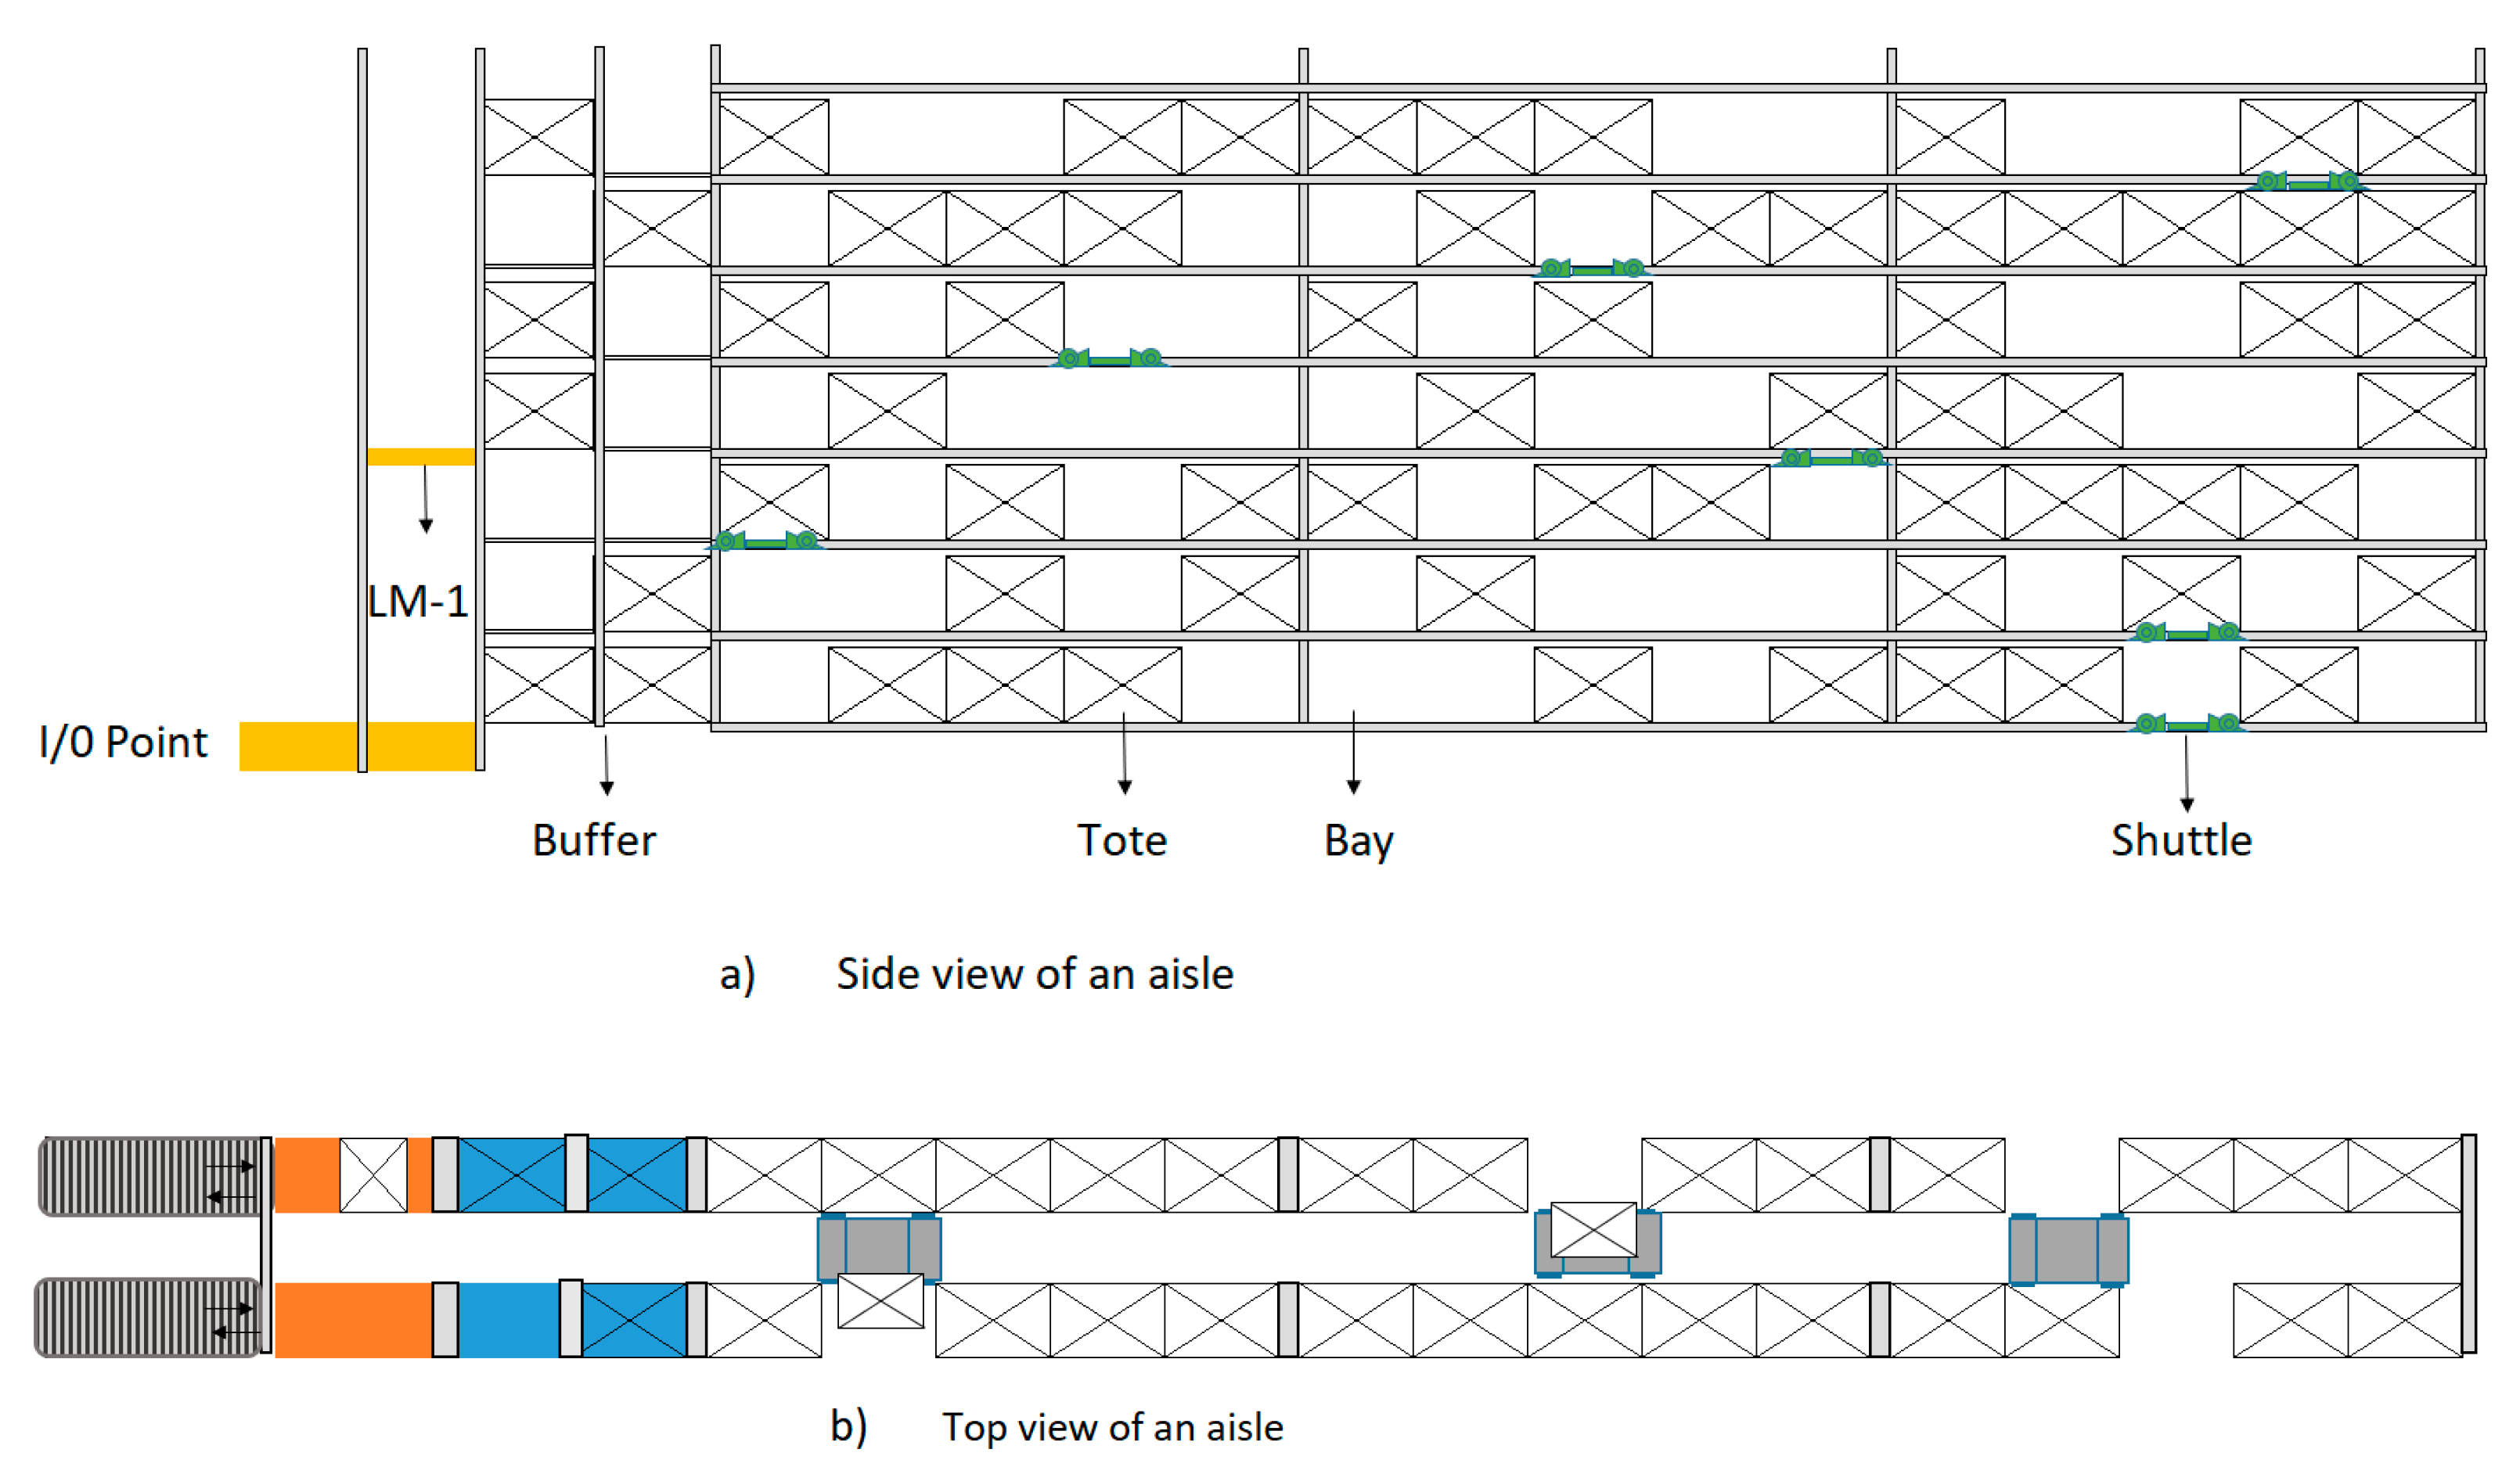
SBS/RS is an automated storage and retrieval system, extensively utilized for storage of mini-load in e-commerce warehouses, one of which is recent micro-fulfillment centers [3]. SBS/RS is developed as a response to recent customer expectations towards fast, efficient hyper local fulfillment. It delivers high throughput and storage capacity for storing small loads fast and efficiently [4,5]. The high transaction capacity of SBS/RS comes from warehouse design, where a shuttle mechanism is dedicated in each tier of an aisle within a high bay racking system. Having many shuttles in the warehouse helps the system achieve a high throughput capacity. However, the handicap of that system design is that the average utilization of shuttles is typically very low compared to the lifting mechanisms in the system. Lifts are usually bottleneck in SBS/RS due to the dedicated shuttles in each tier. Such SBS/RS design is also referred to as tier captive SBS/RS (TC-SBS/RS) in the literature [6,7,8,9,10]. We refer to tier captive SBS/RS as non-flexible SBS/RS, in this paper. Figure 2 shows the side and top view of a non-flexible SBS/RS. According to that, dedicated shuttles in tiers retrieve and store the loads within the tiers. There is a lifting mechanism (i.e., LM-1 in Figure 2) installed in each aisle carrying totes between tiers. In TC-SBS/RS design, the shuttles are not capable of changing their tiers and aisles. LM-1 carries the loads between input/output (I/O) point and the target tier. Because of the excess number of shuttles in the system, the initial investment cost of those designs would likely be higher than one, with reduced number of shuttles, where shuttles can travel flexibly between tiers within an aisle [11,12,13,14,15]. This flexible SBS/RS’ operating, and design principles are explained in the following paragraphs.
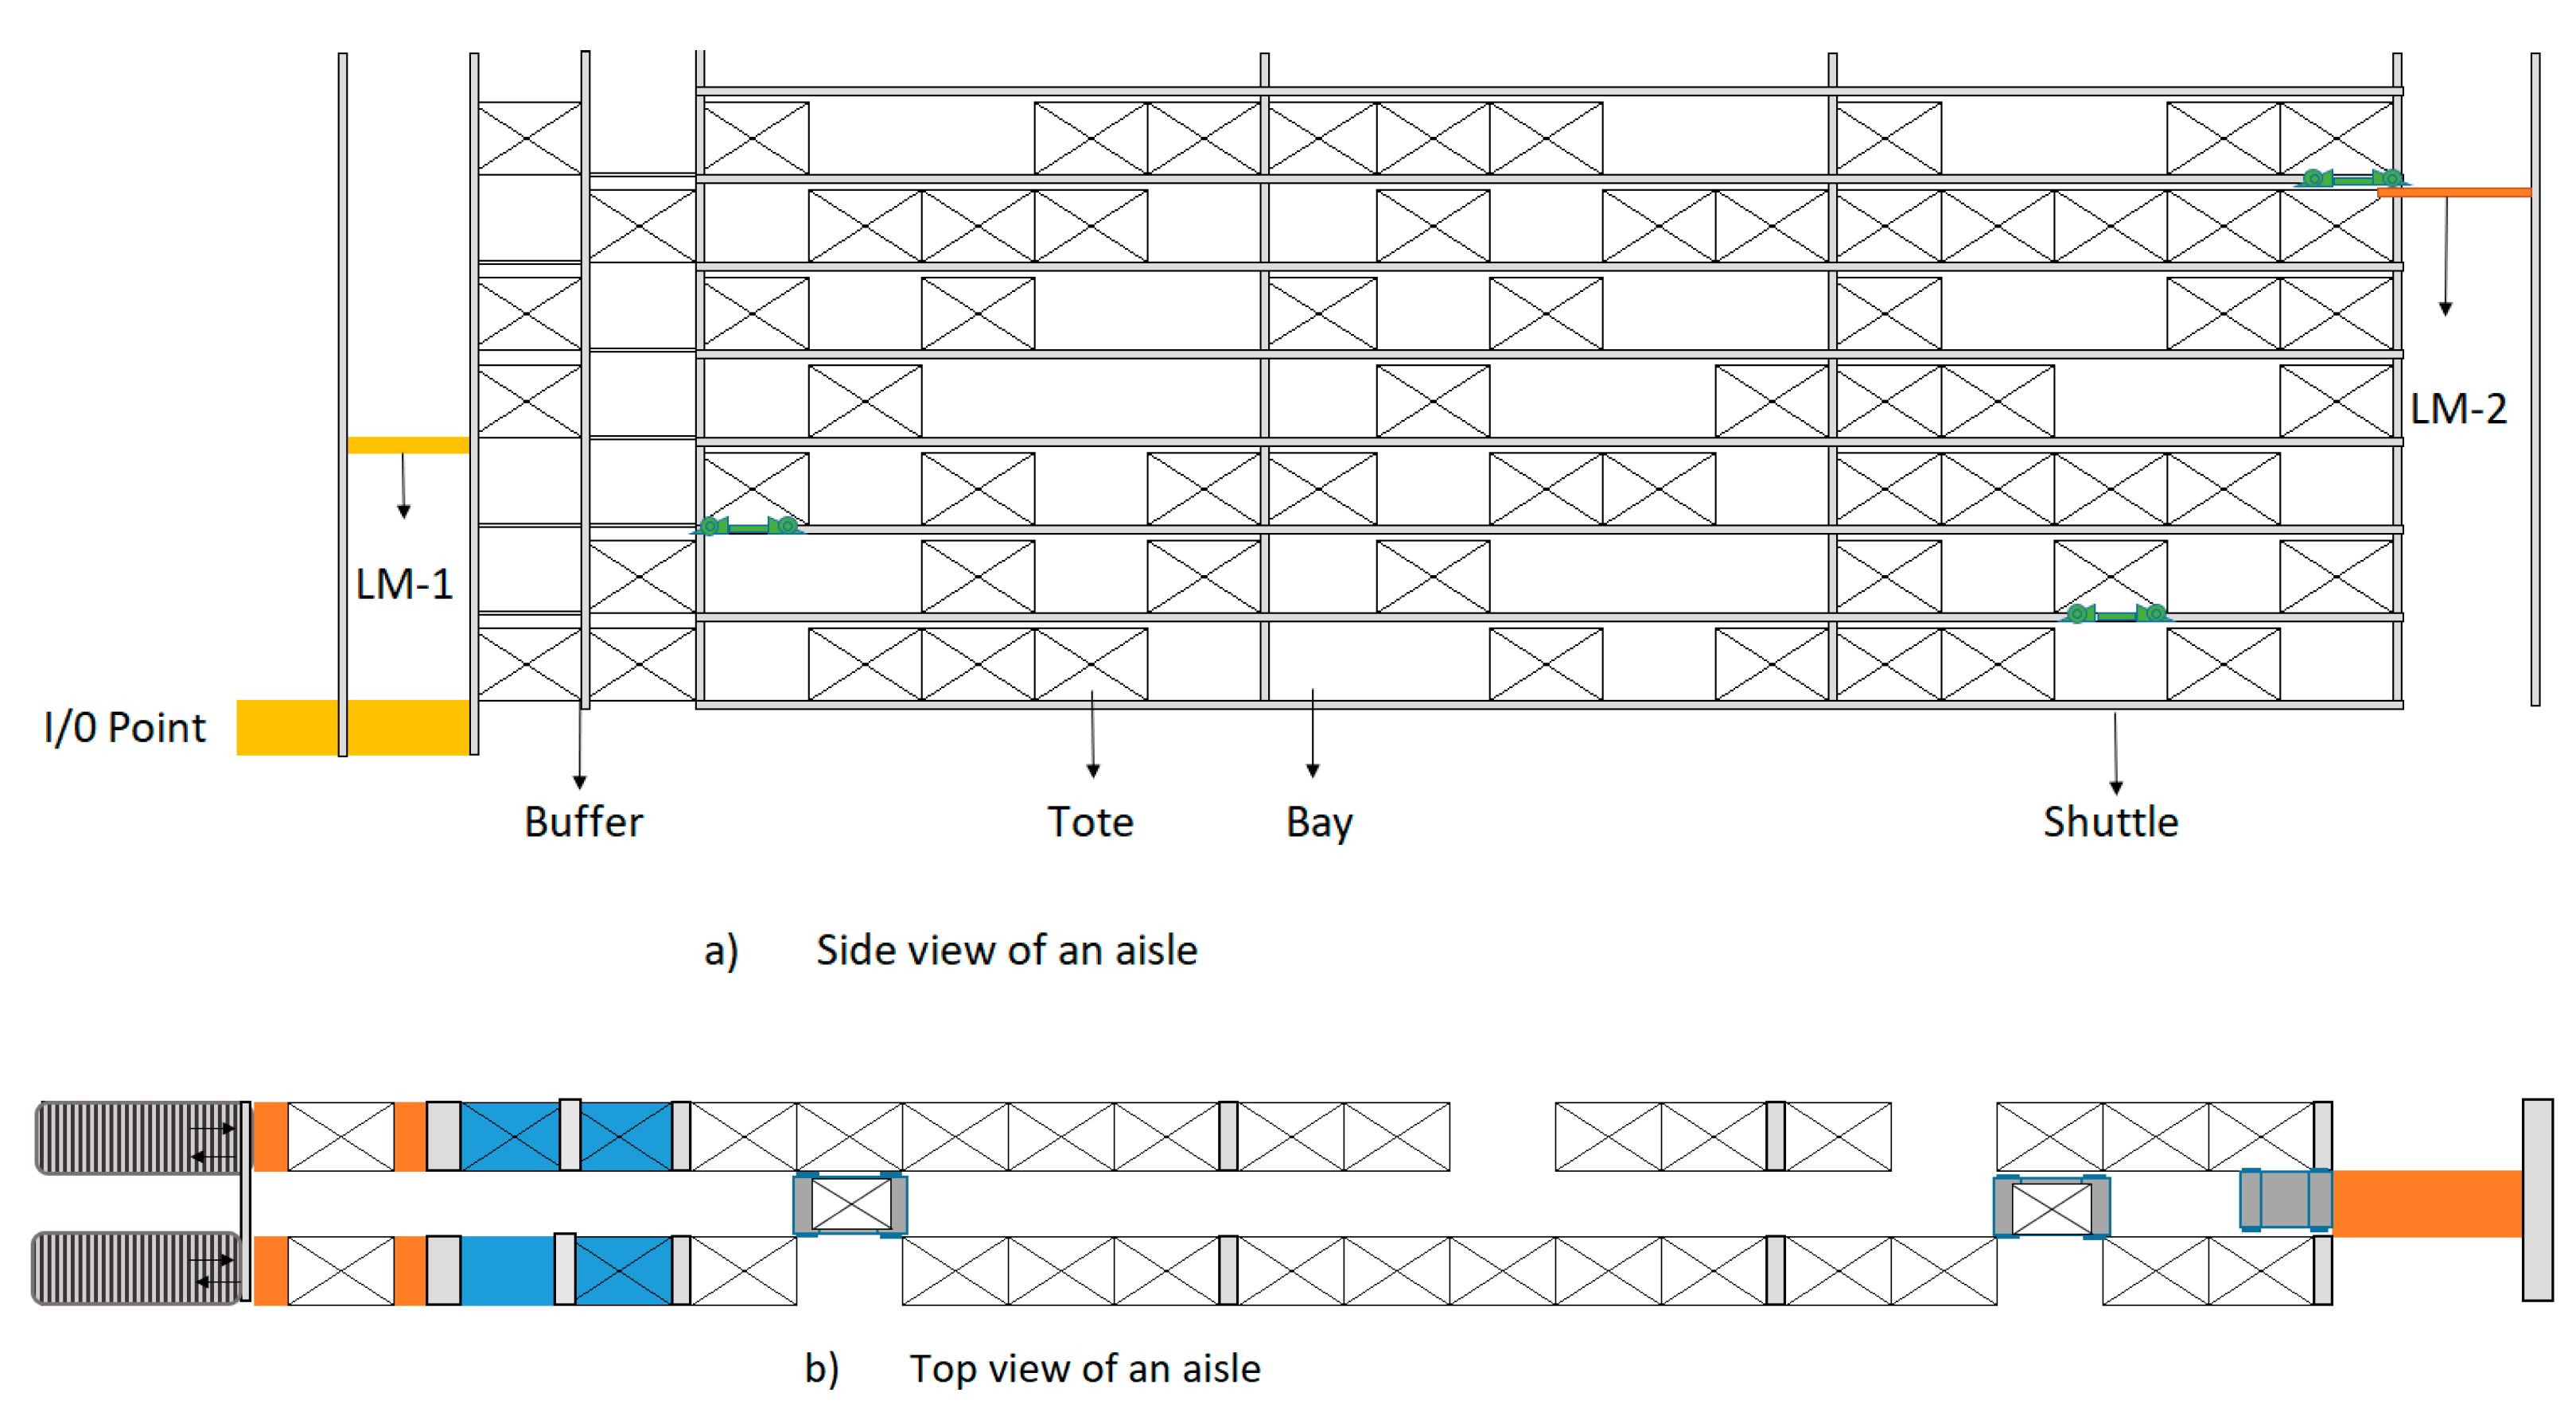
In this paper, to facilitate the investment decisions of retailer companies in automation technologies, specifically for SBS/RS, we study trade-offs between investment cost, throughput rate and energy consumption per transaction in two SBS/RS designs, non-flexible SBS/RS and flexible SBS/RS. Figure 3 shows the side and the top view of the studied flexible SBS/RS design. In that design, shuttles are allowed to travel between tiers by using a lifting mechanism (i.e., LM-2) which is installed at other end side of each aisle. Namely, LM-2 is dedicated to carry shuttles between tiers within its aisle. In that flexible design, the number of shuttles in an aisle may be reduced compared to a non-flexible design. Thus, the system can be operated at a lower investment cost by using fewer shuttles. In addition, by exploring alternative warehouse designs achieving higher process rates would improve the performance of this system more.
The main motivation for the study is to address the growing importance of automated storage and retrieval systems and provide more cost-efficient warehouse design in terms of initial investment cost, energy consumption per transaction, and processing rate per hour. With this study, our main aim is to explore a warehouse design with a less investment cost and more balanced shuttle and lift mechanisms for their average utilization values. We explore the design study under multi-objective perspectives: investment cost, throughput rate and energy consumption per transaction. The remainder of the paper is organized as follows: Section 2 includes a comprehensive assessment of the literature as well as a synopsis of our research. Section 3 presents the simulation model of the systems along with the system assumptions. The results are discussed and summarized in Section 4. An implication section providing recommendations from findings is provided in Section 5. Last, we provide a conclusion part summarizing the work and findings.

2. Literature Review

Most of the research in the literature focuses on non-flexible SBS/RS. There are few numbers of works studying flexible SBS/RS within the literature. We summarize all the related ones, in this section.

2.1. Non-Flexible SBS/RS Works

The first study on non-flexible SBS/RS has been done by [5] which focuses on the scheduling of lifts in the warehouse. They present a heuristic approach and introduce two functions for requesting requests in order.
Marchet et al. [6] design an analytical model for non-flexible SBS/RS design to estimate its performance under different warehouse designs. They develop open queuing network (OQN) models for that purpose.
Tappia et al. [8] model non-flexible SBS/RS by queueing network models to predict the performance of both single-tier and multi-tier system designs. While each tier is modelled as a multi-class semi-open queuing network, the vertical transfer is modelled as an open queueing network.
Wang et al. [9] study task scheduling for non-flexible SBS/RS. The two-step open queueing network is developed to solve resource waiting times. An ant colony technique is used to analyze the outcome of a position distribution optimization model.
Ekren [10] presents a simulation-based method for the key performance outputs from various SBS/RS designs.
Then, Marchet et al. [16] design a non-flexible SBS/RS model to observe how a change in the number of corridors affects the outcome.
Ekren et al. [17] present a method for estimating key performance indicators for various SBS/RS architectures. Any system with a linear, discrete travel pattern and equal distance stop locations can benefit from the proposed methodology. The performance of SBS/RS systems may be quickly assessed by altering the input design parameters of SBS/RS systems using the suggested tool.
Ha and Chae [18] study free balancing impact in non-flexible SBS/RS by comparing basic system control. According to the results of their simulation study, using free balancing reduces the burden on elevators in non-flexible SBS, increasing system performance and allowing for more productive system operation. Later, Ha and Chae [19] present a decision model for non-flexible SBS/RS to determine the best number of shuttles. They show that the proposed model can find the necessary number of shuttles at the desired throughput rate.
Additionally, research in Burkina Faso (West Africa) found that good sustainability management enhances the standing and visibility of foreign development initiatives, raises stakeholder satisfaction, and lessens unfavorable social and environmental effects [20].
Based on a statistical experimental design, Ekren [21] analyzes non-flexible SBS/RS to identify design elements that affect the performance of that system. It is observed that increasing the number of aisles has a substantial impact on system performance. For the design of a non-flexible SBS/RS, Ekren [22] presents a multi-objective optimization method. Simultaneous reduction of average cycle time and energy usage per transaction is regarded as multi-objectives in the study. Later, Ekren and Akpunar [23] provide a queuing network-based tool for predicting many performance indicators (e.g., mean cycle time and mean energy consumption per transaction) from a pre-defined SBS/RS design by using a queueing network.

2.2. Flexible SBS/RS Works

The most related paper is presented by Küçükyaşar et al. [11], where they compare performance of non-flexible SBS/RS and flexible SBS/RS based on their hourly throughput rate, initial investment cost and the other key performance metrics. They observe that flexible SBS/RS designs can achieve a higher throughput rate with lower initial investment costs than non-flexible SBS/RS designs. The main difference between this current paper with that one is that, while Küçükyaşar et al. [11] study single speed profile for shuttles and lifts we also include different velocity profiles along with the different warehouse racking designs.
In contrast to deadlock and collision-focused works, Lerher [24] and Turhanler et al. [25] focus on flexible SBS-RS from shuttle’s flexible travel between aisles. The study provides deadlock collision and prevention rules.
Ekren and Arslan [26] apply a machine learning algorithm for the scheduling of tasks in flexible SBS/RS. They treat the shuttles and lifts as agents in the system that can make dynamic decisions in selecting transactions from their queues. Later, Arslan and Ekren [14] apply Deep-Q learning in flexible SBS/RS.
In this paper, we study system performance comparison of nonflexible and flexible SBS/RS designs from multi objective perspectives: initial investment cost, energy consumption per transaction and throughput rate in unit time. We apply a simulation-based experimental work for comparison purposes.

3. System Description and Simulation Model Assumptions

We detail the flexible SBS/RS design in this section. In this system, unlike the others, shuttles can travel between tiers with the help of LM-2. There are two-sided storage racks in each aisle, where loads can be stored either on the left or right side of an aisle. There are two transaction types: storage and retrieval.
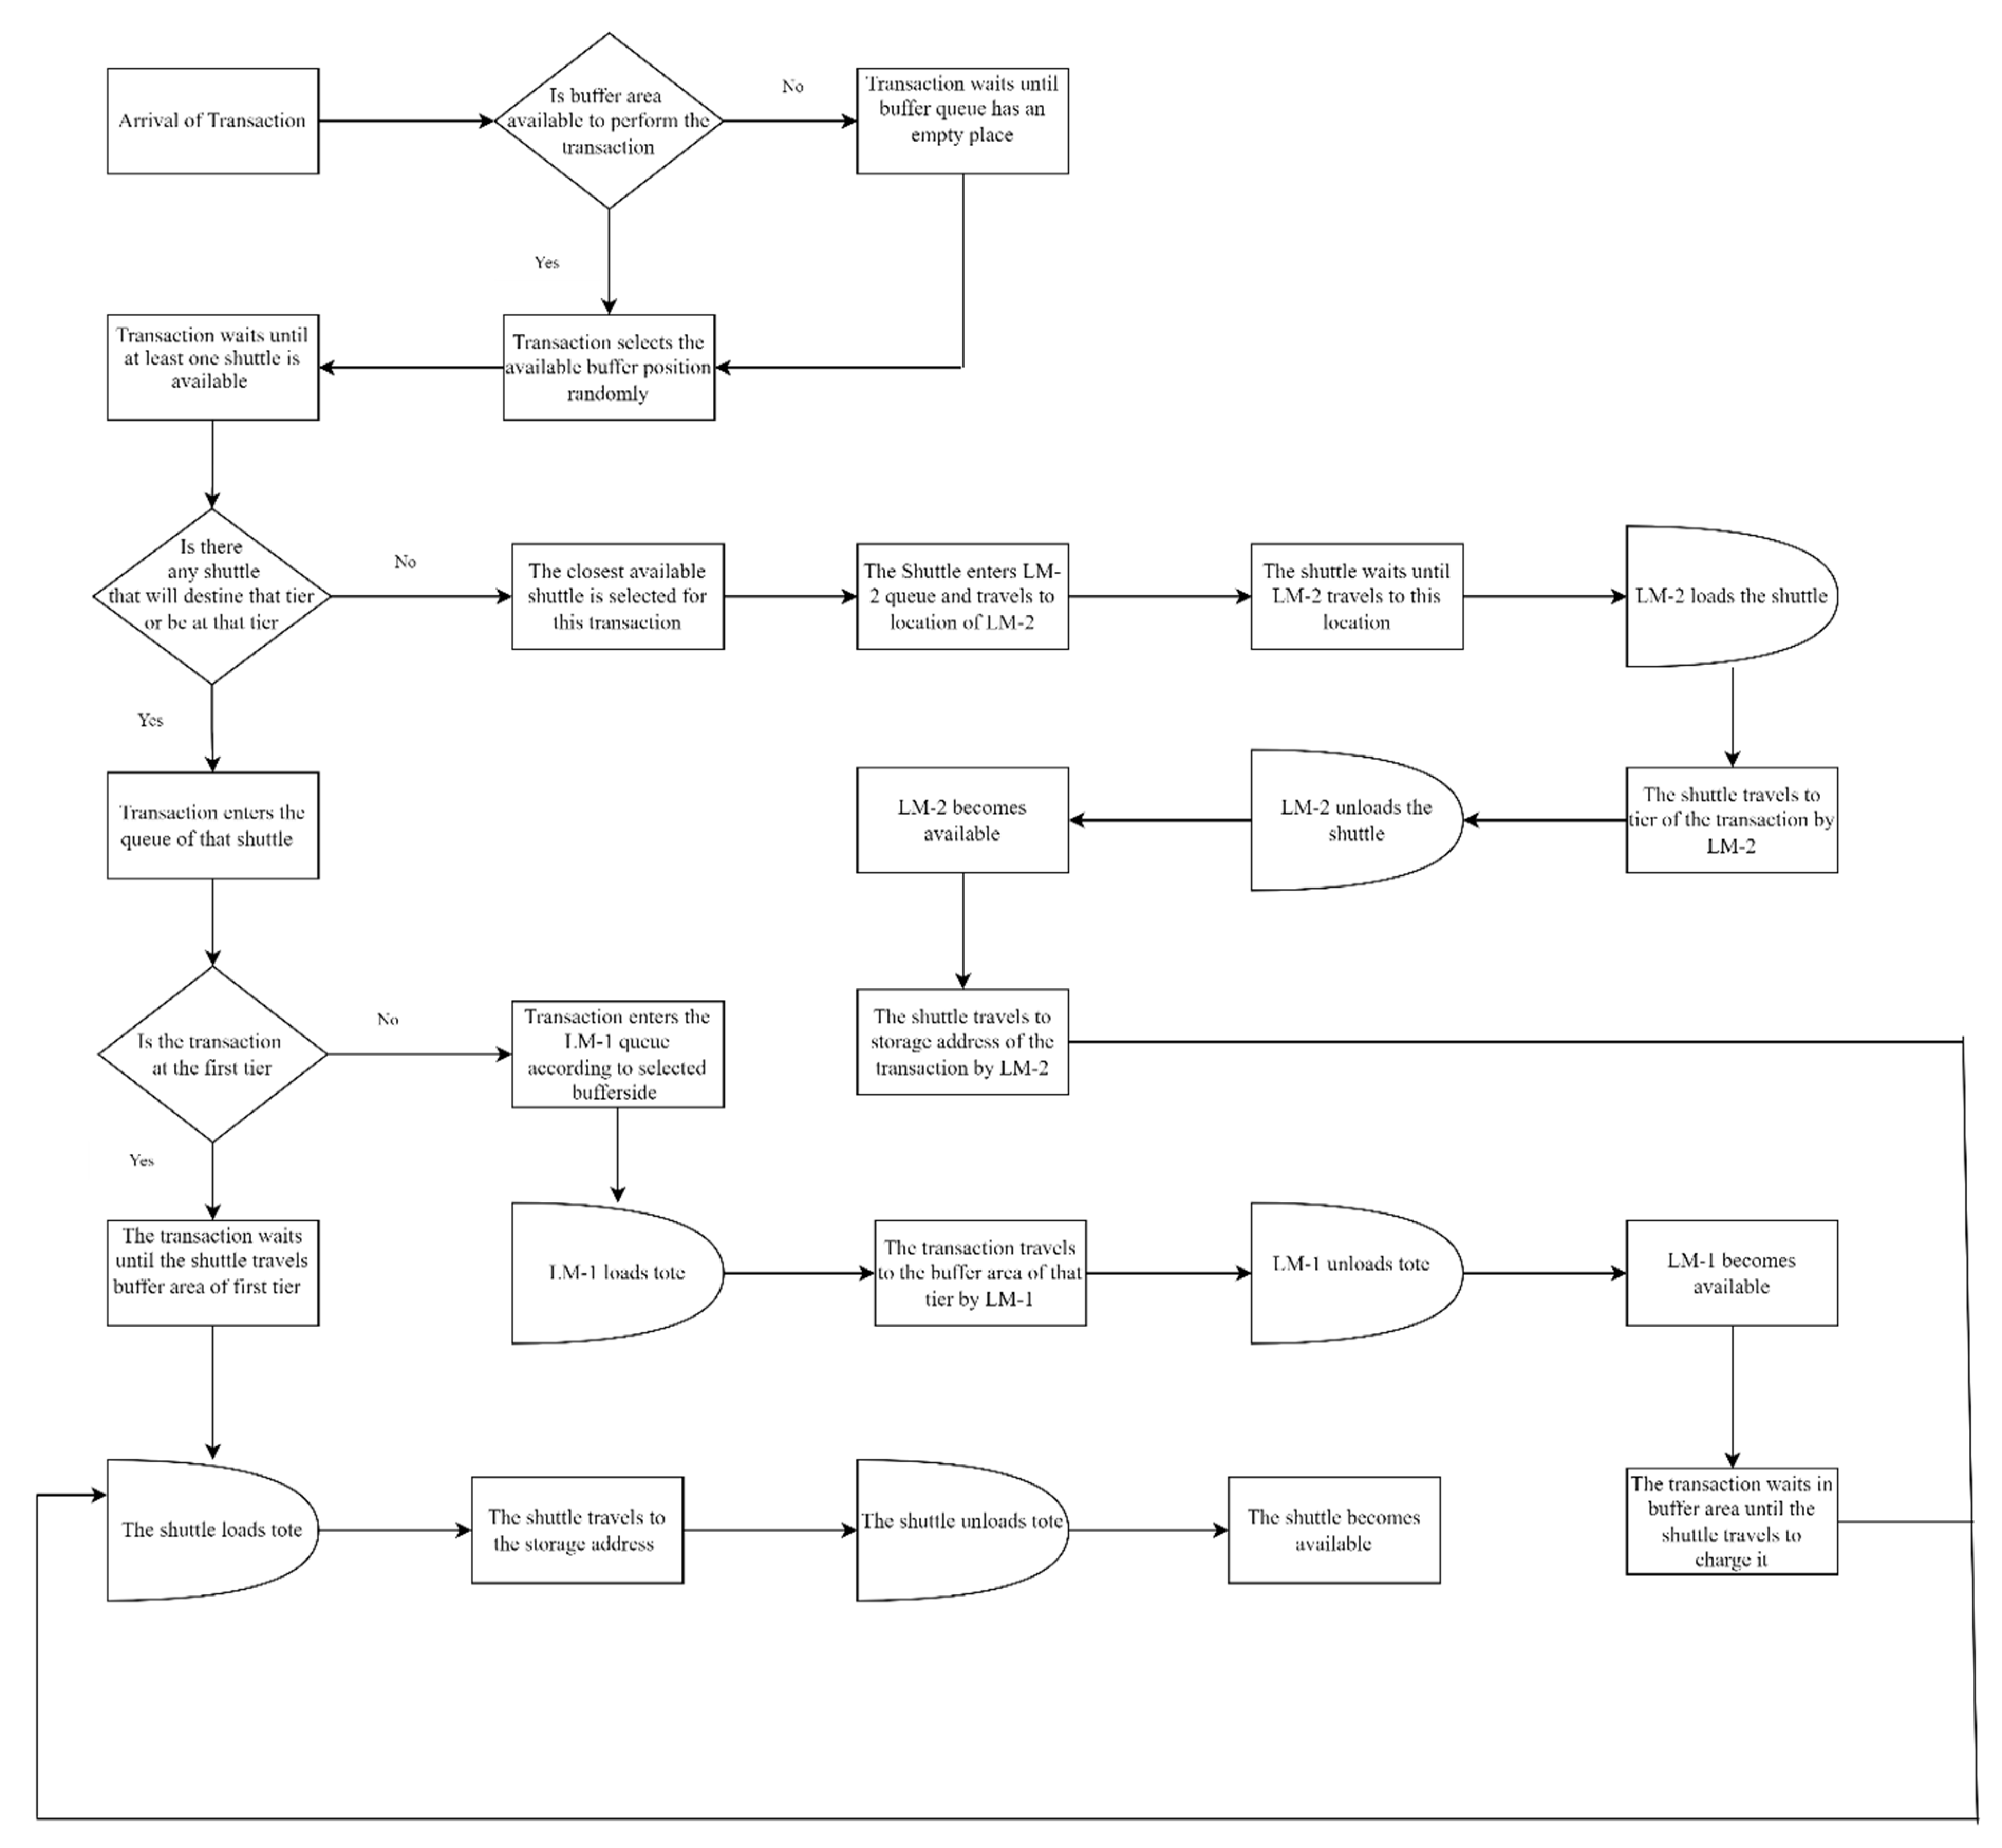
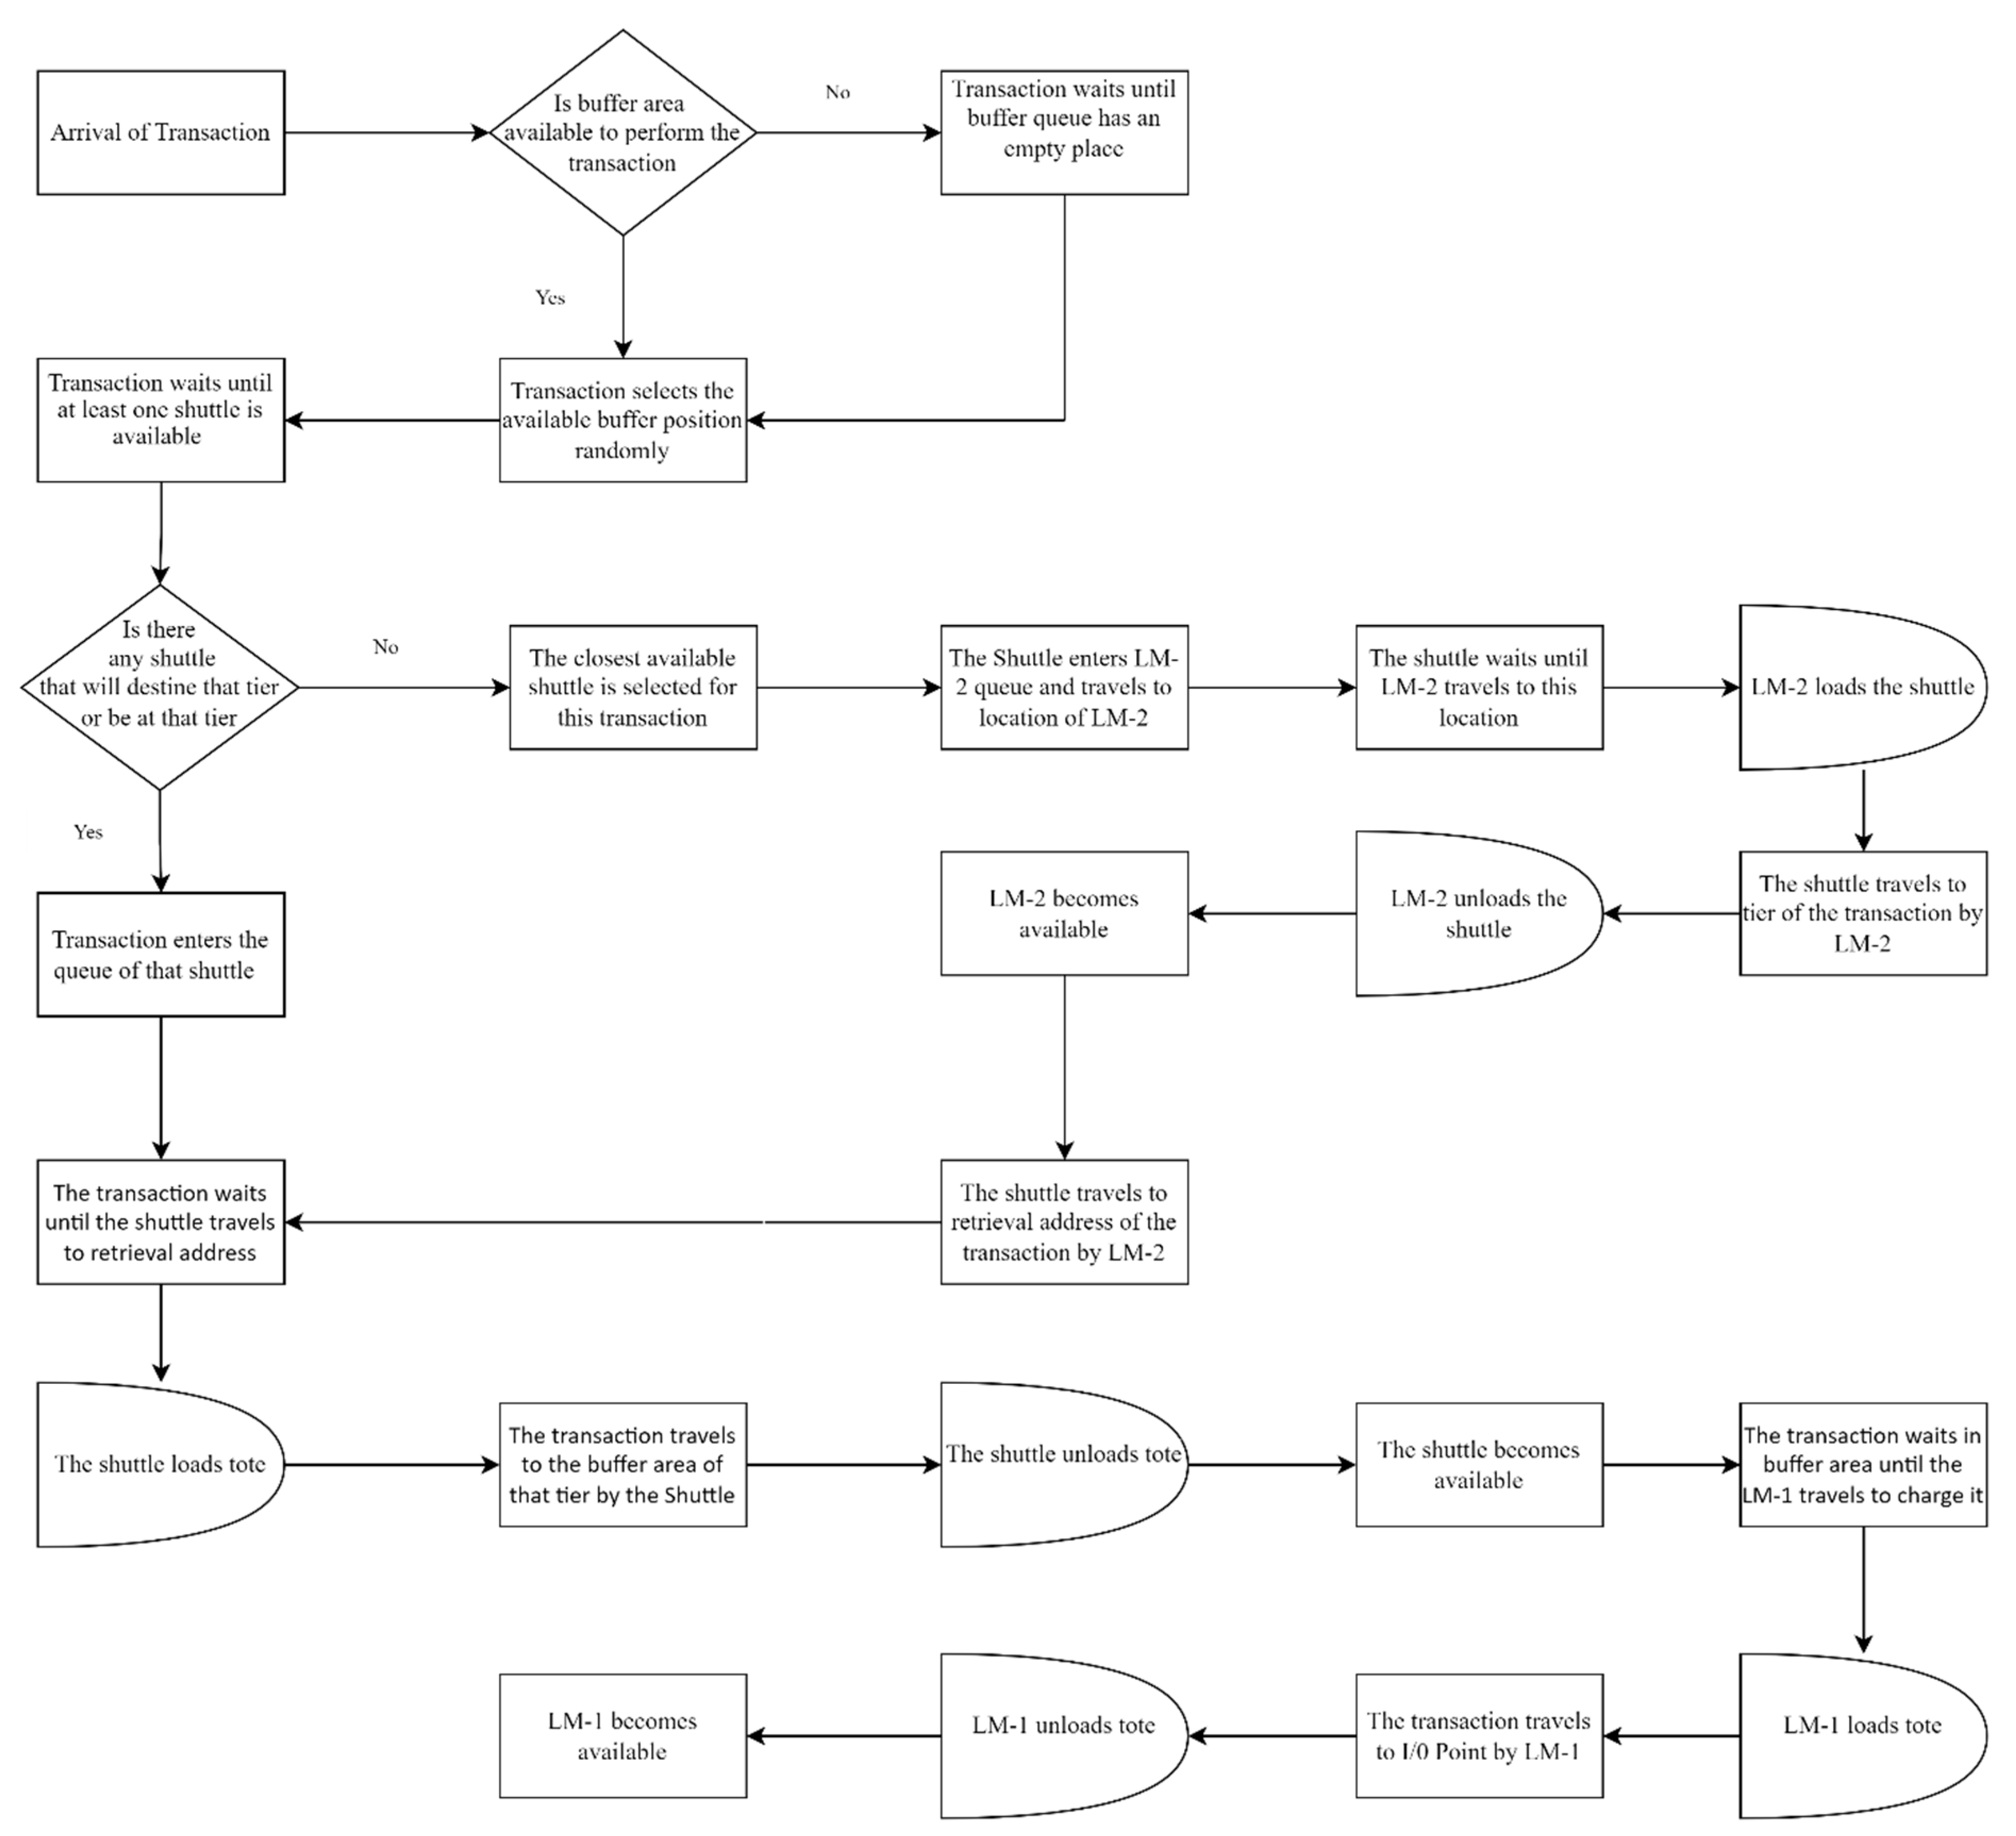
Figure 4 and Figure 5 show the simulation flow charts of the storage and retrieval processes, respectively. Storage process starts with an available bay selection. Later, the storage transaction waits until at least one buffer space becomes available at the regarding tier. The selection rule of a shuttle is the closest shuttle to the transaction address. Meanwhile, the load to be stored enters the queue of LM-1. After lift picks up the load from the I/O point, it travels to the tier address where the load will be stored. Later, LM-1 drops off the load at the buffer area. If a shuttle requires to change its tier, then it requests LM-2. Then, the shuttle travels to the buffer area in that tier to pick up the load, and both travel to the storage bay address. In the retrieval process, while the shuttle selection and the arrival of the shuttle to that tier are the same as the storage process, the entrance of the load to the LM-1 row is when the load is taken from the storage location and arrives at the buffer area. When the load is dropped off at the buffer area, it enters the LM-1 queue. Later, LM-1 carries the load at the I/O point.
The simulation assumptions are summarized below:
  • The queues of LM-1 and LM-2 follow the first-in-first-out (FIFO) scheduling rule.
  • An available shuttle is selected according to the closest distance rule.
  • When transactions are performed on the first tier, the LM-1 is not utilized.
  • There are two main transaction types: storage and retrieval transactions.
  • We assume that the storage transactions begin at the I/O point and the retrieval transactions end at the I/O point.
  • In storage transactions, shuttles pick up the totes from the buffer locations, where LM-1 leaves them there.
  • In retrieval transactions, the shuttles drop off the loads at the buffer locations, and the LM-1 mechanisms picks up them from there.
  • In a single tier, only one shuttle is allowed to travel to prevent collisions.
  • As dwell point policy, shuttles and lifts wait at their last locations until they have new tasks.
  • The buffer areas have three tote capacities, and they are located on either side of each tier.
  • Storage and retrieval addresses of arriving requests are determined randomly.
  • The loading and unloading delays for loads to/from shuttles/lifts are assumed to be equal and 3 s.
  • The models account for acceleration and deceleration travel times of shuttles and lifts until they reach their maximum speeds. Transporter modules are used in simulation software to calculate trapezoidal velocity-time relationships.
  • In the simulation models, the bottleneck resource (e.g., shuttle or lift) is set to be utilized at around 97%.
  • According to Ekren [10,21], we consider the distance between two adjacent bays, the buffer area and the first bay as 0.5 m. Additionally, the distance between two tiers is 0.35 m.
  • The maximum velocity and acceleration/deceleration values of velocities of shuttles are 2 and 4 m/s. It is 2 m/s for lifts.
  • According to Ekren [10,21], we assume that the mass of a shuttle, lift and tote is 40 kg, 60 kg and 20 kg, respectively.
  • The warm-up period for the simulation models is assumed to be 15 days. It is determined by the eye-ball technique.
  • The replication length of simulation runs is 30 days.
  • The number of replications for each design is five.
  • There is no time-dependent deterioration in the operation of all machines.
  • No failure takes place in the warehouse for shuttles and lifts.

3.1. Simulation Model

All SBS/RS designs are simulated by the commercial software, ARENA 16.0. Animation is developed to verify and validate the simulation models. A snapshot from the animation is given in Figure 6. In that figure, there are 30 aisles, 15 tiers and 60 bays. The blue and red balls on the shuttles indicate the type of process, while the white line on the LM-2 indicates that the LM-2 is not idle.
In the simulation models, if there is no available shuttle, the transaction entity is hold by the “hold” module until at least one shuttle becomes idle. Each shuttle has its own separate queue. Transactions with the same tier address of a shuttle enter that shuttle’s queue immediately. Hence, when a shuttle becomes idle, it tends to select a transaction from its own queue. If there is a busy shuttle that is to arrive at the tier address of a transaction request, that transaction enters that shuttle’s queue anyway although it is not available for that transaction. Here, the aim is not to schedule two shuttles at the same tier. If there is not any shuttle currently running at or heading to that transaction’s tier, then that transaction enters the closest shuttle’s queue. After the selection of a shuttle, the entity is duplicated, and one enters the LM-1 queue the other enters the LM-2 queue to consider a parallel travel process. Shuttles, LM-1 and LM-2 have their own queues and these queues are processed based on FIFO rule.

3.2. Design Scenarios

To compare the performance of the flexible and non-flexible SBS/RSs, we conduct four different warehouse designs in the experimental study, shown in Table 1. According to that, we change the number of tiers, aisles and shuttles in the system. Besides, we also consider two warehouse capacity scenarios in terms of the number of bays in the storage racks: 45,000 and 90,000.
We set the number of tiers to 15 and 25, and the number of aisles to 30 and 50. Therefore, the number of bays (B) in an aisle is based on the warehouse capacities. We consider two different velocities which are 2 and 4 m/s. While for the flexible SBS/RS there are two different numbers of shuttles, 3 and 6, in the non-flexible system design there are as many shuttles as tiers. Depending on the capacity of each warehouse, the results are commented on separately. Remember that the arrival rates are varied so that the average utilization of the bottleneck server is around 97%.

3.3. Performance Metrics

From the results, we observe three important performance metrics: total investment cost (TC), hourly throughput rate (λ) and energy consumption per transaction (ET). Here, ET values are computed by Ekren [21,22]. Utilizations of shuttle, LM-1 and LM-2 have been shown by Us, L1u, L2u, respectively. The throughput rates are already shown by λ. The costs of a shuttle, lift, bay and footprint area are important parameters while calculating the initial investment costs. Table 2 shows the cost calculation parameters [16]. To calculate the footprint area, first, we calculate the length of the warehouse (Lw) and then the width of the warehouse (Ww). (1), (2) and (3) show the calculations of Lw, Ww and S, respectively. Total cost calculation is shown by (4) for both systems. Here, note that the number of shuttles in non-flexible SBS/RS configuration is equal to the number of tiers.
Lw = d × (B/2) + lb + lc + l1 + l2
Ww = (2 · wr + wa) · A
S = Lw · Ww
TC = (C1 · ns + C2 + C3) · A + (C4 · T · B · A) + (S · C5)

4. Simulation Results and Discussion

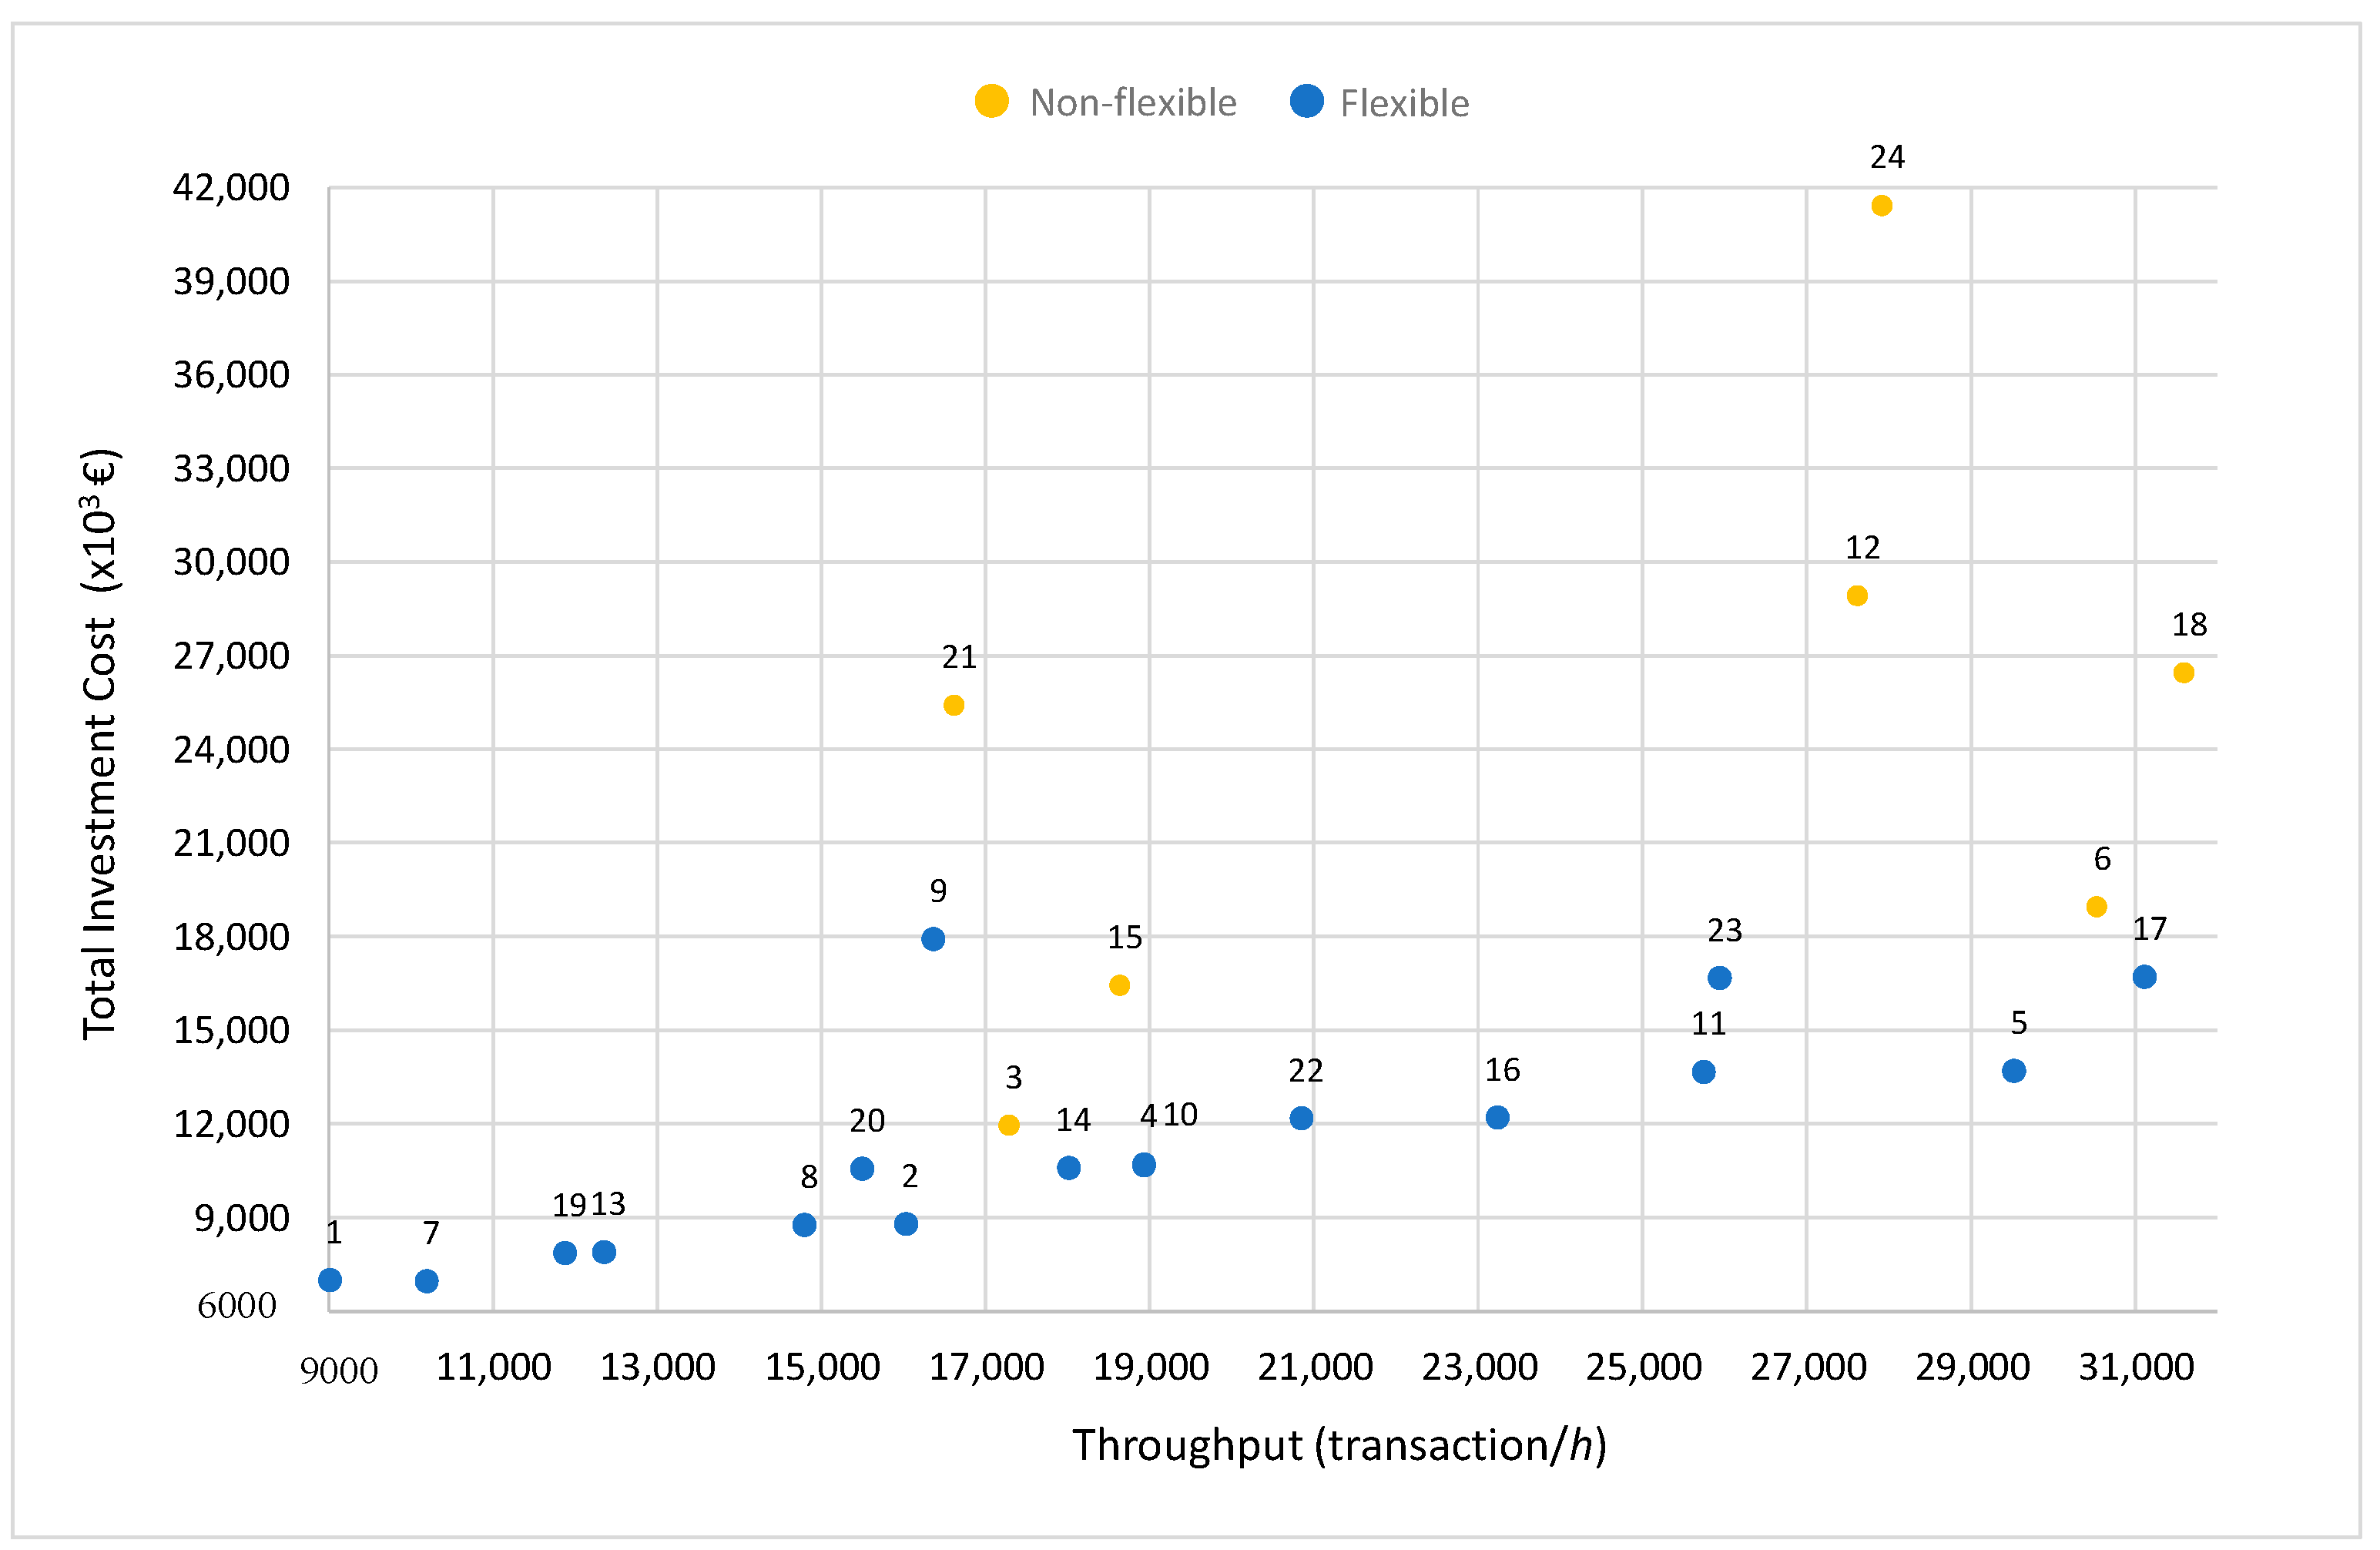
The simulation models are run based on the Table 1 scenarios. Note that the results are provided by multiple replications’ confidence intervals at 95% level. Figure 7 and Figure 8 show the throughput versus total investment cost for 45,000 and 90,000 capacities, respectively. In that figure, yellow-colored dots show the results for non-flexible SBS/RS designs and the blue ones show the results for flexible SBS/RS designs. The cost of non-flexible SBS/RS is generally more expensive than flexible ones. From a multi-objective perspective, we focus on the experiments presented at the lower right corners. Namely, from that graph, we know that an experiment with high throughput rate and less cost would be at the right low corner. By observing those graphs, we note that in the case where throughput rate is at its peak in non-flexible SBS/RS design, there is always a close throughput rate to that value with less investment cost in a flexible SBS/RS. From those graphs, it is observed that, the number of aisles is the most important parameter for throughput per hour performance metric. It also affects the investment cost significantly, this is probably because in non-flexible SBS/RS system, increasing the number of aisles would also increase the number of lifts in the system. We can achieve enormous benefits in terms of cost and transaction rate within flexible SBS/RS.
For example, in Table 3 and Table 4 the experiment with design number 24 which is the one with 25 tiers, 50 aisles, and shuttle speed of 4 results in 27,918 throughput rate per hour with a cost of EUR 41,419,000. The experiment with design number 5, which is the one with 15 tiers, 50 aisles, and shuttle speed 2, produces 29,524 throughput rate per hour with a cost of EUR 13,701,000. Compared to experiment 24, experiment 5 results in a 66% cost reduction and a 10% increase in throughput. Such comparisons can be done by using those tables to understand how those two systems perform in terms of those two-performance metrics. Another example is design number 17, which has a speed of 4 and a throughput rate of 31,112 per hour at a cost of EUR 16,701,000. In comparison with design number 24, design number 17 can increase throughput by approximately 20% while reducing costs by nearly 60%. Thus, we can comment that, designs 5 and 17 can be considered to be alternatives for design 24.
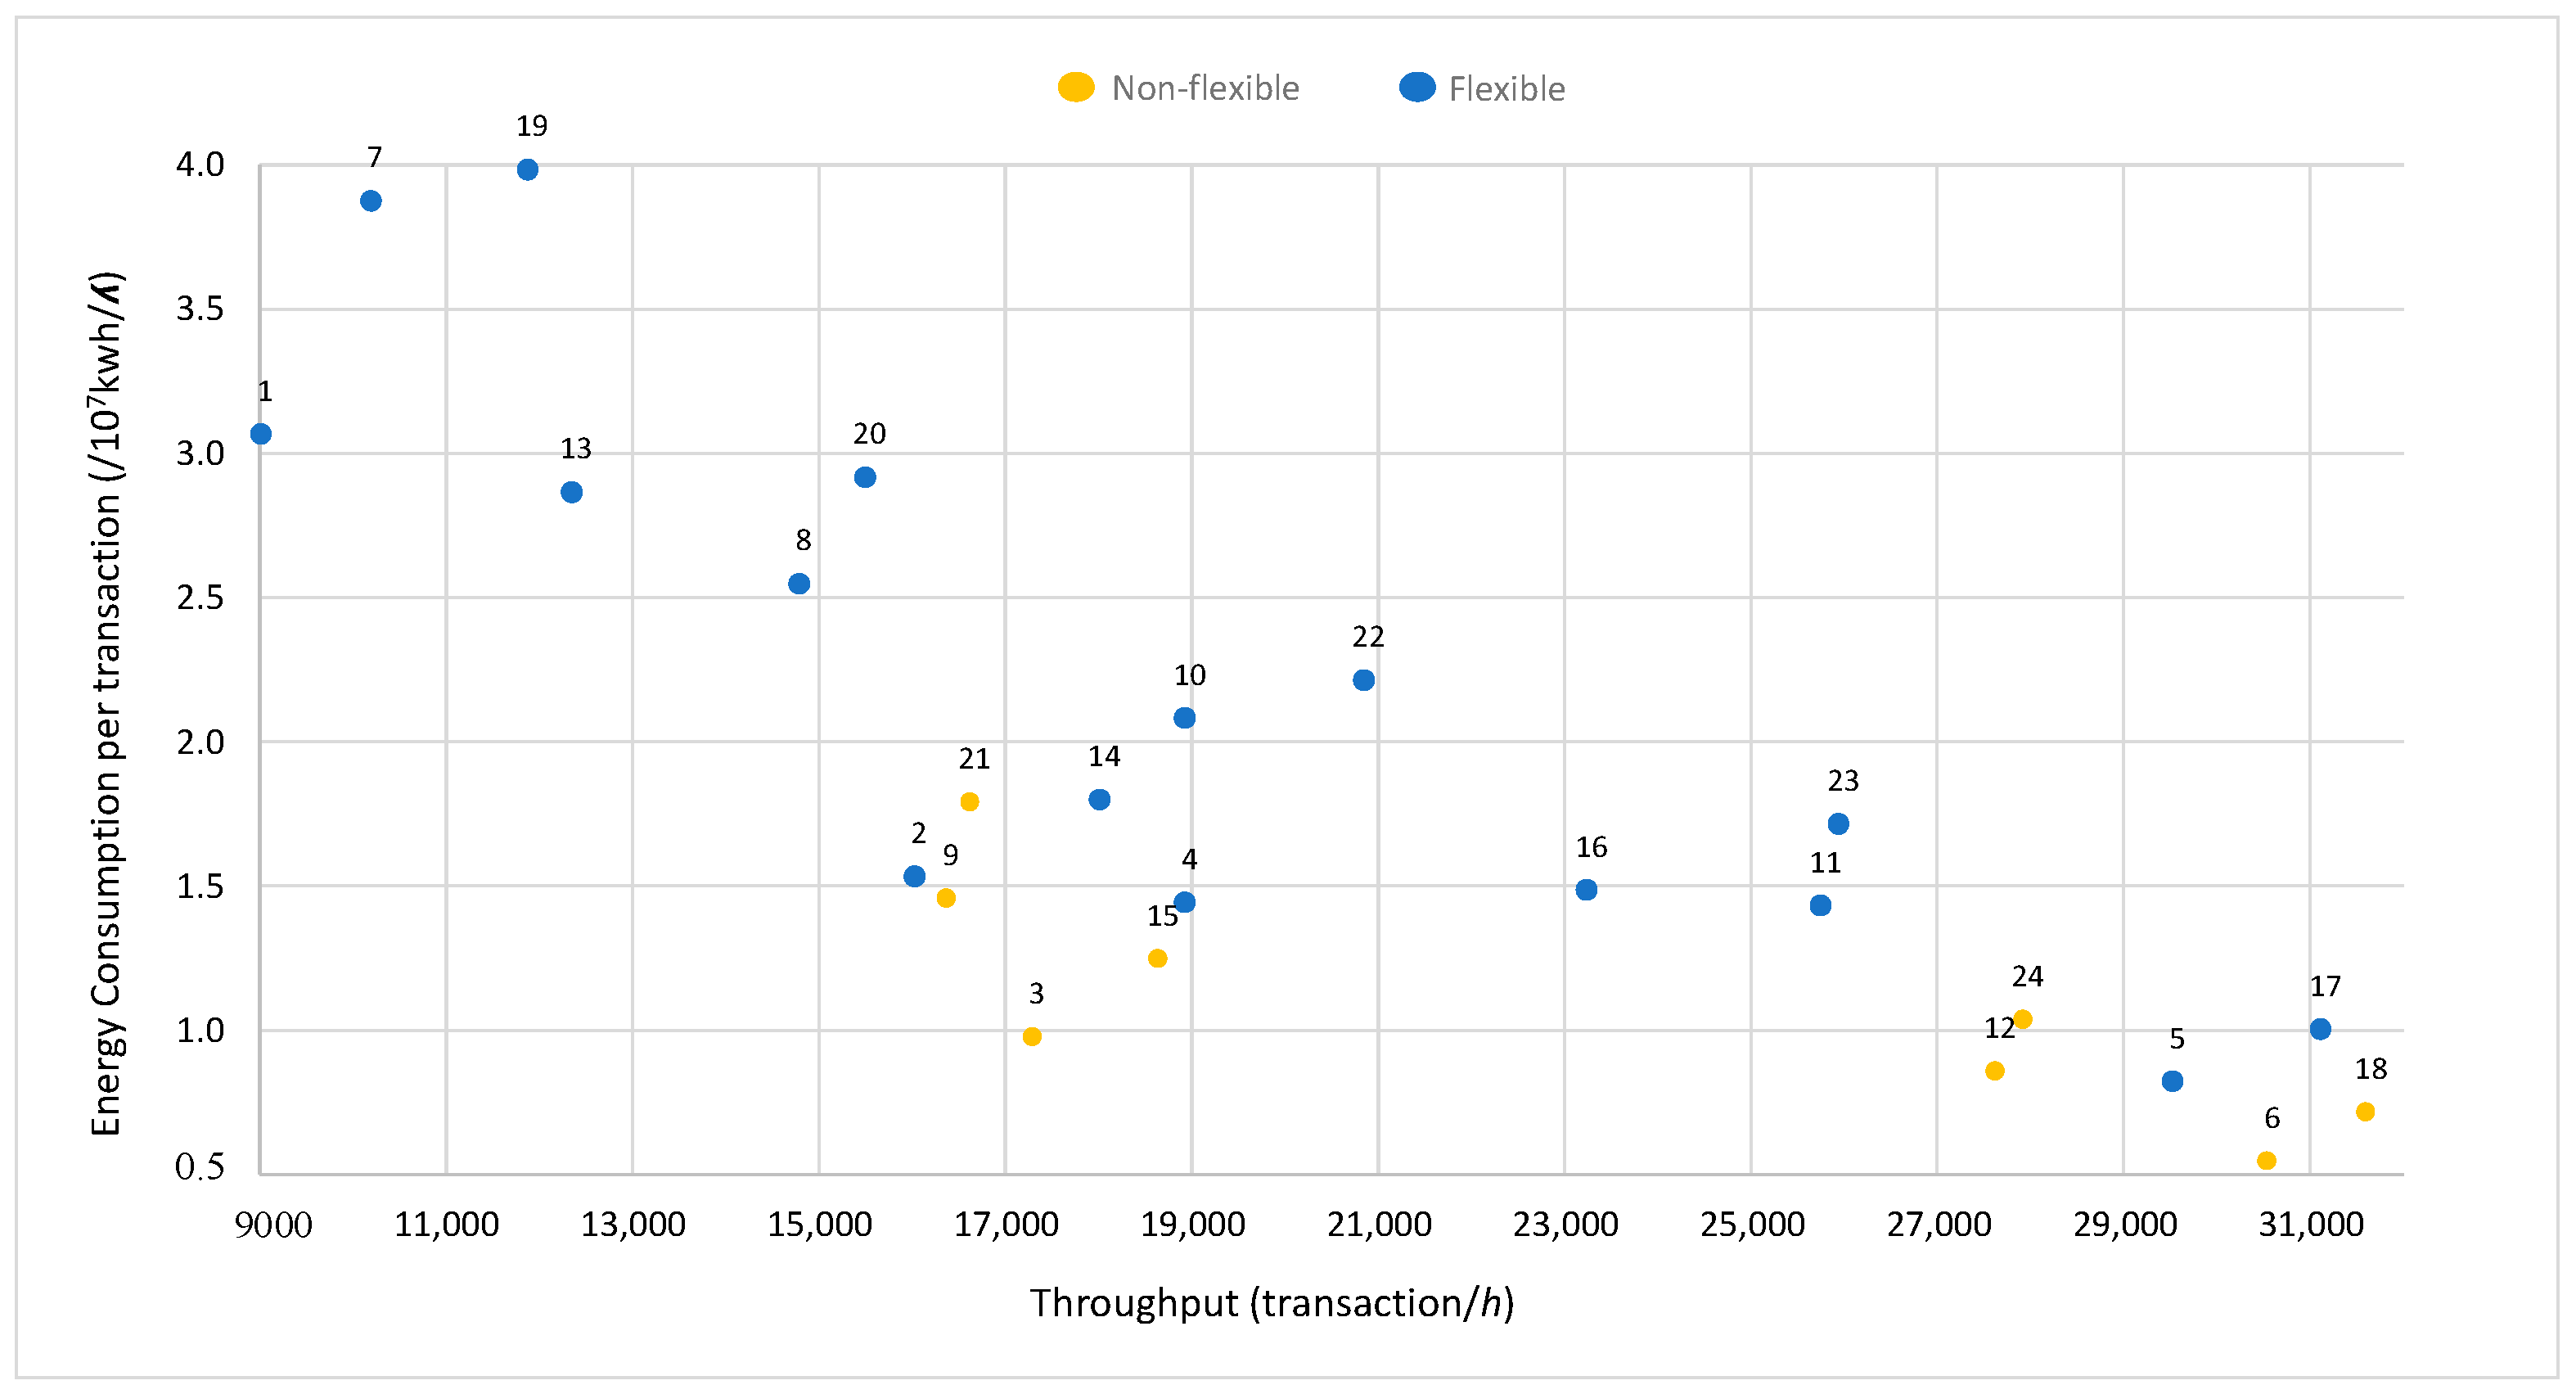
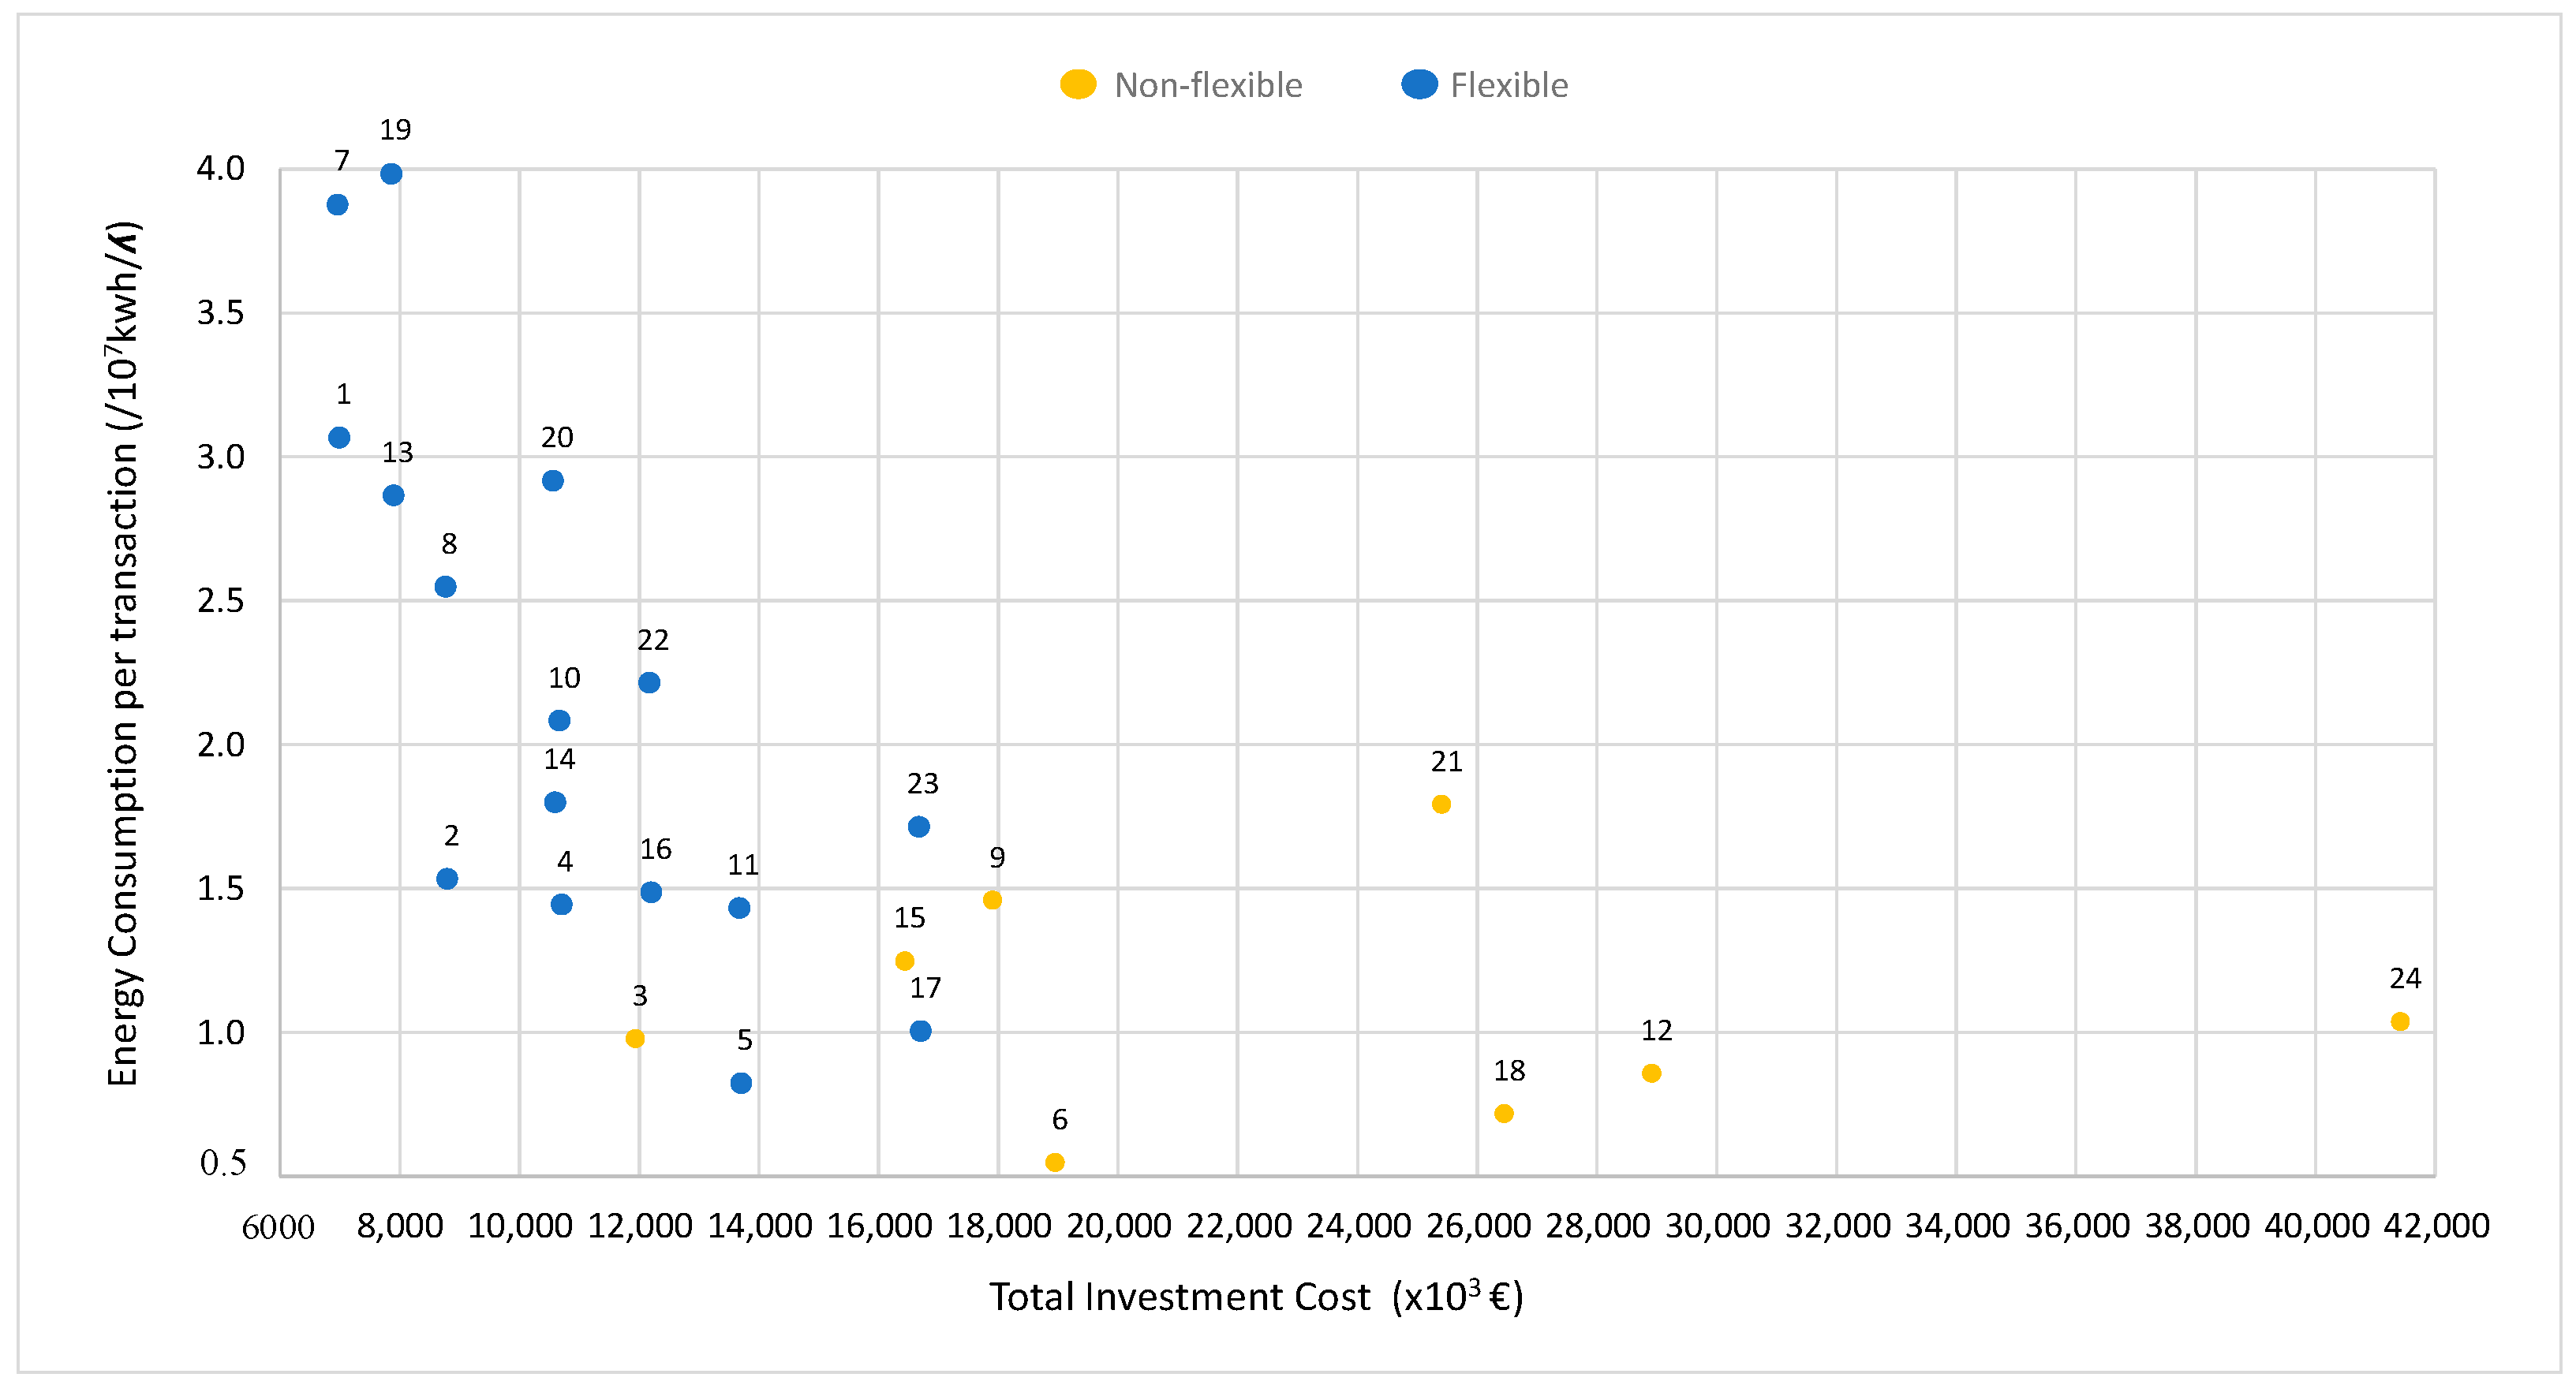
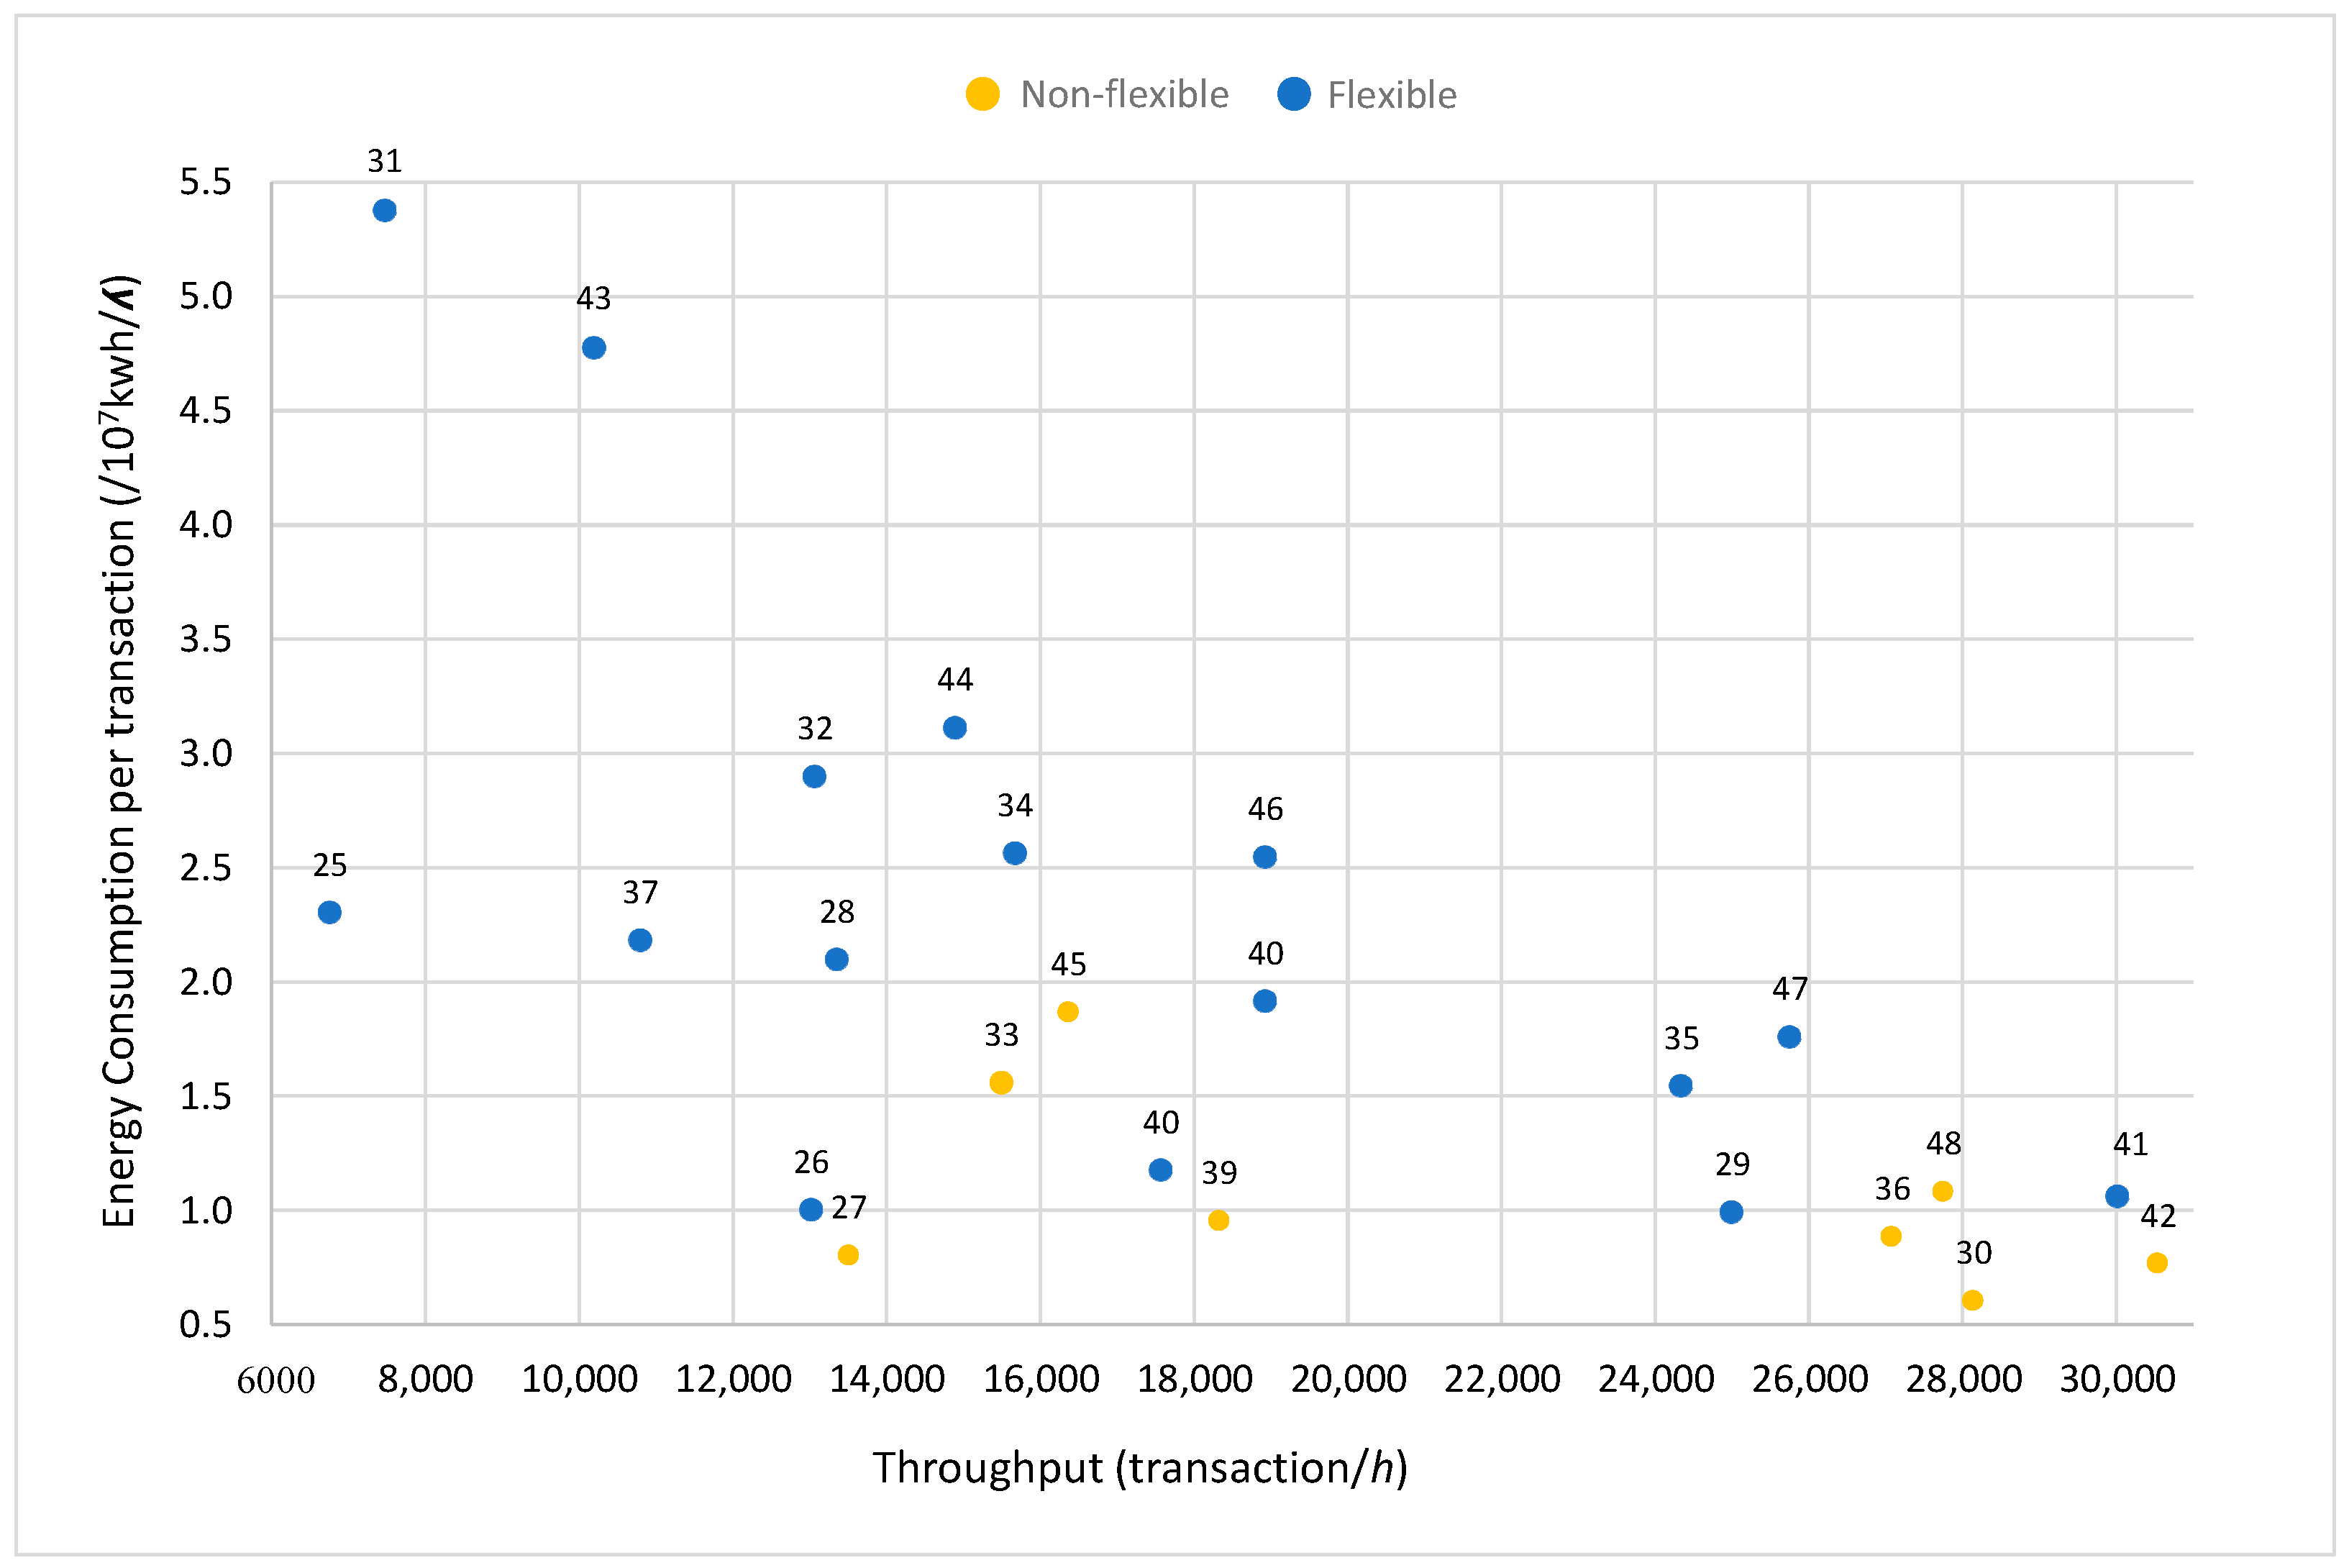
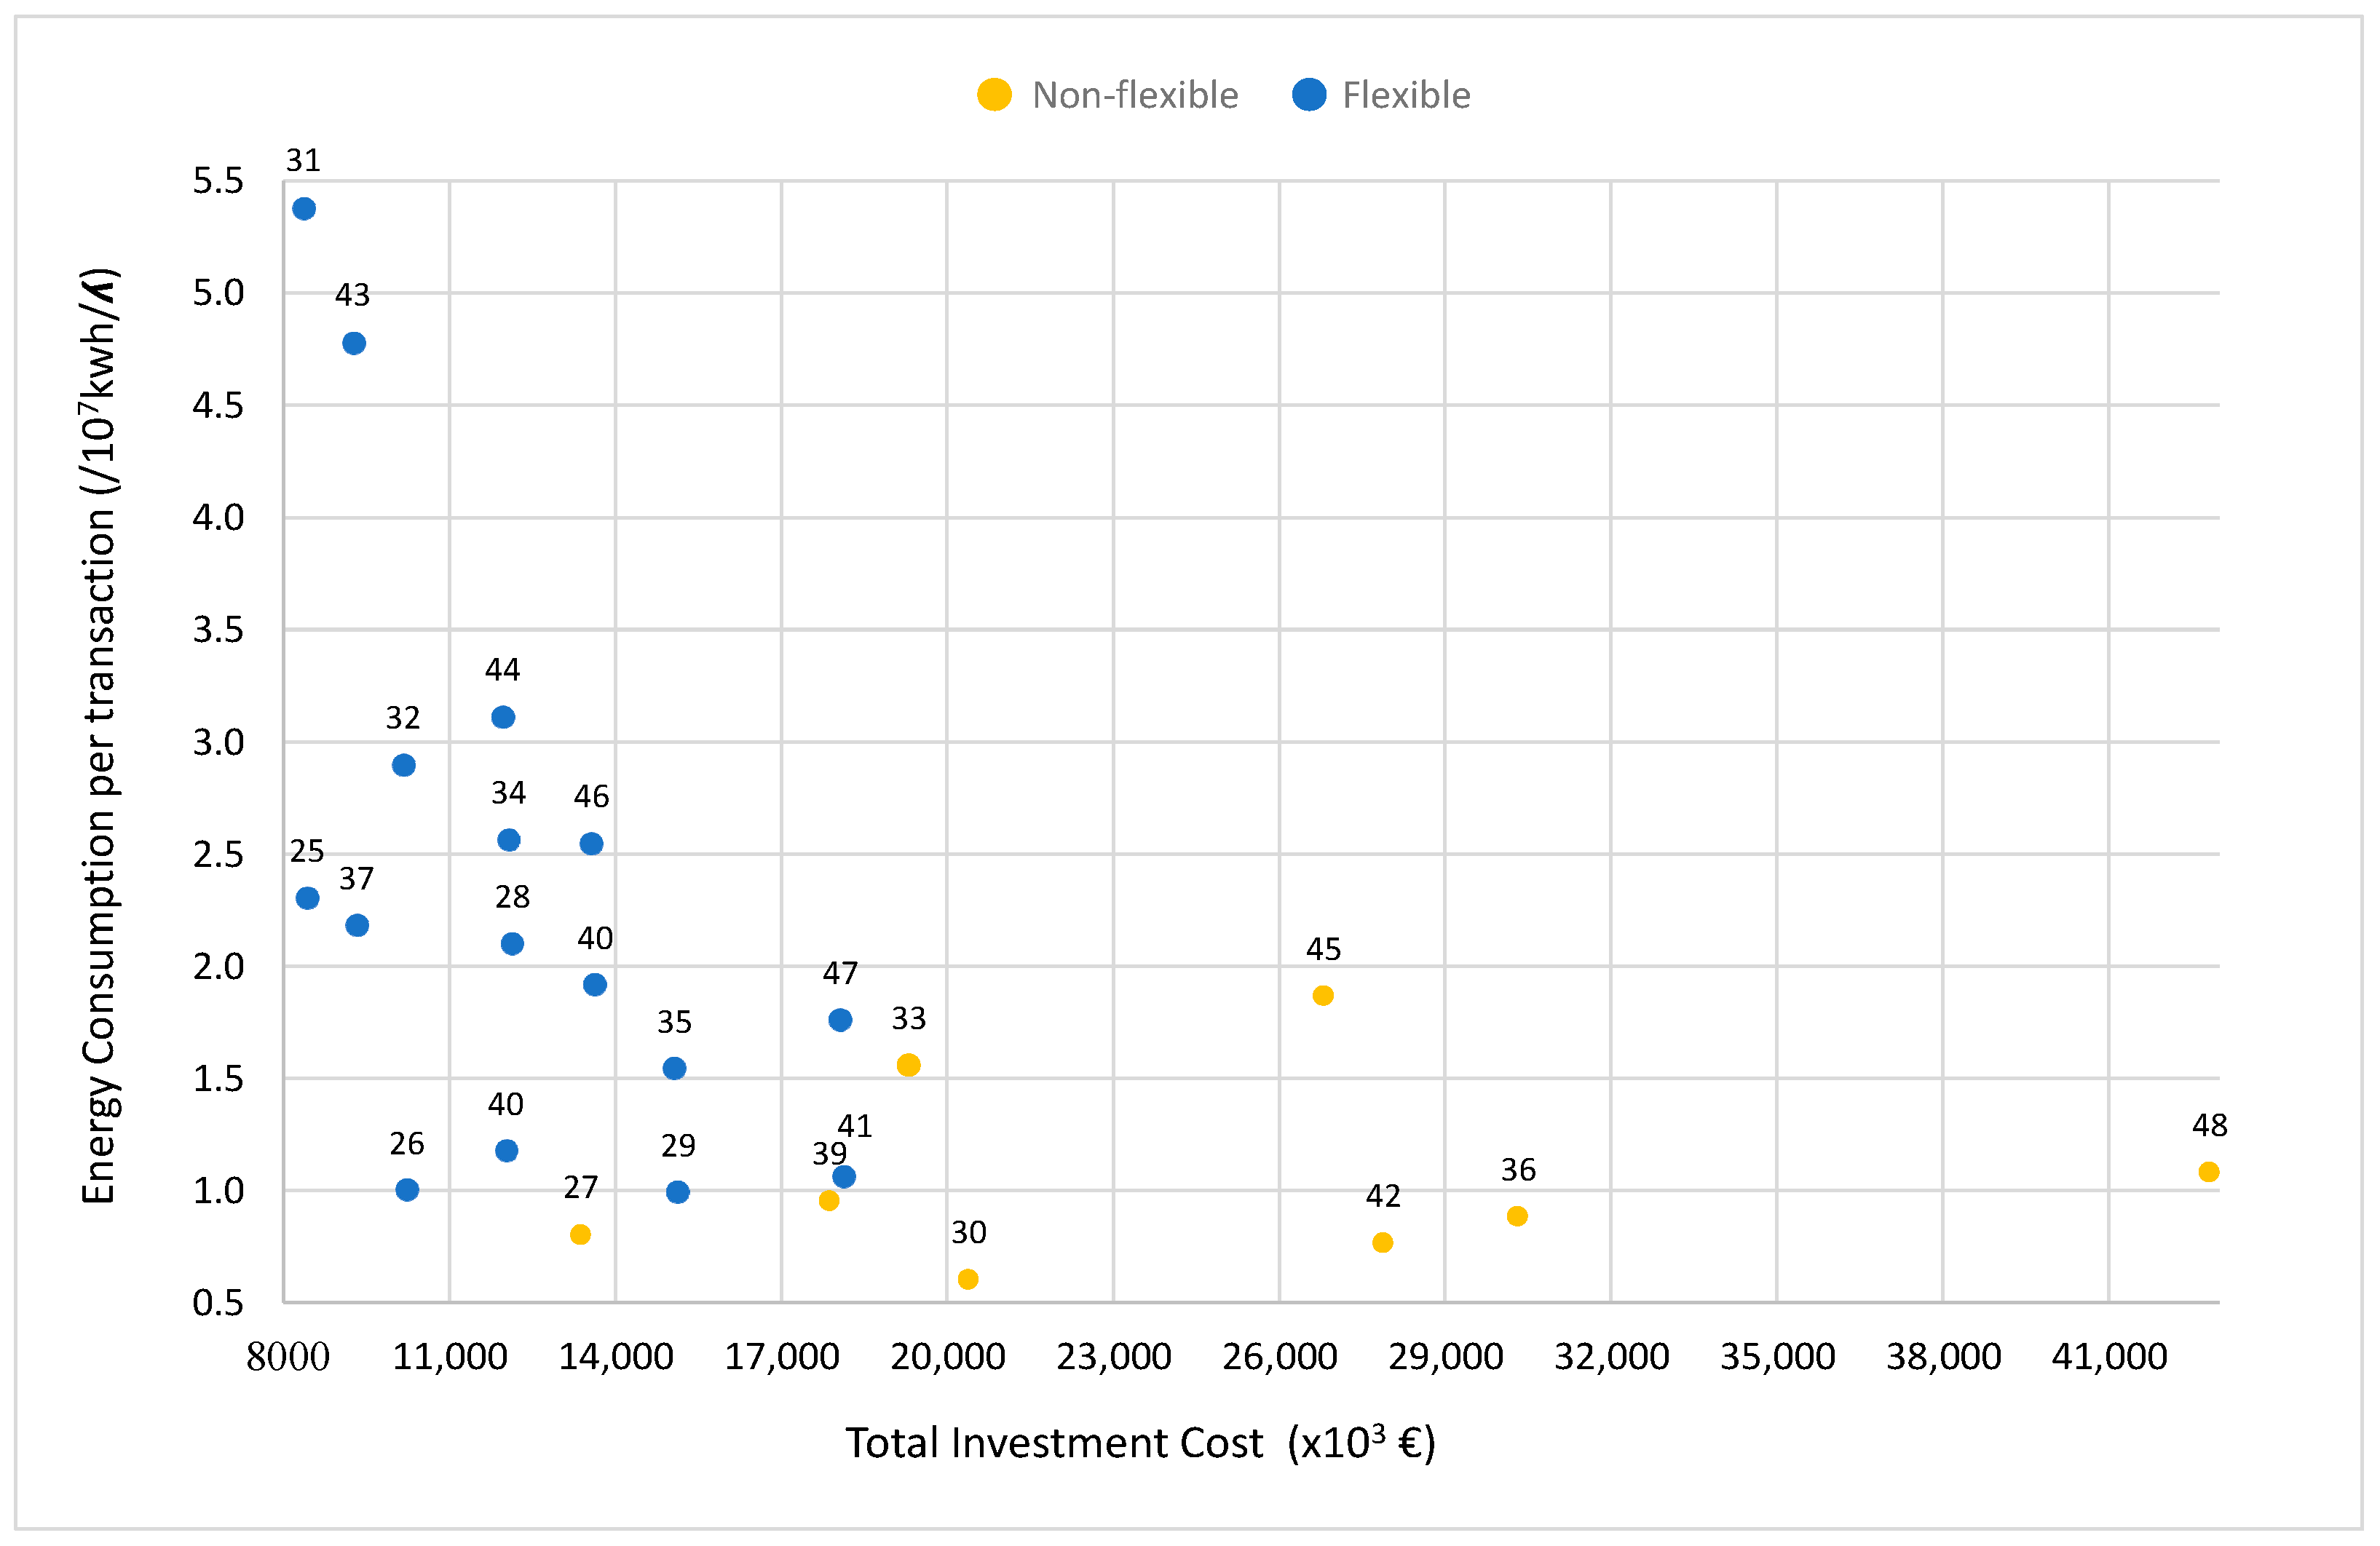
Similar graphs are also drawn for energy consumption per transaction (ET) versus initial investment costs and throughput rate per hour under two capacity scenarios. Figure 9, Figure 10, Figure 11 and Figure 12 show those results, respectively. When we check the same number of aisles and tiers scenarios for fleaxible and non-flexible systems, we do not observe better results in flexible system design in terms of energy consumption and throughout rate. This is probably because that there is LM-2 in flexible system which causes more energy consumption when shuttles travel between tiers. From a multi-objective perspective, we focus on the designs located at the right low corner again in Figure 9 and Figure 11. In Figure 10 and Figure 12, we focus on the designs around the origin points. For example, the experiment with the design number 12 having 25 tiers, 36 aisles, with shuttle speed 2 m/s produces 27,617 throughput rate per hour with 0.86 × 10⁻⁷ Kwh/ʎ. The experiment with design number 5 with 15 tiers, 60 aisles, shuttle speed 2 m/s produces 29,524 throughput rate per hour with 0.82 × 10⁻⁷ Kwh/ʎ. There is roughly 4.7% reduction in energy consumption per transaction and 6.9% increase in throughput rate per hour in design 5 compared to the design 12. Additionally, the experiment 45 with 25 tiers, 120 aisles, and shuttle speed of 4 produces 16,367 throughput rate per hour with 1.87 × 10⁻⁷ Kwh/ʎ. The experiment 41, that is with 15 tiers, 120 aisles, and shuttle speed 4 produces 30,017 throughput rate per hour with 1.06 × 10⁻⁷ Kwh/ʎ. That design 41 creates a 43.4% reduction in energy consumption per transaction and 83.4% increase in throughput rate per hour compared to design 5. Hence, this time we comment that designs 41 and 45 can be considered to be alternatives for design 5.
When Figure 10 and Figure 12 are observed, we note that there is always better alternative in flexible system design compared to non-flexible design. In experiment 5, energy consumption is 35% less than experiment 15′s energy consumption. Initial investment cost is also less in experiment 5 compared to experiment 15. Hence, that flexible system may be considered to be alternatives for experiment 15 of non-flexible system design.
All those graphs can be analyzed in this manner namely by considering multi-objective perspectives. The companies can choose the best design according to their requirements for instance providing decreased initial investment cost, increased transaction process rate per hour and energy consumption per transaction.

5. Implication of the Study

The studied performance comparison work of two SBS/RS designs, flexible and non-flexible SBS/RSs, show the trade-offs between three performance metrics: total investment cost, throughput rate per hour and energy consumption per transaction based-on different warehouse designs. From results it is observed that, the average energy consumption per transaction is usually low in non-flexible system. However, from total investment cost and throughput rate per hour perspectives, flexible system design usually provides better results than the non-flexible system. From practitioners, the most encouraging result to invest in those systems would be most probably the decreased initial investment costs. For instance, 60% decreased initial investment cost can be realized by changing the design of warehouse in flexible SBS/RS. Hence, practitioners may invest in flexible SBS/RS by considering the multi-objectives to meet their requirements.

6. Conclusions

In this paper, we study two SBS/RS designs, flexible and non-flexible SBS/RSs, developed on shuttle travel policies. We compare the performance of those two system designs based on three performance metrics: total investment cost, throughput rate per hour and energy consumption per transaction. We investigate warehouse designs providing better outputs in terms of those three-performance metrics. From energy consumption per transaction although mainly non-flexible system provides better results, from the other performance metrics flexible system provides usually better results than the non-flexible system. The most encouraging results are from initial investment costs. For instance, 60% decreased initial investment cost can be realized by changing the design of warehouse in flexible SBS/RS. The simulation results presented in this paper can be used by practitioners for multi-objective SBS/RS design to meet their requirements. The simulation assumptions considered in the models are limitation of this study. Those can be extended in the future studies. This study can also be extended by considering more warehouse designs and new performance metrics such as average cycle time per transaction as a new output parameter.

Author Contributions

Conceptualization, B.Y.E.; Software, B.Y.E., B.K. and M.K.; Validation, B.Y.E.; Investigation, B.K.; Writing—original draft, B.K. and M.K.; Supervision, B.Y.E.; Project administration, B.Y.E. All authors have read and agreed to the published version of the manuscript.

Funding

This research was funded by The Scientific and Technological Research Council of Turkey: TÜBİTAK [grant number: 118M180].

Institutional Review Board Statement

Not applicable.

Informed Consent Statement

Not applicable.

Data Availability Statement

Data is contained within the article.

Conflicts of Interest

The authors declare no conflict of interest.

References

  1. Retail TouchPoints. 88% of Consumers Will Pay for Same-Day Delivery. Available online: https://www.retailtouchpoints.com/resources/88-of-consumers-will-pay-for-same-day-delivery (accessed on 26 December 2022).
  2. Interact Analysis. Warehouse automation market to expand to over $69bn by 2025. 2021. Available online: https://www.interactanalysis.com/warehouse-automation-market-to-expand-to-over-69bn-by-2025/ (accessed on 28 December 2021).
  3. Interact Analysis. Warehouse Automation Market Infographic. 2020. Available online: https://www.interactanalysis.com/the-warehouse-automation-market-infographic/ (accessed on 28 December 2021).
  4. Lerher, T.; Šraml, M.; Potrč, I. Simulation analysis of mini-load multi-shuttle automated storage and retrieval systems. Int. J. Adv. Manuf. Technol. 2011, 54, 337–348. [Google Scholar] [CrossRef]
  5. Carlo, H.J.; Vis, I.F. Sequencing dynamic storage systems with multiple lifts and shuttles. Int. J. Prod. Econ. 2012, 140, 844–853. [Google Scholar] [CrossRef]
  6. Marchet, G.; Melacini, M.; Perotti, S.; Tappia, E. Analytical model to estimate performances of autonomous vehicle storage and retrieval systems for product totes. Int. J. Prod. Res. 2012, 50, 7134–7148. [Google Scholar] [CrossRef]
  7. Lin, Y.; Wang, Y.; Zhu, J.; Wang, L. A Model and a Task Scheduling Method for Double-Deep Tier-Captive SBS/RS With Alternative Elevator-Patterns. IEEE Access 2021, 9, 146378–146391. [Google Scholar] [CrossRef]
  8. Tappia, E.; Roy, D.; De Koster, R.; Melacini, M. Modeling, analysis, and design insights for shuttle-based compact storage systems. Transp. Sci. 2016, 51, 269–295. [Google Scholar] [CrossRef] [Green Version]
  9. Wang, Y.; Mou, S.; Wu, Y. Task scheduling for multi-tier shuttle warehousing systems. Int. J. Prod. Res. 2015, 53, 5884–5895. [Google Scholar] [CrossRef]
  10. Ekren, B.Y. Graph-based solution for performance evaluation of shuttle-based storage and retrieval system. Int. J. Prod. Res. 2017, 55, 6516–6526. [Google Scholar] [CrossRef]
  11. Küçükyaşar, M.; Ekren, B.Y.; Lerher, T. Cost and performance comparison for tier-captive and tier-to-tier SBS/RS warehouse configurations. Int. Trans. Oper. Res. 2021, 28, 1847–1863. [Google Scholar] [CrossRef]
  12. Küçükyaşar, M.; Ekren, B.Y.; Lerher, T. Energy efficient automated warehouse design. Solving Urban Infrastruct. Probl. Using Smart City Technol. 2021, 269–292. [Google Scholar] [CrossRef]
  13. Ha, Y.; Chae, J. A decision model to determine the number of shuttles in a tier-to-tier SBS/RS. Int. J. Prod. Res. 2018, 57, 1–22. [Google Scholar] [CrossRef]
  14. Arslan, B.; Ekren, B.Y. Transaction selection policy in tier-to-tier SBSRS by using Deep Q-Learning. Int. J. Prod. Res. 2022. [Google Scholar] [CrossRef]
  15. Dong, W.; Jin, M. Travel time models for tier-to-tier SBS/RS with different storage assignment policies and shuttle dispatching rules. Transp. Res. Part E Logist. Transp. Rev. 2021, 155, 102485. [Google Scholar] [CrossRef]
  16. Marchet, G.; Melacini, M.; Perotti, S.; Tappia, E. Development of a framework for the design of autonomous vehicle storage and retrieval systems. Int. J. Prod. Res. 2013, 51, 4365–4387. [Google Scholar] [CrossRef]
  17. Ekren, B.Y.; Akpunar, A.; Sari, Z.; Lerher, T. A tool for time, variance and energy related performance estimations in a shuttle-based storage and retrieval system. Appl. Math. Model. 2018, 63, 109–127. [Google Scholar] [CrossRef]
  18. Ha, Y.; Chae, J. Free balancing for a shuttle-based storage and retrieval system. Simul. Model. Pract. Theory 2018, 82, 12–31. [Google Scholar] [CrossRef]
  19. Ha, Y.; Chae, J. A Decis. Model Determ. Number Shuttles in a Tier toTier SBS/RS. Int. J. Prod. Res. 2019, 57, 963–984. [Google Scholar] [CrossRef]
  20. Sawadogo, D.; Sané, S.; Kaboré, S.E. Sustainability management and the success of international development projects: The role of political and social skills. J. Bus. Socio-Econ. Dev. 2022. ahead of print. [Google Scholar] [CrossRef]
  21. Ekren, B.Y. A simulation-based experimental design for SBS/RS warehouse design by considering energy related performance metrics. Simul. Model. Pract. Theory 2020, 98, 101991. [Google Scholar] [CrossRef]
  22. Ekren, B.Y. A multi-objective optimisation study for the design of an AVS/RS warehouse. Int. J. Prod. Res. 2021, 59, 1107–1126. [Google Scholar] [CrossRef]
  23. Ekren, B.Y.; Akpunar, A. An open queuing network-based tool for performance estimations in a shuttle-based storage and retrieval system. Appl. Math. Model 2021, 89, 1678–1695. [Google Scholar] [CrossRef]
  24. Lerher, T. Aisle changing shuttle carriers in autonomous vehicle storage and retrieval systems. Int. J. Prod. Res. 2018, 56, 3859–3879. [Google Scholar] [CrossRef]
  25. Turhanlar, E.E.; Ekren, B.Y.; Lerher, T. Autonomous mobile robot travel under deadlock and collision prevention algorithms by agent-based modelling in warehouses. Int. J. Logist. Res. Appl. Open Access 2022. [Google Scholar] [CrossRef]
  26. Ekren, B.Y.; Arslan, B. A reinforcement learning approach for transaction scheduling in a shuttle-based storage and retrieval system. Int. Trans. Oper. Res. 2022, 1–22. [Google Scholar] [CrossRef]
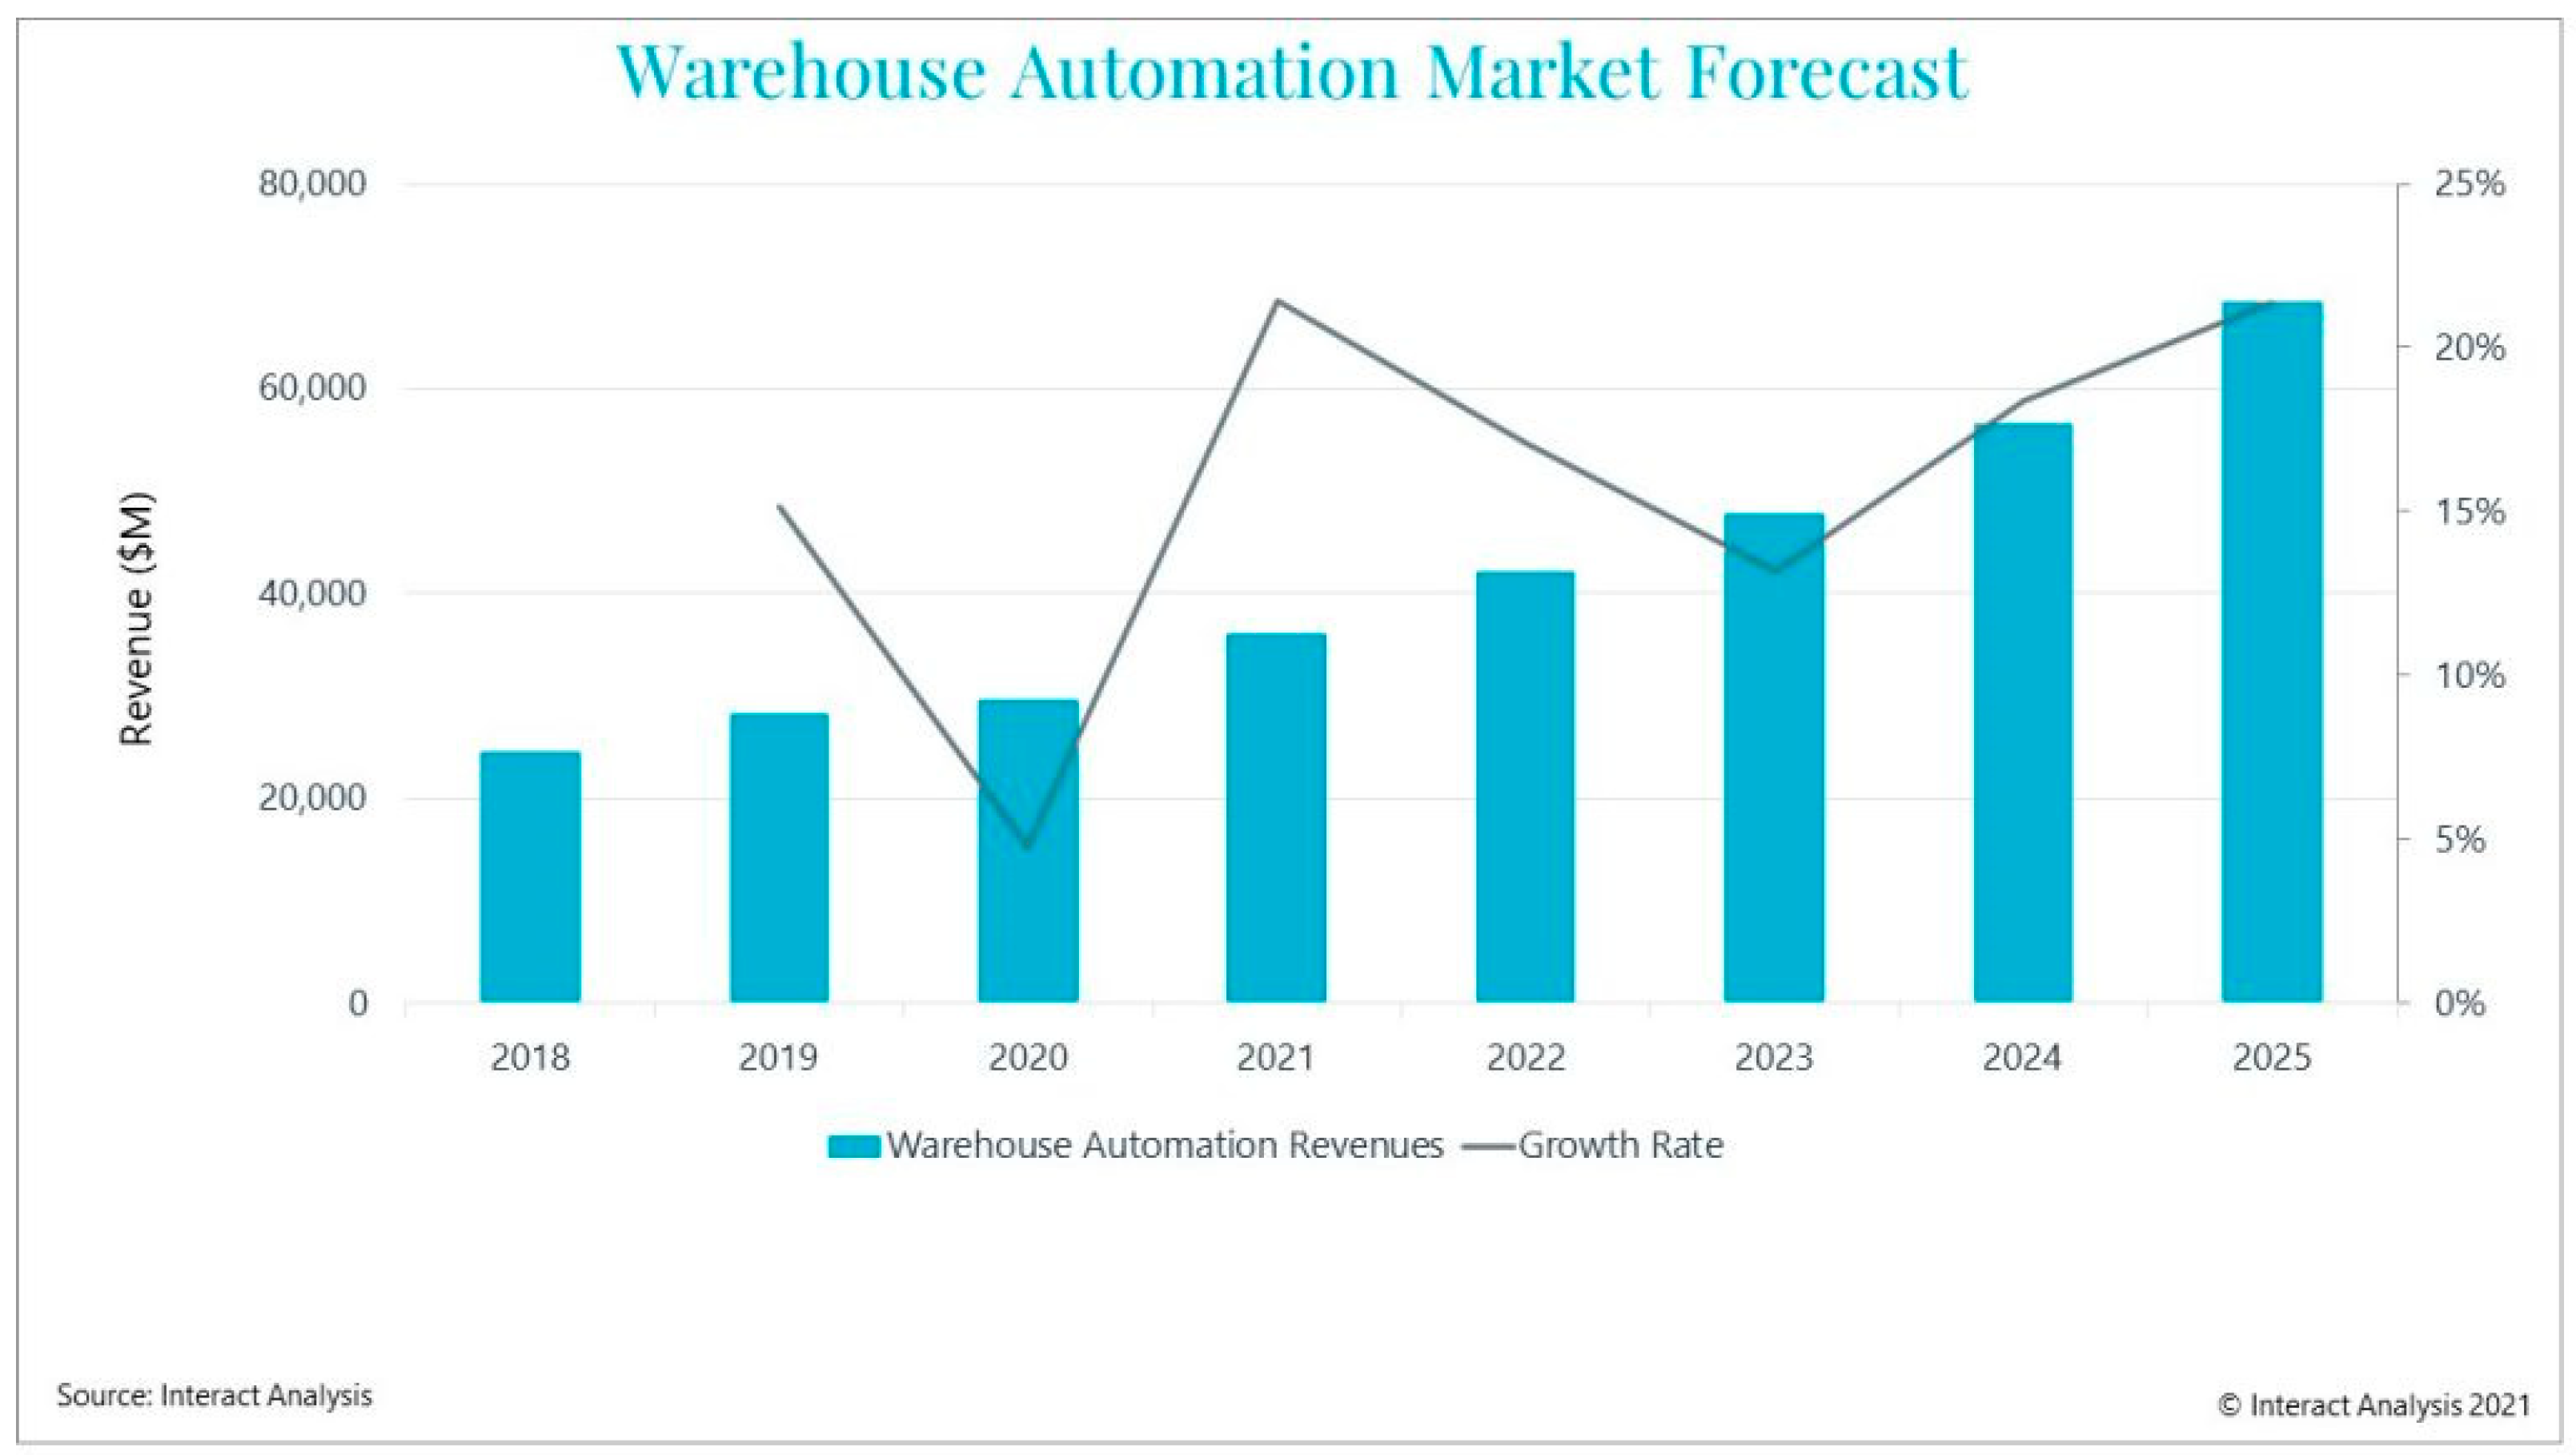
Figure 1. Global warehouse automation market forecast [2].
Sustainability 15 00762 g001
Figure 2. Side view and top view of an aisle in non-flexible SBS/RS.
Sustainability 15 00762 g002
Figure 3. Side view and top view of and aisle in flexible SBS/RS.
Sustainability 15 00762 g003
Figure 4. Storage process flow chart in flexible SBS/RS.
Sustainability 15 00762 g004
Figure 5. Retrieval Process flow chart in flexible SBS/RS.
Sustainability 15 00762 g005
Figure 6. A snapshot from the simulation animation.
Sustainability 15 00762 g006
Figure 7. Throughput versus total investment cost graph for 45,000 bay capacity.
Sustainability 15 00762 g007
Figure 8. Throughput versus total investment cost graph for 90,000 bay capacity.
Sustainability 15 00762 g008
Figure 9. Throughput versus energy consumption per transaction graph for 45,000 bay capacity.
Sustainability 15 00762 g009
Figure 10. Total investment cost versus energy consumption per transaction graph for 45,000 bay capacity.
Sustainability 15 00762 g010
Figure 11. Throughput versus energy consumption per transaction graph for 90,000 bay capacity.
Sustainability 15 00762 g011
Figure 12. Total investment cost versus energy consumption per transaction graph for 90,000 bay capacity.
Sustainability 15 00762 g012
Table 1. Design Factors.
Factor/Factor Level123
Tier (T)1525
Aisle (A)3050
Velocity (V)24
Number of shuttle (Ns)36Non-flexible
Table 2. Cost Calculation Parameters.
ParametersDefinitionUnitValue 1Value 2
C1Cost of ShuttleEUR/shuttle20,00030,000
C2Cost of LM-1EUR/LM-150,000
C3Cost of LM-2EUR/LM-275,000
C4Cost of a BayEUR/bay30
C5Cost of a Space EUR/m250
BTotal number of bays in a tier
SFootprint of the warehousem2
NsNumber of shuttles in an aisle
LwLength of the warehousem
WwWidth of the warehousem
dDistance between two adjacent baysm
IbLength of buffer aream
IcLength of conveyor aream
I1Length of LM-1m
I2Length of LM-2m
wrWidth of a rackm
waWidth of an aislem
NODesign number
NTNumber of Tier
NANumber of Aisle
NBNumber of Bay
TCTotal CostEUR
ʎThroughput per Hour
UsUtilization of Shuttle
L1uUtilization of Lift 1
L2uUtilization of Lift 2
CPTCost per ThroughputEUR/ʎ
ETEnergy consumption per transactionKwh/ʎ
Table 3. Simulation results for 45,000 bay capacity.
NoNTNBNANSVL1UL2UUsʎTCCI (±) ET
115100303272%73%98%901169922.06 × 10−33.07 × 10⁻⁷
215100306297%80%98%16,02687921.07 × 10−31.53 × 10⁻⁷
3151003015297%NA51%17,28811,9421.56 × 10−30.98 × 10⁻⁷
41560503276%75%97%18,92710,7011.46 × 10−31.44 × 10⁻⁷
51560506297%77%97%29,52413,7011.07 × 10−30.82 × 10⁻⁷
615605015297%NA52%30,53618,9511.61 × 10−30.55 × 10⁻⁷
72560303276%80%98%10,19169608.34 × 10−43.88 × 10⁻⁷
82560306297%91%97%14,79187604.77 × 10−42.55 × 10⁻⁷
925603025298%NA45%16,36717,9102.56 × 10−31.46 × 10⁻⁷
102536503278%82%97%18,92710,6691.47 × 10−32.08 × 10⁻⁷
112536506297%89%97%25,74713,6697.77 × 10−41.43 × 10⁻⁷
1225365025297%NA45%27,61728,9192.38 × 10−30.86 × 10⁻⁷
1315100303478%74%98%12,35078921.88 × 10−32.87 × 10⁻⁷
1415100306497%76%96%18,01010,5921.44 × 10−31.80 × 10⁻⁷
15151003015497%NA57%18,63616,4421.98 × 10−31.25 × 10⁻⁷
161560503481%75%98%23,23612,2011.10 × 10−31.49 × 10⁻⁷
171560506498%70%96%31,11216,7011.24 × 10−31.00 × 10⁻⁷
1815605015497%NA55%31,59726,4511.31 × 10−30.72 × 10⁻⁷
192560303480%82%98%11,87478601.90 × 10−33.98 × 10⁻⁷
202560306497%89%97%15,49510,5601.04 × 10−32.92 × 10⁻⁷
2125603025497%NA46%16,62025,4103.78 × 10−31.79 × 10⁻⁷
222536503481%82%98%20,84512,1691.41 × 10−32.21 × 10⁻⁷
232536506497%90%96%25,93816,6698.61 × 10−41.72 × 10⁻⁷
2425365025497%NA48%27,91841,4192.81 × 10−31.04 × 10⁻⁷
Table 4. Simulation results for 90,000 bay capacity.
NoNTNBNANSVL1UL2UUsʎTCCI (±) ET
2515200303247%59%98%675584213.10 × 10−32.30 × 10⁻⁷
2615200306297%50%96%13,01510,2211.01 × 10−31.00 × 10⁻⁷
27152003015298%NA41%13,50613,3711.53 × 10−38.04 × 10⁻⁷
2815120503270%72%97%13,35312,1302.23 × 10−32.10 × 10⁻⁷
2915120506296%81%98%24,99515,1305.28 × 10−40.99 × 10⁻⁷
30151205015298%NA54%28,13120,3801.52 × 10−30.60 × 10⁻⁷
3125120303270%78%98%746883582.67 × 10−35.38 × 10⁻⁷
3225120306295%92%98%13,06410,1581.20 × 10−32.90 × 10⁻⁷
33251203025297%NA37%15,49519,3081.86 × 10−31.56 × 10⁻⁷
342572503274%81%97%15,66712,0671.68 × 10−32.56 × 10⁻⁷
352572506297%91%98%24,33315,0677.66 × 10−41.54 × 10⁻⁷
3625725025298%NA45%27,07430,3172.30 × 10−30.88 × 10⁻⁷
3715200303474%62%98%10,79493211.83 × 10−32.18 × 10⁻⁷
3815200306497%50%88%17,56712,0211.36 × 10−31.17 × 10⁻⁷
39152003015498%NA39%18,32217,8712.51 × 10−30.95 × 10⁻⁷
4015120503476%75%97%18,92713,6301.86 × 10−31.91 × 10⁻⁷
4115120506498%73%98%30,01718,1301.48 × 10−31.06 × 10⁻⁷
42151205015497%NA51%30,53627,8802.37 × 10−30.77 × 10⁻⁷
4325120303476%80%98%10,19192581.11 × 10−34.78 × 10⁻⁷
4425120306497%91%97%14,89111,9585.41 × 10−43.11 × 10⁻⁷
45251203025497%NA45%16,36726,8083.83 × 10−31.87 × 10⁻⁷
462572503478%82%97%18,92713,5671.87 × 10−32.55 × 10⁻⁷
472572506497%89%97%25,74718,0671.01 × 10−31.76 × 10⁻⁷
4825725025498%NA51%27,74242,8173.66 × 10−31.08 × 10⁻⁷
Disclaimer/Publisher’s Note: The statements, opinions and data contained in all publications are solely those of the individual author(s) and contributor(s) and not of MDPI and/or the editor(s). MDPI and/or the editor(s) disclaim responsibility for any injury to people or property resulting from any ideas, methods, instructions or products referred to in the content.