Article

Landscape Pattern Changes Affect Runoff and Sediment Yield in the Nandong Underground River System in Southwest China

1
College of Forestry, Guangxi University, Nanning 530001, China
2
Institute of Karst Geology, Chinese Academy of Geological Sciences, Guilin 541004, China
3
College of Environment and Resources, Guangxi Normal University, Guilin 541004, China
4
Guangxi Institute of Botany, Chinese Academy of Sciences, Guilin 541006, China
*
Author to whom correspondence should be addressed.
Sustainability 2023, 15(1), 835; https://doi.org/10.3390/su15010835
Submission received: 16 November 2022 / Revised: 17 December 2022 / Accepted: 28 December 2022 / Published: 3 January 2023

Abstract

:
Since 2008, soil and water treatment and ecological restoration have been applied in the karst areas of Southwest China, but the effect of the treatments in karst fault basins is not clear. As a typical watershed of a faulted basin, studying the influence of landscape pattern changes on runoff and sediment yields in the Nandong underground river system (NURS) helps to establish the relationship between watershed and runoff and sediment changes. It provides a theoretical basis and effective method for water and soil management assessment, and soil and water treatment in karst fault basins. The vegetation topographic factor (VTF) was constructed using the normalized vegetation index (NDVI), digital elevation model (DEM) and water-system map from 2000 to 2018. On the basis of VTF classification, the vegetation topographic landscape index (VTLI) was calculated using the FRAGSTATS software, and the effects of VTLI changes on NURS runoff and sediment yield were analyzed. The study found the following: (1) PD, IJI, LSI and SHDI were positively correlated with runoff and sediment yield (p < 0.01), and the correlation coefficients were 0.693, 0.668, 0.551 and 0.582 and 0.62, 0.635, 0.627 and 0.63, respectively. AI and CONNECT were significantly negatively correlated with runoff and sediment yield (p < 0.01), and the correlation coefficients were −0.551 and −0.596, −0.627 and −0.446, respectively. The LPI and DIVISION index were not significantly correlated with discharge, but were significantly correlated with sediment yield (p < 0.05), and the correlation coefficients were −0.179 and 0.271, respectively. (2) The interpretation of VTLI for runoff increased from 0.639 to 0.778, and the interpretation of sediment transport decreased from 0.809 to 0.613. (3) In urban areas, VTF decreased and was persistent. VTF increased in the basin mountain edge area. In mountainous areas, VTF was unchanged, but has an antipersistence trend. The NURS ecological restoration project had achieved obvious results, and the change in the watershed increased runoff production and reduced sediment production. The capacity of soil and water conservation in the high slope area of the mountain edge of the basin recovered and showed a trend of sustainable development. Due to the urban expansion brought about by economic development, the capacity of soil and water conservation around the city has declined, and it showed a sustainable development trend. Policymakers should strengthen the ecological environment of urban areas and coordinate development within mountainous areas.

1. Introduction

The spatial arrangement of landscape patches of different sizes, shapes and types constitutes the landscape pattern, which is the result of the coupling of human activities and natural factors at different scales [1]. The landscape pattern index is an important tool to describe the spatial organization structure of a landscape [2]. With the development of landscape ecology and spatial information analysis methods, the landscape pattern index has been gradually applied to the field of watershed runoff and sediment yield [3,4]. Soil erosion causes regional soil and water loss and vegetation degradation, which is a worldwide problem seriously threatening regional ecological environment and economic development [5,6]. Landscape pattern can be characterized by underlying surface structure and characteristics, including land use, topography, vegetation cover, hydrological connectivity and other changes. A reasonable landscape pattern can reduce the damage of soil erosion by regulating the cycle of soil moisture and nutrients [7,8]. At present, research on landscape pattern mainly uses FRAGSTATS software to calculate the landscape pattern index to measure the effect of the landscape pattern on ecological processes.
Land use change affects ecological processes through landscape pattern changes [9]. Land use landscape pattern has become one of the most frequently discussed topics in the study of local and global environmental changes. Based on the remote sensing interpretation of land use types, the composition and distribution characteristics of landscape are quantitatively analyzed [10]. The landscape pattern of land use is also an important form of human activity. It is closely related to the hydrological cycle and ecological factors in watershed [11,12]. Reid compared the soil erosion on three patch types (canopy, forest, and bare) in northern New Mexico in the United States [13]. The bare patch areas generated the highest runoff and sediment yield. These barren patches are also sources of runoff and sediment, while canopy patches and vegetated patches inhibit soil erosion. Boix-Fayos found soil loss could reach more than nine times in different vegetation patterns in southeastern Spain [14]. B. Yan quantified the contribution of single land use type change to runoff and sediment yield change using a hydrological model and partial least squares regression (PLSR) [15]. Different land use transformations change the degree of soil erosion [16]. Yu believes that woodland and shrubs are the first choice to curb soil erosion when the land use transformation occurs [17].
However, the landscape pattern index generated by land use patterns is generally characterized by a low temporal resolution and failure to show features such as hydrological connectivity, vegetation cover and topography. Hydrological connectivity is an important method to study the runoff (sediment) yield difficulty in watershed, which can indicate the runoff and sediment transport path and surface landscape changes [18]. Usually, the Euclidean distance between grid points and water system is used to represent the hydrological connectivity [19]. The existence of vegetation has a positive effect on reducing soil erosion [20,21], and the NDVI representing vegetation cover can be accurate to the monthly scale and beyond. The slope factor is important to sediment production and discharge process in the basin, which can increase the gravitational potential energy of the water and soil. To a certain extent, soil erosion is positively correlated with the slope, and the greater the slope, the more serious the soil erosion [22,23]. In addition, land use cannot quantify the level of soil erosion capacity. Therefore, the vegetation topographic factor (VTF) and vegetation topographic landscape index (VTLI) were constructed in this paper. VTF is composed of vegetation cover, terrain slope and Euclidean distance to the water system, which can reflect the water and soil conservation capacity in the watershed. Based on the classification of the VTF, the landscape pattern index was further calculated. Through the relationship between each VTF grid, the influence of each VTF on the sediment production in the basin and the change in the importance degree of a certain factor influencing sediment production were studied.
The karst fault basin is the typical geomorphology in karst areas of southwest China, and the interaction mechanism between soil erosion and landscape changes is the focus of this paper. In order to improve the local environmental problems, the “National Program for Medium to Long-term Scientific Planning and Development Outline (2006–2020)” prioritized ecological restoration and reconstruction functions in ecologically fragile regions as the focus of the southwest karst area, and more measures of ecological governance and water conservation were adopted in these areas. However, the ecological restoration effect in fault basins is controversial [24]. Xiao found that the ecological, economic and social benefits of regional ecological governance projects in faulted basins have been continuously enhanced [25]. Using the changes in vegetation productivity, Zhang found that rocky desertification control and vegetation restoration have a certain effect, but it is still not stable [26]. Some researchers believe that ecological engineering has no significant impact on vegetation changes in the fault basin regions, and human activities are a more important factor causing vegetation degradation in these areas [27].
Because the response mechanism of watershed runoff and sediment to landscape pattern changes is not yet clear, the above studies have not clearly shown the effectiveness of soil and water conservation governance in faulted basins. To evaluate the effect of soil and water conservation of various landforms in faulted basins correctly, we used NDVI, slope and Euclidean to construct a VTF index, which represents the soil and water conservation capacity. The trend of soil and water conservation capacity was analyzed with the slope method. The Hurst index method was used to study the sustainable trend of the soil and water conservation ability, and to evaluate the effect of soil and water conservation in different landform parts of the fault basin. In addition, the relationship between the various landscape indicators (underlying surface) of the watershed and the yield of water and sediment is currently unclear, and it is impossible to adopt corresponding landscape management measures for the restoration of specific watersheds. Therefore, we constructed eight indicators of VTLI on the basis of VTF. Pearson’s method analyzed the correlation between the eight indicators and water and sediment yield to understand the closeness of these indicators to water and sediment production. We used the PLSR method to analyze the important changes from 2000 to 2018, and to verify the validity of the newly constructed model.
As a typical representative of fault basin, the Nandong underground river system (NURS) is the main water supply system at the source of the Pearl River ae well as the political, cultural and economic center of southern Yunnan. It has the characteristics of population concentration, ecological pressure and serious soil erosion [28]. In recent years, due to the acceleration of economic development, human activities continue to transform the landscape pattern of NURS, which has had a serious impact on runoff and sediment yield of the entire basin. The ecological resource conservation, water supply and sediment control of NURS play important roles in the ecological protection of the Pearl River Basin and the economic development of southern Yunnan. Therefore, the main research content consists of the following three parts: (I) Construct the VTLI model and analyze its correlation with runoff and sediment transport. (II) Use the PLSR method to study the changing trend of VTLI importance over time. (III) Study the variation trend of VTF in the space time range and whether the trend change is sustainable.

2. Materials and Methods

2.1. Study Region

The Nandong Underground River System (NURS) is located in Mengzi, Kaiyuan and Gejiu Honghe Prefecture, Yunnan Province, which is a secondary tributary of the upper reaches of the Pearl River. NURS covers an area of about 1628 km2, with an average annual runoff of 260 million m3/a. It is one of the four underground rivers in southwest China. NURS is located on the Kangdian rhombus plate on the east side of the Himalayan plate, and two fault zones cross the north-west and north-south. Therefore, high mountains and basins coexist in NURS (Figure 1). The altitude of the plateau mountainous area is above 1900 m, which is mainly covered by the pure and thick limestone dolomitic limestone of the Middle Triassic Gejiu formation. The elevation of the fault basin area is about 1250~1330 m, which is composed of three beaded basins from south to north, including the Mengzi, Caoba and Dazhuang, widely distributed in the tertiary marl and mudstone Quaternary sandy clay. NURS, located near the tropic of cancer, is a low-latitudes subtropical zone with a monsoon climate and simultaneous heat and precipitation. Due to the special landform, the study area has a three-dimensional climate. In the basin area, the mean annual temperature in the basin is 18.3 °C, the maximum extreme temperature is 38.2 °C, and the extreme minimum temperature is −4.9 °C. The average annual rainfall is 738.1 mm and the average annual evaporation is 687.7 mm. In the mountainous area, the average annual temperature is 13.7 °C with an extreme maximum temperature of 30.3 °C and an extreme minimum temperature of −6.4 °C. The average annual rainfall is 1214.1 mm, and the average annual evaporation is 1509.6 mm. According to the observation data, in 1998–2014, the annual average sediment content of NURS is 0.105 kg/m3, the annual average discharge is 8.15 m3/s, the average total runoff is 257 million m3 and the soil erosion modulus is 16.58 t/km2 a.

2.2. Data

The digital elevation model (DEM) was derived from Data Mirroring Station of Chinese Academy of Sciences (http://www.cnic.cas.cn/, accessed on 25 April 2020). The normalized vegetation index (NDVI) was obtained from the NASA data information service (MODl3Q1) (http://modis.gsfc.nasa.gov, accessed on 6 June 2020), with a temporal resolution of 16 days and spatial resolution of 250 m [29]. These data are multi-spectrum, have strong recognition ability and are widely used in ecological environment monitoring and climate change research [30]. The MODIS Reprojection tool (MRT) is used to convert the original MODIS data into the WGS84/Geographic and Albers Equal Area used for projections. In order to reduce the interference of cloud and atmospheric noise on data accuracy, the Maximum Value Composite (MVC) method was adopted in this study to obtain the monthly NDVI values of the above remote sensing data [31]. The water system map of NURS for calculating Euclidean is from the project team. The monthly runoff and sediment yield are provided by the Bureau of Hydrology and Water Resources of Honghe Prefecture, Yunnan Province, of China in the time series from 2000 to 2018 in the NURS. Data usage and resolution are shown in (Table 1).

2.3. Method

The distribution of landscape pattern can affect the production and transport of runoff and sediment [7]. NDVI, topography and distance from river system are important factors of the underlying surface [19,20,23]. Based on the vegetation coverage data and combined with the topographic characteristics of each pixel, VTF were constructed, including NDVI, slope and Eucdistance. The VTF is divided into 5 grades. VTLI was obtained by applying Fragstats4.2 to each VTF level. The correlation of each factor with sediment and runoff. The temporal of VTLI was obtained using the PLSR method. Finally, the spatio-temporal change trend of the VTF levels was analyzed. The specific process is shown in (Figure 2).

2.3.1. Vegetation-Terrain Factor (VTF)

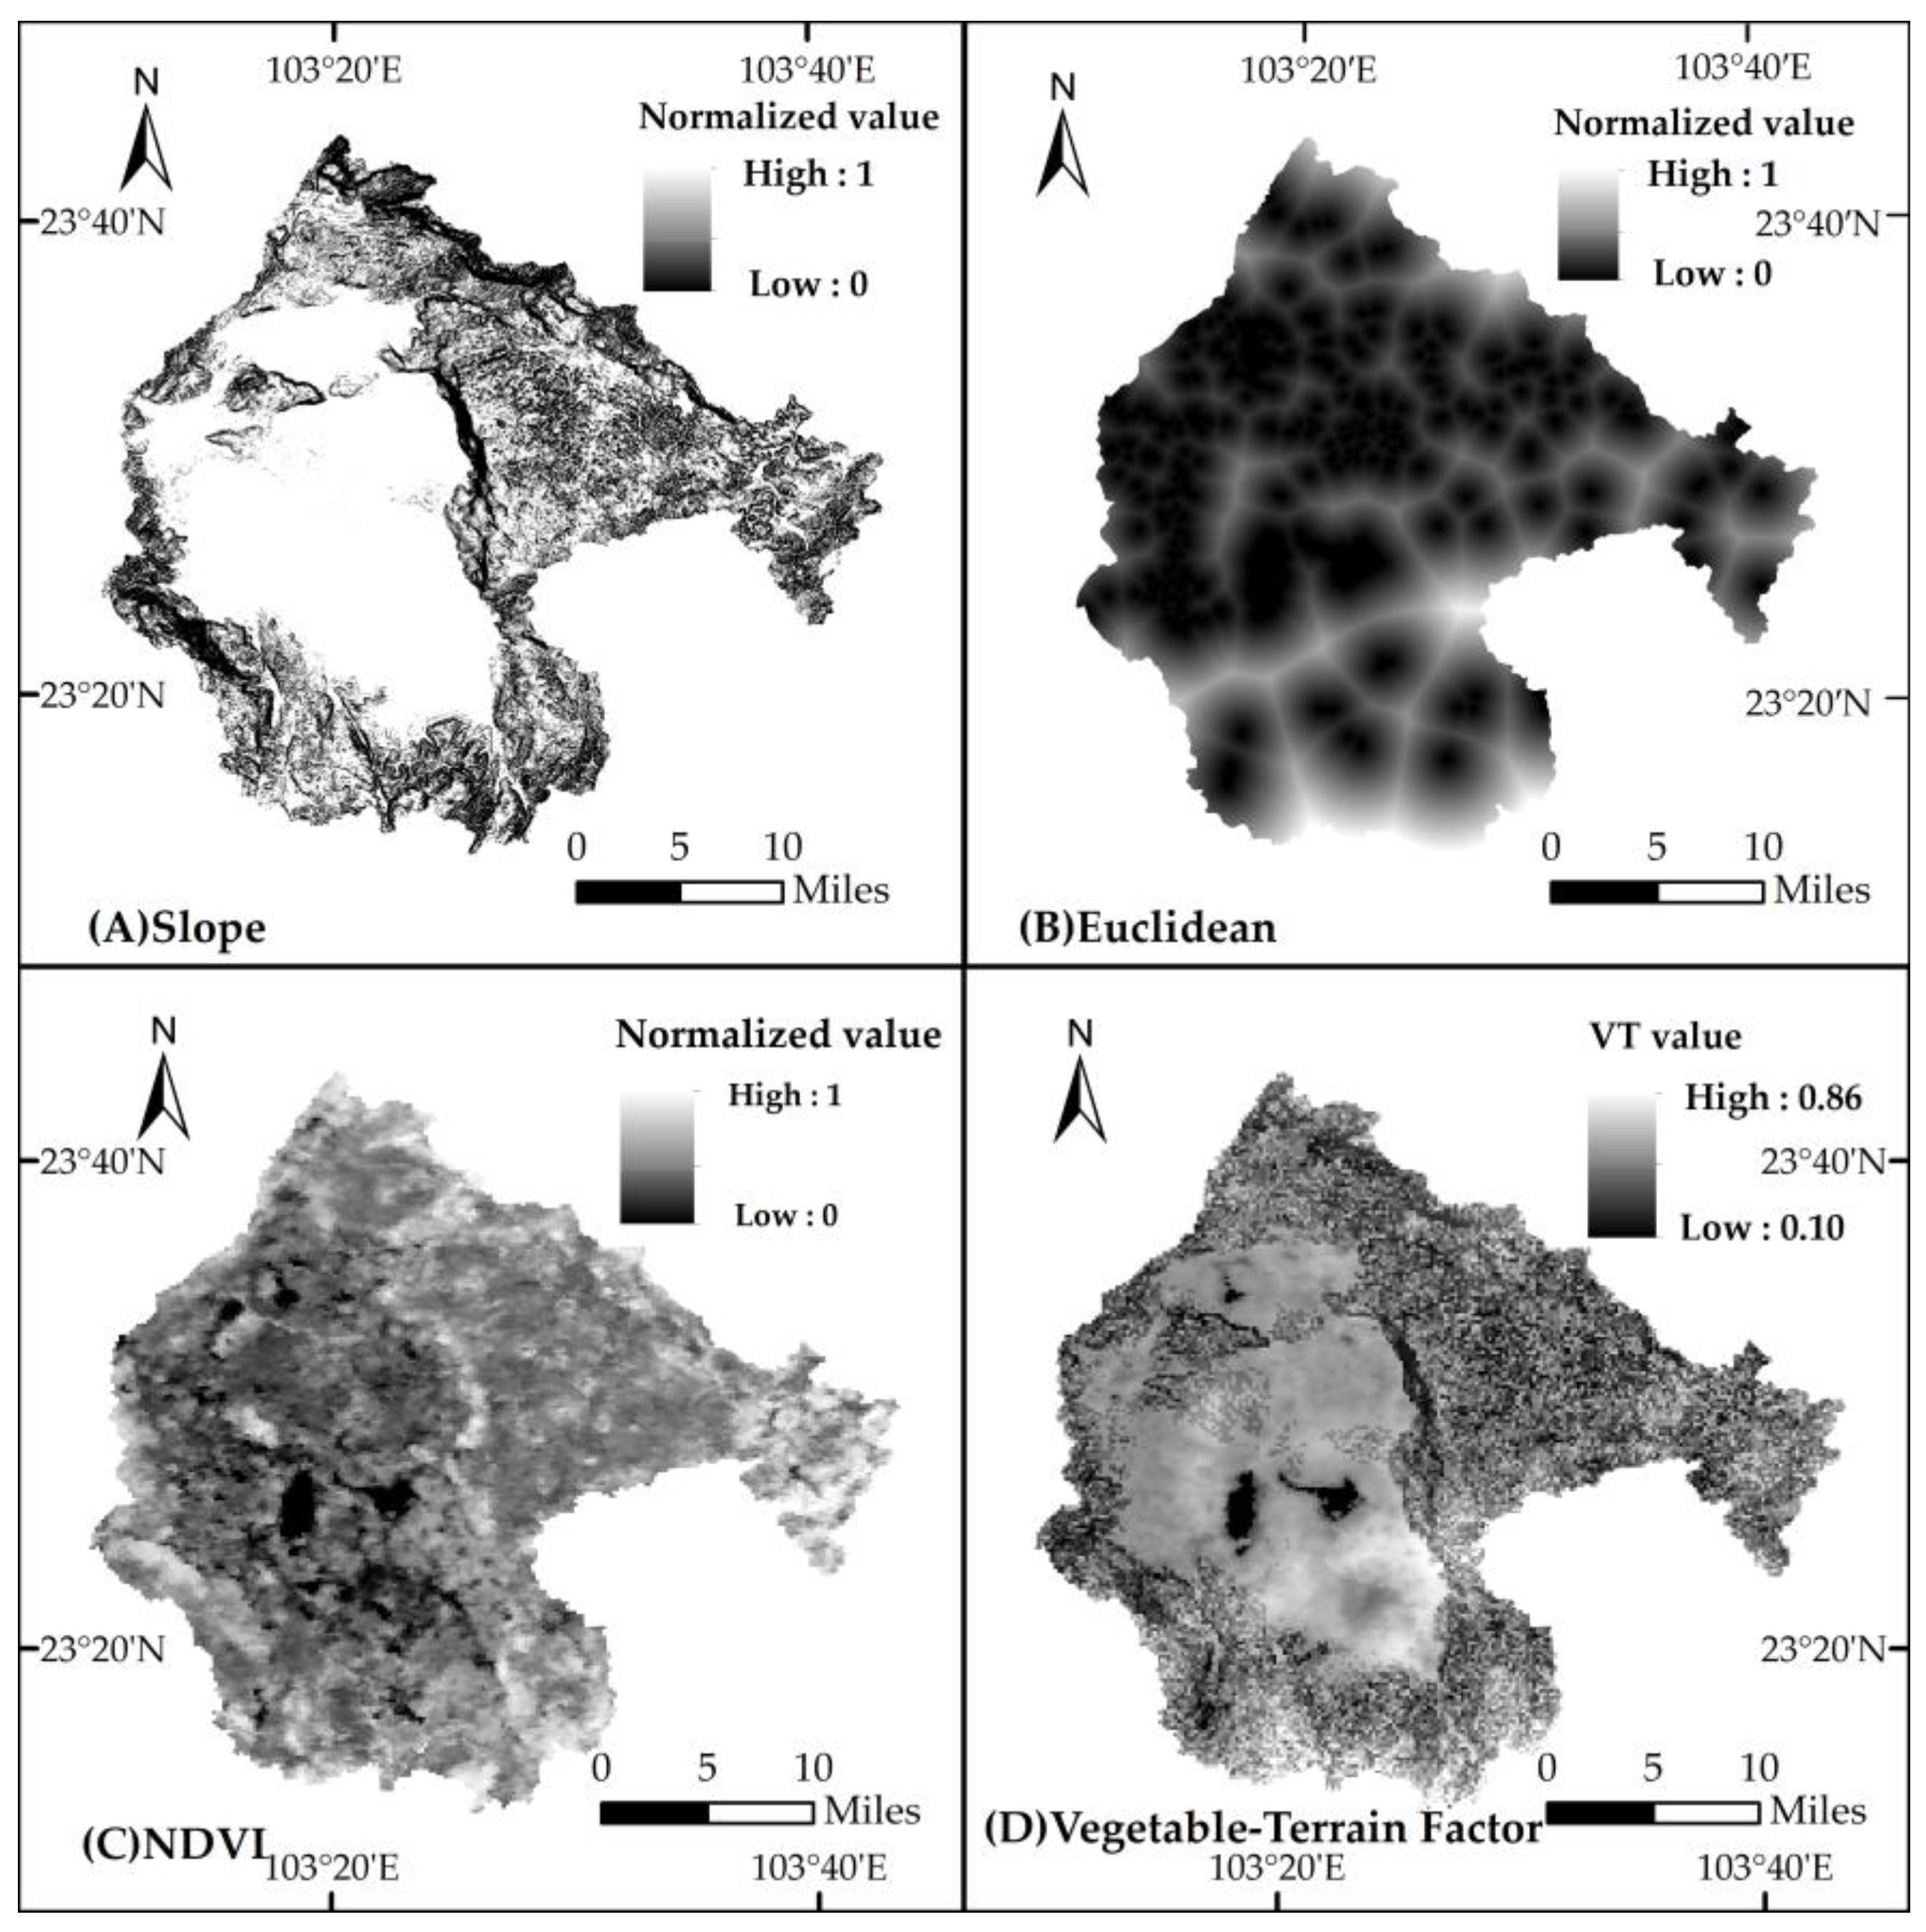
A total of 228 NDVI images per month from 2000 to 2018 were standardized. DEM elevation images were used to extract, standardize, reverse order, and reclassify the information. In the spatial analysis module, a few surface water bodies in NURS were adopted as the reference center. Then, the distance between each pixel in the basin and the reference center was calculated by Eucdistance. The value of each factor was limited to the range [0, 1] (Figure 3A–C). At the same time, it was assumed that the contribution of each factor to soil and water conservation ability was uniform, and the weight of each factor was set at 1:1:1. The VTF formula is as follows:
VTF = 1 3 NDVI + Slope + Eucdistance
VTF values obtained by ArcGISraster calculator are shown in (Table 2 and Figure 3D). The calculated VTF values range from 0.1 to 0.86, with 5 grades from 0 to 1 and an interval of 0.2. VTF1 corresponds to very low soil and water conservation capacity; VTF2, VTF3, and VTF4 are low, medium and high soil and water conservation capacity, respectively; and VTF5 is very high soil and water conservation capacity.

2.3.2. Vegetation Terrain Landscape Index (VTLI)

Landscape pattern, also known as landscape structure, mainly includes the number, type, configuration, and distribution of landscape units. Landscape index is an important parameter to describe landscape pattern quantitatively and effectively. It can reflect the spatial form and composition characteristics of landscape pattern and has highly concentrated landscape pattern information [32].
FRASTATS 4.2 is a software program for calculating multiple landscape indices and revealing the patterns of the types of distribution. The earliest version was published in 1995 in the USDA Forest Service Technical Report by Mac Garigal and Barbara Marks at Oregon State University [33]. In this study, in order to use the vegetation–topographic landscape index to reflect the change in water and sediment content, the landscape index was selected as follows (Table 3).

2.3.3. Pearson Correlation

Pearson correlation method can determine the quantitative relationship between runoff, sediment yield and landscape pattern. The correlation coefficient can reflect the degree of correlation between two groups of variables.

2.3.4. PLSR

Partial least squares regression (PLSR) is used to analyze multiple independent variables with high autocorrelation and noise. The method integrates principal component analysis, correlation analysis and multiple linear analysis. It is suitable for regression modeling with multiple linear correlation conditions, and it can include all independent variables to distinguish system information from noise. In this study, runoff and sediment discharge were adopted as the dependent variables, and the vegetation topographic landscape index was adopted as the independent variable.
Q 2 CUM = 1.0 Π ( i = 1 n ( Ρ i q i ) 2 / i = 1 n ( p i q i ) 2 ) k      k = ( 1 ,   2 ,…,   m )
Pi is the predicted runoff or sediment yield of analysis samples, and qi and pi are the measured and predicted runoff or sediment yield amounts, respectively. Q2cum is the principal component accumulation model prediction ability, m is the PLSR principal component quantity, and n is the number of samples.

2.3.5. Trend Analysis

Unitary linear regression analysis can reflect the overall spatial variation law and spatio-temporal pattern of regional VTF through the variation characteristics of a single pixel. The linear regression slope between annual average VTF and time indicates the trend direction and magnitude of VTF change. The formula is as follows:
S = n i = 1 n i × V T F i i = 1 n i × i = 1 n V T F i n i = 1 n i 2 i = 1 n i 2
In the above formula, VTFi is the average value of VTF in year i, S is the slope of the pixel regression equation, and n is the time length. When S > 0, the VTF of the pixel is increasing. When S = 0, it indicates that the VTF of the pixel is basically unchanged. When S < 0, the VTF of the pixel is decreasing.
The Hurst index reflects the autocorrelation of time series, especially the hidden long-term trend in the series, which is called long-term memory in statistics. The relationship between this index and the trend is as follows (set Hurst Index as H):
H = 0.5: The time series is approximately a random walk (Brownian motion).
H < 0.5: Indicates the increased possibility of time series reversal (unsustainable), the mean value reversion process.
0.5 < H < 1: Indicates that the trend of time series keeps increasing (sustainable), which implies a time series of long-term memories.

3. Results

3.1. VTLI Correlation Analysis

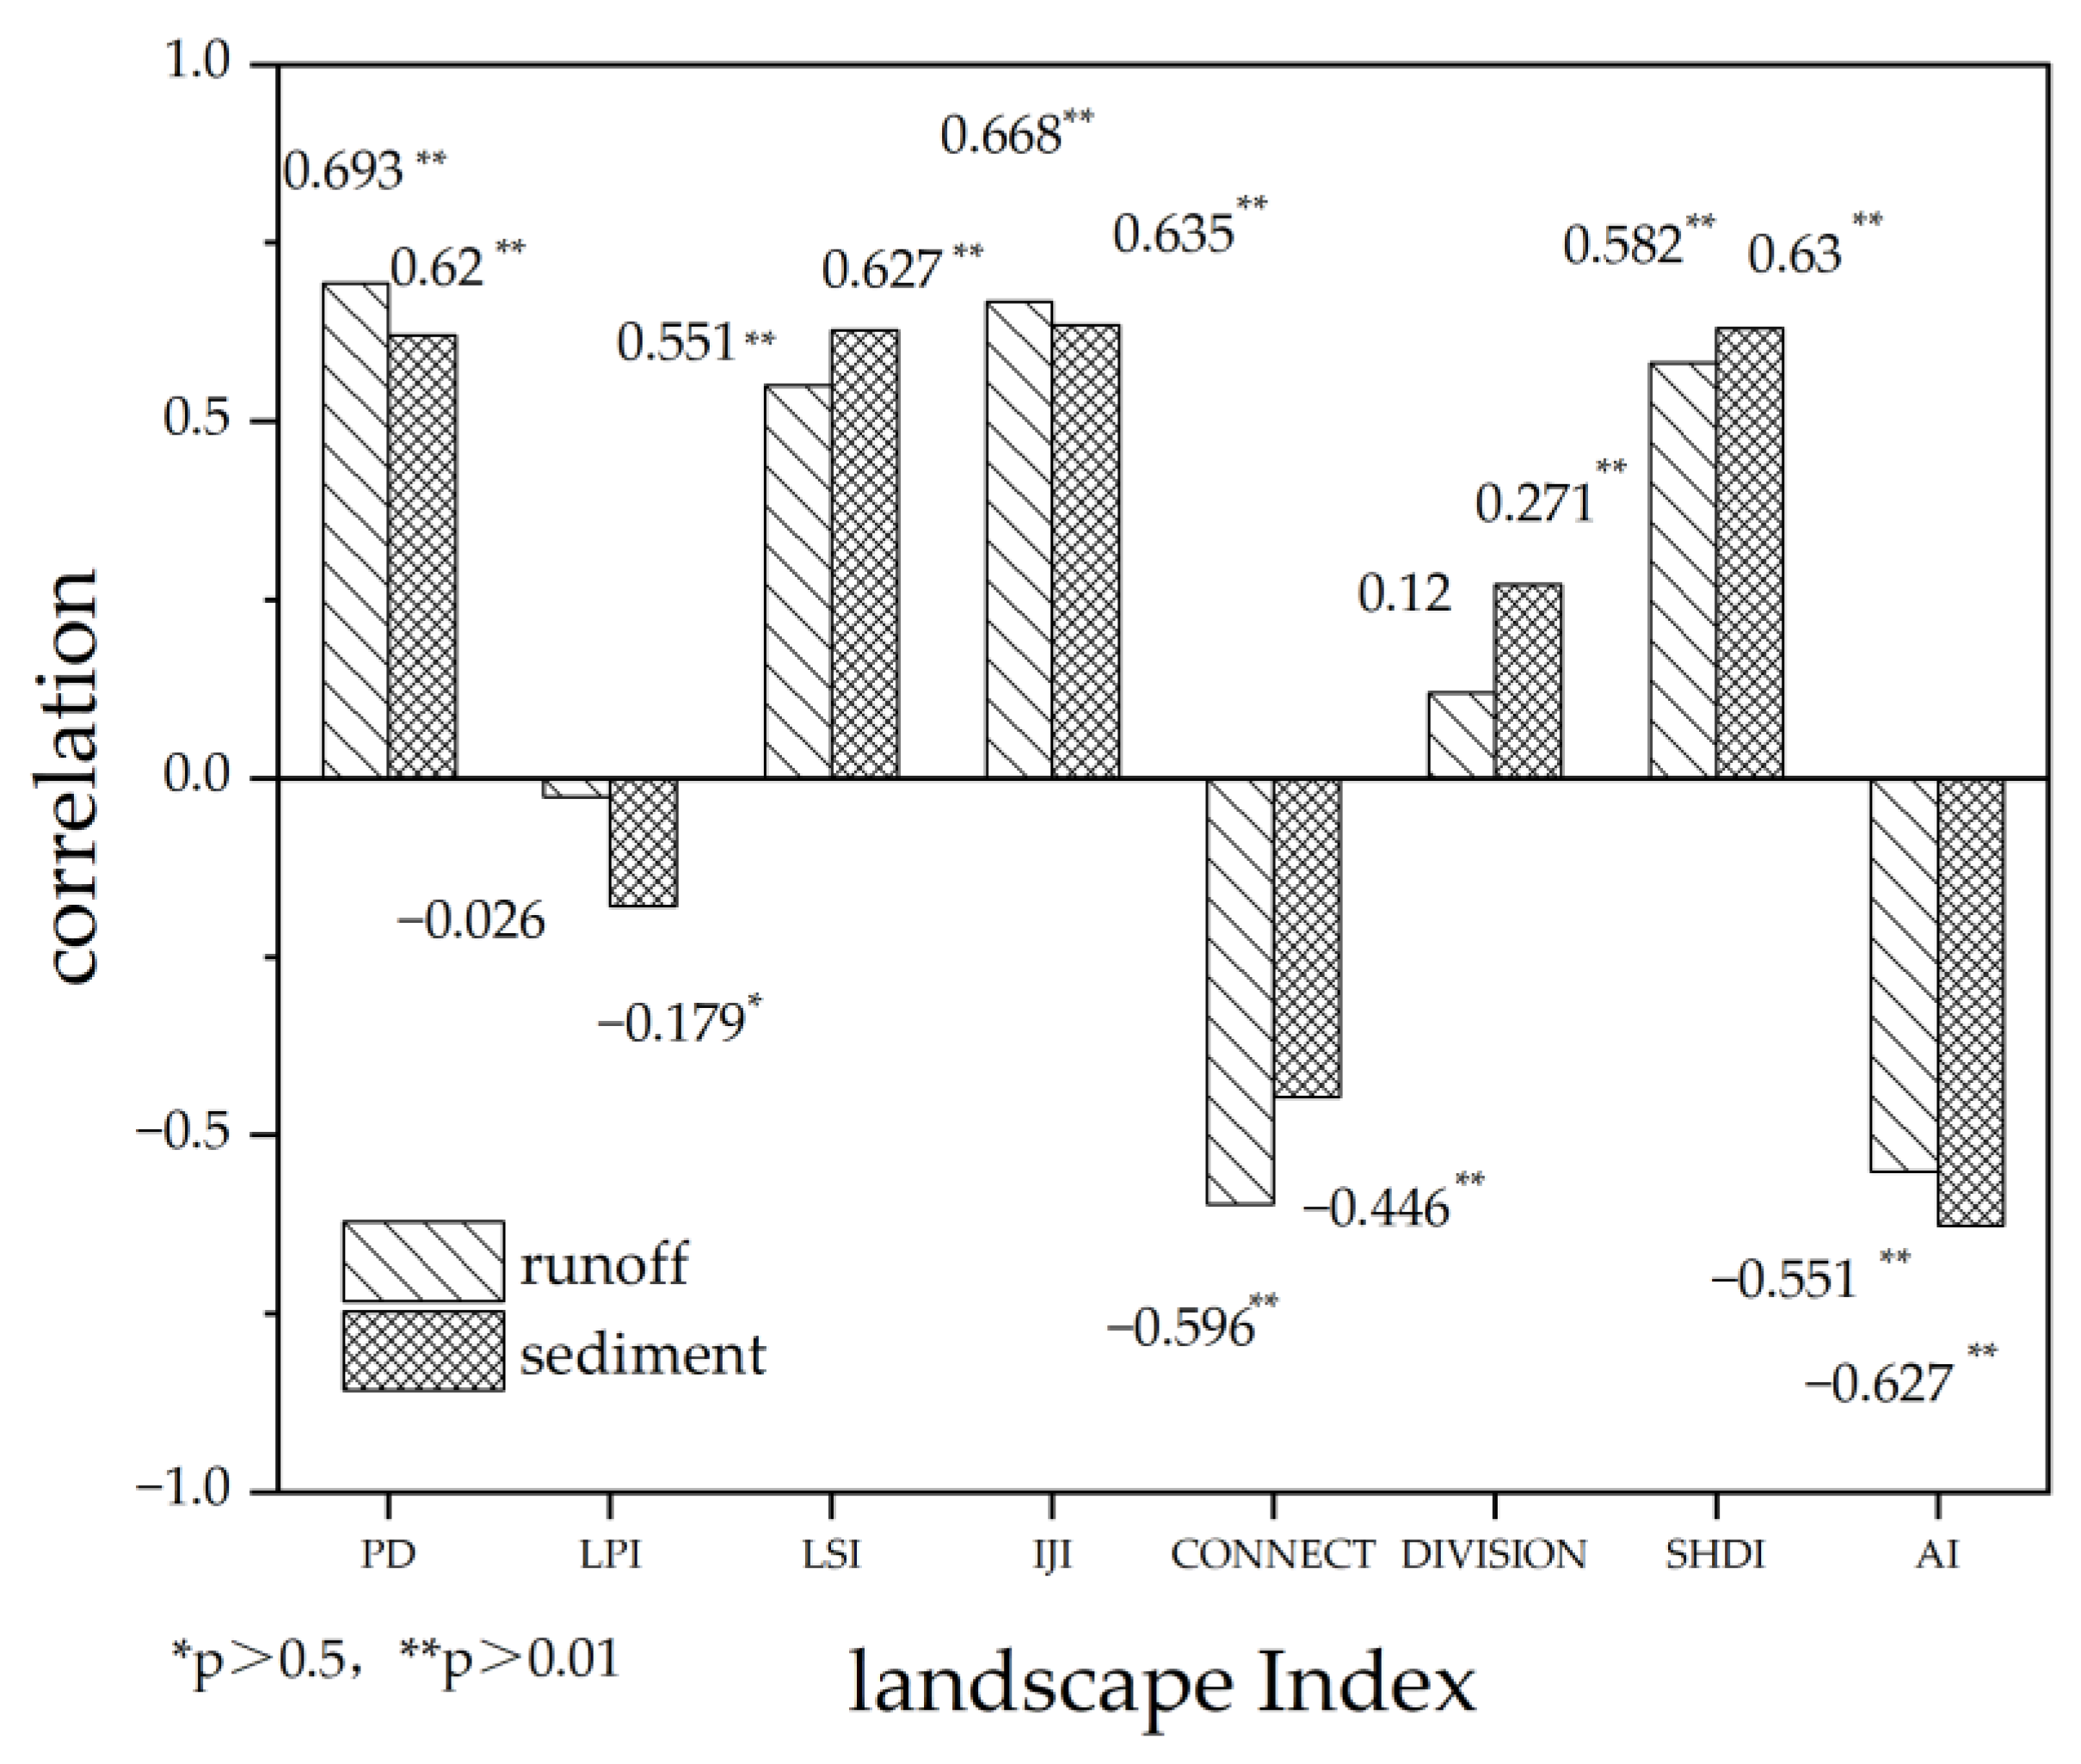
The Pearson correlation analysis results show (Figure 4) that PD, LSI, IJI, DIVISION and SHDI are positively correlated with runoff and sediment yield, while LPI, CONNECT and AI are negatively correlated with them. LPI and DIVISION have no significant correlation with runoff, and LPI has a significant correlation with sediment yield. The other indices were extremely significantly correlated with runoff and sediment yield. The correlation coefficients of PD, IJI and SHEI with runoff were 0.693, 0.688, and 0.592, respectively. IJI, SHDI, LSI and PD had the highest positive correlation with sediment transport, and the correlation coefficients were 0.635, 0.634, 0.627 and 0.620, respectively. The negative correlation coefficients of CONNECT with runoff and sediment were −0.596 and −0.551. The correlation coefficients of runoff and sediment yield with AI were −0.446 and −0.627, respectively.

3.2. VTLI Changes

The PLSR model of VTLI in NURS from 2000 to 2018 is shown in (Table 4). The PLSR model has a high explanatory power for runoff and sediment, with the explanatory power ranging from 0.514 to 0.809, which meets the research requirements.
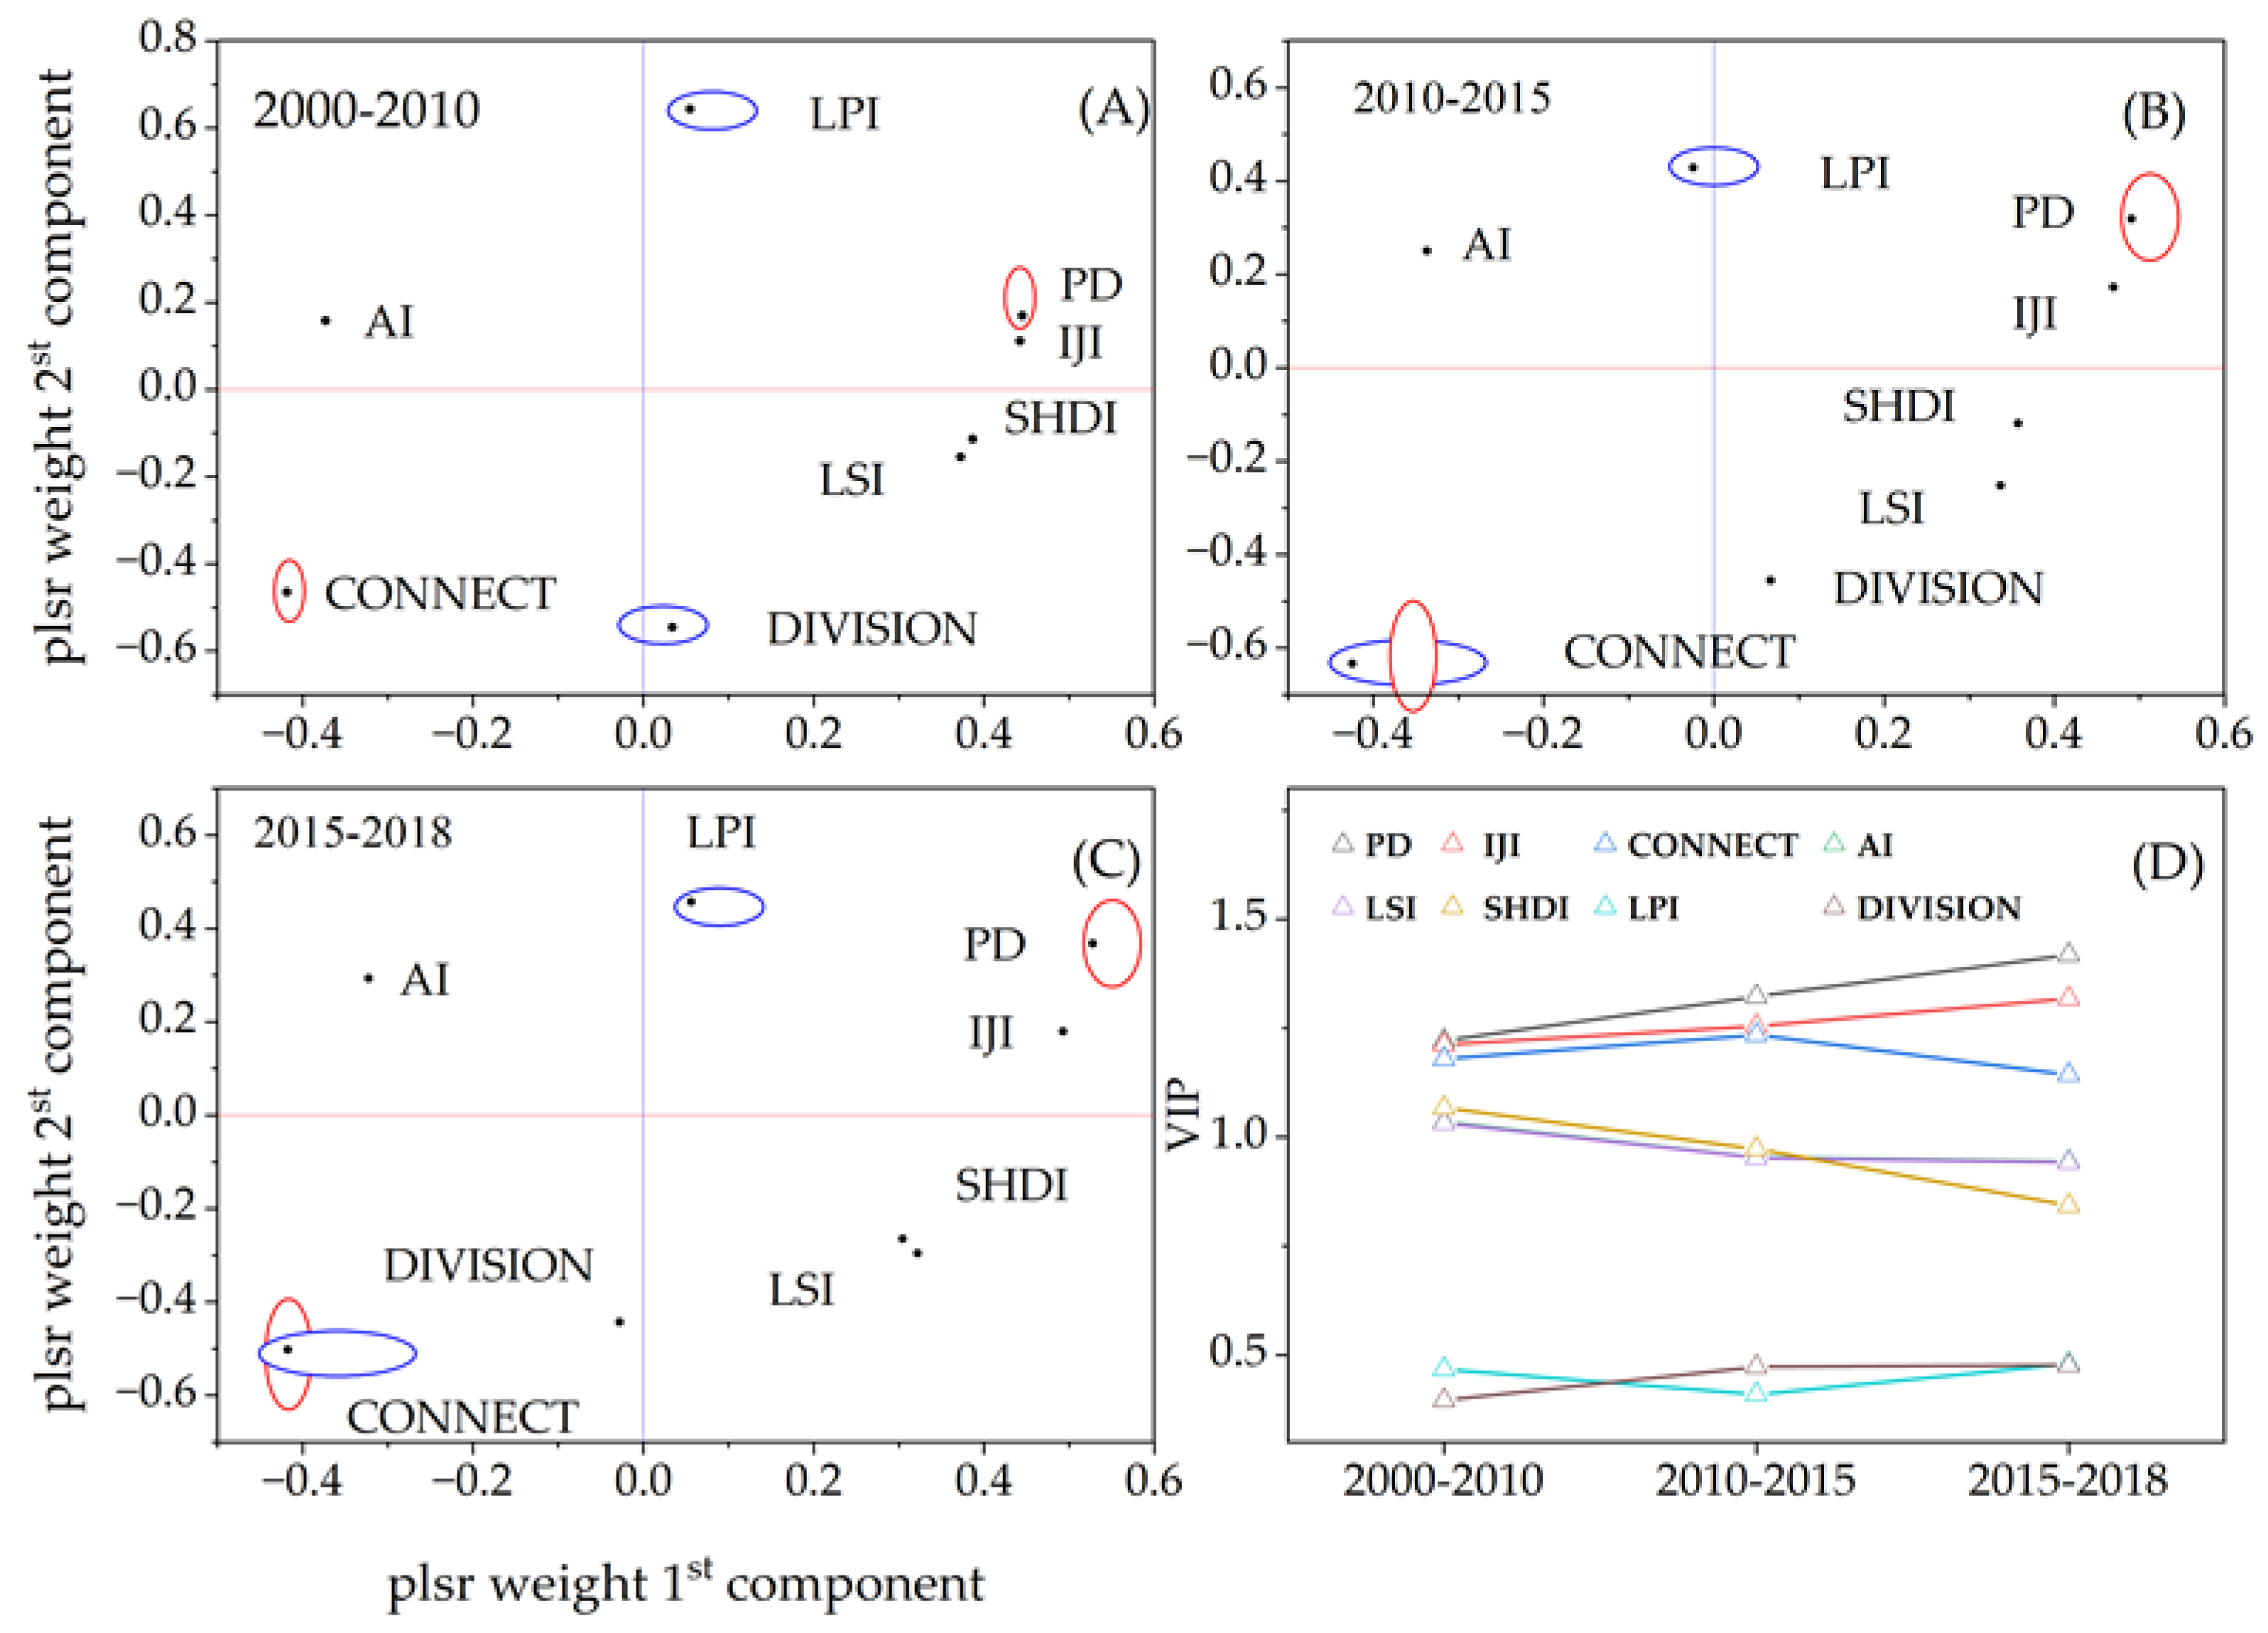
In the PLSR model, the first and second principal component landscape indices have the greatest explanatory power for runoff and sediment yield, as shown in the weight of runoff prediction by different VTLI values (Figure 5A–C). From 2000 to 2010, PD and CONNECT had a higher weight in the first principal component. PD body weight was dominant in positive values, while CONNECT was dominant in negative values.
LPI and DIVISION dominate the second principal component. LPI weights dominate in positive values, while DIVISION dominate in negative values. However, in 2010–2015 and 2015–2018, the negative value of the second principal component changed to CONNECT.The importance of projection variables (VIP) varied along with time (Figure 5D). PD and IJI increased gradually, while SHDI decreased. CONNECT and LSI fluctuated, while LPI and DIVISION remained at a low level.
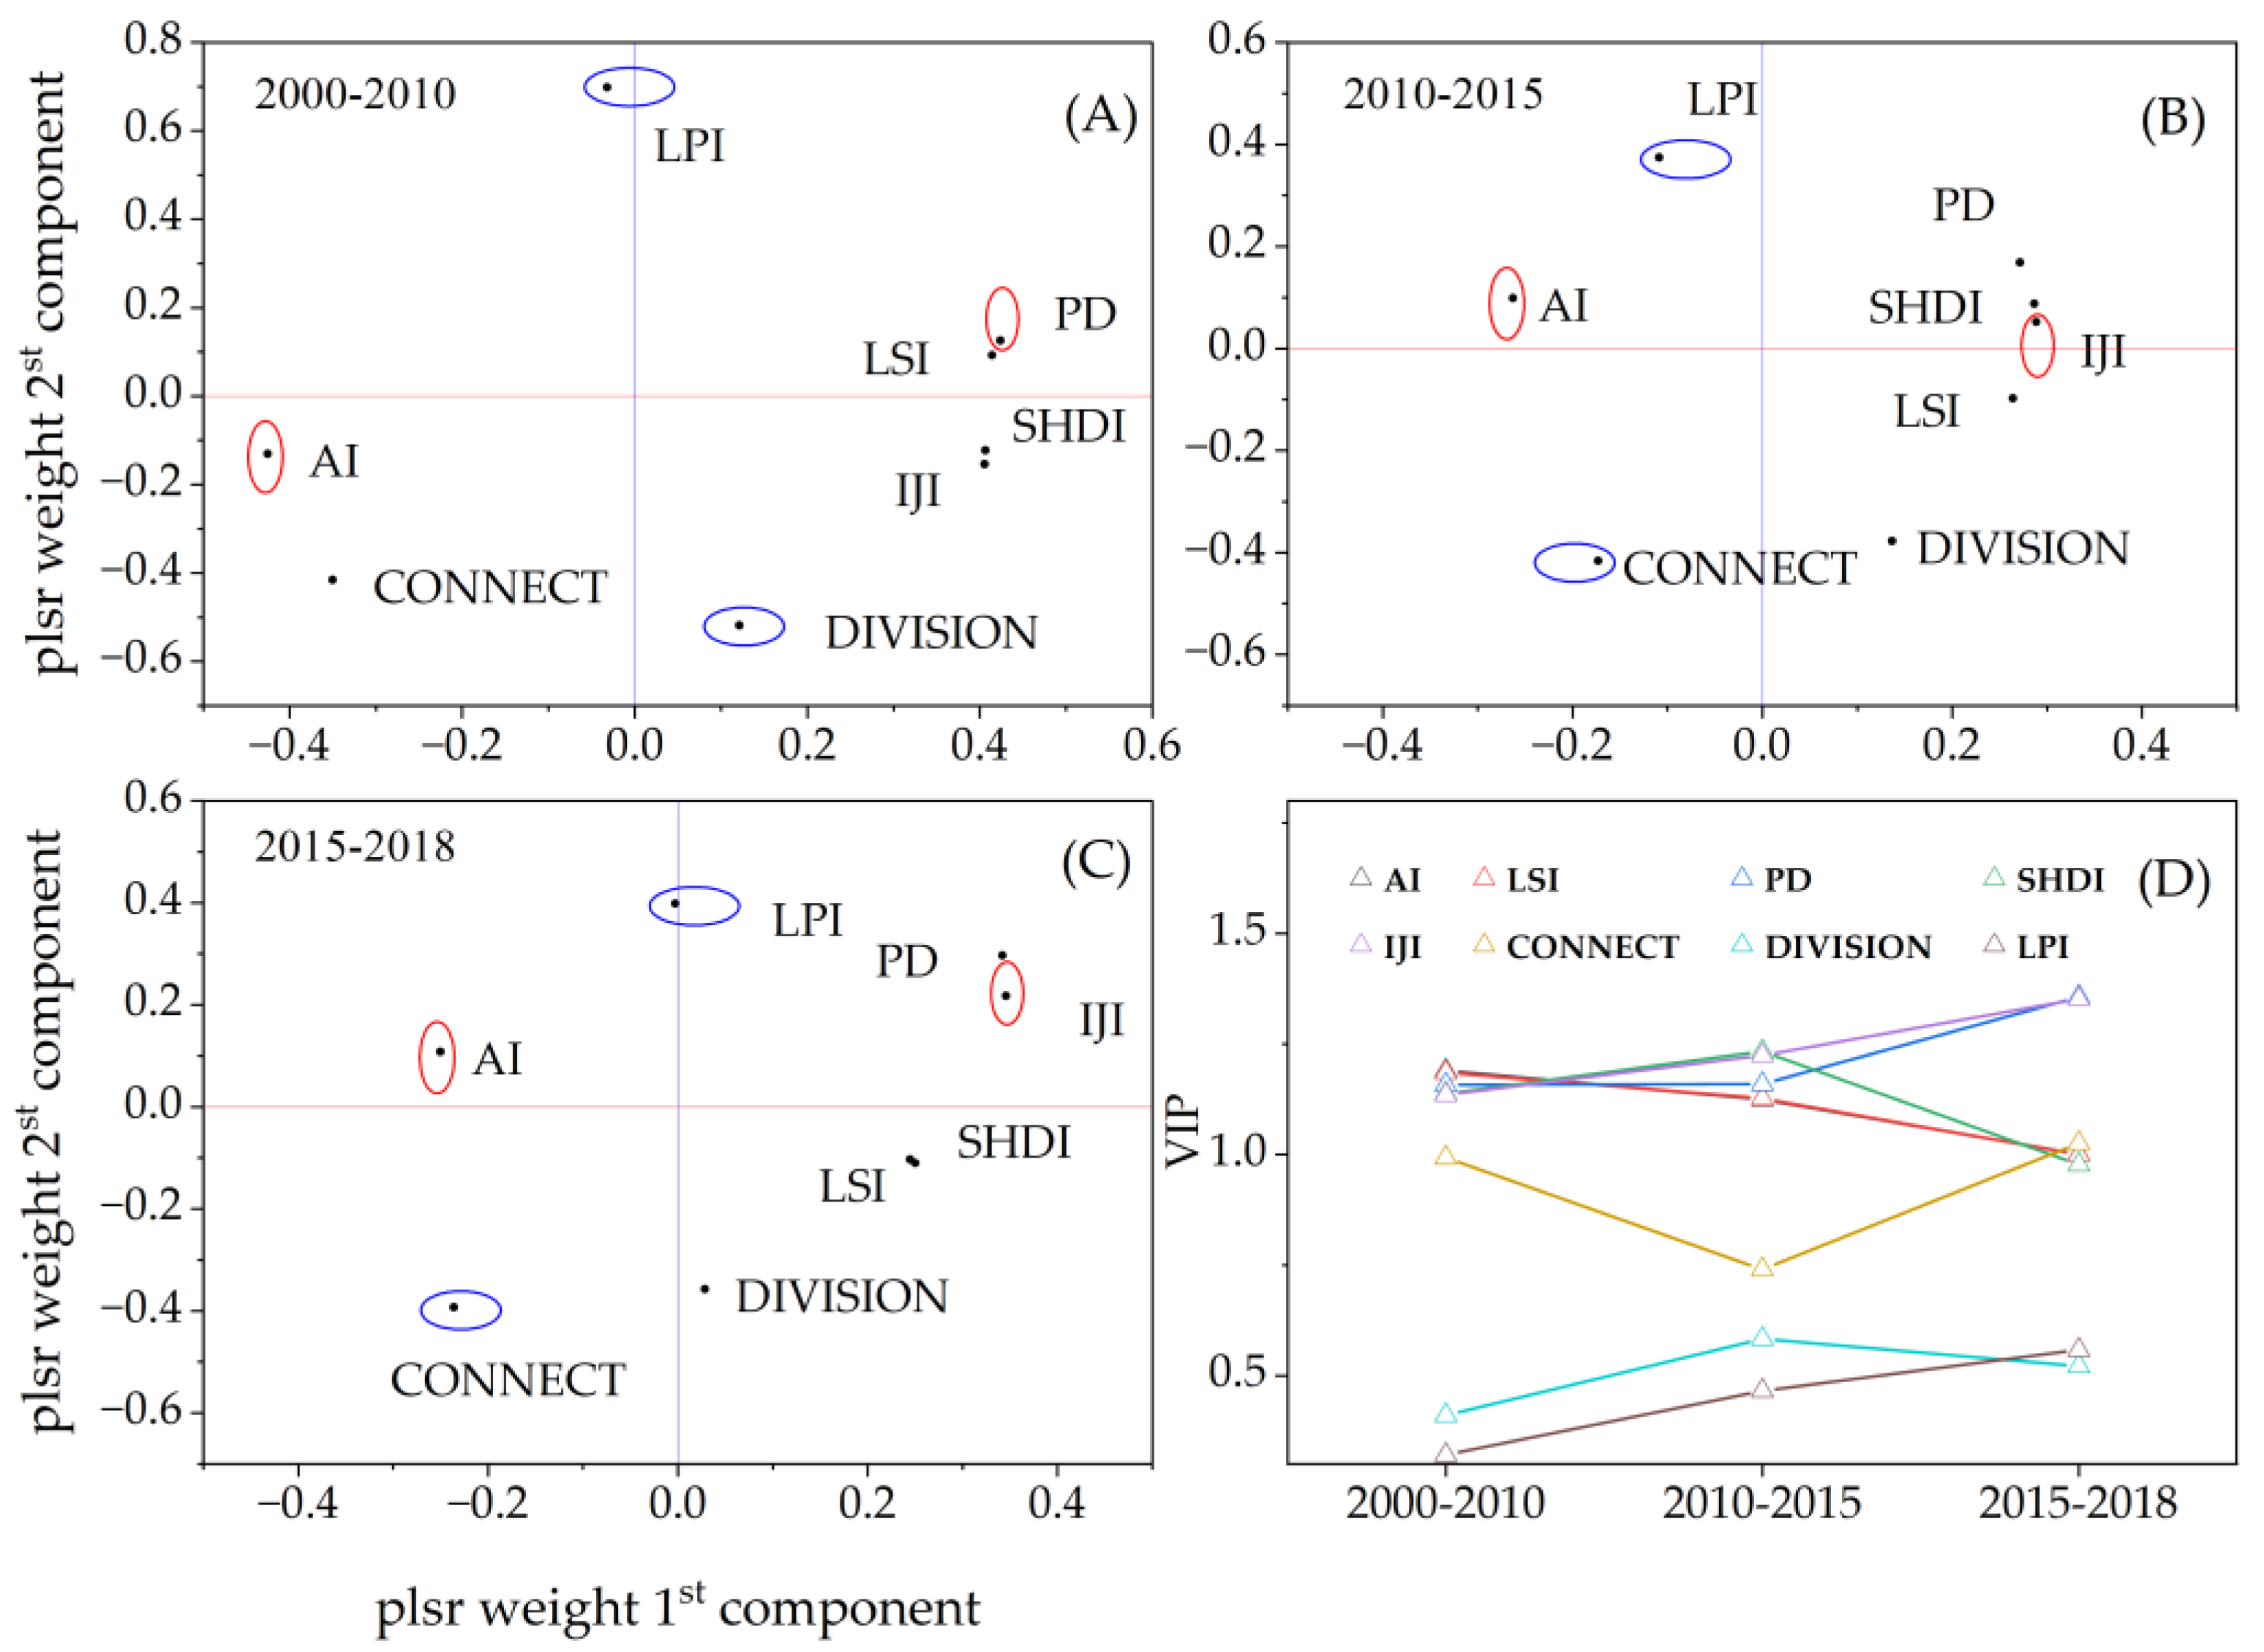
The predicted weight of each VTLI on sediment (Figure 6A–C) shows that the PD and AI in the first principal component were larger in 2000–2010. PD was dominant on the positive values, while AI was dominant on the negative values. LPI and DIVISION dominate the second principal component. LPI weight is dominant on the positive values, while DIVISION weight is dominant on the negative values. However, in 2010–2015 and 2015–2018, the positive values of the first principal component became IJI, and the negative values of the second principal component became CONNECT. The VIP in sediment are more complex than the runoff from the importance projection (Figure 6D). IJI and PD gradually transferred into the most important factors, while AI, SHDI and LSI gradually decreased. CONNECT factors fluctuated greatly, and the change trend decreased and then increased. Although DIVISION and LPI were at low levels, they increased significantly.

3.3. Spatio-Temporal Changes in VTF

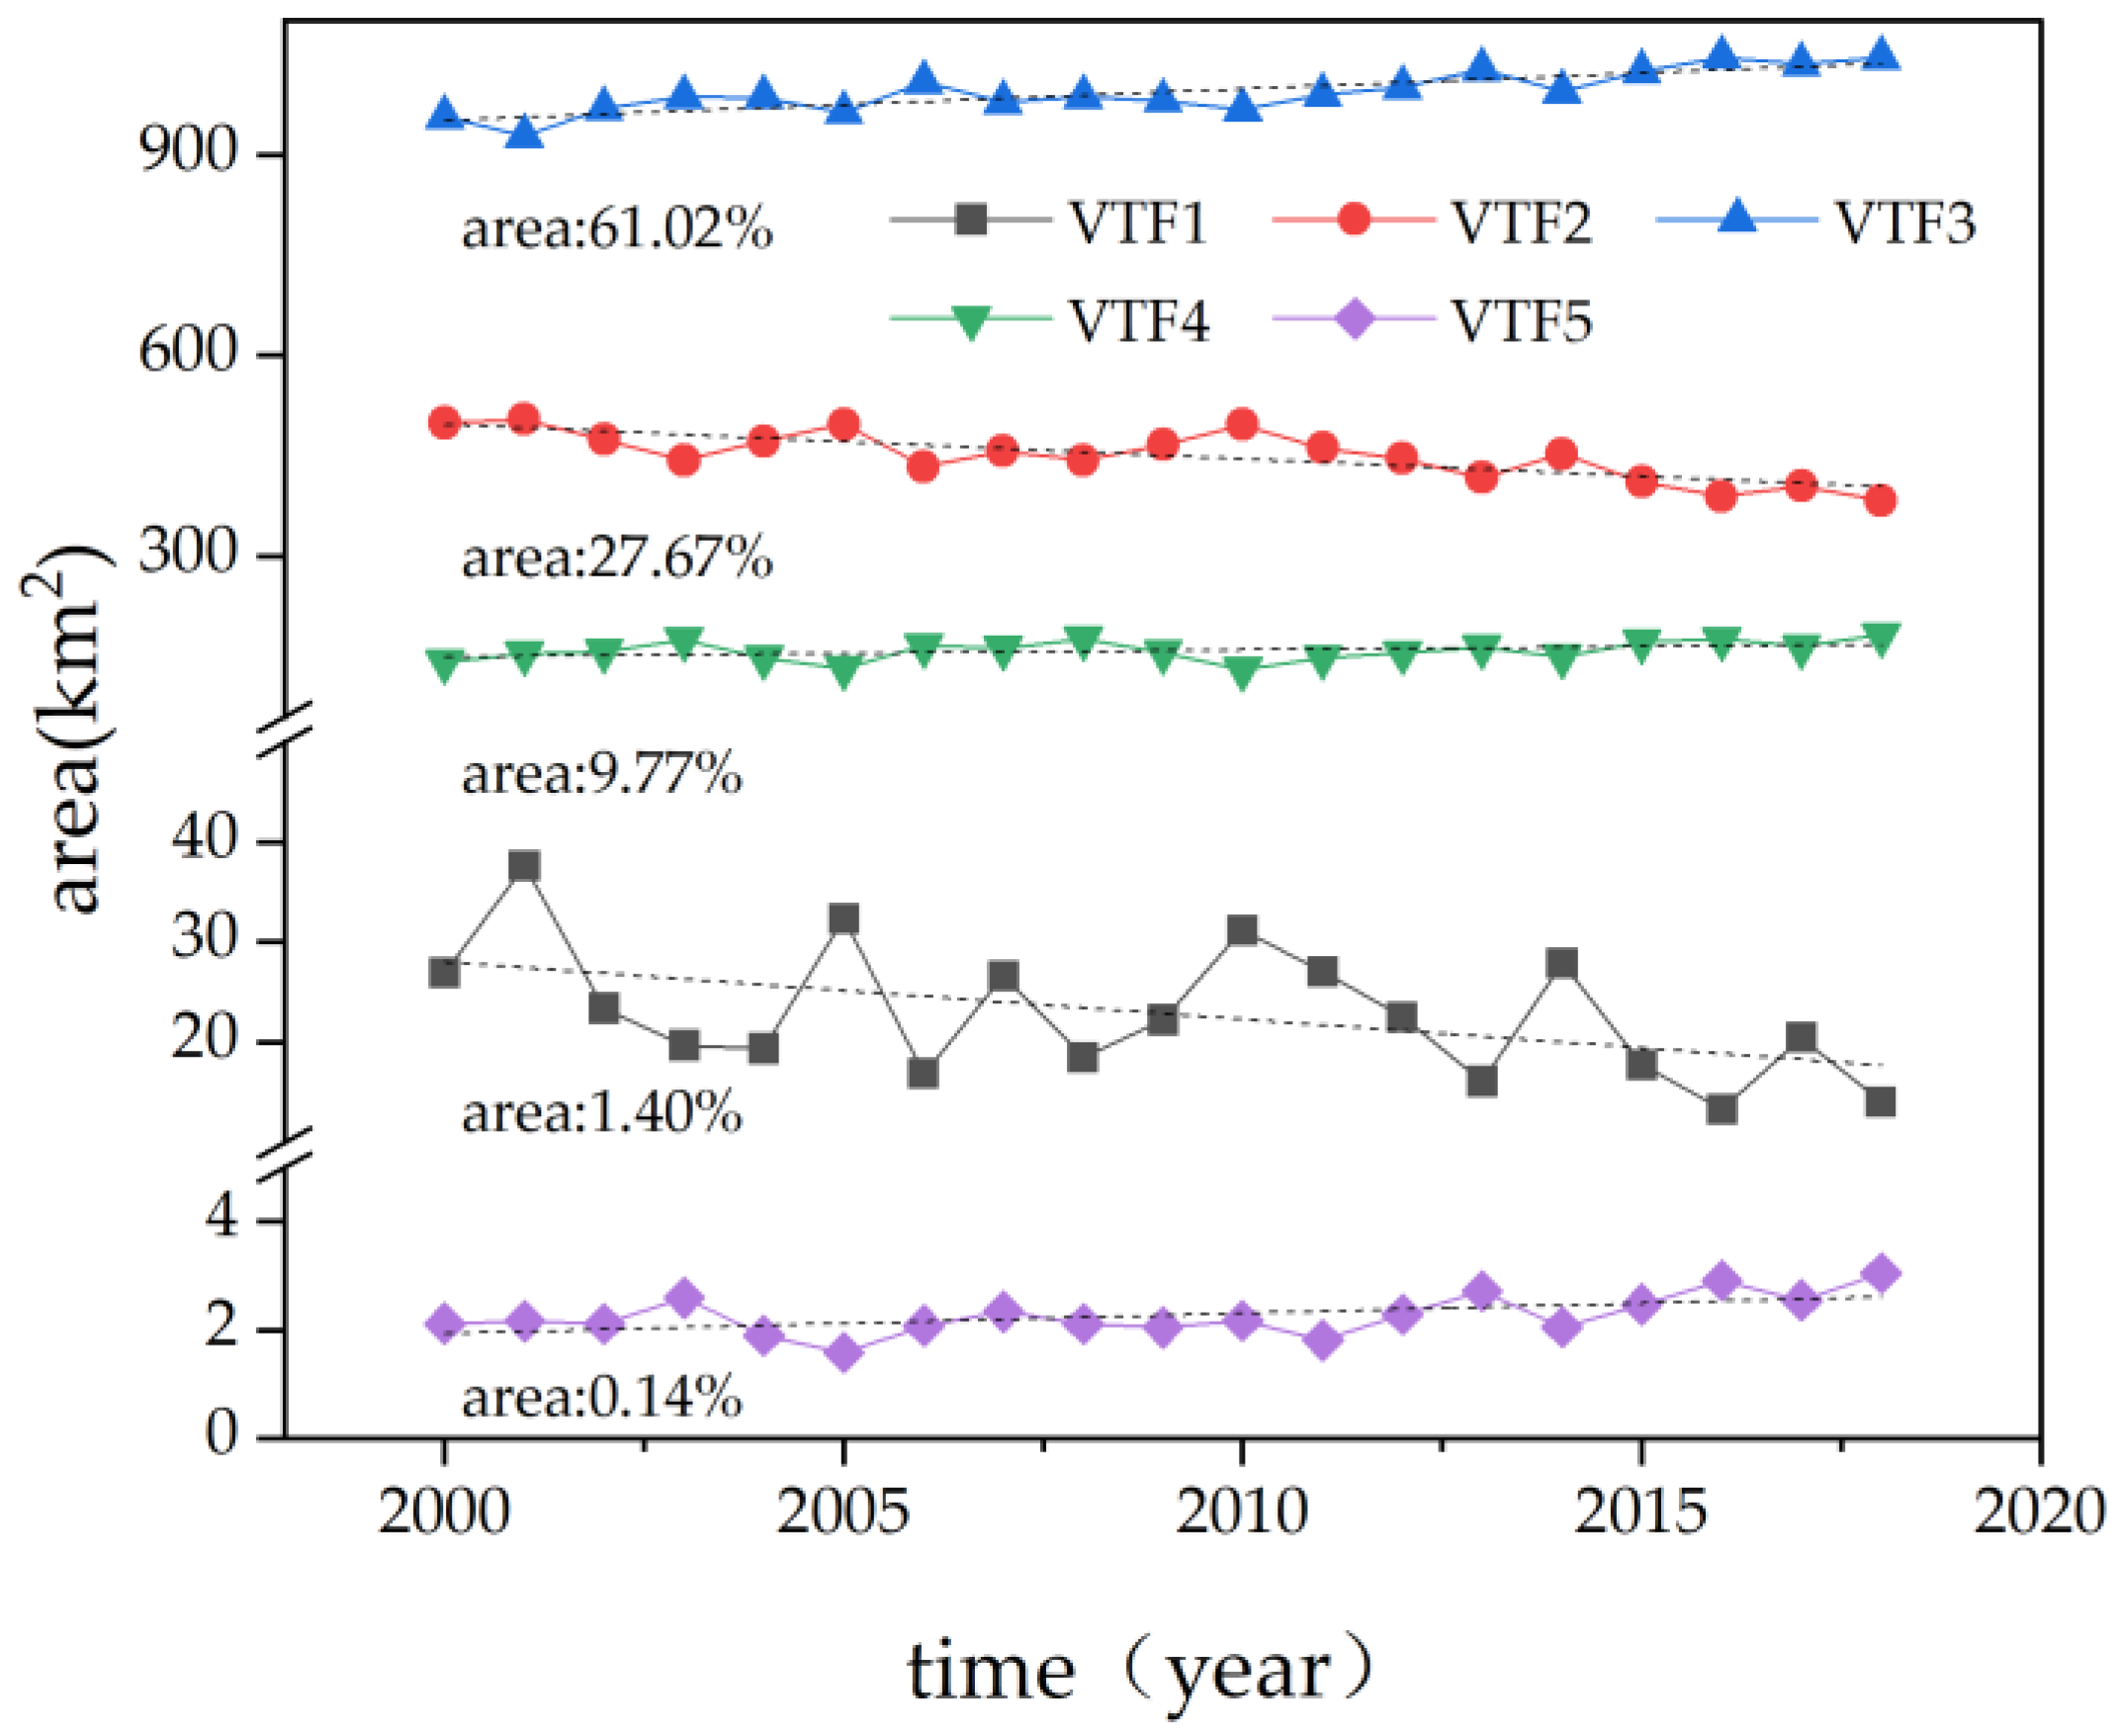
The annual statistical results of VTF are shown in (Figure 7). Medium and higher VTF (VTF2, VTF3 and VTF4) values were the dominant in NURS. The average area proportion of medium factor VTF3 was 61.02% with an upward trend. Higher and extreme values for VTF4 and VTF5 accounted for a relatively low area proportion with an average area proportion of 9.77% and 0.14%, respectively, which also had an upward trend, while low value factors VTF1 and VTF2 area proportions were 1.40% and 27.67% with a slightly downward trend.
The spatial distribution of VTF from 2000 to 2015 is shown in (Figure 8). The regions with low soil and water conservation ability (VTF1 and VTF2) account for 15.5%, while those with medium soil and water conservation ability (VTF3) account for 48.3%. The areas with strong soil and water conservation ability (VTF4 and VTF5) accounted for 36.2%. Therefore, more than 85 percent of the areas have medium and high water and soil conservation capacity. From different levels of VTF spatial distribution, the basin is mainly dominated by VTF3 and VTF4, which is mainly due to the large amount of flat arable land. In the mountain areas of the NURS, VTF2 and VTF3 had a staggered distribution due to relatively fragmented vegetation patches and the small amount of VTF1 found in the adjacent peak-cluster depression area. Meanwhile, the high soil and water conservation capacity factor VTF5 appeared in the southern mountainous area.
The spatial distribution according to the trend test value is shown in (Figure 9). VTF values significantly increased in the southern and northwestern regions of NURS, especially in the basin mountain ecotone at the edge of the basin. The VTF value changes little or without a significant increase in most mountain and basin central areas. In the south-central southern parts of the basin where Mengzi City is located, the VTF value has a significant downward trend due to the urban expansion in recent years.
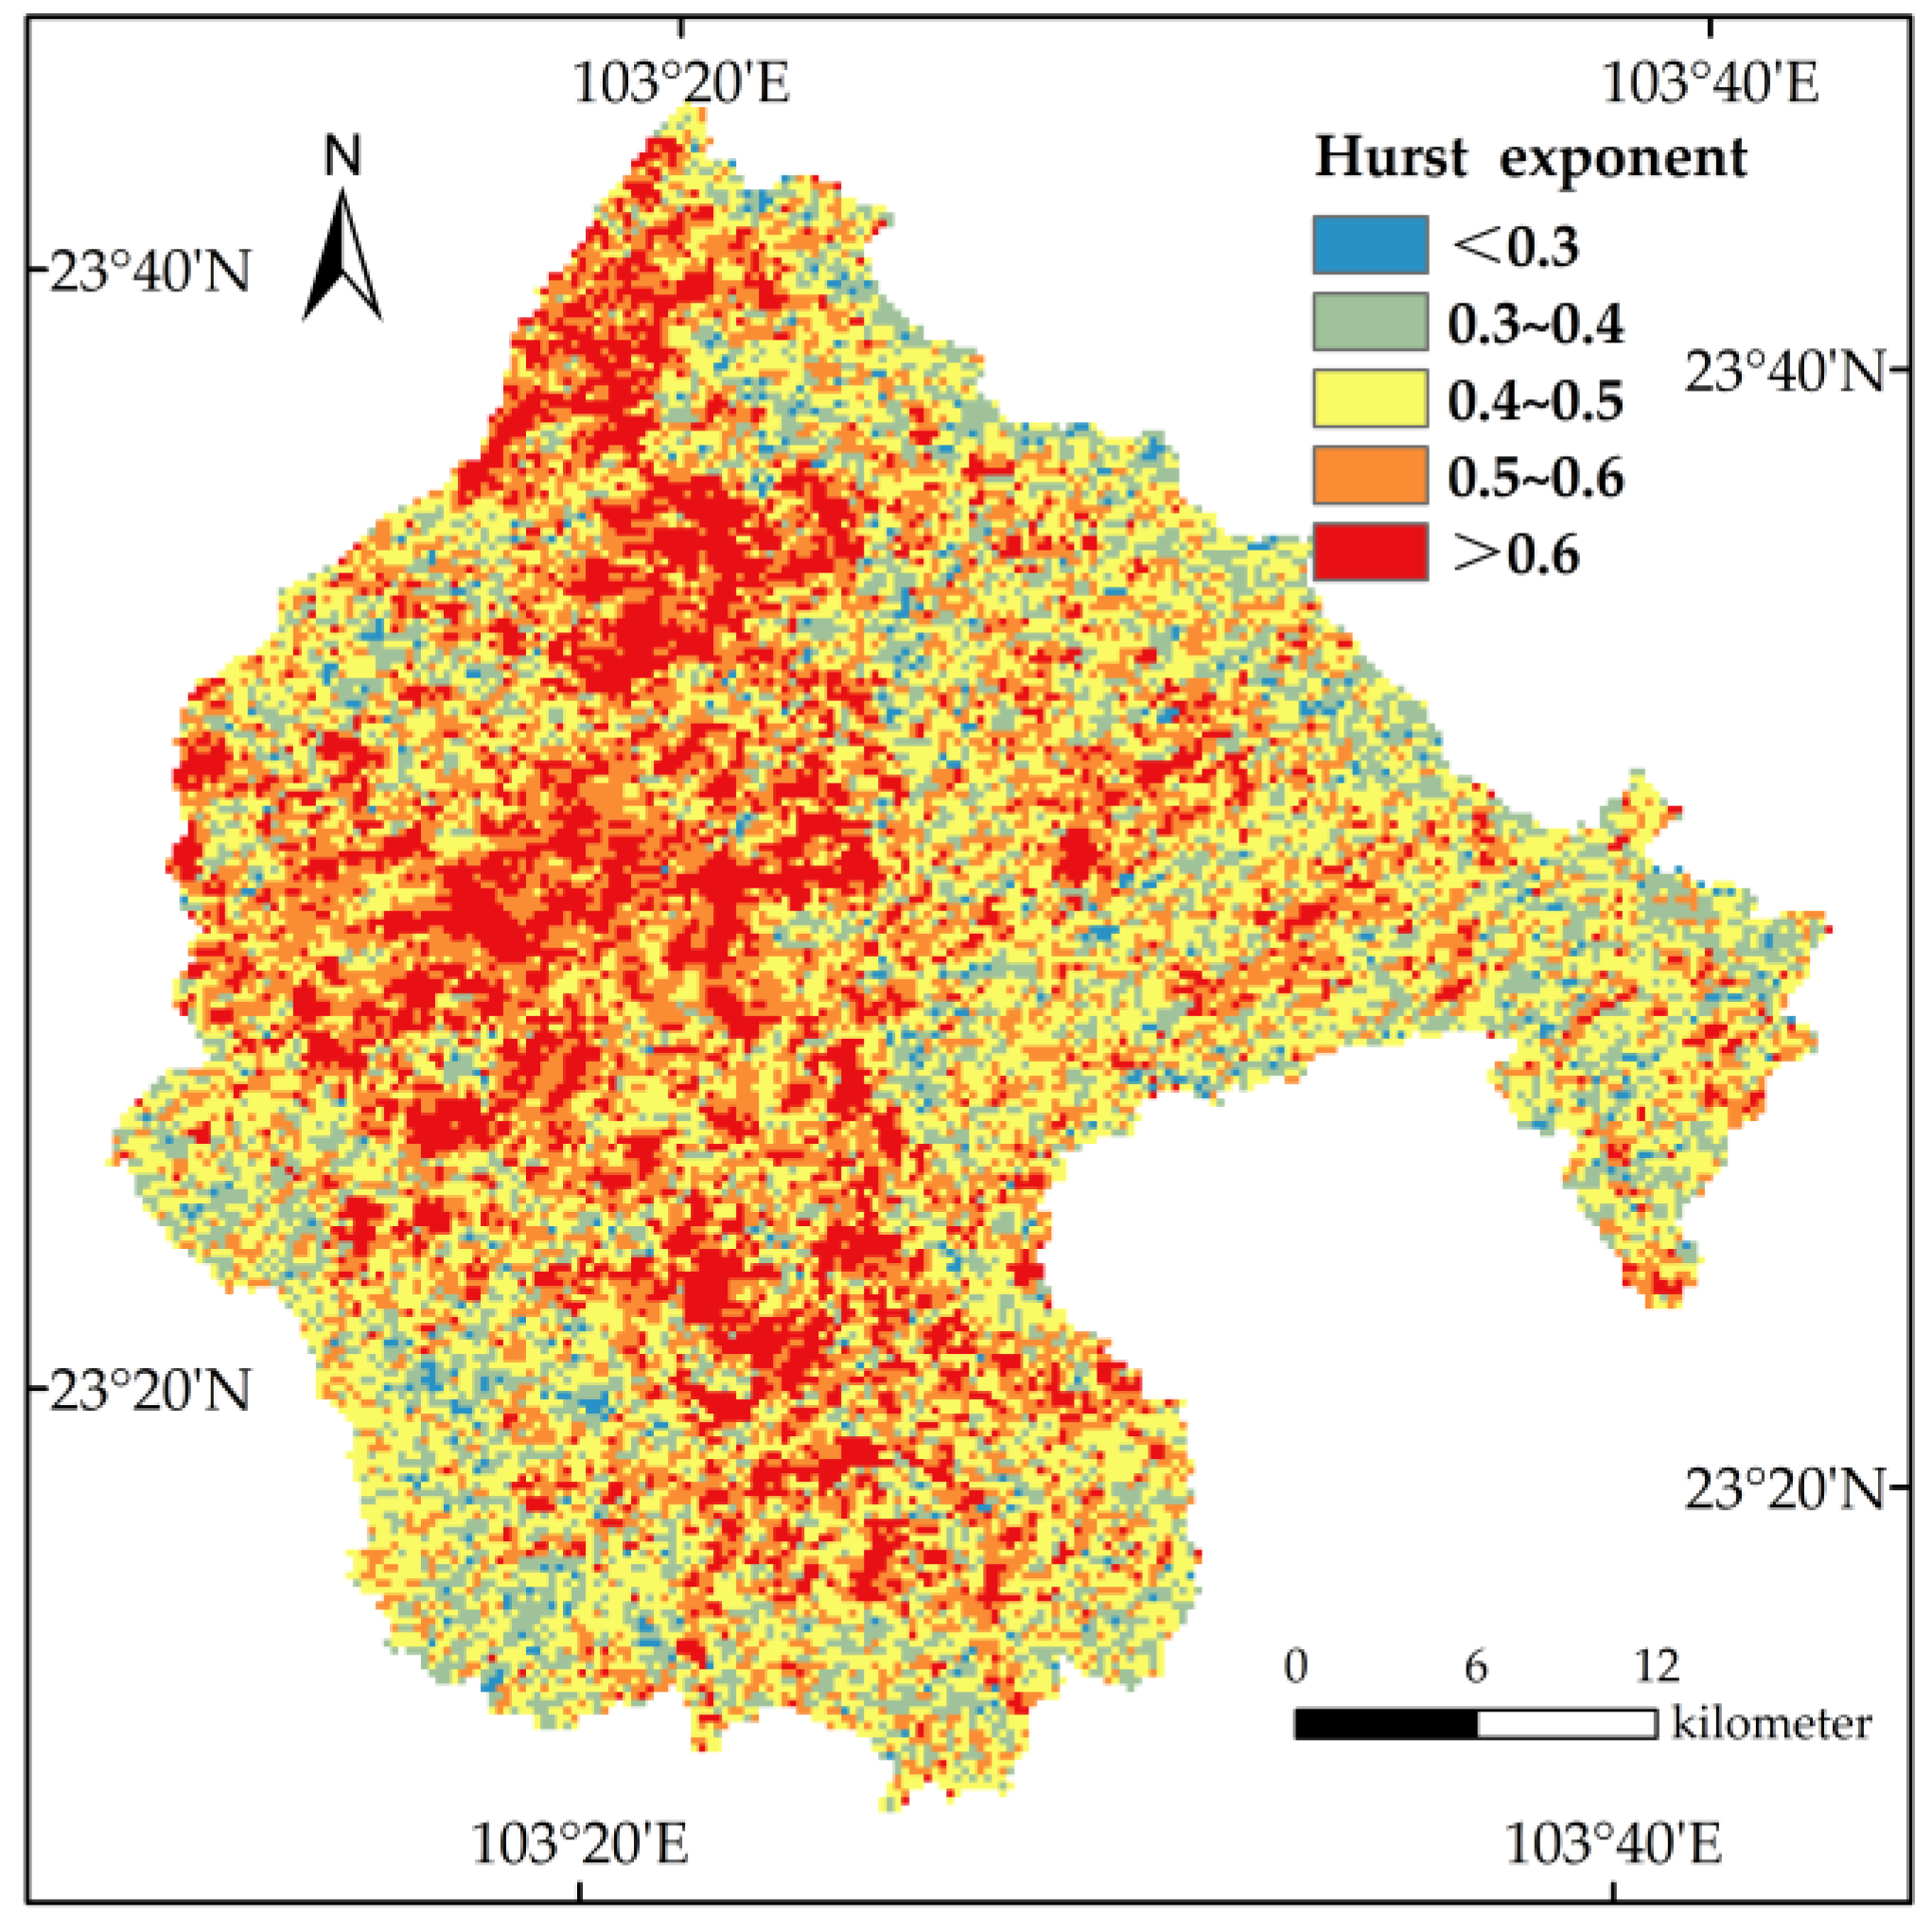
The mean Hurst value from the VTF trend is 0.49, indicating that the change in the VTF value in the future should be consistent with that in the past (Figure 10). The areas ratio with Hurst values less than 0.3 and 0.3–0.4 account for 1.83% and 17.11%, respectively, and are mainly distributed in the mountainous areas around the basin. VTF changes in these areas were sustained. The VTF values of these areas are relatively stable or had no significant increasing trend during the study period, indicating that the VTF trend of these areas may become worse in the future. The area ratios with Hurst values between 0.4–0.5 and 0.5–0.6 account for 35.47% and 28.05%; for the vast majority of NURS, the changes in these areas are stable. The trend of VTF values in these areas was not significant. The area proportion with a Hurst value greater than 0.6 is 17.54%, mainly concentrated in the interior of the basin and the southern basin mountain ecotone area; these areas show sustainability.
Trend analysis can identify three types of VTF changes over time: regressive, stable and restorative. With 0.5 as the boundary, Hurst analysis can analyze whether the change in VTF over time can continue in two cases. If we use ArcGISfor superposition analysis, we can judge whether the changes in VTF are sustainable, which can be divided into six types. The area distribution of these six changes in VTF is shown in Table 5. The recovery area is more than 50%, among which the sustainable recovery area is 31.05% and the unsustainable recovery area is 19.84%. The degradation area is less than 8%, the continuous degradation area is 2.48%, the degradation unsustainability is 5.09%, and the rest are stable regions.
The spatial distribution of these six changes in VTF is shown in (Figure 11). It can be seen that the restoration area is distributed in the basin and mountain transition zone and the southern mountain area, and the restoration is mainly sustainable. The plateau mountainous area and the central and northern part of the basin are mostly stable regions, and the degradation region is mainly distributed in the southern urban area of the basin, and the continuous degradation is the main one.

4. Discussion

4.1. Comparison to Traditional Landscape Indices

Traditional landscape pattern indices are based on land use generated by remote sensing, while the landscape pattern index is not limited to land use [34]. Yang combined slope, soil and vegetation cover to generate landscape pattern index in his doctoral dissertation to calculate the relationship with water and sediment [35]. Bin used land cover, topographic features and soil properties to generate the Runoff Landscape Index (RLI) to calculate the impact of RLI and runoff [34].
The time resolution of the land use method is not high enough, and the values are not continuous. The purpose of our research was to evaluate the change trend of NURS’s soil and water conservation capacity. In addition to the analysis of space, the requirements for time change are relatively high. Therefore, we constructed the VTF using three elements: NDVI, Euclidean distance and slope. Further, VTLI was generated using FRAGSTATS, which described the effect of VTF on water and sediment at the patch level well. The results show that VTLI index has a good correlation with runoff and sediment yield (Figure 4). Through the PLSR method, it is verified that the interpretation degree of landscape indicators for the water and sediment yield in each period is in the range of 0.514–0.809 (Table 4), which further verifies the effectiveness and feasibility of the new framework.

4.2. VTLI with Runoff and Sediment

Runoff and sediment transport are affected by the landscape pattern of the basin. Patches can slow runoff and promote rainfall infiltration, which in turn reduces runoff and sediment yield [36], thus intercepting surface runoff and “capturing” water and nutrients from runoff [7]. Therefore, the interaction of landscape patches can greatly affect the eco-hydrological process, including the soil erosion process [37].

4.2.1. VTLI Correlation

PD, IJI, LSI and SHDI are positively correlated with runoff and sediment in NURS. PD is the density of landscape patches and LSI is the complexity of landscape shape. The higher the PD and LSI values, the higher the degree of landscape fragmentation and the increase in sediment yield. In watershed management, the number of landscape patches should be reduced, and small patches should be combined to reduce the complexity of patches. IJI is the overall distribution and juxtaposition of various patches at the landscape level. The increase in IJI value leads to a greater dispersion of patches, more irregular spatial distribution and greater Mosaic degree between patches, more landscape fragmentation and more human disturbance, thus a higher runoff and sediment yield.
SHDI is the Shannon Wiener diversity index. A higher SHDI value indicates a richer land use type and a higher degree of fragmentation, which not only increases the runoff but also increases the sediment yield of the watershed [38,39]. Therefore, in terms of water and soil conservation, an optimal SHDI value should be determined and the rational allocation of water and soil conservation measures should be expounded form the point of ecology.
AI and CONNECT were significantly negatively correlated with the runoff and the sediment. CONNECT refers to the degree of landscape connectivity. As connectivity increases, the homogenous patches will be more homogeneously distributed in the spatial and runoff and the sediment yield will decrease. If the AI Index decreases, the aggregation degree of homogeneous patches decreases and the spatial distribution of the patches becomes more dispersed, resulting in the large patches becoming small patches in the landscape. In the watershed soil erosion control process, attention should be paid to reducing the fragmentation of stable sediment landscape and improving the aggregation of homogeneous patches.

4.2.2. VTLI Changes

The PLSR model is an effective method to describe the relationship between landscape pattern and basin ecohydrology. It reduces the noise in the data by eliminating the autocorrelation of variables and further explains the maximum variation of dependent variables [37,40]. The results show that the landscape pattern had a significant effect on runoff and sediment yield. The PLSR model can be used to determine the main landscape pattern factors controlling the NURS runoff and sediment yield, and the VIP index is suitable for the study of the change degree of landscape factors.
Landscape pattern indices PD and IJI were the main promoting factors of runoff and sediment yield, showing a gradual increase with time that indicated that the impacts of watershed fragmentation, spatial irregularity and human activities on sediment yield were increasing. LSI and SHDI were the main driving factors of sediment yield. LSI and SHDI gradually decreased over time, which indicated that the impact of landscape shape, landscape richness, and land use type fragmentation on sediment yield gradually decreased. CONNECT was the main restrain factor of runoff generation and fluctuated over time. The restrain factor effect of increased connectivity on flow generation is decreasing. AI was the main restrain of sediment yield, and it showed a decreasing trend, indicating that the restrain effect of homogeneous patch on sediment yield was decreasing.
It was found by comparing the PLSR of three time periods (2000–2010, 2010–2015 and 2015–2018). The proportion of VTLI explaining abortion first decreased slightly and then increased significantly (0.639–0.578–0.778). The proportion explained by VTLI to sediment production first decreased sharply, and then increased slightly (0.809–0.514–0.613). Generally speaking, the yield of abort and sediment is mainly affected by the combined influence of the underlying surface and climate. Among them, from 2010 to 2015, Yunnan experienced severe drought, and the water and sediment content decreased, for which the climate was a very important factor. Therefore, after the implementation of the national project (in 2008), the influence of the underlying surface change on the water yield increased while the influence on the sediment yield decreased.

4.3. VTF Change and Sustainability

In 2003, the government of Honghe Prefecture moved from Gejiu City to Mengzi City, and the Mengzi economy began to develop rapidly. The relocation of the prefecture government required massive municipal construction. Before 2002, the total amount of fixed asset investment in Mengzi was low and the growth was slow. After 2002, the amount of fixed asset investment increased significantly. According to statistics, the average population growth rate from 1995 to 2002 was 1.13%, and the average natural population growth rate from 2003 to 2018 was 1.71%. On the one hand, with the increase in natural population growth rate, the water consumption for residents and industries increased sharply. On the other hand, as the population increases, so does the demand for farmland and construction land [41]. Under the pressure of resources and population, the urban land type changes from forest land to construction land, which leads to the decrease in NDVI and VTF values.
Since 2008, Yunnan province has implemented a series of key ecological projects, including a shelterbelt project in the upper reaches of the Pearl River, a comprehensive agricultural development project in mountainous areas, and a terraced field project to return farmland to forest or grassland [42]. With the State Council approving the Rocky Desertification in the Karst Region Comprehensive Treatment Planning Outline (2006–2015), the local government launched the rocky desertification comprehensive treatment pilot work. The steep slope zone of the NURS was restored with natural afforestation, artificial afforestation and farmland with more than 25° slope abandonment to control soil erosion.
In this paper, VTF was constructed to study the changing trend of soil and water conservation capability of NURS in the future. In faulted basins, previous studies about vegetation restoration were analyzed. Zhang predicted the changes in vegetation utilization and vegetation productivity in the faulted basin area and found that the vegetation recovered in recent years, but was still unstable [26]. Tong found that the vegetation restoration in Yunnan and Guizhou from 2001 to 2013 was mainly sustained and stable, while urbanization led to a small part of the sustainable degradation of the vegetation [43]. Our study on VTF trends from 2000 to 2018 showed that the dominance of stability has changed to the dominance of recovery, but the sustainability of degradation caused by urbanization still exists.

4.4. Limitations

Due to the in limitations of the data, the landscape index factor of the vegetation-topographic pattern adopted the superposition of MODIS with 250 m resolution of NDVI data and 10 m DEM data, which reduces the accuracy. In future studies, data with a higher temporal and spatial resolution will be adopted. The time data will be extended, and spatial data with 30 m or even higher precision with DEM synchronization will be adopted, which will enhance the accuracy of the results. The runoff and sediment processes at the watershed scale are complex, and so it is difficult to scientifically explain their changes with a single index. Therefore, in the future, the construction of landscape pattern indices based on more hydrological processes will be addressed.

5. Conclusions

In this paper, the NDVI using a DEM, Eucdistance and vegetation of NURS was adopted to construct the VTLI and VTF. The following conclusions were reached.
PD, IJI, LSI and SHDI were positively correlated with runoff and sediment yield (p < 0.01). AI and CONNECT were significantly negatively correlated with runoff and sediment yield (p < 0.01). The LPI and DIVISION index were not significantly correlated with discharge, but were significantly correlated with sediment yield (p < 0.05). The interpretation of VTLI for runoff increased from 0.639 to 0.778, and the interpretation of sediment transport decreased from 0.809 to 0.613. On the other hand, the ecological restoration effect was obvious, and VTF restoration sustainability accounted for 31.05%, which was located in the basin mountain edge area. The unsustainable VTF was only 2.48%, which was distributed in the urban periphery.
In conclusion, the ecological restoration project of NURS achieved obvious effects, and the change in the underlying surface increased the runoff production and reduced the sediment production. In the basin and mountain edge area with a high slope, the water conservation capacity has been restored, and the trend is sustainable. Due to the urban expansion brought by economic development, the water conservation capacity around the city decreased, and the trend is also sustainable. In the future, policymakers should strengthen the ecological environment in urban areas, and coordinate the development of the interior of the mountainous areas and the edge of the basin with uncertain changes and trends.

Author Contributions

P.L. coordinated and wrote this article. Z.J. and Y.L. participated in the topic selection and analysis of the research direction. Y.L. and F.L. participated in data analysis, research framework design, and draft writing. Y.S. revised the manuscript. All co-authors have given explanations of the results and texts and approved the publication. All authors have read and agreed to the published version of the manuscript.

Funding

This work was supported by the National Key Research and Development Program of China (No. 2016YFC0502503), the Key Laboratory Construction Project of Guangxi (No. 19-185-7), the Youth Foundation of National Natural Science Foundation of China (No. 41502342) and the General Project of National Natural Science Foundation of China (No. 41471447).

Data Availability Statement

Not applicable.

Acknowledgments

The authors are grateful to DEM data from the Computer Network Information Center of Chinese Academy of Sciences, the NASA Data Information Service MODIS product, the runoff and sediment data provided by Bureau of Hydrology and Water Resources of Honghe Prefecture, Yunnan Province. Special thanks to the faulted Basin R&D project 3 team. We also appreciate all reviewers and editors for their constructive and insightful comments.

Conflicts of Interest

The authors declare no conflict of interest.

Appendix A

Figure A1. Calculation formula of each landscape index.
Sustainability 15 00835 g0a1

References

  1. Chen, L.D.; Liu, Y.; Lv, Y.H.; Feng, X.M.; Fu, B.J. Landscape pattern analysis in landscape ecology: Current, challenges and future. Acta Ecol. Sin. 2008, 28, 5521–5531. [Google Scholar]
  2. Fu, B.J.; Xu, Y.D.; Lv, Y.H. Scale Characteristics and Coupled Research of Landscape Pattern and Soil and Water Loss. Adv. Earth Sci. 2010, 25, 673–681. [Google Scholar]
  3. Khan, M.Y.A.; Daityari, S.; Chakrapani, G.J. Factors responsible for temporal and spatial variations in water and sediment discharge in Ramganga River, Ganga Basin, India. Environ. Earth Sci. 2016, 75, 283. [Google Scholar] [CrossRef]
  4. Cui, L.; Zhao, Y.; Liu, J.; Han, L.; Ao, Y.; Yin, S.; Li, R. Landscape ecological risk assessment in Qinling Mountain. Geol. J. 2018, 53, 342–351. [Google Scholar] [CrossRef]
  5. Panwar, S.; Khan, M.Y.A.; Chakrapani, G.J. Grain size characteristics and provenance determination of sediment and dissolved load of Alaknanda River, Garhwal Himalaya, India. Environ. Earth Sci. 2016, 75, 91. [Google Scholar] [CrossRef]
  6. Liu, P.; Jiang, Z.C.; Li, Y.Q.; Lan, F.N.; Yu, Y.; Huang, Y.X. A Study of Soil Anti-erodibility of Different Slope Positions on Plateau Depression in Karst Gabin Basin. Acta Geosci. Sin. 2021, 42, 373–381. [Google Scholar] [CrossRef]
  7. Ludwig, J.A.; Wilcox, B.P.; Breshears, D.D.; Imeson, A.C. Vegetation patches and runoff–erosion as interacting ecohydrological processes in semiarid landscapes. Ecology 2005, 86, 288–297. [Google Scholar] [CrossRef] [Green Version]
  8. Krause, S.; Lewandowski, J.; Grimm, N.B.; Hannah, D.M.; Pinay, G.; McDonald, K.; Martí, E.; Argerich, A.; Pfister, L.; Klaus, J.; et al. Ecohydrological interfaces as hot spots of ecosystem processes. Water Resour. Res. 2017, 53, 6359–6376. [Google Scholar] [CrossRef] [Green Version]
  9. Wu, J.G. Landscape Ecology-Concepts and Theories. Chin. J. Ecol. 2000, 19, 42–52. [Google Scholar] [CrossRef]
  10. Roy, H.Y.; Mark, C. Quantifying landscape structure: A review of landscape indices and their application to forested landscapes. Prog. Phys. Geogr. Earth Environ. 2016, 20, 418–445. [Google Scholar] [CrossRef]
  11. Khan, M.Y.A. Spatial Variation in the Grain Size Characteristics of Sediments in Ramganga River, Ganga Basin, India. In Handbook of Environmental Materials Management; Hussain, C.M., Ed.; Springer International Publishing: Cham, Switzerland, 2018; pp. 1–11. [Google Scholar] [CrossRef]
  12. Yu, Y.; Zhao, W.; Martinez-Murillo, J.F.; Pereira, P. Loess Plateau: From degradation to restoration. Sci. Total Env. 2020, 738, 140206. [Google Scholar] [CrossRef] [PubMed]
  13. Reid, K.D.; Wilcox, B.P.; Breshears, D.D.; MacDonold, L. Runoff and Erosion in a Piiion-Juniper Woodland: Influence of Vegetation Patches. Soil. Sci. Soc. Am. J. 1999, 63, 1869–1879. [Google Scholar] [CrossRef] [Green Version]
  14. Boix-Fayos, C.; Barberá, G.G.; López-Bermúdez, F.; Castillo, V.M. Effects of check dams, reforestation and land-use changes on river channel morphology: Case study of the Rogativa catchment (Murcia, Spain). Geomorphology 2007, 91, 103–123. [Google Scholar] [CrossRef]
  15. Yan, B.; Fang, N.F.; Zhang, P.C.; Shi, Z.H. Impacts of land use change on watershed streamflow and sediment yield: An assessment using hydrologic modelling and partial least squares regression. J. Hydrol. 2013, 484, 26–37. [Google Scholar] [CrossRef]
  16. Tarolli, P.; Sofia, G. Human topographic signatures and derived geomorphic processes across landscapes. Geomorphology 2016, 255, 140–161. [Google Scholar] [CrossRef] [Green Version]
  17. Yu, Y.; Zhu, R.; Ma, D.; Liu, D.; Liu, Y.; Gao, Z.; Yin, M.; Bandala, E.R.; Rodrigo-Comino, J. Multiple surface runoff and soil loss responses by sandstone morphologies to land-use and precipitation regimes changes in the Loess Plateau, China. Catena 2022, 217. [Google Scholar] [CrossRef]
  18. Good, S.P.; Noone, D.; Bowen, G. Water Resources. Hydrologic connectivity constrains partitioning of global terrestrial water fluxes. Science 2015, 349, 175–177. [Google Scholar] [CrossRef] [PubMed] [Green Version]
  19. Rui, X.F.; Jiang, C.Y. Review of research of hydro-geomorphological processes interaction. Adv. Water Sci. 2010, 21, 444–449. [Google Scholar] [CrossRef]
  20. Yu, Y.; Loiskandl, W.; Kaul, H.-P.; Himmelbauer, M.; Wei, W.; Chen, L.; Bodner, G. Estimation of runoff mitigation by morphologically different cover crop root systems. J. Hydrol. 2016, 538, 667–676. [Google Scholar] [CrossRef] [Green Version]
  21. Gan, G.; Liu, Y.; Sun, G. Understanding interactions among climate, water, and vegetation with the Budyko framework. Earth-Sci. Rev. 2021, 212, 103451. [Google Scholar] [CrossRef]
  22. Johnson, L.B.; Gage, S.H. Landscape approaches to the analysis of aquatic ecosystems. Freshw. Biol. 1997, 37, 113–132. [Google Scholar] [CrossRef]
  23. Yin, Z.Y.; Walcott, S.; Kaplan, B.; Cao, J.; Lin, W.; Chen, M.J.; Liu, D.S.; Ning, Y.M. An analysis of the relationship between spatial patterns of water quality and urban development in Shanghai, China. Comput. Environ. Urban Syst. 2005, 29, 197–221. [Google Scholar] [CrossRef]
  24. Li, Y.Q.; Jiang, Z.C.; Yu, Y.; Shan, Z.J.; Lan, F.N.; Yue, X.F.; Liu, P.; Gyasi-Agyei, Y.; Rodrigo-Comino, J. Evaluation of soil erosion and sediment deposition rates by the (137)Cs fingerprinting technique at different hillslope positions on a catchment. Environ. Monit. Assess. 2020, 192, 717. [Google Scholar] [CrossRef] [PubMed]
  25. Xiao, L.Y.; Wu, X.Q.; Zhou, J.X.; Xiao, G.Y. Comprehensive Benefit Evaluation of Rocky Desertification Control in the Typical County of Karst Fault Basin: A Case Study of Jianshui County, Yunnan Province. Acta Geosci. Sin. 2021, 42, 444–450. [Google Scholar] [CrossRef]
  26. Zhang, X.T.; Wu, X.Q. Research on the Spatial-temporal Variation of NPP in Yunnan Fault-depression Basins Based on CASA Model in 2005–2019. Acta Geosci. Sin. 2021, 42, 426–434. [Google Scholar] [CrossRef]
  27. Tong, X.W.; Wang, K.L.; Brandt, M.; Yue, Y.M.; Liao, C.J.; Fensholt, R. Assessing Future Vegetation Trends and Restoration Prospects in the Karst Regions of Southwest China. Remote Sens. 2016, 8, 357. [Google Scholar] [CrossRef] [Green Version]
  28. Wang, Y.; Zhang, H.; Zhang, G.; Wang, B.; Peng, S.H.; He, R.S.; Zhou, C.Q. Zoning of Environmental Geology and Function in Karst Fault-Depression Basins. Carsologica Sin. 2017, 36, 283–295. [Google Scholar] [CrossRef]
  29. Vermote, E.F.; Satterfield, E.A. Cover: Southern Africa, 2 February 2002 to 16 May 2002, Moderate Resolution Imaging Spectroradiometer (MODIS) 500 m land surface reflectance. Int. J. Remote Sens. 2007, 26, 4137–4139. [Google Scholar] [CrossRef]
  30. Fensholt, R.; Proud, S.R. Evaluation of Earth Observation based global long term vegetation trends—Comparing GIMMS and MODIS global NDVI time series. Remote Sens. Environ. 2012, 119, 131–147. [Google Scholar] [CrossRef]
  31. Holben, B.N. Characteristics of maximum-value composite images from temporal AVHRR data. Int. J. Remote Sens. 2007, 7, 1417–1434. [Google Scholar] [CrossRef]
  32. Li, X.Z.; Bu, R.C.; Chang, Y.; Hu, Y.M.; Wen, Q.C.; Wang, X.G.; Xu, C.G.; Li, Y.H.; He, H.S. The response of landscape metrics against pattern scenarios. Acta Ecol. Sin. 2004, 24, 123–134. [Google Scholar]
  33. He, P.; Zhang, H.R. Study on Factor Analysis and Selection of Common Landscape Metrics. For. Res. 2009, 22, 470–474. [Google Scholar] [CrossRef]
  34. Bin, L.; Xu, K.; Xu, X.; Lian, J.; Ma, C. Development of a landscape indicator to evaluate the effect of landscape pattern on surface runoff in the Haihe River Basin. J. Hydrol. 2018, 566, 546–557. [Google Scholar] [CrossRef]
  35. Yang, X.N. Effects of landscape pattern on runoff and sediment in the Loess Plateau: A multi-scale study. Ph.D. Thesis, Northwest A&F University, Xianyang, China, 2019. [Google Scholar]
  36. Zhao, M.; Yang, X.N.; Chen, P.Y.; Sun, W.Y.; Ming, M.X.; Gao, P.; Zhao, G.J. Effects of shrub patch pattern on runoff and sediment yield. Chin. J. Appl. Ecol. 2020, 31, 735–743. [Google Scholar] [CrossRef]
  37. Xu, X.L.; Li, Z.W.; Xu, C.H.; Liu, M.X.; Wang, K.L.; Yu, B.F. Annual Runoff is Highly Linked to Precipitation Extremes in Karst Catchments of Southwest China. J. Hydrometeorol. 2017, 18, 2745–2759. [Google Scholar] [CrossRef]
  38. Wang, S.; Fu, B.J.; He, C.S.; Sun, G.; Gao, G.Y. A comparative analysis of forest cover and catchment water yield relationships in northern China. For. Ecol. Manag. 2011, 262, 1189–1198. [Google Scholar] [CrossRef]
  39. Li, J.; Zhou, Z.X. Landscape pattern and hydrological processes in Yanhe River basin of China. Acta Geogr. Sin. 2014, 69, 933–944. [Google Scholar] [CrossRef]
  40. Shi, Z.H.; Huang, X.D.; Ai, L.; Fang, N.F.; Wu, G.L. Quantitative analysis of factors controlling sediment yield in mountainous watersheds. Geomorphology 2014, 226, 193–201. [Google Scholar] [CrossRef]
  41. Lan, F.; Zhao, Y.; Jiang, Z.; Yu, Y.; Li, Y.; Caballero-Calvo, A.; Senciales González, J.M.; Rodrigo-Comino, J. Exploring long-term datasets of land use, economy, and demography variations in karst wetland areas to detect possible microclimate changes. Land Degrad. Dev. 2022, 33, 2743–2756. [Google Scholar] [CrossRef]
  42. Li, Y.Q.; Jiang, Z.C.; Chen, Z.H.; Yu, Y.; Lan, F.N.; Shan, Z.J.; Sun, Y.J.; Liu, P.; Tang, X.B.; Rodrigo-Comino, J. Anthropogenic Disturbances and Precipitation Affect Karst Sediment Discharge in the Nandong Underground River System in Yunnan, Southwest China. Sustainability 2020, 12, 6. [Google Scholar] [CrossRef] [Green Version]
  43. Tong, X.; Wang, K.L.; Yue, Y.M.; Brandt, M.; Liu, B.; Zhang, C.H.; Liao, C.J.; Fensholt, R. Quantifying the effectiveness of ecological restoration projects on long-term vegetation dynamics in the karst regions of Southwest China. Int. J. Appl. Earth Obs. Geoinf. 2017, 54, 105–113. [Google Scholar] [CrossRef]
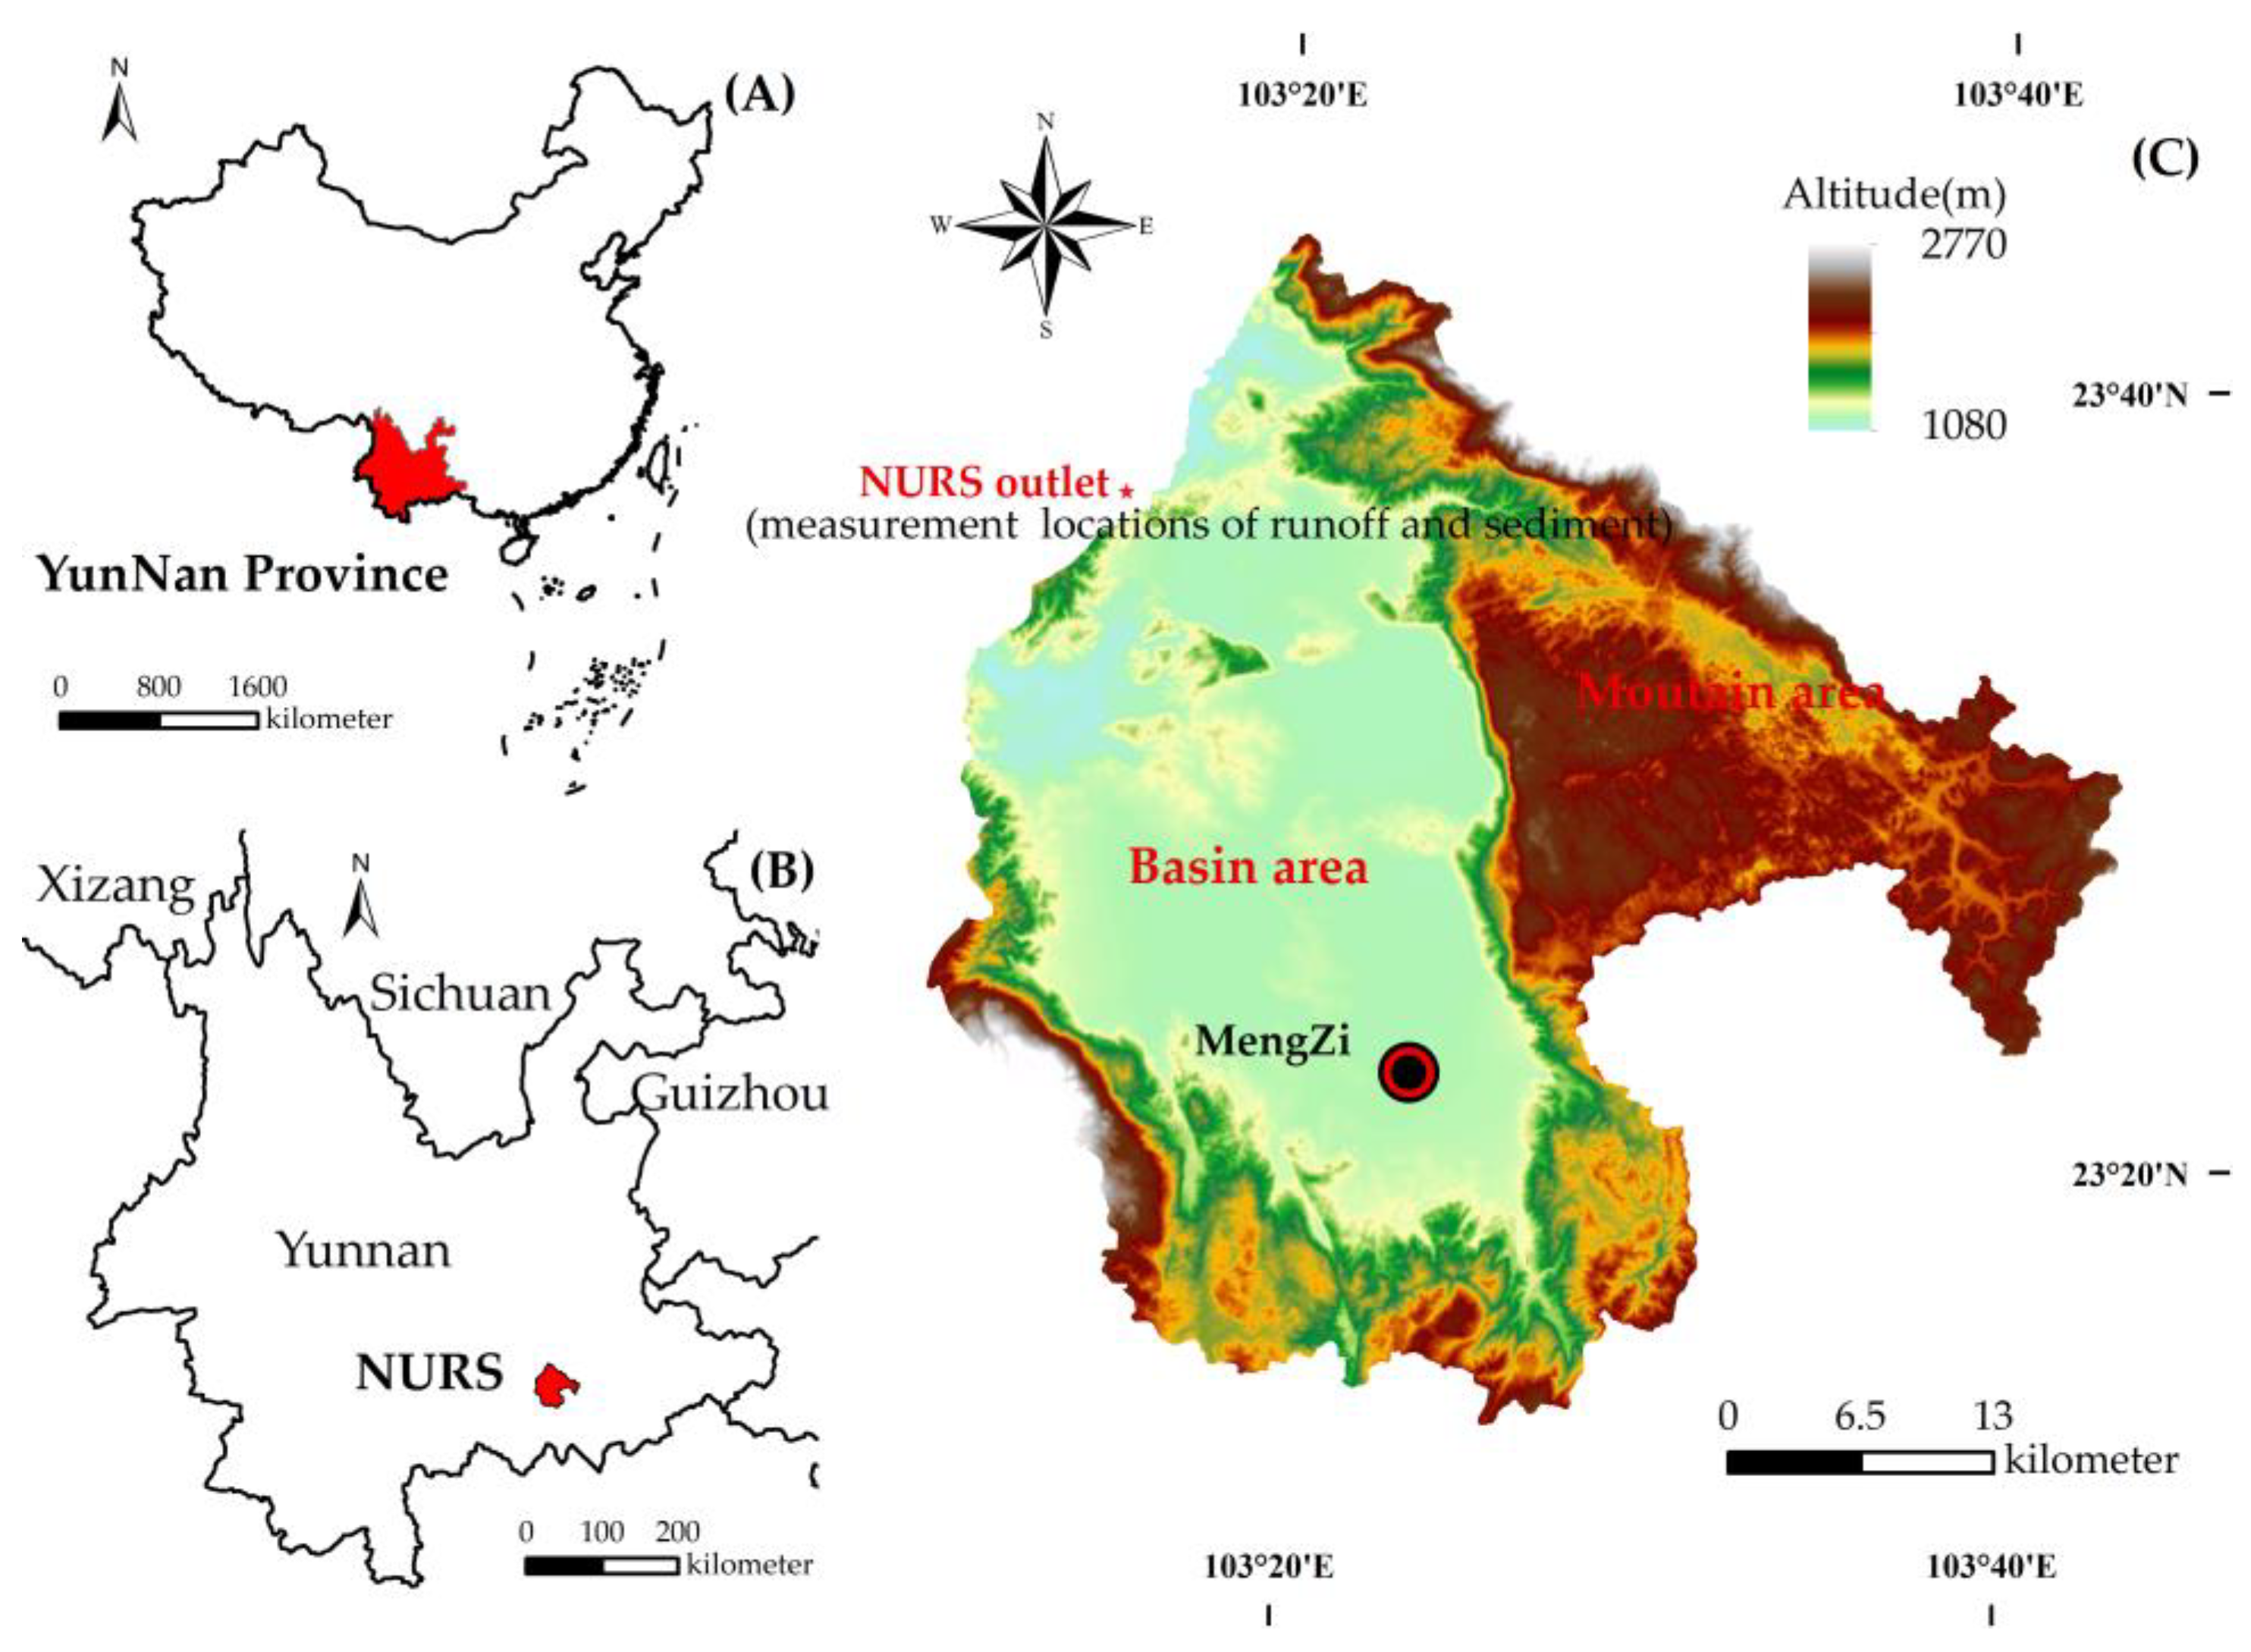
Figure 1. NURS is located in China: (A) Yunnan is located in China, (B) NUSR is located in Yunnan, and (C) Map of NURS.
Sustainability 15 00835 g001
Figure 2. Methodology flow chart.
Sustainability 15 00835 g002
Figure 3. Normalized value (A) Slope, (B) Euclidean, (C) NDVI and (D) VT value.
Sustainability 15 00835 g003
Figure 4. The correlation between VTLI with runoff and sediment yield.
Sustainability 15 00835 g004
Figure 5. First and second component PLSR weights of runoff yield (A) 2000–2010, (B) 2010–2015, (C) 2015–2018, and (D) projection importance of the variable.
Sustainability 15 00835 g005
Figure 6. First and second component PLSR weights of sediment yield (A) 2000–2010, (B) 2010–2015, (C) 2015–2018, and (D) projection importance of the landscape index variables. The red circle is the VTLI factor of the maximum and minimum values of the first component of PLSR, and the blue circle is the VTLI factor of the maximum and minimum values of the second component of PLSR.
Sustainability 15 00835 g006
Figure 7. Time variation of VTF areas in NURS from 2000 to 2018.
Sustainability 15 00835 g007
Figure 8. Multi-year mean value of VTF in NURS.
Sustainability 15 00835 g008
Figure 9. Trends of VTF in NURS from 2000 to 2018.
Sustainability 15 00835 g009
Figure 10. Hurst exponent trends of VTF in NURS from 2000 to 2018.
Sustainability 15 00835 g010
Figure 11. Persistence of change in VTF (Unsustainable degradation (USD), Sustainable degradation (SD), Unsustainable stable (USS), Sustainable stable (SS), Unsustainable restoration (USR), and Sustainable restoration (SR)).
Sustainability 15 00835 g011
Table 1. Research data sources, resolution and uses.
DataUseRevolutionSource
DEMSlope map10 mCAS (http://www.cnic.cas.cn/ accessed on 25 April 2020)
NDVINDVI map250 m/monthMOD13Q1 (http://modis.gsfc.nasa.gov accessed on 6 June 2020)
Water system mapEucdistance map10 mProject Team
Runoff and sedimentCorrelation/change analysisper monthHydrology and Water Resources Bureau
Table 2. Parameter classification.
IndicatorsNDVISlopeEucdistanceVTF
Characterbare~high coverageflat~steep slopeshort~long(water and soil conservation capacity) weak~strong
Original value0~0.890~67°0~0.39-
Normalized value0~10~10~1-
Proportion1/31/31/3-
VTF value---0.10~0.86
Table 3. Landscape pattern index.
Landscape IndexDescription
PD (Patch Density)An important indicator of landscape fragmentation
LPI (Largest Patch Index)Reflect the richness and dominant species in the landscape
LSI (Landscape Shape Index)Complexity of the shape of a landscape type
IJI (Interspersion Juxtaposition Index)Overall dispersion and juxtaposition of various patch types
CONNECT (Landscape Connectivity)Degree of connection between patches
DIVISON (Division of Landscape)Degree of separation of landscape types
SHDI (Diversity Index)Reflect landscape heterogeneity
AI (Aggregation Index)Degree of aggregation of landscape types
The specific calculation formula of each landscape index: Appendix A, Figure A1.
Table 4. The PLSR model (Q2cum) between landscape index with water and sediment yield.
Component2000–20102010–20152015–2018
WaterSedimentWaterSedimentWaterSediment
10.5670.6480.4620.3880.6720.489
20.6190.7620.5410.4170.7200.553
30.6250.7930.5620.4590.7560.578
40.6390.8090.5780.5140.7780.613
Table 5. Persistence of change in VTF.
IndicatorsDegradeStableRecover
Sustainable (Hurst > 0.5)2.48%21.58%31.05%
Unsustainable (Hurst < 0.5)5.09%19.96%19.84%
Disclaimer/Publisher’s Note: The statements, opinions and data contained in all publications are solely those of the individual author(s) and contributor(s) and not of MDPI and/or the editor(s). MDPI and/or the editor(s) disclaim responsibility for any injury to people or property resulting from any ideas, methods, instructions or products referred to in the content.