Article

Stability of Functionally Modified Biochar: The Role of Surface Charges and Surface Homogeneity

1
Yunnan Provincial Key Laboratory of Soil Carbon Sequestration and Pollution Control, Faculty of Environmental Science & Engineering, Kunming University of Science &Technology, Kunming 650500, China
2
Department of Environmental Chemistry, University of Maria Skłodowska-Curie, pl. M. Curie-Sklodowskiej 3, 20-031 Lublin, Poland
*
Author to whom correspondence should be addressed.
Sustainability 2023, 15(10), 7745; https://doi.org/10.3390/su15107745
Submission received: 13 March 2023 / Revised: 29 April 2023 / Accepted: 6 May 2023 / Published: 9 May 2023
(This article belongs to the Section Environmental Sustainability and Applications)

Abstract

:
Biochar modification has received significant research attention due to its attractive and fruitful rewards in improving biochar performances. However, the determinants of modified biochars’ stability and the ability of aged modified biochars to remove heavy metals have not been comprehensively evaluated. Therefore, three commonly used functional groups of modified biochars (5% and 10% H2O2-modified (BCH5 and BCH20); 25% and 65% HNO3-modified (BCA25 and BCA65); and amino-modified (BCN), were prepared in this study to explore their stability and the Cd(II) removal performance of aged functional groups modified biochars was studied. The results showed that the O/C ratio is not sensitive enough to predict the stability of functional groups modified biochars, which was commonly used to evaluate pristine biochar (BC0); instead, -COOH content is crucial for modified biochar stability (r = −0.99, r = −0.91, p < 0.05). BCA65 displayed the highest less prone to oxidation property, which indicated that the high surface charges and uniform surface determined the less prone to oxidation ability of the functionally modified biochars. The order of the stability of functionally modified biochars was HNO3-modified > H2O2-modified > amino-modified. After oxidation, the surface charges and pores were significantly reduced, and the Cd2+ adsorption mechanism of modified biochar changed from multilayer adsorption to monolayer adsorption, which led to a reduction in overall Cd(II) removal. The maximum adsorption capacities of BCA65 were reduced from 18.15 mg·g−1 to 4.86 mg·g−1 after oxidation, particularly. In the design and preparation of modified biochar, the long-term stability of the structure and function of modified biochar and its sustainable application in the environment should be considered while improving the heavy metal removal performance of biochars.

1. Introduction

Biochars, as carbon-rich materials originating from limited oxygen pyrolysis of agricultural and forestry wastes, have been broadly known as important carbon sequestration materials and soil amendments in the agricultural field. Biochars are a promising option for C-fixing and removal from the short-term carbon cycle and can be stored in soils for long periods [1]. However, because of its abundant porous structure and surface functional groups, biochars are also commonly used to remove pollutants from water and soil. To further improve biochar’s pollutant removal performance, many chemical and physical measures have been used to tune the properties of modified biochars, such as the specific surface area, functional groups, and mineral content [2,3,4]. Oxidative acids are often used to introduce functional groups on the biochar surface to enhance the heavy metal removal capacity. Zhang et al. used a mixed HNO3 and H2O2 solution to successfully introduce carboxyl functional groups and phenolic hydroxyl groups on the surface, which led to the adsorption capacity of Cd2+ increasing by 34.48% [5]. Indeed, there is increasing research interest in biochar modification due to its promising application; however, the environmental sustainability of modified biochar, including its stability and effectiveness in removing pollutants after aging, has not been systematically studied.
The aging process for unmodified biochars has been carefully discussed [6,7]. Once biochars enter the environment, biochars undergo biotic and abiotic aging processes. Microorganisms can utilize liable carbon on biochars as their energy source. Abiotic aging processes undergo many physical and chemical processes, such as freeze-thaw cycles, photochemical degradation, and mild oxidation of root exudates [8]. All these processes can lead to significant changes in biochar properties [9,10]. Cheng et al. found that after incubation of biochars in soil for 12 months, the functional groups, such as carboxyl functional groups and phenolic hydroxyl groups, were formed on the biochar surface, which led to the positive surface charge of biochars disappearing and the generation of a negative charge [11]. Therefore, evaluating biochars before their application to soil is important. The International Biochar Initiative (IBI) states that biochars with an O/C molar ratio of <0.2 are generally most stable, with an estimated half-life of <1000 years; biochars with an O/C ratio of 0.2–0.6 have half-lives of between 100 and 1000 years [12]. Schmidt et al. further recommended that H/Corg and O/Corg ratios could be used as indicators for evaluating the stability of biochars [13]. Till now, most of the studies have used the O/C ratio to determine the overall stability of biochars [14,15]. However, it is not clear whether the O/C ratio can accurately evaluate the stability of functionally modified biochars.
However, once pristine biochars are treated by acids, alkalis, and oxidizers, many functional groups are introduced onto the surface of biochars [16,17]. These modification processes greatly increase the O/C ratio on the surface of biochars. According to the previous conclusions, the overall stability of modified biochars should be significantly reduced. On the other hand, it is worth debating whether introducing functional groups on biochar surfaces requires relatively harsh oxidation conditions, which might reduce the liable carbon from the biochars. As a result, the stability of biochars should be further improved. Research has also shown that the pore structure of biochars is destroyed during hash acid treatment, resulting in inner surface exposure and endogenous mineral release [18]. Both processes make oxidants easily access the biochar surface, which may reduce the less prone to oxidation ability of biochars eventually.
Endogenous minerals were another factor responsible for biochar stability. Han et al. showed that the stability of biochars with low ash content mainly depends on their aromatic C content, while the stability of biochars with high ash content mainly depends on aromatic C and mineral components [14]. However, Siatecka et al. showed that sludge biochars, as one of the modified biochars, contained more minerals than willow biochars [19]. The contained minerals caused defects in aromatic structures during the pyrolysis process, which led to a decrease in the overall stability of sludge biochars. Therefore, the type of biochars modification process could influence the endogenous mineral content of modified biochars and lead to an uncertain change in their chemical stability.
In summary, modified biochars have grabbed a lot of research interest, but their physicochemical properties and how to affect their stability remain unclear. It is also uncertain whether the methods used to evaluate the functional and structural stability of functionally modified biochars are the same as those used in pristine biochars. Since functional groups modified biochars are the most common type of modified biochars, it is important to understand the less prone to oxidation properties of this kind of modified biochars. In addition, determining the parameters of the stability of modified biochars is the premise of their large-scale environmental application. Therefore, in this study, three kinds of functional groups modified biochars (-OH-modified, -COOH-modified, and -NH2-modified) were prepared, and K2Cr2O7 was used to determine the stability of functional groups modified biochars. By comparing the property changes before and after oxidation, the key parameters to control the stability of functionally modified biochars, as well as the heavy metal adsorption performance, were identified. This research will provide a basic theoretical understanding of the key factors that could control the durability of functional groups modified biochars and guide the design and sustainable utilization of future modified biochars.

2. Materials and Methods

2.1. Preparation and Modification of Biochars

Rice straw biochars (BC0) used in this study were produced through a slow pyrolysis process under an N2 atmosphere at 550 °C for 6 h and passed through a 100-mesh sieve. HNO3 modification was performed by treating the biochars with 25% and 65% HNO3 (solid-to-liquid weight ratio as 1:30) for 4 h at 90 °C [20] and labeled as BCA25 and BCA65, respectively. H2O2 modification was performed by treating the biochars with 5% and 20% H2O2 (solid-to-liquid weight ratio as 1:30) for 6 h at 80 °C [16] and labeled as BCH5 and BCH20, respectively. Amino modification was performed by placing 6 g biochars with 50 mL concentrated sulfuric acid and 50 mL concentrated HNO3 into an ice-cold water bath flask and stirring for 2 h. The pretreated biochars were filtered and washed with deionized water and isopropanol and then dried at 90 °C. The pretreated biochars were mixed with 50 mL H2O and 15 mol·L−1 ammonia for 15 min, and then 28 g Na2S2O4 was added and stirred for another 20 h. Then, 120 mL of 2.915 mol·L−1 acetic acid was added to the mixture. After 5 h of reflux at 100 °C, the suspension was cooled to room temperature [21]. The prepared biochar is numbered BCN. After the modification process, all the modified biochars were washed with deionized water until the pH remained unchanged, dried at 60 °C, and stored in a brown bottle for later use.

2.2. Determination of Biochar Stability

The K2Cr2O7 oxidation method was used to determine the chemical oxidation resistance of biochars [22]. It has been widely used to determine the content of soil organic carbon or oxidation carbon in recent decades [23]. A total of 30 mg of biochar was mixed with 5 mL 0.1 mol·L−1 K2Cr2O7 solution, and 6 mL concentrated H2SO4 was put into brown bottles and placed in an oven at 135 °C for 30 min. The residual Cr6+ concentration in the solution was detected at 540 nm by diphenylcarbazide using an ultraviolet spectrophotometer (UV-2600, Shimadzu, Kyoto, Japan) [24]. The remaining solid-liquid mixture filtered out the biochars. Biochars were washed and dried for future use. The surface functional groups of modified biochars also reacted with K2Cr2O7, so the consumption of K2Cr2O7 was used to represent the loss of biochars in this study.

2.3. Batch Sorption Experiments

2.3.1. Batch Sorption Isotherm Experiments

All the batch sorption isotherm experiments were carried out at room temperature (22 ± 2 °C) by adding 8 mg of modified biochars before and after oxidation by K2Cr2O7 into 10 mL brown bottles, which contained 8 mL 1.0–20.0 mg·L−1 Cd2+ solution (0.01 mol·L−1 NaNO3 as background solution). The mixture was shaken in a mechanical shaker at room temperature at 150 rpm for 24 h to achieve the adsorption equilibrium state. After the adsorption experiments reached equilibrium, the mixtures were filtered through a 0.45 μm PES membrane filter. The Cd2+ concentration in the filtrates was determined by atomic absorption spectrophotometry (Hitachi Z-2000 Series) [25]. The pH of the experimental system was maintained at 6 using 0.01 mol·L−1 HNO3 and NaOH.
In this work, the adsorption capacity Qe (mg·g−1) of Cd2+ at the equilibrium state for different modified biochars was calculated according to the following equation:
Q t   =   ( C o     C t )   ×   V   ×   10 3 m
where Co and Ct are the initial concentration of metal (mg·L−1) and the metal concentration at contact time t, respectively. V (mL) is the volume of the solution, and m (g) is the weight of the added modified biochars. All experiments were performed in duplicate, and the data are presented as mean ± standard deviation.
The Langmuir model was used to simulate the sorption isotherms:
Q e   =   Q m   ×   K L   ×   C e 1   +   C e   ×   K L
Qe (mg·g−1) is the adsorption capacity for modified biochars at equilibrium, while Ce (mg·L−1) represents the equilibrium concentration of the metals in the liquid phase. Qm (mg·g−1) refer to the maximum adsorption capacity, and KL (L·mg−1) is the Langmuir adsorption constant related to the energy of adsorption.
The Freundlich adsorption model is based on adsorption onto a multilayer heterogeneous surface with an interaction between adsorbed ions. The liner form is given by the following equation:
Q e   =   K F   ×   C e 1 n
where KF is the Freundlich equation constant that characterizes the adsorption capacity; n is the Freundlich equation constant.

2.3.2. Kinetic Study

To obtain the adsorption kinetics, 6.80 mg·L−1 of Cd2+ solution was sampled with time intervals of 0, 20, 40, 60, 180, 300, 420, 720, and 1440 min. The pH of the experimental system was maintained at 6 using 0.01 mol·L−1 of HNO3 and NaOH. After the adsorption experiments, the mixtures were filtered through a 0.45 μm PES membrane filter. The Cd2+ concentration was determined by atomic absorption spectrophotometry.
The pseudo-first-order and pseudo-second-order kinetic models simulated the kinetic adsorption process. The equations are as follows:
Pseudo-first-order model:
Q t   =   Qe   ×   1     e k 1 t
Pseudo-second-order model:
Q t   =   Q e 2   ×   k 2   ×   t 1   +   Q e   ×   k 2   ×   t
where Qe (mg·g−1) is the adsorption quantity at equilibrium. k1 (min−1) and k2 (mg·(g·min) −1) are the rate constants of the pseudo-first-order model and pseudo-second-order model, respectively.

2.4. Characterization of Biochars

The surface area of different biochars was determined by N2 adsorption-desorption isotherms obtained from a surface area analyzer at 77 K (ASAP 2020, American Mike Model, GA, USA). The elemental content (C, H, O, N, S) of the modified biochars was determined using an elemental analyzer (Microcube, Elementar, Frankfurt, Germany). The ash content was measured by weighing a certain amount of biochars in a crucible and burning it at 700 °C for 2 h to obtain the ash content. Fourier transform infrared spectrometer (FTIR, Varian 640-IR, Thermo Fisher, Waltham, MA, USA) was used to determine the surface functional groups of biochars. The analytical samples were prepared via the potassium bromide tablet method. An X-ray scanning photoelectron spectrometer (XPS, 250Xi, Thermo Fisher Scientific Escalab, Waltham, MA, USA) determined the elemental composition and the speciation changes on the biochar surface. The X-ray source was a monochromatic Al K-alpha radiation anode target. The variations in the surface potentials of the biochars with pH (6.5) were detected using a zeta potential analyzer (ZetaPlus, Brookhaven, NY, USA).

2.5. Boehm Titration

The surface carboxyl functional group on the biochar surface was quantified using the Boehm titration method [26]. XPS peak splitting is quick and convenient and is often used to estimate the content of -COOH on the surface of biochars. Boehm titration was used to ensure the reliability and accuracy of XPS peak splitting results. Briefly, 50 mL NaHCO3 solutions (0.05 mol·L−1) were added to 100 mg dried biochar samples and shaken for 20 h on a magnetic stirring apparatus. Then, 20 mL of solution was separated and back-titrated using 0.05 mol·L−1 of HCl until pH stabilized to 5.1. The consumption of NaHCO3 was used to calculate the number of carboxylic groups on the modified biochar surface. All titrations were conducted in triplicate.

2.6. Statistics

The data were analyzed using SPSS v.25, and significant differences between means were determined according to the analysis of variance (ANOVA). All significant differences were reported at the 0.05 probability level.

3. Results and Discussion

3.1. The Properties of Modified Biochars

The elemental composition of whole biochar samples was obtained by elemental analysis, and the relative content of the elemental composition on the surface of different biochar samples was measured by XPS. The different element content obtained from these two regular analysis methods could show the heterogeneity of biochars. Table 1 shows that the O/C ratio of BC0 gained by elemental analysis was 0.16, and it also did not change after 5% and 20% H2O2 modification, but the O/C ratio of BCA25, BCA65, and BCN increased from 0.16 to 0.33, 0.47, and 0.22, respectively (p < 0.05). On the other hand, the surface O/C ratio of BC0 measured by XPS was 0.23, which was significantly higher than what was measured by the elemental analyzer (0.16). After 5% and 20% H2O2 modification, the surface O/C ratio was increased to 0.24 and 0.25, which was still higher than what was measured by the elemental analyzer. The surface O/C ratio of BCA25 and BCA65 measured by XPS were 0.36 and 0.47, which started approaching the O/C ratio measured by elemental analysis. The O/C ratio of BCN was almost equal to that of BCA25, probably because of the involvement of HNO3 in the first step of the amino modification process. These results indicated that pristine biochars had higher heterogeneity than modified biochars. When biochars were modified by HNO3, the pores were destroyed by the oxidation process [27], leading to the similarity of surface and inner matrix properties. The oxidative ability of H2O2 was not strong enough; therefore, after H2O2 modification, the O content on the surface of biochars was only slightly increased (Table S1), and the overall O/C ratio of biochars remained the same. This result reinforced that HNO3 modification can not only change the O content on the surface of biochars but also allow oxidants to penetrate deep into the biochar interior. This resulted in pore expansion and the overall element distribution of modified biochars. This conclusion can be further verified via BET results. The specific surface area of the two H2O2-modified biochars (BCH5 and BCH20) only decreased from 132.35 cm2·g−1 to 94.83 and 37.52 cm2·g−1, which is 28% and 72% of the unmodified biochar, respectively. For HNO3-modified biochar, its specific surface area was dramatically reduced by 96%. Nzediegwu et al. and Peiris et al. reported that the reduction in the specific surface area of HNO3-modified biochars was due to pore collapse, which is consistent with the conclusion of our results [28,29]. SEM (Figure 1) clearly shows the changes in the porous structure for different functionally modified biochars. The inner surface of pores of BC0, BCH5, BCH20, and BCN are smooth, but the inner pore structures of BCA25 and BCA65 are relatively rough (green circles) and even have some small new pores on the cross-section area (red circles).
The ash content of all kinds of modified biochars was significantly lower than unmodified biochars due to the low pH of HNO3 and peroxide. This low pH would lead to the loss of endogenous inorganic minerals in biochars [30]. There was no significant difference in ash content among the three different modified biochars, indicating that the endogenous inorganic minerals that remained in the modified rice straw biochars should be in the matrix of the carbon structure. Modification damaged the pores to varying degrees, but the ash content of three modified biochars remained the same.
The C-containing functional groups on the surface of biochars before and after modification were revealed by the C1s peak of the XPS spectrum (Figure S1). The C1s of biochars can be divided into 4 peaks: 284.9 eV (graphic carbon), 286.5 eV (alcohol and ether), 287.9 eV (C=O carbonyl carbon), and 289.4 eV (carboxyl or ester) [31]. The relative concentration of chemical bonds is shown in Table 2. The results showed that the C-C/C=C content decreased from 88.22% to 72.52%, 67.84%, 66.94%, and 62.70% after H2O2 and HNO3 modification, respectively. Meanwhile, the content of C-O, C=O, and -COOH after H2O2 and HNO3 treatment all significantly increased. The C-O content of pristine biochars was about 8.23%, but after 5% and 20% H2O2 modification, it increased to 15.57% and 19.25%, respectively. For HNO3 treatment, the C-O content increased to 13.75% for BCA25 but then decreased to 11.57% for BCA65, which is still higher than pristine biochars. These results indicated that the functional group modification processes could break the C-C/C=C bonds, reduce the graphitization degree of pristine biochars, and introduce an oxygen functional group at broken edges [32]. The ID/IG values of the Raman spectra in Table 1 can also support the above conclusions. H2O2 modification methods introduced -OH on the biochar surface, leading to the highest C-O content on the biochar surface [33]. HNO3 could introduce C-O and further oxidize to C=O on the biochar surface [34]; therefore, the C-O content of BCA 65 was only slightly higher than pristine biochars, but C=O content was the highest among all the treatments. The content of -COOH can be obtained by XPS peak splitting. Using Boehm titration to determine the content of functional groups on the surface of biochars was also conducted to verify the accuracy of XPS peak splitting results. In statistical analysis, the data obtained by these two methods are significantly correlated (r = 0.995, p < 0.05), indicating that the -COOH data obtained by the peak splitting method in this study is reliable.
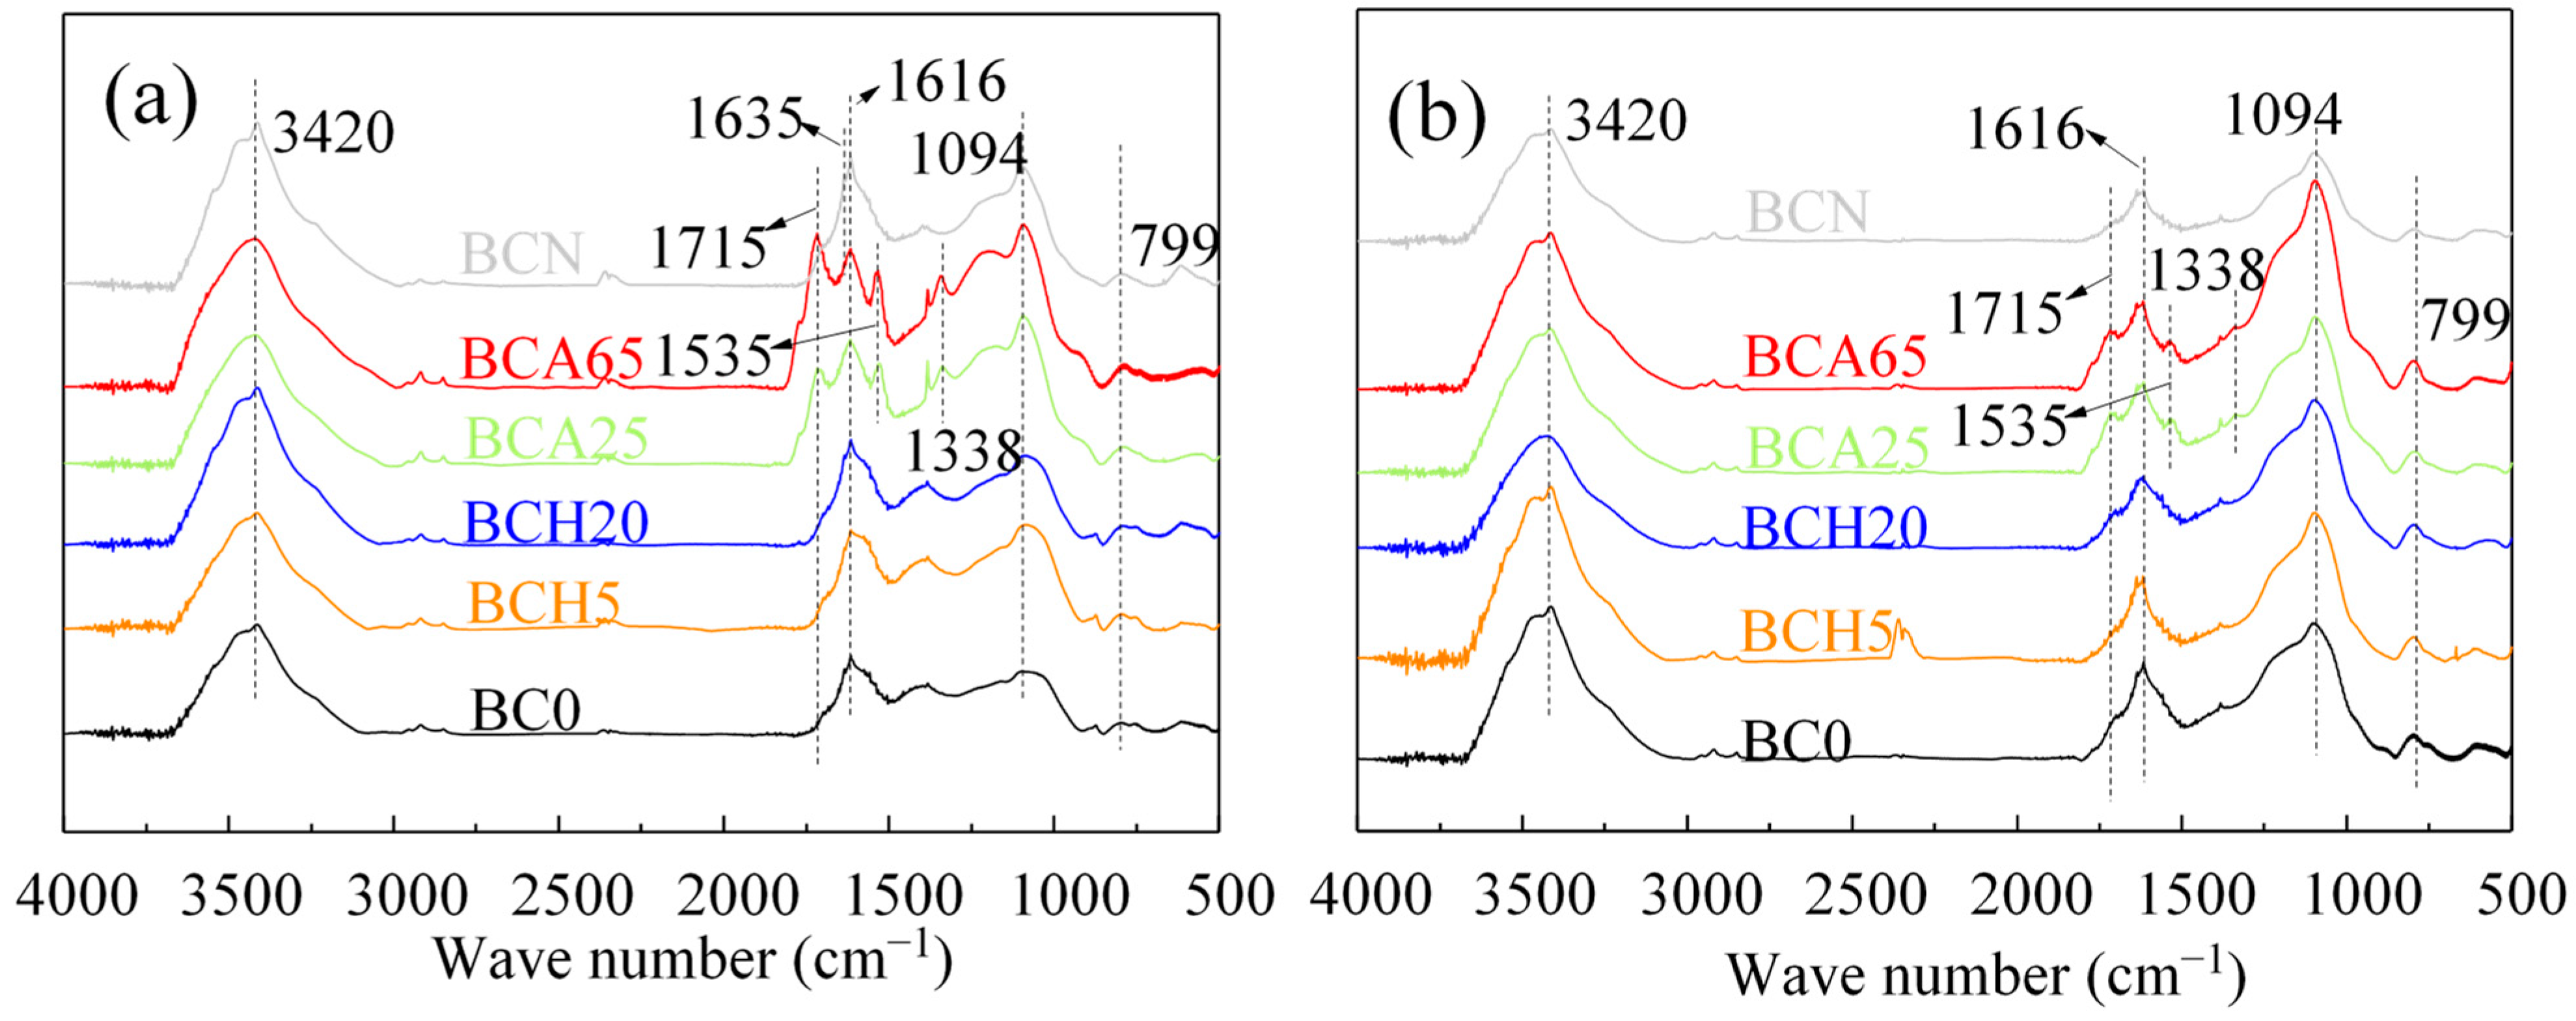
The changes in functional groups on the biochar surface through different modification methods are directly shown in FTIR results (Figure 2). The FTIR spectra of H2O2-modified biochars BCH5, BCH20, and BC0 barely show any difference. They all contained the following FTIR peaks: 3420 cm−1 is the -OH peak (stretching of -OH), the peak at 1616 cm−1 correlates with the C=C stretching of the aromatic carbons, the peaks at 1090 cm−1 can be ascribed to phenolic C-O and O-H stretching, and the peak at 1388 cm−1 represents -CH2- bending in the alkane and alkyl groups. On the other hand, the HNO3 modification process successfully introduced a large amount of -COOH (1715 cm−1) and -NO2 (-NO2 asymmetric peak (1535 cm−1), as well as a -NO2 symmetric peak (1338 cm−1) onto the biochars. This result was similar to the FTIR shown by Qian and Chen [35] and Khan et al. [36]. BCN presents a -NH2 peak at 1635 cm−1, reflecting that amino groups have been loaded on the biochars.
The FTIR spectrum (Figure 2b) shows the broken bonds on the surface of biochars due to simulated oxidation conditions. After the oxidation of BC0, the C-O peak of biochars increased, and the -COOH and C=C bond did not change significantly. This result indicates that the K2Cr2O7 oxidant can oxidize liable carbon on the pristine biochar surface but cannot oxidize the functional groups (e.g., C-O) of biochars to -COOH or increase the condensation degree of biochars. However, the -COOH of BCA25 and BCA65 were reduced after oxidation, and no differences were found in the C-O peak. This shows that K2Cr2O7 destroys the C-C bond connecting the -COOH to the modified biochars.
Raman spectroscopy can identify structural defects, such as edges, vacancies, and non-hexagonal units, and heteroatom doping on biochars [37]. Figure S2 shows all biochars have two characteristic peaks at −1350 cm−1 (D-band) and −1580 cm−1 (G-band), indicating that the biochars contained both amorphous C and graphitic C [38]. The ratio between the D-band and G-band indicates the disorder and defects in the biochar structure. The higher the ID/IG value of biochars, the greater the disorder and defects in the biochar structure [30]. ID/IG values of modified biochars are shown in Table 1. The ID/IG value of BCA65 displayed the most obvious increase among all modified biochars indicating that HNO3 oxidation could destroy the graphitized structure and increase the structural defects of biochars, which is also consistent with XPS results.

3.2. Chemical Oxidation Resistance of Modified Biochars

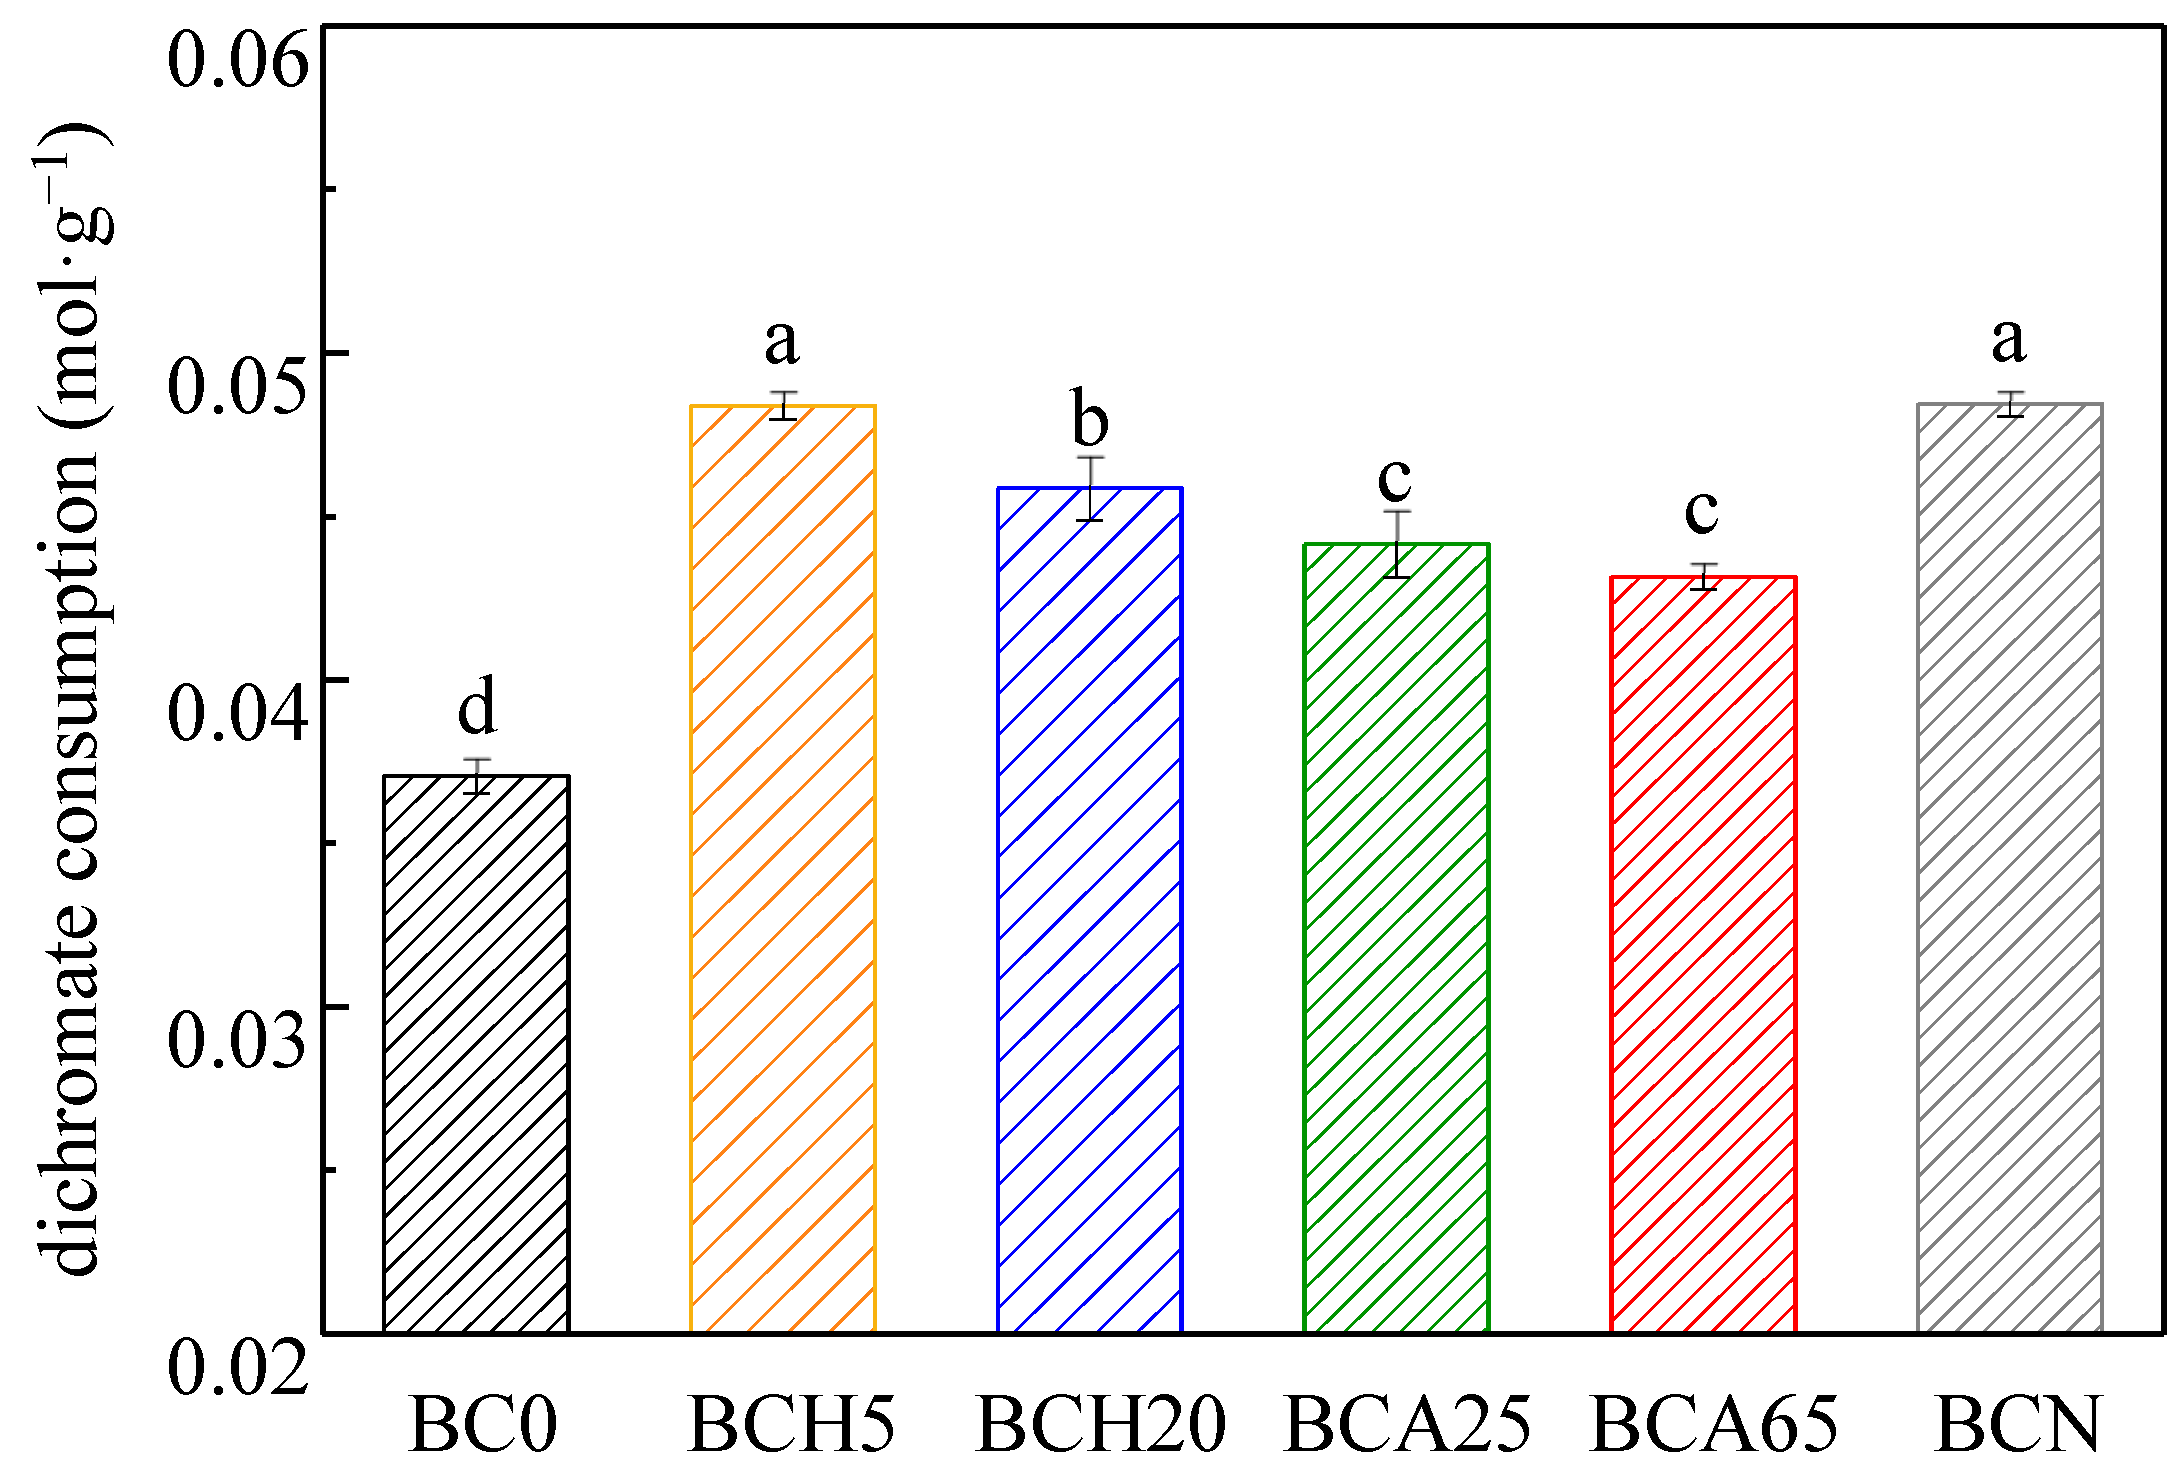
K2Cr2O7 is a commonly used strong oxidant for biochars and can quickly react with liable structures under acidic conditions. Many studies used this method to simulate the aging process of biochars in the natural environment [6,39]. K2Cr2O7 oxidation of biochars can stimulate the real mineralization of biochars in the soil to a certain extent [40]. In this study, the consumption of K2Cr2O7 was calculated to represent the stability of modified biochars. The higher the consumption of K2Cr2O7 was, the lower the stability of tested biochars. In Figure 3, when comparing with the pristine biochars, the consumption of K2Cr2O7 clearly increased for all modified biochars, indicating that the stability of modified biochars to chemical oxidation decreased significantly. Among them, the highest K2Cr2O7 consumption of modified biochars is BCN and BCH5, about 30% higher than unmodified biochars. The K2Cr2O7 consumption of BCH20, BCA25, and BCA65 was 23.73%, 19.14%, and 16.47%, respectively, which were still higher than unmodified biochars.
The O/C value has been widely used in most studies to estimate the stability of biochars [41]. However, in this study, the O/C ratio of BCH5, BCH 20, and BC0 was the same, 0.16, and the consumption of K2Cr2O7 was significantly different. In addition, no correlation was found in the correlation analysis between the O/C ratio and the consumption of K2Cr2O7 (r = −0.107, p > 0.05) (Figure S3). Therefore, using the O/C ratio as an indicator to predict the chemical oxidation resistance of modified biochars is insufficient. For pristine biochars, the change in the O/C ratio only depended on pyrolysis temperature [18]. Research showed, by increasing pyrolysis temperature, O on the surface of biochars could fall off or migrate into the interior of biochars [42]. However, the O content of modified biochars was not affected only by the pyrolysis temperature; it also depended on the number of oxygen-containing functional groups introduced by the modification process (Table 1). Therefore, for functional groups modified biochars, the O/C ratio was not sensitive enough to show the stability difference.
The presence of minerals has been broadly accepted in that it could increase the stability of biochars [43,44]. This showed that the amorphous silicon in the poultry litter biochars at 450 °C could interact with C and prevent C from oxidation to a certain extent [14]. On the other hand, the presence of exogenous Ca had a negative effect on carbon aromatization at a low pyrolysis temperature (300 °C), thereby weakening the stability of biochars while increasing the pyrolysis temperature enhanced the stability of the carbon structure [31]. However, if phosphate and Ca are both present in the pyrolysis process, it could form thermally stable phosphorus complexes containing metaphosphate and C-O-PO3 groups, which improve the carbon stability in the soil environment. These groups can act as a physical barrier to block active carbon sites [45]. In this study, the obvious difference in stability between modified biochars and pristine biochars could be attributed to the protection of endogenous minerals. Acid modification removed the ash inside the pores of the biochars and reduced the protection of liable degradable organic carbon on the biochar, resulting in a decrease in stability. However, Table 1 shows that the ash contents of biochars after five different modification processes remained at 17%, but the consumption of K2Cr2O7 varied significantly (r = 0.599, p > 0.05). This was because the minerals remaining after modification were present in the inner sphere of the biochars, which the oxidant could not reach. Therefore, the minerals could not prevent oxidants from attaching to modified biochars.

3.3. Decisive Roles in the Stability of the Modified Biochar

As mentioned above, the O/C ratio and endogenous minerals cannot be used to predict the modified biochar stability. Therefore, Pearson correlation coefficient (PCC) analysis between the carbon stability and different modified biochars (BC0 is not involved) properties was conducted (Figure 4). IBI has suggested that the carbon stability in biochars could be predicted by the molar ratio of H/C [6]. However, there is no relationship between the H/C ratio and the consumption of K2Cr2O7 (r = 0.21, p > 0.05). This is because the harsh acid modification process could destroy the aromatic structure. Therefore, the molar ratio of the H/C ratio can no longer serve as a good indicator for modified biochars. The molar ratio of O/C, as another indicator, could represent the stability of biochars [14,22], but based on our study, there is no significant correlation between the O/C ratio and the consumption of K2Cr2O7 (r = −0.82, p >0.05). Instead, there is a significant negative correlation between the -COOH content (received by XPS and Boehm titration) and the K2Cr2O7 consumption (r = −0.90, r = −0.89, p < 0.05). -COOH are sufficiently oxidized functional groups, so it is easy to understand that the higher the content of -COOH on the biochar surface, the stronger the biochar stability. Xiao and Chen found that the straw biochar at 700 °C contained more C=O bonds than the straw biochar at 500 °C, showing higher overall stability [46]. Zhao et al. also reported the transformation of C-O to C=O and O-C=O, leading to a more stable state of biochars [47].
Another reason is that -COOH are electronegative, and the greater the content of the carboxyl group (received by XPS and Boehm titration), the stronger the surface electrostatic repulsion would present (r = −0.99, r = −0.91, p < 0.05) (Table 1) between environmental oxidizer (such as microorganisms [48],) and the surface of biochars. In addition, the pore diameter and the consumption of K2Cr2O7 also have a significant correlation (r = −0.91, p < 0.05). This may be due to the correlation wherein the higher the average pore size of the biochars, the lower the amount of liable degradable carbon remaining in the structure. Therefore, the modified biochars with a larger average pore size have strong stability. The surface -COOH of BCN is higher than that of BCH5, but its stability is not significantly lower than BCH5. This is because the introduced -NH2 is easily oxidized on the surface of biochars, thus reducing the stability of BCN. The FTIR spectrum showed that the -NH2 peak decreased significantly after K2Cr2O7 oxidation, indicating it is easily oxidized on the biochars. Therefore, the type of functional group also played an important role in the stability of modified biochars.

3.4. Chemical Aging Reduced the Adsorption Capacity of Heavy Metals

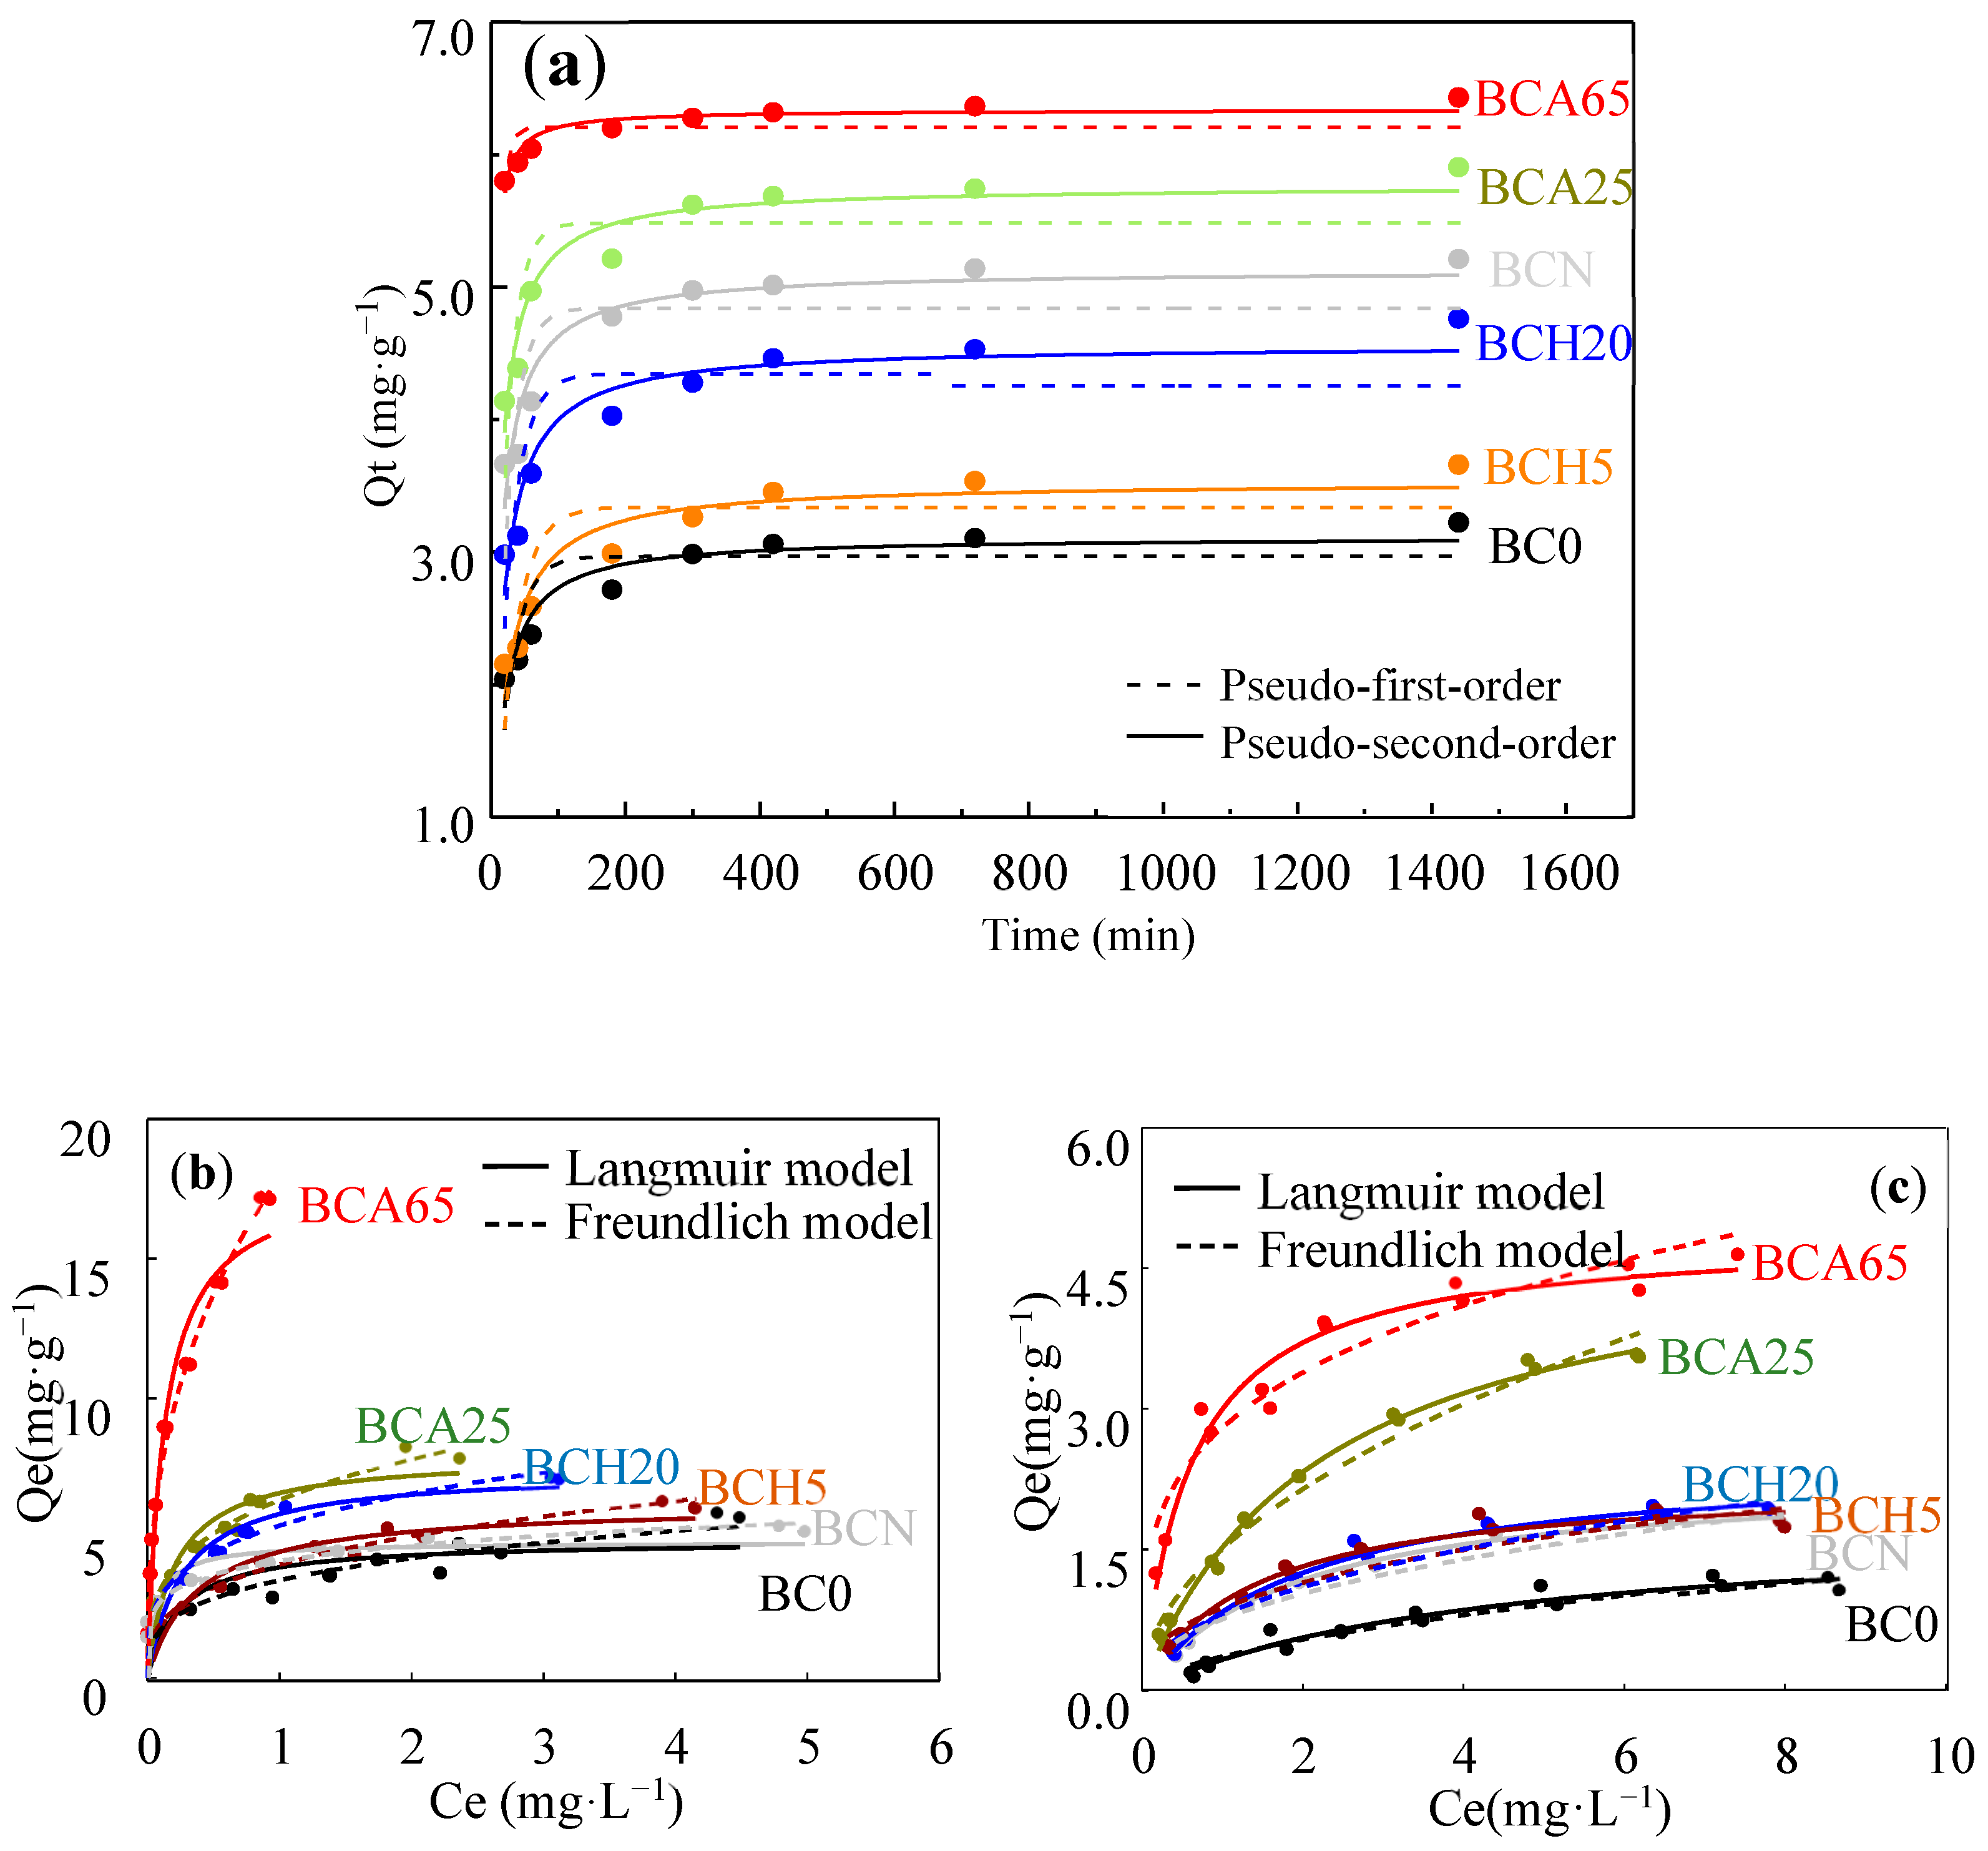
To investigate the adsorption mechanism and potential rate-controlling steps, including mass transport and surface reaction processes, the pseudo-first-order and pseudo-second-order models were used to fit the experimental data [49]. The values of the kinetic parameters and the correlation coefficients were obtained (Table S2). The kinetic fitting of the adsorption curve for Cd2+ is shown in Figure 5a, which suggests that the pseudo-second-order kinetic model fits the experimental data with an R2 > 0.9. Hence, the pseudo-second-order model could be applied to predict the adsorption kinetic of oxidized modified biochars, which reveals the chemisorption rate control mechanism [50,51].
Langmuir and Freundlich isotherm models were used to describe the adsorption isotherms of biochars [52]. Table S3 shows the parameters of the isotherm model of six biochars modified to Cd2+ before and after oxidation. The Freundlich model can best describe the Cd2+ adsorption behavior on oxidized modified biochars since it presented a higher R2. The Cd2+ adsorption on functional groups by modified biochars can be considered multilayer adsorption on internal and external surfaces. This result indicated that the adsorption energy distribution was uneven on the modified biochar surface [53]. However, after modified biochars were oxidized by K2Cr2O7, the Langmuir model can best describe Cd2+ adsorption behavior, indicating a monolayer adsorption process [54]. This interesting adsorption behavior change was due to the disappearance of functional groups on the surface of modified biochars caused by oxidation, which evened the adsorption energy distribution on the biochar surface. In addition, oxidation could lead to a reduction in pores of modified biochars, and the homogenization of the surface structure could lead to the average distribution of adsorption energy. Compared with BC0, the adsorption capacity of BCA65 for Cd2+ increased by 14.09 mg·g−1. In addition, the adsorption capacity of biochars was significantly correlated with its -COOH content (r = 0.93, p < 0.05) (Figure S4). Moreover, the carboxyl group shown in FTIR spectra (Figure 2b) can also correspond to the content analyzed by the Boehm titrated and XPS spectra. This showed that the modified biochars mainly depend on the surface carboxyl functional group to remove heavy metal from the aqueous solution [20]. After the modified biochars were oxidized, the -COOH on the surface decreased, resulting in a decrease in the maximum adsorption capacity of Cd2+. This result stated that -COOH would complex with Cd2+ and lead to the removal of Cd2+ from the solution [50,55]. The maximum adsorption capacities of BCA25 and BCA65 were reduced from 7.42 and 18.15 mg·g−1 to 4.95 and 4.86 mg·g−1 after oxidation, and the maximum adsorption capacities of BCH5, BCH20, and BCN were reduced from 6.21, 7.95 and 4.83 mg·g−1 to 2.29, 2.50 and 2.24 mg·g−1 after oxidation, respectively. These results showed that aging leads to a loss in the adsorption performance of oxygen-functional modified biochars. In this study, the FTIR spectrum (Figure 2b) shows that when the -COOH on the surface was further oxidized, the C-C bond between the -COOH and the carbon matrix was broken, resulting in the fall of -COOH from the biochar surface, leading to an obvious decline in the adsorption capacity of Cd2+. Although a large amount of -COOH was shed by oxidation on the surface of BCA25 and BCA65, the content of -COOH remained higher than that of other modified biochars. Most previous studies have shown that the original biochars can improve the fixation of heavy metals after aging [56,57]. Still, Meng et al. showed that four aging treatments (combined aging, dry-wet cycling, acidification, and freeze-thaw cycling) negatively affect the long-term immobilization of cadmium in soil [58]. This further revealed that the adsorption function of modified biochars is not stable. After modified biochars are added to the soil, they can be oxidized by oxidizing substances such as reactive oxygen species in the environment; therefore, the adsorption capacity changes accordingly.

4. Conclusions

In this study, by comparing the less prone to oxidation capacity of the modified biochars treated with H2O2, HNO3, and amino groups, it was clearly shown that the less prone to oxidation capacity of functionally modified biochars decreased, which was due to the removal of ash. The -COOH content rather than the O/C ratio was crucial for modified biochar stability. Surface charges and a homogeneous surface of modified biochars can reduce their contact with oxidizers such as dichromate, which protect them from further oxidation. In addition, -NH2 was easily oxidized on the surface of biochars; thus, the type of functional groups also played an important role in the stability of modified biochars. Therefore, the order of stability of functionally modified biochars is HNO3-modified > H2O2-modified > amino-modified. Moreover, the adsorption property of modified biochars was significantly reduced after oxidation, and the adsorption mechanism changed from multilayer adsorption to monolayer adsorption. The maximum adsorption capacity of BCA65 decreased from 18.15 mg·g−1 to 4.86 mg·g−1. The above results revealed that the stability and adsorption performance of modified biochars is not as stable as we expected. Therefore, in the design and preparation of modified biochars in the future, we should comprehensively consider the stability and sustainability of the structure and function of modified biochars in the environment.

Supplementary Materials

The following supporting information can be downloaded at: https://www.mdpi.com/article/10.3390/su15107745/s1, Table S1: Elemental content ratio of elemental analysis and XPS analysis of different biochars; Table S2: Fitting of adsorption kinetics data of different biochars; Table S3: Fitting of adsorption isotherms data of different biochars; Figure S1: C1s of XPS spectrum of different modified biochars; Figure S2: Raman spectrum of different modified biochars; Figure S3: Relationship between CHN O/C ratio of pristine, modified biochars, and their consumption of potassium dichromate; Figure S4: Relationship between Cd2+ adsorption capacity of modified biochars and their carboxyl functional groups.

Author Contributions

Conceptualization, methodology, writing—original draft, Z.Z.; writing—review & editing, conceptualization, supervision, data curation, W.D. (Wenyan Duan); investigation, validation, Z.C.; investigation, formal analysis, W.D. (Wei Du); supervision, data curation, validation, F.C.; validation, F.L.; writing—review, funding acquisition, P.O. All authors have read and agreed to the published version of the manuscript.

Funding

This work was supported by the National Natural Science Foundation of China (41961134002, 41807377, 41907300) and Yunnan Major Scientific and Technological Projects (grant NO. 202102AG050032).

Institutional Review Board Statement

Not applicable.

Informed Consent Statement

Not applicable.

Data Availability Statement

Not applicable.

Conflicts of Interest

The authors declare no conflict of interest.

References

  1. Xie, Y.; Wang, L.; Li, H.; Westholm, L.J.; Carvalho, L.; Thorin, E.; Yu, Z.; Yu, X.; Skreiberg, O. A critical review on production, modification and utilization of biochar. J. Anal. Appl. Pyrolysis 2022, 161, 105405. [Google Scholar] [CrossRef]
  2. Jin, J.; Sun, K.; Wang, Z.; Han, L.; Du, P.; Wang, X.; Xing, B. Effects of chemical oxidation on phenanthrene sorption by grass- and manure-derived biochars. Sci. Total Environ. 2017, 598, 789–796. [Google Scholar] [CrossRef]
  3. Wang, B.; Gao, B.; Fang, J. Recent advances in engineered biochar productions and applications. Crit. Rev. Environ. Sci. Technol. 2017, 47, 2158–2207. [Google Scholar] [CrossRef]
  4. Wang, H.; Gao, B.; Wang, S.; Fang, J.; Xue, Y.; Yang, K. Removal of Pb(II), Cu(II), and Cd(II) from aqueous solutions by biochar derived from KMnO4 treated hickory wood. Bioresour. Technol. 2015, 197, 356–362. [Google Scholar] [CrossRef] [PubMed]
  5. Zhang, H.; Yue, X.; Li, F.; Xiao, R.; Zhang, Y.; Gu, D. Preparation of rice straw-derived biochar for efficient cadmium removal by modification of oxygen-containing functional groups. Sci. Total Environ. 2018, 631–632, 795–802. [Google Scholar] [CrossRef]
  6. Leng, L.; Huang, H.; Li, H.; Li, J.; Zhou, W. Biochar stability assessment methods: A review. Sci. Total Environ. 2019, 647, 210–222. [Google Scholar] [CrossRef] [PubMed]
  7. Singh, B.P.; Cowie, A.L.; Smernik, R.J. Biochar carbon stability in a clayey soil as a function of feedstock and pyrolysis temperature. Environ. Sci. Technol. 2012, 46, 11770–11778. [Google Scholar] [CrossRef] [PubMed]
  8. Zimmerman, A.R. Abiotic and microbial oxidation of laboratory-produced black carbon (biochar). Environ. Sci. Technol. 2010, 44, 1295–1301. [Google Scholar] [CrossRef] [PubMed]
  9. Baronti, S.; Vaccari, F.P.; Miglietta, F.; Calzolari, C.; Lugato, E.; Orlandini, S.; Pini, R.; Zulian, C.; Genesio, L. Impact of biochar application on plant water relations in Vitis vinifera (L.). Eur. J. Agron. 2014, 53, 38–44. [Google Scholar] [CrossRef]
  10. LeCroy, C.; Masiello, C.A.; Rudgers, J.A.; Hockaday, W.C.; Silberg, J.J. Nitrogen, biochar, and mycorrhizae: Alteration of the symbiosis and oxidation of the char surface. Soil Biol. Biochem. 2013, 58, 248–254. [Google Scholar] [CrossRef]
  11. Cheng, C.-H.; Lehmann, J.; Engelhard, M.H. Natural oxidation of black carbon in soils: Changes in molecular form and surface charge along a climosequence. Geochim. Cosmochim. Acta 2008, 72, 1598–1610. [Google Scholar] [CrossRef]
  12. Spokas, K.A. Review of the stability of biochar in soils: Predictability of O:C molar ratios. Carbon Manag. 2010, 1, 289–303. [Google Scholar] [CrossRef]
  13. Schmidt, H.P.; Bucheli, T.; Kammann, C.; Glaser, B.; Abiven, S.; Leifeld, J. European Biochar Certificate-Guidelines for a Sustainable Production of Biochar; European Biochar Foundation (EBC): Arbaz, Switzerland, 2016. [Google Scholar] [CrossRef]
  14. Han, L.F.; Ro, K.S.; Wang, Y.; Sun, K.; Sun, H.R.; Libra, J.A.; Xing, B.S. Oxidation resistance of biochars as a function of feedstock and pyrolysis condition. Sci. Total Environ. 2018, 616, 335–344. [Google Scholar] [CrossRef] [PubMed]
  15. Ippolito, J.A.; Cui, L.Q.; Kammann, C.; Wrage-Monnig, N.; Estavillo, J.M.; Fuertes-Mendizabal, T.; Cayuela, M.L.; Sigua, G.; Novak, J.; Spokas, K.; et al. Feedstock choice, pyrolysis temperature and type influence biochar characteristics: A comprehensive meta-data analysis review. Biochar 2020, 2, 421–438. [Google Scholar] [CrossRef]
  16. Tan, L.; Ma, Z.; Yang, K.; Cui, Q.; Wang, K.; Wang, T.; Wu, G.-L.; Zheng, J. Effect of three artificial aging techniques on physicochemical properties and Pb adsorption capacities of different biochars. Sci. Total Environ. 2019, 699, 134223. [Google Scholar] [CrossRef]
  17. Zheng, X.; Ma, X.; Hua, Y.; Li, D.; Xiang, J.; Song, W.; Dong, J. Nitric acid-modified hydrochar enhance Cd2+ sorption capacity and reduce the Cd2+ accumulation in rice. Chemosphere 2021, 284, 131261. [Google Scholar] [CrossRef] [PubMed]
  18. Xu, Z.; He, M.; Xu, X.; Cao, X.; Tsang, D.C. Impacts of different activation processes on the carbon stability of biochar for oxidation resistance. Bioresour. Technol. 2021, 338, 125555. [Google Scholar] [CrossRef]
  19. Siatecka, A.; Rozylo, K.; Ok, Y.S.; Oleszczuk, P. Biochars ages differently depending on the feedstock used for their production: Willow- versus sewage sludge-derived biochars. Sci. Total Environ. 2021, 789, 147458. [Google Scholar] [CrossRef]
  20. Jin, J.; Li, S.; Peng, X.; Liu, W.; Zhang, C.; Yang, Y.; Han, L.; Du, Z.; Sun, K.; Wang, X. HNO3 modified biochars for uranium (VI) removal from aqueous solution. Bioresour. Technol. 2018, 256, 247–253. [Google Scholar] [CrossRef]
  21. Yang, G.-X.; Jiang, H. Amino modification of biochar for enhanced adsorption of copper ions from synthetic wastewater. Water Res. 2014, 48, 396–405. [Google Scholar] [CrossRef]
  22. Liu, G.; Pan, X.; Ma, X.; Xin, S.; Xin, Y. Effects of feedstock and inherent mineral components on oxidation resistance of biochars. Sci. Total Environ. 2020, 726, 138672. [Google Scholar] [CrossRef] [PubMed]
  23. Chen, D.; Yu, X.; Song, C.; Pang, X.; Huang, J.; Li, Y. Effect of pyrolysis temperature on the chemical oxidation stability of bamboo biochar. Bioresour. Technol. 2016, 218, 1303–1306. [Google Scholar] [CrossRef]
  24. Xu, Z.; Xu, X.; Zhang, Y.; Yu, Y.; Cao, X. Pyrolysis-temperature depended electron donating and mediating mechanisms of biochar for Cr(VI) reduction. J. Hazard. Mater. 2020, 388, 121794. [Google Scholar] [CrossRef] [PubMed]
  25. Li, F.; Gui, X.; Ji, W.; Zhou, C. Capacity and potential mechanisms of Cd(II) adsorption from aqueous solution by blue algae-derived biochars. Chemosphere 2020, 251, 126335. [Google Scholar] [CrossRef]
  26. Feizbakhshan, M.; Hashisho, Z.; Crompton, D.; Anderson, J.E.; Nichols, M. Effect of activated carbon’s pore size distribution on oxygen induced heel build-up. J. Hazard. Mater. 2021, 126905. [Google Scholar] [CrossRef]
  27. Fernando, J.C.; Peiris, C.; Navarathna, C.M.; Gunatilake, S.R.; Welikala, U.; Wanasinghe, S.T.; Madduri, S.B.; Jayasinghe, S.; Mlsna, T.E.; Hassan, E.B.; et al. Nitric acid surface pre-modification of novel Lasia spinosa biochar for enhanced methylene blue remediation. Groundw. Sustain. Dev. 2021, 14, 100603. [Google Scholar] [CrossRef]
  28. Peiris, C.; Nayanathara, O.; Navarathna, C.M.; Jayawardhana, Y.; Nawalage, S.; Burk, G.; Karunanayake, A.G.; Madduri, S.B.; Vithanage, M.; Kaumal, M.N.; et al. The influence of three acid modifications on the physicochemical characteristics of tea-waste biochar pyrolyzed at different temperatures: A comparative study. RSC Adv. 2019, 9, 17612–17622. [Google Scholar] [CrossRef]
  29. Nzediegwu, C.; Naeth, M.A.; Chang, S.X. Feedstock type drives surface property, demineralization and element leaching of nitric acid-activated biochars more than pyrolysis temperature. Bioresour. Technol. 2022, 344, 126316. [Google Scholar] [CrossRef]
  30. Fan, Q.; Sun, J.; Chu, L.; Cui, L.; Quan, G.; Yan, J.; Hussain, Q.; Iqbal, M. Effects of chemical oxidation on surface oxygen-containing functional groups and adsorption behavior of biochar. Chemosphere 2018, 207, 33–40. [Google Scholar] [CrossRef]
  31. Liu, X.-Q.; Ding, H.-S.; Wang, Y.-Y.; Liu, W.-J.; Jiang, H. Pyrolytic temperature dependent and ash catalyzed formation of sludge char with ultra-high adsorption to 1-naphthol. Environ. Sci. Technol. 2016, 50, 2602–2609. [Google Scholar] [CrossRef] [PubMed]
  32. Yakout, S.M.; Daifullah, A.M.; El-Reefy, S.A. Pore structure characterization of chemically modified biochar derived from rice straw. Environ. Eng. Manag. J. 2015, 14, 473–480. [Google Scholar] [CrossRef]
  33. Xue, Y.; Gao, B.; Yao, Y.; Inyang, M.; Zhang, M.; Zimmerman, A.R.; Ro, K.S. Hydrogen peroxide modification enhances the ability of biochar (hydrochar) produced from hydrothermal carbonization of peanut hull to remove aqueous heavy metals: Batch and column tests. Chem. Eng. J. 2012, 200–202, 673–680. [Google Scholar] [CrossRef]
  34. Oliveira, G.A.; Gevaerd, A.; Mangrich, A.S.; Marcolino-Junior, L.H.; Bergamini, M.F. Biochar obtained from spent coffee grounds: Evaluation of adsorption properties and its application in a voltammetric sensor for lead (II) ions. Microchem. J. 2021, 165, 106114. [Google Scholar] [CrossRef]
  35. Qian, L.; Chen, B. Interactions of aluminum with biochars and oxidized biochars: Implications for the biochar aging process. J. Agric. Food. Chem. 2014, 62, 373–380. [Google Scholar] [CrossRef]
  36. Khan, M.A.; Khan, S.; Ding, X.; Khan, A.; Alam, M. The effects of biochar and rice husk on adsorption and desorption of cadmium on to soils with different water conditions (upland and saturated). Chemosphere 2018, 193, 1120–1126. [Google Scholar] [CrossRef]
  37. Zheng, Y.; Jiao, Y.; Ge, L.; Jaroniec, M.; Qiao, S.Z. Two-step boron and nitrogen doping in graphene for enhanced synergistic catalysis. Angew. Chem. Int. Edit. 2013, 52, 3110–3116. [Google Scholar] [CrossRef]
  38. Qu, X.; Fu, H.; Mao, J.; Ran, Y.; Zhang, D.; Zhu, D. Chemical and structural properties of dissolved black carbon released from biochars. Carbon 2016, 96, 759–767. [Google Scholar] [CrossRef]
  39. Nan, H.; Zhao, L.; Yang, F.; Liu, Y.; Xiao, Z.; Cao, X.; Qiu, H. Different alkaline minerals interacted with biomass carbon during pyrolysis: Which one improved biochar carbon sequestration? J. Clean. Prod. 2020, 255, 120162. [Google Scholar] [CrossRef]
  40. Liu, B.; Liu, Q.; Wang, X.; Bei, Q.; Zhang, Y.; Lin, Z.; Liu, G.; Zhu, J.; Hu, T.; Jin, H.; et al. A fast chemical oxidation method for predicting the long-term mineralization of biochar in soils. Sci. Total Environ. 2020, 718, 137390. [Google Scholar] [CrossRef]
  41. Chen, J.; Wang, P.; Ding, L.; Yu, T.; Leng, S.; Chen, J.; Fan, L.; Li, J.; Wei, L.; Li, J.; et al. The comparison study of multiple biochar stability assessment methods. J. Anal. Appl. Pyrolysis 2021, 156, 105070. [Google Scholar] [CrossRef]
  42. Manyà, J.J.; Ortigosa, M.A.; Laguarta, S.; Manso, J.A. Experimental study on the effect of pyrolysis pressure, peak temperature, and particle size on the potential stability of vine shoots-derived biochar. Fuel 2014, 133, 163–172. [Google Scholar] [CrossRef]
  43. Fang, Y.; Singh, B.; Singh, B.P.; Krull, E. Biochar carbon stability in four contrasting soils. Eur. J. Soil. Sci. 2014, 65, 60–71. [Google Scholar] [CrossRef]
  44. Yang, F.; Zhao, L.; Gao, B.; Xu, X.; Cao, X. The Interfacial Behavior between Biochar and Soil Minerals and Its Effect on Biochar Stability. Environ. Sci. Technol. 2016, 50, 2264–2271. [Google Scholar] [CrossRef] [PubMed]
  45. Rosas, J.M.; Ruiz-Rosas, R.; Rodriguez-Mirasol, J.; Cordero, T. Kinetic study of the oxidation resistance of phosphorus-containing activated carbons. Carbon 2012, 50, 1523–1537. [Google Scholar] [CrossRef]
  46. Xiao, X.; Chen, B. A direct observation of the fine aromatic clusters and molecular structures of biochars. Environ. Sci. Technol. 2017, 51, 5473–5482. [Google Scholar] [CrossRef]
  47. Zhao, L.; Cao, X.; Zheng, W.; Kan, Y. Phosphorus-assisted biomass thermal conversion: Reducing carbon loss and improving biochar stability. PLoS ONE 2014, 9, e115373. [Google Scholar] [CrossRef]
  48. Ren, X.; Sun, H.; Wang, F.; Cao, F. The changes in biochar properties and sorption capacities after being cultured with wheat for 3 months. Chemosphere 2016, 144, 2257–2263. [Google Scholar] [CrossRef]
  49. Zhang, C.; Shan, B.; Tang, W.; Zhu, Y. Comparison of cadmium and lead sorption by Phyllostachys pubescens biochar produced under a low-oxygen pyrolysis atmosphere. Bioresour. Technol. 2017, 238, 352–360. [Google Scholar] [CrossRef]
  50. Chen, D.; Wang, X.; Wang, X.; Feng, K.; Su, J.; Dong, J. The mechanism of cadmium sorption by sulphur-modified wheat straw biochar and its application cadmium-contaminated soil. Sci. Total Environ. 2020, 714, 136550. [Google Scholar] [CrossRef]
  51. Zhou, Q.; Liao, B.; Lin, L.; Qiu, W.; Song, Z. Adsorption of Cu(II) and Cd(II) from aqueous solutions by ferromanganese binary oxide–biochar composites. Sci. Total Environ. 2018, 615, 115–122. [Google Scholar] [CrossRef]
  52. Liu, T.; Lawluvy, Y.; Shi, Y.; Ighalo, J.O.; He, Y.; Zhang, Y.; Yap, P.-S. Adsorption of cadmium and lead from aqueous solution using modified biochar: A review. J. Environ. Chem. Eng. 2022, 10, 106502. [Google Scholar] [CrossRef]
  53. Sun, L.; Gong, P.; Sun, Y.; Qin, Q.; Song, K.; Ye, J.; Zhang, H.; Zhou, B.; Xue, Y. Modified chicken manure biochar enhanced the adsorption for Cd2+ in aqueous and immobilization of Cd in contaminated agricultural soil. Sci. Total Environ. 2022, 851, 158252. [Google Scholar] [CrossRef] [PubMed]
  54. Chang, R.; Sohi, S.P.; Jing, F.; Liu, Y.; Chen, J. A comparative study on biochar properties and Cd adsorption behavior under effects of ageing processes of leaching, acidification and oxidation. Environ. Pollut. 2019, 254, 113123. [Google Scholar] [CrossRef] [PubMed]
  55. Sun, J.; Lian, F.; Liu, Z.; Zhu, L.; Song, Z. Biochars derived from various crop straws: Characterization and Cd(II) removal potential. Ecotoxicol. Environ. Saf. 2014, 106, 226–231. [Google Scholar] [CrossRef] [PubMed]
  56. Xu, Z.; Xu, X.; Tsang, D.C.W.; Cao, X. Contrasting impacts of pre- and post-application aging of biochar on the immobilization of Cd in contaminated soils. Environ. Pollut. 2018, 242, 1362–1370. [Google Scholar] [CrossRef] [PubMed]
  57. Fan, J.; Cai, C.; Chi, H.; Reid, B.J.; Coulon, F.; Zhang, Y.; Hou, Y. Remediation of cadmium and lead polluted soil using thiol-modified biochar. J. Hazard. Mater. 2020, 388, 122037. [Google Scholar] [CrossRef] [PubMed]
  58. Meng, Z.; Huang, S.; Laird, D.A.; Wu, J.; Lin, Z. Identifying key processes driving Cd long-term adsorption and immobilization by biochar in soils and evaluating combined aging effects under simulated local climates. J. Environ. Chem. Eng. 2022, 10, 108636. [Google Scholar] [CrossRef]
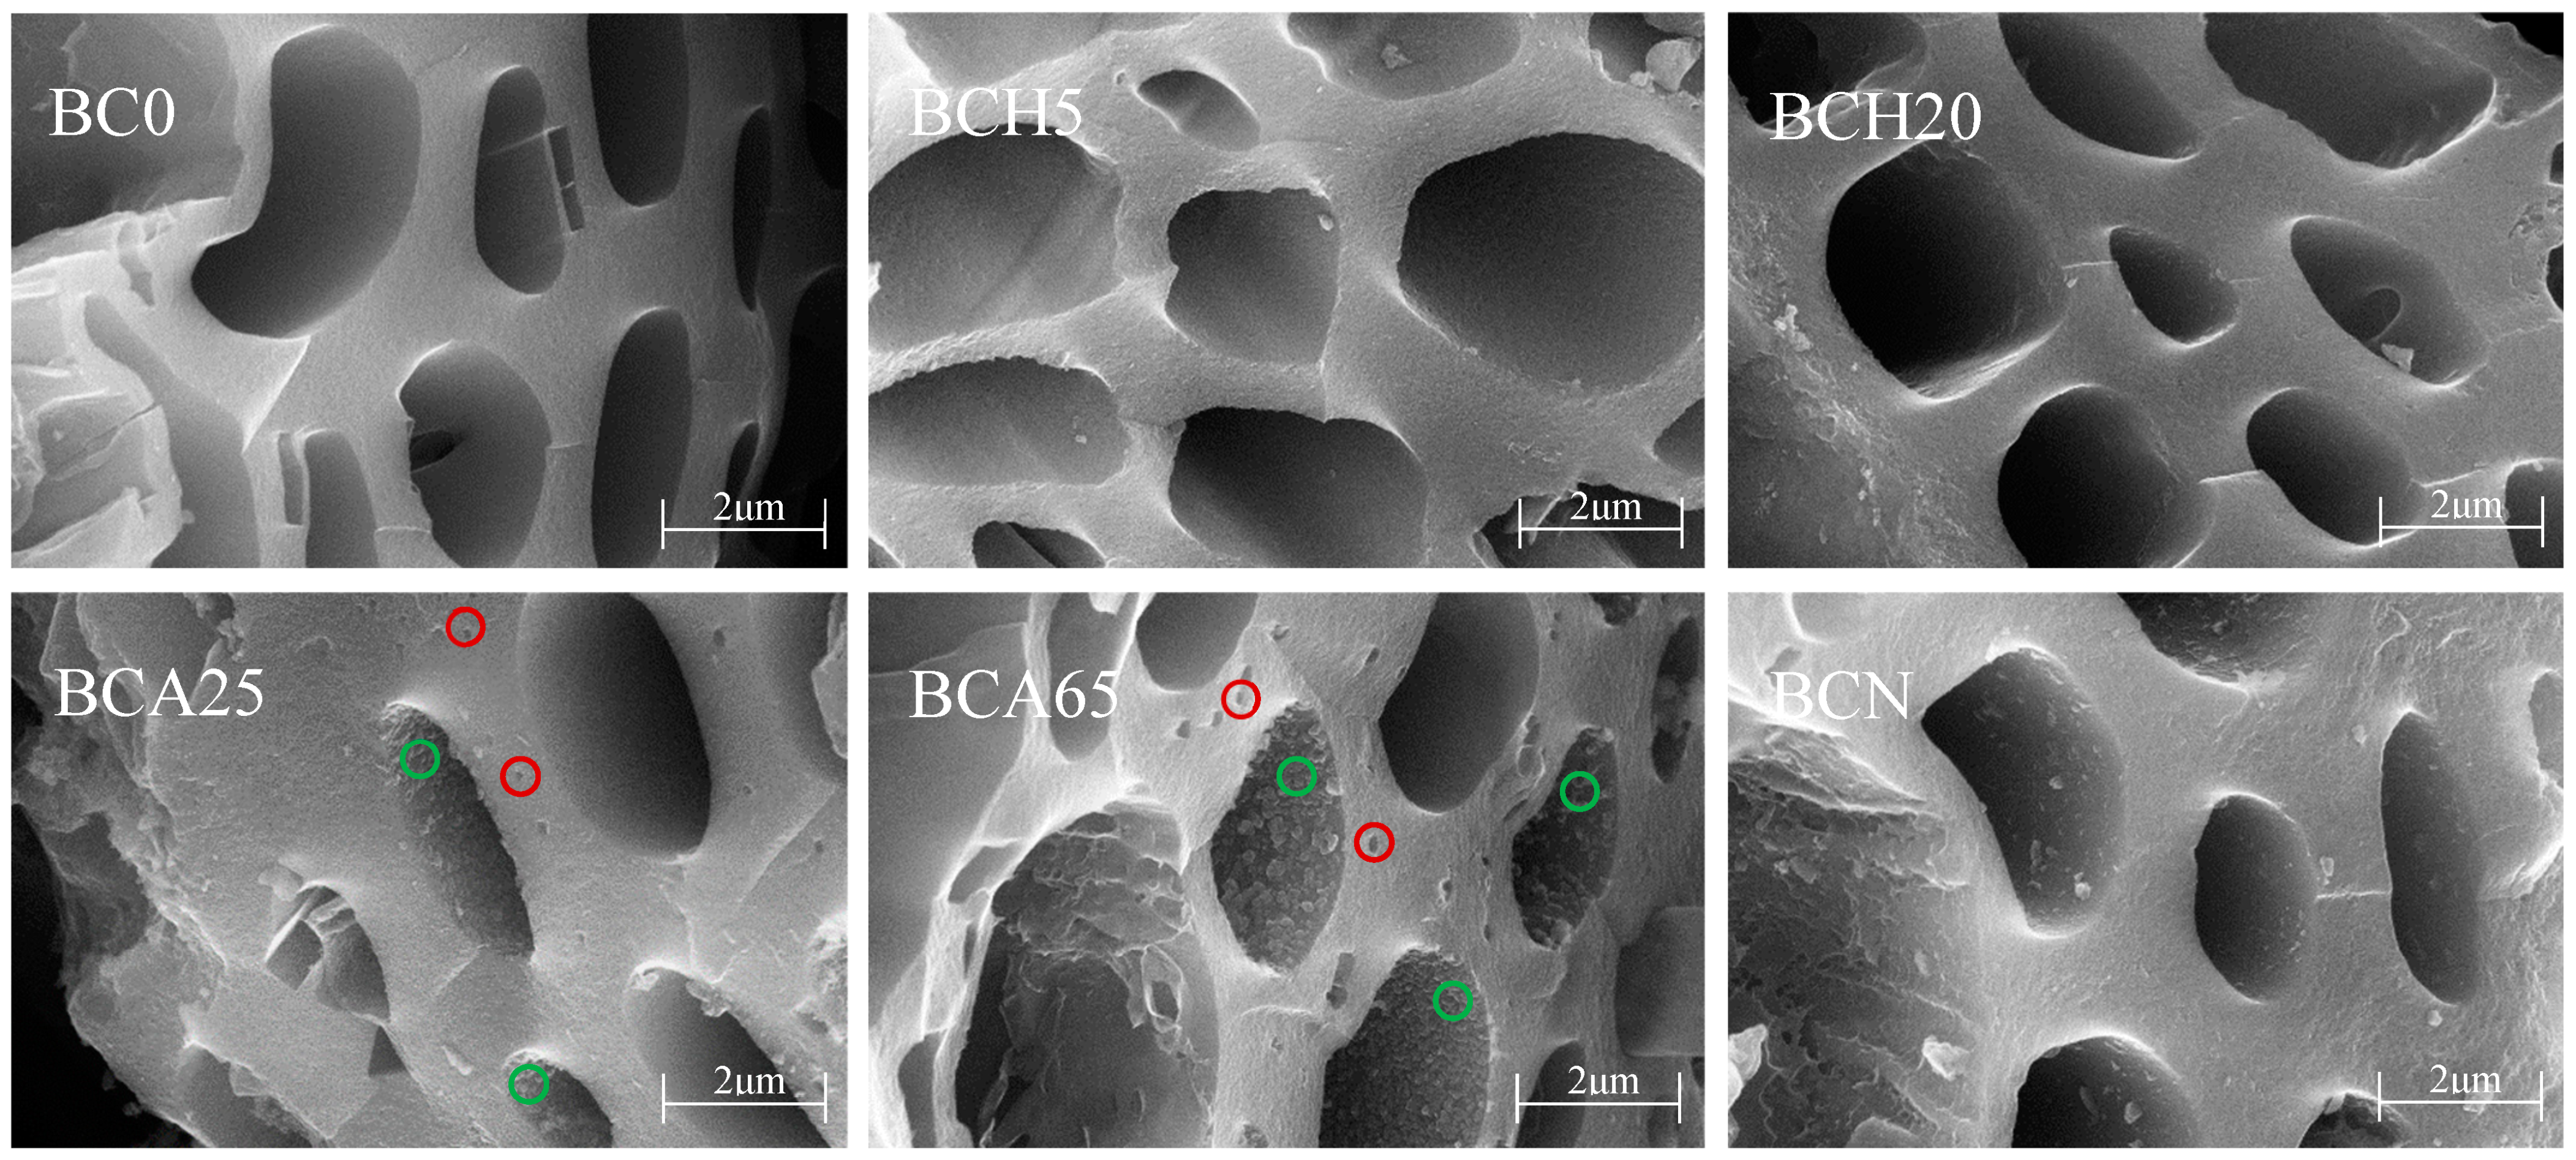
Figure 1. SEM images of different modified biochars. Note: The green circles indicate the relatively rough internal pore structure created by oxidation, and the red circles indicate the pores formed by oxidation on the cross-section area.
Sustainability 15 07745 g001
Figure 2. FTIR spectra of different modified biochars before (a) and after (b) oxidation by potassium dichromate.
Sustainability 15 07745 g002
Figure 3. Molar amount of potassium dichromate consumed per gram of different biochars. The different lowercase letters indicate a significant difference in the data (p < 0.05).
Sustainability 15 07745 g003
Figure 4. Pearson correlation matrix of the carbon stability and different physiochemical properties of modified biochars.
Sustainability 15 07745 g004
Figure 5. Fitting curve of adsorption kinetics (a) and adsorption isotherms before (b) and after (c) oxidation of different modified biochars.
Sustainability 15 07745 g005
Table 1. Basic properties of biochars.
Biochar TypeBC0BCH5BCH20BCA25BCA65BCN
CHN H/C0.49 ± 0.01 b0.41 ± 0.02 c0.42 ± 0.02 c0.44 ± 0.01 c0.49 ± 0.00 b0.59 ± 0.02 a
CHN O/C0.16 ± 0.01 d0.15 ± 0.00 e0.16 ± 0.00 de0.33 ± 0.00 b0.47 ± 0.00 a0.22 ± 0.01 c
XPS O/C0.230.240.250.360.470.35
Ash content25.36%17.80%17.08%17.56%17.55%14.78%
SSA (cm2·g−1)132.3594.8337.525.945.3225.81
Pore volume (cm3·g−1)0.0890.0710.0390.0150.0130.025
Average pore size (nm)2.702.994.1810.229.843.91
ID/IG0.710.760.780.830.850.83
Zeta (mV)2.42 −0.21−1.31 −2.09−4.05 −0.60
Note: CHN represents the data measured using an elemental analyzer, and XPS represents the data measured by the X-ray diffraction energy spectrum. The lowercase letters in the same row indicate a significant difference in the data (p < 0.05). CHN H/C passed a single-factor ANOVA test. F(5,6) = 23.31 > F0.05(5,6) = 4.39. CHN O/C passed a single-factor ANOVA test. F(5,6) = 2251.16 > F0.05(5,6) = 4.39.
Table 2. The XPS spectra and Boehm titration of functional groups of biochars.
Biochar TypeC-C/C=C% XC-O% XC=O% X-COOH% X-COOH B
(mmol/g)
BC088.228.232.111.440.07±0.00 d
BCH572.5215.577.724.190.09 ± 0.07 d
BCH2067.8419.257.005.910.43 ± 0.01 c
BCA2566.9413.7510.019.301.03 ± 0.08 b
BCA6562.7011.5710.4315.302.01 ± 0.18 a
BCN63.2919.3612.584.780.39 ± 0.00 c
Note: X represents the data measured by X-ray diffraction energy spectrum, and B represents the data measured by Boehm titration. The different lowercase letters in the same column indicate a significant difference in the data (p < 0.05). -COOH B passed a single-factor ANOVA test. F(5,6) = 152.57 > F0.05(5,6) = 4.39.
Disclaimer/Publisher’s Note: The statements, opinions and data contained in all publications are solely those of the individual author(s) and contributor(s) and not of MDPI and/or the editor(s). MDPI and/or the editor(s) disclaim responsibility for any injury to people or property resulting from any ideas, methods, instructions or products referred to in the content.