Abstract
Providing high-quality public transport services and enhancing passenger experiences require efficient urban rail transit connectivity; however, passengers’ perceived transfer distance at urban rail transit stations may differ from the actual transfer distance, resulting in inconvenience and dissatisfaction. To address this issue, this study proposed a novel machine learning framework that measured the perceived transfer distance in urban rail transit stations and analyzed the significance of each influencing factor. The framework introduced the Ratio of Perceived Transfer Distance Deviation (R), which was evaluated using advanced XGBoost and SHAP models. To accurately evaluate R, the proposed framework considered 32 indexes related to passenger personal attributes, transfer facilities, and transfer environment. The study results indicated that the framework based on XGBoost and SHAP models can effectively measure the R of urban rail transit passengers. Key factors that affected R included the Rationality of Signs and Markings, Ratio of Escalators Length, Rationality of Traffic Organization outside The Station, Ratio of Stairs Length, and Degree of Congestion on Passageways. These findings can provide valuable theoretical references for designing transfer facilities and improving transfer service levels in urban rail transit stations.
1. Introduction
The growth of urban rail transit system in China has been remarkable since the turn of the 21st century. The Ministry of Transport of China reported that, as of December 2022, there are 290 urban rail transit lines in operation across mainland China, serving 1.16 billion passengers and covering a total distance of 9584 km. This represents a significant increase of 226.5 km from the previous month, demonstrating the rapid and continuous expansion and development of the urban rail transit system in China [1].
The rapid growth of urban rail transit has given rise to two critical challenges: (1) meeting passengers’ increasing demands for safety, speed, and comfort, and (2) maximizing the commercial potential of urban rail transportation. Addressing these challenges has become a popular research topic among governments and scholars, with many focusing on improving transfer facilities.
Transfer distance at an urban rail transit station is a crucial indicator of service level and passenger satisfaction, typically measured as the actual transfer distance; however, previous research has shown that not all transfer distances are equal. Yao [2] optimized the facility layout in urban rail transit stations to reduce the actual transfer distance. Olszewski [3] introduced the concept of Equivalent Walking Distance, which accounts for obstacles encountered during walking as penalties added to the actual walking distance. The impact of the transfer environment and facilities (such as the Number of Escalators [4], Intersection Density [5], and Facility Congestion [6]) on passenger experience has also been explored in previous research; however, the penalties for poor transfer are often set as fixed values that do not account for differences in the environment or passengers, thus oversimplifying the hindrances in the transfer process.
Perceived transfer distance has been shown to be a more reliable indicator of passengers’ transfer experience and satisfaction with the service compared to actual transfer distance or equivalent walking distance [7]. It refers to the distance between the pick-up and drop-off points of a transfer that passengers estimate based on their perception and experience, which can deviate significantly from the actual distance [7,8]. Furthermore, given individual differences and diverse travel experiences, residents within the same community may have varying perceptions of the actual transfer distance, leading to distinct preferences for urban rail transit travel.
Most people prefer a short transfer distance, and their perceived transfer distance can significantly influence their choice of transfer and even their decision to use urban rail transit [9]; however, a pedestrian-friendly environment can compensate for the inconvenience of a longer transfer distance [10]. For instance, safe intersections, good infrastructure, and attractive buildings can enable passengers to accept longer transfer distances [11,12].
Understanding how passengers estimate transfer distance is crucial for effective passenger flow management and urban rail transit station design and planning. Although research on perceived transfer distance in the field of urban rail transit is limited, findings from psychology, behavior, geography, and other fields on perceived walking distance could be used as references. Relevant literatures suggested that Personal Attributes, Route Characteristics, and Environmental Factors are among the main influencing factors.
Personal Attributes have been identified as influential factors in differentiating perceived distance. For instance, studies [13,14] have discovered that age affects distance estimation, with older travelers more likely to overestimate distance. Gender differences are also found in perceptions of length, with women tending to overestimate distance compared to men [15]. Additionally, travel frequency also have an impact on distance perception, although the effect is less pronounced [16]. Weight-bearing has also been shown to increase distance perception among travelers [17]. Moreover, emotions [18], attention [19], and familiarity with the space during travel [20] could affect judgments of distance.
Route Characteristics also play a crucial role in determining perceived transfer distance. Hess [8] found a positive correlation between the number of route intersections and the perceived distance in urban environments. Sadalla [21] found in a laboratory setting that routes with seven right-angle turns are perceived to be longer than routes with only two turns. Similarly, Kahl [22] suggested that children perceive segmented routes to be longer than continuous routes of the same length. Morgado [23] proposed that participants tend to overestimate distance when two locations are separated by obstacles, while segments without obstacles are relatively underestimated. Tenhundfeld [24] confirmed that perceived distance is longer on slopes, both uphill and downhill, compared to flat ground. The same conclusion is reached for estimating walking distance on stairs [25].
Environmental Factors affect perceived walking distance. For example, Sun [26] experimentally demonstrated that pedestrians are more likely to overestimate walking distances on routes without sheltered walkways. Similarly, Iosa’s study [27] pointed out that there are differences in distance estimation between indoors (single-level) and outdoors environments, with people more likely to underestimate distance in indoor environments. Winter [28] argued that vertical distance increases indoor distance estimation due to the increased complexity of indoor movement in multilevel environments.
The different methods used to assess perceived distance have included the Scaling Method, Regression Analysis [29], t-test, Logistic Regression [30], Graph Theory, and Routing Algorithm. Ankomah [31] used the Scaling Method and found that extroverted men who live in the community for a longer period of time have a more accurate perception of distance. Walmsley [32] demonstrated using Regression Analysis that tourists often overestimate the perceived distance compared to the actual distance. Zhou [33] identified several significant factors that affecte tourists’ perceived distance using independent sample t-test and single-factor analysis of variance, which includes personality, destination, presence of family and friends, purpose of travel, number of trips, and travel experience; however, the aforementioned methods may be less accurate and stable in comprehensively evaluating urban rail transit station transfer distance due to their insensitivity to non-linear relationships between indicators.
To address this issue, recent studies have proposed extreme gradient boosting (XGBoost) [34] and Shapley additive explanations (SHAP) models [35] as potential solutions. XGBoost is a scalable tree boosting system widely used by data scientists, which can provide state-of-the-art results for many problems. It is also a novel sparsity-aware algorithm for handling sparse data and a theoretically justified weighted quantile sketch for approximate learning. XGBoost has been widely used in various areas of transportation, such as traveler perception, traffic volume prediction, transportation safety, and risk analysis, and has achieved better results than traditional algorithms. Asadi-Shekari [36] introduced an algorithm based on XGBoost and analyzed the perceptions of vulnerable road users towards sharing the road with autonomous vehicles. The results showed that XGBoost is highly effective and accurate in predicting the views of cyclists or pedestrians. Liu [37] built a prediction model for bus–metro-transfer ridership based on XGBoost, and the results demonstrated that XGBoost outperforms linear models, random forests, and LightGBM in terms of fitting, accuracy, and stability. Yang [38] explored the relationships between built environment factors and the spatial distribution of freight truck-related crashes using XGBoost. The results showed that XGBoost has a strong ability to capture the nonlinear relationships between certain explanatory variables and the dependent variables. Alshboul [39] developed an ensemble machine learning technique (EMLT) that combines algorithms such as extreme gradient boosting (XGBoost), categorical boosting (CatBoost), k-nearest neighbor (kNN), light gradient boosting machine (LightGBM), artificial neural network (ANN), and decision tree (DT) to predict liquidated damages in highway construction projects. The results showed that, compared to other machine learning-based models, EMLT achieves the highest accuracy of 0.997; however, its application in the field of distance perception is still very limited, and this paper aims to bridge the gap.
Moreover, the use of a tree-based model, such as XGBoost, presents both benefits and drawbacks when compared to more easily interpretable models such as linear regression. Although linear regression models can be easily interpreted, they may not be able to capture the complex and non-linear relationships between predictors. Conversely, the XGBoost model has the ability to capture non-linear relationships and provides higher predictive accuracy, but its interpretability may be limited. In order to address this issue, our study employed SHAP values to explain the model’s predictions and obtained insights into the relative importance of different factors.
To sum up, this paper mainly focused on the perceived transfer distance of passengers, analyzing the influences of 32 different factors related to Passenger Personal Attributes, Transfer Facilities and Transfer Environment. Specifically, we utilized the XGBoost model to assess the perceived transfer distance of passengers, which was then used to evaluate the connection performance of urban rail transit stations. Meanwhile, we adopted the SHAP model to analyze the impact of various factors on passengers’ perceived transfer distance.
2. Index Quantification and Date Collection
2.1. Definition of the Ratio of Perceived Transfer Distance Deviation
In this paper, “transfer” refers to the movement process between the drop-off point of urban rail transit and the pick-up point of another modes of transportation. The Actual Transfer Distance () is the actual mileage of the transfer process. The subjective interpretation of this distance by passengers is represented by the variable Perceived Transfer Distance ().
To evaluate the transfer service level of urban rail transit stations and compare them regardless of actual transfer distance, this paper introduces the Ratio of Perceived Transfer Distance Deviation (). The equation for calculating R is shown in Equation (1) below,
where is the Ratio Of Perceived Transfer Distance Deviation; is the Perceived Transfer Distance, a scalar measured in meters; and is the Actual Transfer Distance, a scalar measured in meters.
A value of means passengers’ perceived transfer distance is longer than the actual distance, indicating low acceptability of the transfer process due to poor actual transfer conditions. The larger the R value, the worse the passenger experience. Conversely, when , the is shorter than what passengers anticipate based on daily experiences, indicating a high level of acceptability of the transfer process and better passenger experiences. At last, when , the fully matches what passengers anticipate, indicating that the actual transfer conditions are similar to the average level of passenger cognition.
2.2. Analysis of Influencing Factors
This study examined the perceptual mechanisms that influence transfer distance in the urban rail transit system from three aspects: Passenger Personal Attributes, Transfer Facilities, and Transfer Environment. Figure 1 summarizes all possible influencing factors, and Table 1 describes the factors in detail.
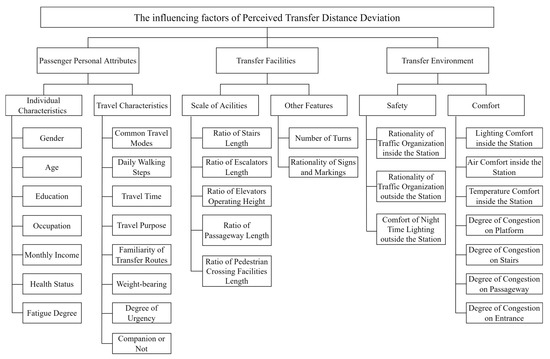
Figure 1.
The influencing factors of the Perceived Transfer Distance Deviation.

Table 1.
Codes and descriptions of influencing factors.
- (1)
- Passenger Personal Attributes
Two categories make up Passenger Personal Attributes: individual characteristics and travel characteristics. Individual characteristics include seven factors: Gender, Age, Education, Occupation, Monthly Income, Health Status, and Fatigue Level. Travel characteristics include eight factors: Common Travel Mode, Daily Walking Steps, Travel Time, Travel Purpose, Familiarity of Transfer Routes, Weight-bearing, Degree of Urgency, and Companion or Not.
- (2)
- Transfer Facilities
Transfer Facilities consist of two categories: facility scale and other features. Facilities scale include six factors: Ratio of Stairs Length, Ratio of Escalators Length, Ratio of Elevators Operating Height, Ratio of Passageway Length, Ratio of Pedestrian, and Crossing Facilities Length. Other features include Number of Turns and Rationality of Signs and Markings.
- (3)
- Transfer Environment
Transfer Environment is composed of two categories: safety and comfort. Safety includes three factors: Rationality of Traffic Organization outside the Station, Rationality of Traffic Organization inside the Station, and Comfort of Nighttime Lighting outside the Station. Comfort has seven factors: Lighting Comfort inside the Station, Air Comfort inside the Station, Thermal Comfort inside the Station, Degree of Congestion on Platform, Degree of Congestion on Stairs, Degree of Congestion on Passageway, and Degree of Congestion on Entrance.
2.3. Data Collection
2.3.1. Principles of Survey
When conducting a transfer data survey, it is essential to meet the following requirements to ensure accurate and comprehensive data collection:
(1) Site selection should be diverse and representative, with an even distribution of site types covering all the indicators listed in Table 1 for transfer facilities and environment;
(2) Survey time should cover peak and off-peak hours as well as daytime and nighttime on both weekdays and holidays;
(3) The sampling should target passengers who have just completed an urban rail transit transfer and should be drawn randomly to ensure that the sample distribution closely resembles the population distribution;
At last, the sample size of the survey should be determined by Equation (2) below, which specifies the required minimum sample size, denoted as , for a survey with a population of sufficient or infinite size,
where is the confidence level, is the quantile of a normal distribution, and is the population proportion. In the behavioral and social sciences, the significance level α is typically set at 0.05, the corresponding value of k is 1.96, and P is conventionally set at 0.5.
Based on Equation (2), the minimum sample size for conducting an efficacious transfer survey should exceed 384.
2.3.2. Survey Methods
Perceptions are difficult to quantify and remember due to their intangible nature. To overcome this challenge, this study adopted the “Experience-Response” based passenger transfer perception survey method [30] to obtain perception data. This method involves conducting a questionnaire survey on passengers who have just completed an urban rail transit transfer. The passengers were not informed of the survey information beforehand, ensuring the timely collection of perception data and reducing the psychological impact of the survey on passengers’ travel experiences.
The survey was conducted at urban rail transit platforms and various transfer points such as bus platforms, non-motorized parking points, and motorized parking points, among others.
2.3.3. Survey Steps
To collect data on perceived and actual transfers of urban rail transit passengers, this study follows six investigation steps:
Step 1: conduct a preliminary investigation of urban rail transit stations to determine their operating hours, peak passenger flow periods, distribution of transfer points, and types of transfer facilities.
Step 2: determine the survey sites, locations, and times based on survey principles.
Step 3: design a questionnaire based on survey indicators, characteristics of the survey object, survey principles, and other requirements. Please refer to Appendix A for a sample questionnaire.
Step 4: survey passengers’ transfer perceptions, who have recently completed an urban rail transit transfer, at survey locations,. The collected data should include passengers’ actual transfer routes, x1–x15, x22–x32, and their perceived transfer distance.
Step 5: take measurements and annotations on the station floor plan to obtain x16-x21 and the actual transfer distance based on the actual transfer routes of passengers. Validate the accuracy of the collected data by performing on-site observations.
Step 6: used Equation (1) to calculate the Ratio of Perceived Transfer Distance Deviation (R) by inserting the collected data of the Perceived Transfer Distance () and the Actual Transfer Distance ().
3. The Perceived Transfer Distance Model Based on XGBoost-SHAP
3.1. Extracting Key Factors
As multiple factors can influence , factor screening is necessary to reduce the dimensionality and complexity of the data and to improve the accuracy and interpretability of the model. To exclude factors that were not related to R (p < 0.01), the study tested the Pearson correlation between R and the 32 influencing factors listed in Table 1. The m factors that remained after this process were deemed to be strongly correlated with .
Below is the dataset that consists of n survey samples and m explanatory factors,
where is the i-th sample and . is the k-th key factor of i-th sample (1 < < m), n is the number of samples, and is the R value of the i-th sample.
3.2. The R Prediction Model Based on XGBoost
Due to the non-linear effects among the influencing factors of R, the study utilized the XGBoost regression algorithm, which can effectively handle the heterogeneity between categorical and continuous variables.
XGBoost [34] is a popular machine learning algorithm used for regression and classification problems. It is based on the gradient boosting decision tree algorithm and uses a combination of different decision trees to make predictions. XGBoost has gained popularity due to its ability to handle complex non-linear relationships between variables as well as handle missing data and fast computational speed. It has been widely used in various research and applications, including data mining, natural language processing, and computer vision.
The process for building the prediction model based on XGBoost is as follows:
Step 1: split the dataset D into a training set and a test set using a ratio of 7:3 due to the small sample size. Use the training set as input for the XGBoost model.
Step 2: initialize the predicted value for each sample; in this study .
Step 3: establish the objective function Obj and simplify it according to Equations (3) and (4) [34],
where is the predicted value of of the i-th sample, is the target value of of the i-th sample, is the loss function which measures the difference between and and is usually , is the number of decision trees, is the regularization term that penalizes complex models, is the complexity coefficient of leaf nodes, is the number of the leaf node, is the penalty coefficient, and is the weight of the -th key factor.
To transform the objective function to the Euclidean domain, XGBoost employs Taylor approximation, as shown in Equation (4),
where , which represents the gradient of the loss function; , which represents the Hessian of the loss function; and is the sample set in the leaf node.
Step 4: build decision trees continuously and fit the residuals.
Step 5: accumulate the predicted value of each decision tree, which represents , as shown in Equation (5),
where is the regression equation corresponding to the -th decision tree.
Step 6: feed the test set into the model and evaluate the model’s performance using various evaluation metrics. This study used two common metrics to measure the accuracy and precision of regression models: RMSE (root mean squared error), and MAE (mean absolute error). Smaller values of these metrics indicate better model performance.
3.3. Analysis of Key Factors Based on SHAP
The XGBoost model has highly accurate in prediction, but it cannot provide an explanation for the impact of factors. This study aims not only to predict but also to identify the influencing factors that affected it, providing technical support for guiding the planning and design of transfer facilities at urban rail transit stations.
There are various methods to rank the significance of different factors, such as maximum information coefficient, splitting times of tree nodes, Kullback–Leibler divergence, and SHAP [35]. Among these methods, the SHAP framework is preferred because it can consistently present the facilitative or inhibitory effects of each influencing factor on predicted variables, and it can be used for both local and global interpretations [35]. The study analyzed the relationship between R and each influencing factor by calculating the Shapley value (), as shown in Equation (6) [34],
where is the Shapley value of the -th influence factor, which reflects the marginal contribution of the j-th factor to the predicted value of ; is the set of model input factors after extracting key factors; is the subset of obtained by removing the -th factor, whose dimension is ; is the model of R; is the predicted value of with the set as the input variable; and is the predicted value of with the set S as the input variable.
The Shapley value measures the impact of the j-th influence factor on the model’s output, accounting for its interaction with other features in the model. The sign of the Shapley value indicates whether the influence factor has a positive or negative effect on the prediction. A Shapley value > 0 means that the factor increases the predicted value, while a Shapley value < 0 means that the factor decreases the predicted value.
The SHAP framework for calculating the significance of the j-th factor involves the following steps:
Step 1: determine the set .
Step 2: use and as input variables in the R prediction model based on XGBoost to obtain the predicted values and .
Step 3: substitute and into Equation (6) to calculate for the j-th factor.
4. Case Study
4.1. Case Overview
This study used the Jin-Yi-Dong Line of the Jinhua Rail Transit System in Zhejiang Province, China, as a case study. This line spans 58.4 km and includes 17 stations.
Following the survey principles outlined in Section 2.3.1, this study conducted an “Experience-Response” questionnaire survey on 39 transfer points in 9 stations along the Jin-Yi-Dong Line between June 6 and 19 June 2022. A total of 1017 respondents completed the survey, and after plausibility checks, 981 responses remained, resulting in an efficiency rate of 96.46%.
After organizing and processing the raw data, this study obtained a total of 33 variables, which were divided into two tables for ease of presentation. Table 2 contains the discrete variables, while Table 3 contains the continuous variables.
Table 2.
Discrete variables descriptive statistics.
Table 3.
Continuous variable descriptive statistics.
4.2. Extracting Key Factors
This study utilized the Pearson correlation coefficient to examine the relationships between and 32 influencing factors. Table 4 presents the results. Among the 32 factors, 12 factors including Education (X3), Occupation (X4), Monthly Income (X5), Common Travel Mode (X8), Daily Walking Steps (X9), Travel Purpose (X11), Degree of Urgency (X14), Companion or Not (X15), Ratio of Elevators Operating Height (X18), Lighting Comfort inside the Station (X26), Air Comfort inside the Station (X27), and Temperature Comfort inside the Station (X28) were not significantly related to . Therefore, after excluding the 12 factors this study identified the remaining 20 factors as key variables affecting .
Table 4.
The result of Pearson correlation coefficient.
4.3. Predicting Effect of XGBoost Model
In order to verify the effectiveness of the XGBoost model in predicting R, this study compared its performance with three other commonly used algorithms: linear regression, random forest, and LightGBM. Moreover, this study selected two different variable input schemes to verify the need for using Pearson correlation coefficient to extract key factors. The first scheme included all factors as model inputs, while the second scheme used only key factors for prediction.
To reduce the impact of randomness during the data splitting, this study evaluated the model’s performance by averaging the results of 10 times 5-fold cross validation. In Table 5, the evaluation results of the model using all factors is presented, while Table 6 shows the model’s predictive performance solely based on key factors. It is important to note that Figure 2 only displays the performance of each model on the test set.
Table 5.
Evaluation results with all features as model inputs.
Table 6.
Evaluation results of key features as input to the model.
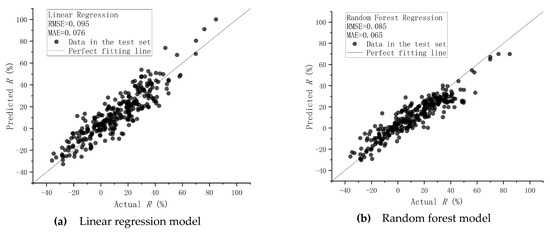
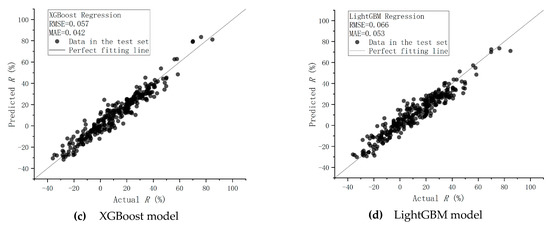
Figure 2.
Validation of the Ratio Of Perceived Transfer Distance Deviation by four models (test set). The scatter plot describes the relationship between actual and predicted R on the test set, using (a) linear regression, (b) random forest, (c) XGBoost, and (d) LightGBM methods. The closer the plotted points in the graph are to the perfect fitting line, the better the model’s predictive ability.
Upon comparing Table 5 and Table 6, the results showed that after extracting key factors, the random forest, XGBoost, and LightGBM models exhibited a decrease in errors, while the performance of the linear regression model remains relatively poor. This study believes that this is mainly because, after variable selection, tree-based models such as random forest, XGBoost, and LightGBM can better capture nonlinear relationships between variables, reduce model complexity, and minimize noise interference, thereby significantly improving model performance. However, due to the linear assumptions and limited noise factors removal effect of the linear regression model, its performance remains largely unchanged after variable selection.
Moreover, after comparing the performance of all models on the training and test sets, the XGBoost model demonstrated a significant advantage. The study found that the XGBoost model generated lower root mean square error (RMSE) and mean absolute error (MAE) than the other three models. Particularly, the XGBoost model showed a reduction of 40.00%, 32.94%, and 13.64% in RMSE, and 44.74%, 35.38%, and 20.75% in MAE, respectively, when compared with PSO-XGBoost, XGBoost, and DT, the linear regression model, random forest, and LightGBM.
Furthermore, as indicated in Figure 2, the comparison of the actual and predicted R of the four models on the testing set demonstrated that the XGBoost model’s points were positioned in close proximity to the perfect fitting line, indicating a significant alignment between predicted and real values. Conversely, the remaining three models displayed larger errors and greater discreteness, suggesting that the XGBoost model is the most suitable for predicting R and providing superior application results.
4.4. Analysis of the Ranking of Key Factors’ Significance
Figure 3 illustrates the SHAP values of all 20 key factors computed using the trained XGBoost model accompanied by a scatter plot that shows the relationship between the key factors and R. To assess the significance of the key variables on R, this study utilized the degree of significance, which is calculated by averaging the absolute value of SHAP, as presented in Figure 4.
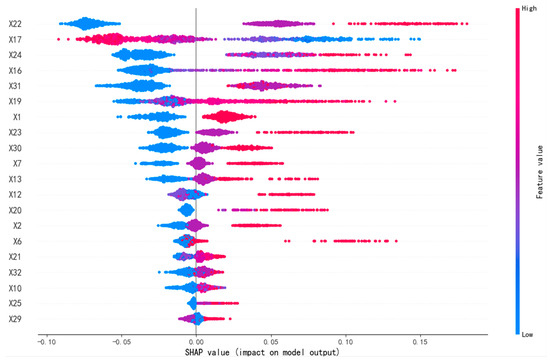
Figure 3.
The SHAP values of key variables.
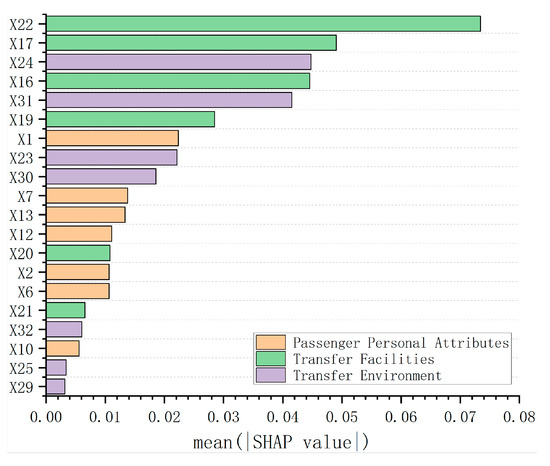
Figure 4.
Ranking of the significance of key variables.
The findings reveal that the Transfer Environment has the most significant impact on R, followed by Transfer Facilities, while the impact of Passenger Personal Attributes is relatively low. Thus, optimizing the Transfer Facilities and Transfer Environment can effectively decrease R for urban rail transit passengers; however, it is also essential to take into account the influence of Passenger Personal Attributes on the perceived transfer distance.
Figure 4 provides valuable insight into the key factors affecting R, with Rationality of Signs and Markings (X22) being identified as the most influential feature. It has the highest average SHAP value, indicating its strongest explanatory power for R overall. Other variables such as Ratio of Escalators Length (X17), Rationality of Traffic Organization outside the Station (X24), Ratio of Stairs Length (X16), and Degree of Congestion on Passageway (X31) also play a crucial role in transfer distance perception, albeit with smaller contributions than X22. Furthermore, Ratio of Passageway Length (X19) is another significant characteristic among the Transfer Facilities variables, which has a critical effect on transfer distance perception.
Additionally, the study identifies several other variables that significantly influence transfer distance perception, including Gender (X1), Rationality of Traffic Organization inside the Station (X23), Degree of Congestion on Stairs (X30), Fatigue Degree (X7), Weight-bearing (X13), Familiarity of Transfer Routes (X12), Ratio of Pedestrian Crossing Facilities Length (X20), Age (X2), and Health Status (X6). In contrast, variables such as Number of Turns (X21), Degree of Congestion on Entrance (X32), Travel Time (X10), Comfort of Nighttime Lighting outside the Station (X25), and Degree of Congestion on Platform (X29) are found to have little effect on transfer distance perception, as their degree of significance is less than 0.01.
This study emphasizes the examination of five key factors impacting R, including Rationality of Signs and Markings (X22), Ratio of Escalators Length (X17), Rationality of Traffic Organization outside the Station (X24), Ratio of Stairs Length (X16), and Degree of Congestion on Passageway (X31).
The Rationality of Signs and Markings (X22) is the most critical factor affecting R with a positive correlation. In other words, improved signs and markings help passengers easily identify directions and locations, reducing their perception of transfer distance. In contrast, poor signage and markings increase R.
In line with everyday experience, the Ratio of Escalators Length (X17) is negatively correlated with passengers’ R. Longer escalators require less physical effort, reducing passengers’ perception of transfer distance.
The Rationality of Traffic Organization outside the Station (X24) plays a crucial role in R. Chaotic organization creates obstacles, such as crowded areas, road crossings, and interweaving passenger and vehicle flows, directly affecting passengers’ perception of transfer distance. Additionally, extreme disorder can pose safety hazards, such as traffic congestion and accidents, further influencing passengers’ perception.
An inverse relationship exists between the Ratio of Stairs Length and R. Longer stairs result in more time spent walking, increased fatigue, and visual illusions, causing passengers to overestimate transfer distance. Therefore, replacing stairs with escalators in urban rail transit stations is recommended to reduce this overestimation.
Lastly, the Degree of Congestion on Passageway (X31) has a significant impact on R. Crowded conditions increase difficulty and travel time, causing anxiety and stress and leading to a perception of a longer distance. Transitioning from spacious areas such as platforms or halls to narrower passageways exposes passengers to uncertain factors, such as crowds and obstacles, requiring frequent changes in steps, reducing comfort during transfers, and intensifying visual information, leading to overestimation of the actual transfer distance. Urban rail transit station operators should closely monitor and guide passageway congestion to ensure passenger safety and travel experience.
Table 7 presents the discussion on the significance ranking of all 20 key factors.
Table 7.
Discussion on the significance ranking of key factors.
4.5. Implications and Applications
Based on the research results, this study suggests taking the following measures to improve the perceived status of passenger transfer for the Jin-Yi-Dong Line of the Jinhua Rail Transit System:
Enhancing passenger experience in urban rail transit relies heavily on improving the Rationality of Signs and Markings (X22). One reason for this is that X22 has the most significant impact on passengers’ perceived transfer distance. Fortunately, the cost of improving X22 is relatively low, and optimizing it can be achieved during both station design and management stages. To ensure effective guidance for passengers, signage and markings should be strategically placed with clear and concise information. By doing so, confusion can be minimized, making it easier for passengers to navigate the station and ultimately decreasing their perceived transfer distance.
The optimization of escalators and stairs arrangement, ranked second in importance (X17, X16), is a critical aspect for enhancing the passenger experience in urban rail transit. When planning and designing stations, it is imperative to prioritize the installation of escalators over stairs to minimize physical exertion and reduce the perceived transfer distance, especially for passengers with limited mobility. Additionally, it is crucial to ensure there is an appropriate spacing between escalators and stairs and design them to accommodate effective passenger flow.
In addition, careful attention should be paid to ensure that the traffic organization plan (X23, X24) is adaptable and responsive to changing conditions, such as fluctuating passenger volumes or external events that may impact traffic flow. By continually assessing and adjusting the traffic organization plan as needed, the station can remain efficient and effective in providing a positive passenger experience.
Addressing congestion in passageways (X31) is a critical aspect of optimizing stations. During the station planning and design phase, it is important to estimate passenger flow and establish appropriate passageway sizes. In the operational phase, effective crowd management strategies should be implemented to alleviate congestion, such as deploying staff to guide passengers during peak periods, utilizing real-time information systems to notify passengers of congested areas, and modifying station layouts to promote efficient passenger flow. It is crucial to prioritize passenger safety and comfort by creating clear and unobstructed passageways.
The design and planning of stations should take into account the personal characteristics of the passengers being served, including those with disabilities, the elderly, and those who are unfamiliar with the station. To meet the needs of different passengers, the station design should include seating areas, elevators, and clear wayfinding information. Such features can facilitate passengers’ use of the station and enhance its accessibility and inclusiveness. By considering the diverse needs of passengers, the station can become a more inviting and user-friendly environment for everyone.
By implementing these recommendations, urban rail transit stations can effectively reduce passengers’ perceived transfer distances, improving their overall travel experience and satisfaction.
It is important to note that passenger flow characteristics, transfer facilities, and transfer environment may vary among different stations or even at the same station over different time periods, leading to differing levels of importance for various influencing factors. Therefore, this article provides design and optimization strategies solely based on the Jin-Yi-Dong Line of the Jinhua Rail Transit System at its current stage. These strategies may not be applicable to other stations.
5. Conclusions
This study made a significant contribution to the field of urban rail transit by proposing a novel concept, the Ratio Of Perceived Transfer Distance Deviation (R), which could accurately measure the level of transfer service at urban rail transit stations. Furthermore, this study investigated the potential of machine learning in the study of perceived transfer distance and the use of explainable methods for reviewing model predictions to address the long-standing “black box” problem in computational methods. The comprehensive evaluation system established in this research considered 32 influencing factors relating to Passenger Personal Attributes, Transfer Facilities, and Transfer Environment, providing a comprehensive understanding of the complexities of perceived transfer distance.
The use of advanced XGBoost and SHAP models resulted in a more advanced analysis of transfer distance perception at urban rail transit stations, surpassing other models such as linear regression, random forest, and LightGBM in predicting R, with an RMSE of 0.057 and an MAE of 0.042.
Moreover, this study found that Transfer Facilities, Transfer Environment, and Passenger Personal Attributes were significant influencing factor groups, with the Rationality of Signs and Markings, Ratio of Escalators Length, Rationality of Traffic Organization Outside the Station, Ratio of Stairs Length, and Degree of Congestion on Passageway being the most critical determinants affecting R for urban rail transit passengers.
The research findings provide valuable theoretical guidance for planning, constructing, and optimizing urban rail transit connection facilities, improving the accessibility of urban rail transit stations, and enhancing the level of transfer services provided to passengers. Furthermore, the research can contribute to predicting passenger transfer behavior, offering practical implications for urban rail transit management and planning. Overall, this study presented a novel approach to accurately measuring the perceived transfer distance at urban rail transit stations and provides significant contributions to the field of urban rail transit.
Author Contributions
C.M. designed the study; W.X. conducted data analysis and wrote the paper; Y.H., N.Z. and X.Z. (Xintong Zhang) collected the data; X.Z. (Xinhuan Zhang) contributed to the rationale and discussion of the results. All authors have read and agreed to the published version of the manuscript.
Funding
This research was funded by the Project of Science and Technology of Jinhua, China (2021-4-376) and the Natural Science Foundation of Zhejiang Province (LY18G030021).
Institutional Review Board Statement
Not applicable.
Informed Consent Statement
Not applicable.
Data Availability Statement
The data that support the findings of this study are available upon request from the corresponding author. The data are not publicly available due to privacy or ethical restrictions.
Conflicts of Interest
The authors declare no conflict of interest.
Appendix A
Survey on Perception of Urban Rail Transit Connections.
Part 1 Perception Survey on Transit Connections.
- 1. Estimate how many meters you walked from the station platform to the survey location ().
- A. 100 m; B. 120 m; C. 140 m; D. 160 m; E. 180 m;
- F. 200 m; G. 220 m; H. 240 m; I. 260 m; J. 280 m;
- K. 300 m; L. 320 m; M. 340 m; N. 360 m; O. 380 m;
- P. 400 m; Q. 420 m; R. 440 m; S. 460 m; T. 480 m;
- U. 500 m; V. 520 m; W. 540 m; X. 560 m; Y. 580 m;
- Z. 600 m or more; V. others_____;
Part 2 Basic Information Survey.
- 1. Gender ().
- A. Male; B. Female
- 2. Age ().
- A. 16–25; B. 26–45; C. 46–60; D. Over 61
- 3. Education ().
- A. Junior High School or Below;
- B. Technical Secondary School/High School;
- C. College/Undergraduate;
- D. Postgraduate or Above
- 4. Occupation ().
- A. Civil Servants; B. Public Institution Employees;
- C. Enterprise Employee; D. Freelancers;
- 5. Unemployed; 6. Retirees; 7. Students; 8. Others
- 5. Monthly Income ().
- A. Less Than 5000 Yuan; B. 5000–A0000 Yuan; C. A0000–B0000 Yuan;
- D. More Than B0000 Yuan;
- 6. Health Status ().
- A. Very Good; B. Good; C. Poor; D. Very Poor
- 7. Fatigue Degree ().
- A. Very Relaxed; B. Relaxed; C. A Little Tired; D. Very Tired
- 8. Common Travel Modes ().
- A. Walk; B. Bicycle/Electric Bicycle; C. Bus; D. Rail Transit;
- E. Taxi/Ride-sharing; F. Private Car;
- 9. Daily Walking Steps ().
- A. Under 2000; B. 2000–5000; C. 5000–10,000; D. 10,000–15,000;
- E. Over 15,000
- 10. Travel Time ().
- A. Weekday Peak Hours; B. Weekday off-Peak Hours;
- C. Holiday Peak Hours; D. Holiday off-Peak Hours
- 11. Travel Purpose ().
- A. On or off Duty; B. Go To School or Leave School;
- C. Visit Relatives Additionally, Friends;
- D. Travel; 5. Entertainment Shopping; 6. official Business; 7. Others
- 12. Familiarity of Connecting Routes ().
- A. Very Familiar; B. Familiar; C. Unfamiliar; D. Very Unfamiliar
- 13. Weight-bearing ().
- A. No Load; B. Light; C. Heavy; D. Very Heavy
- 14. Degree of Urgency ().
- A. Not Urgent; B. Urgent; C. Very Urgent
- 15. Companion or not ().
- A. With Partner(s); B. No Partner
Part 3 Transit Connection Evaluation Survey.
- 1. Rationalization of Traffic Organization inside the Station ().
- A. Very Good; B. Good; C. Poor; D. Very Poor
- 2. Rationalization of Traffic Organization outside the Station ().
- A. Very Good; B. Good; C. Poor; D. Very Poor
- 3. Comfort of Nighttime Lighting outside The Station ().
- A. Very Good; B. Good; C. Poor; D. Very Poor
- 4. Lighting Comfort inside The Station ().
- A. Very Good; B. Good; C. Poor; D. Very Poor
- 5. Air Comfort inside The Station ().
- A. Very Good; B. Good; C. Poor; D. Very Poor
- 6. Temperature Comfort inside The Station ().
- A. Very Good; B. Good; C. Poor; D. Very Poor
- 7. Degree of Congestion on Platform ().
- A. Very comfortable; B. comfortable; C. Congested;
- D. Very Congested
- 8. Degree of Congestion on Stairs ().
- A. Very comfortable; B. comfortable; C. Congested;
- D. Very Congested
- 9. Degree of Congestion on Passageways ().
- A. Very comfortable; B. comfortable; C. Congested;
- D. Very Congested
- 10. Degree of Congestion on Entrance ().
- A. Very comfortable; B. comfortable; C. Congested;
- D. Very Congested
- 11. Rationality of Signs and Markings ().
- A. Very useful; B. Useful; C. Useless; D. Very Useless
- Survey Time: HH MM SS Survey Stop:
- Survey Location:
- Companion or Not: □ Yes □ No
- Travel Time: □ Peak Hours On Weekday
- □
- off-Peak Hours On Weekday
- □
- Peak Hours On Holiday
- □
- off-Peak Hours On Holiday
Please note that the questionnaire’s range and options for perceived transfer distance are customized based on the actual transfer distance, typically with the minimum and maximum options set at half and three times the actual transfer distance, respectively. The interval between options is set at 10% of the actual transfer distance to enhance accuracy in collecting passengers’ perceived transfer distance. If a passenger’s perceived distance exceeds the given options in the questionnaire, they are advised to enter their own perceived transfer distance under the “other” option. It is important to note that the perceived transfer distance options for this questionnaire were designed based on an actual transfer distance of 200 m and may not be directly applicable to other contexts.
References
- Ministry of Transport of the People’s Republic of China. Express Report of Urban Rail Transit Operation Data in 2022. Available online: http://www.gov.cn/shuju/2023-01/20/content_5738226.htm (accessed on 2 April 2023).
- Yao, L.; Sun, L.; Wang, W.; Xia, X. Connection Facility Layout Model of Subway Stations. Adv. Mech. Eng. 2015, 7, 457508. [Google Scholar] [CrossRef]
- Olszewski, P.; Wibowo, S.S. Using Equivalent Walking Distance to Assess Pedestrian Accessibility to Transit Stations in Singapore. Transp. Res. Rec. J. Transp. Res. Board 2005, 1927, 38–45. [Google Scholar] [CrossRef]
- Guo, Z.; Wilson, N.; Rahbee, A. Impact of Weather on Transit Ridership in Chicago, Illinois. Transp. Res. Rec. J. Transp. Res. Board 2007, 2034, 3–10. [Google Scholar] [CrossRef]
- Guo, Z.; Ferreira, J. Pedestrian environments, transit path choice, and transfer penalties: Understanding land-use impacts on transit travel. Environ. Plan. B Urban Anal. City Sci. 2008, 35, 461–479. [Google Scholar] [CrossRef]
- Zhan, G.; Wilson, N. Assessing the cost of transfer inconvenience in public transport systems: A case study of the London Underground. Transp. Res. A Policy Pract. 2011, 45, 91–104. [Google Scholar]
- Rodriguez-Gonzalez, M.B.; Aguero-Valverde, J. Walking distances from home to bus stops in San José, Costa Rica: Real, perceived, and stated-preference distances. Adv. Transp. Stud. 2017, 43, 63–74. [Google Scholar]
- Hess, D.B. Walking to the bus: Perceived versus actual walking distance to bus stops for older adults. Transportation 2012, 39, 247–266. [Google Scholar] [CrossRef]
- Syafriharti, R.; Kombaitan, B.; Kusumantoro, I.P.; Syabri, I. Train users’ perceptions of walking distance to train station and attributes of paratransit service: Understanding their association with decision using paratransit or not towards the train station. IOP Conf. Ser. Earth Environ. Sci. 2018, 158, 012016. [Google Scholar] [CrossRef]
- Chen, E.; Stathopoulos, A.; Nie, Y. Transfer station choice in a multimodal transit system: An empirical study. Transp. Res. Part A Policy Pract. 2022, 165, 337–355. [Google Scholar] [CrossRef]
- Zhao, J.; Wei, D. Relationship of Walk Access Distance to Rapid Rail Transit Stations with Personal Characteristics and Station Context. J. Urban Plan. Dev. 2013, 139, 311–321. [Google Scholar] [CrossRef]
- Park, S.; Deakin, E.; Jang, K. Can Good Walkability Expand the Size of Transit-Oriented Developments? Transp. Res. Rec. 2015, 2519, 157–164. [Google Scholar] [CrossRef]
- Sugovic, M.; Witt, J.K. An older view on distance perception: Older adults perceive walkable extents as farther. Exp. Brain Res. 2013, 226, 383–391. [Google Scholar] [CrossRef]
- Sapawi, R.; Said, I.; Mohamad, S. Disparities of Perception on Walking Distance by Subgroups in Urban Neighbourhood Area. Procedia-Soc. Behav. Sci. 2013, 85, 513–522. [Google Scholar] [CrossRef]
- Stone, J.P.; Mcbeath, M.K. Gender Differences in Distance Estimates When Exposed to Multiple Routes. Environ. Behav. 2010, 42, 469–478. [Google Scholar] [CrossRef]
- Sims, D.; Matthews, S.A.; Bopp, M.J.; Rovniak, L.S.; Poole, E. Predicting discordance between perceived and estimated walk and bike times among university faculty, staff, and students. Transp. A Transp. Sci. 2018, 14, 691–705. [Google Scholar] [CrossRef]
- Baldock, K.L.; Paquet, C.; Howard, N.J.; Coffee, N.T.; Taylor, A.W.; Daniel, M. Correlates of Discordance between Perceived and Objective Distances to Local Fruit and Vegetable Retailers. Int. J. Environ. Res. Public Health 2019, 16, 1262. [Google Scholar] [CrossRef] [PubMed]
- Downs, R.M.; Stea, D. Image and Environment: Cognitive Mapping and Spatial Behavior, 1st ed.; Transaction Publishers: New Brunswick, NJ, USA, 1976; pp. 317–322. [Google Scholar]
- Ozawa, R.; Fujii, K.; Kouzaki, M. The Return Trip Is Felt Longer Only Postdictively: A Psychophysiological Study of the Return Trip Effect. PLoS ONE 2015, 10, e0133339. [Google Scholar]
- Crompton, A. Perceived Distance in the City as a Function of Time. Environ. Behav. 2006, 38, 173–182. [Google Scholar] [CrossRef]
- Sadalla, E.K.; Magel, S.G. The Perception of Traversed Distance. Environ. Behav. 1980, 12, 65–79. [Google Scholar] [CrossRef]
- Kahl, H.B.; Herman, J.F.; Klein, A.C. Distance distortions in children’s cognitive maps: An examination of the information storage model. J. Exp. Child Psychol. 1984, 38, 134–146. [Google Scholar] [CrossRef]
- Morgado, M.; Gentaz, E.; Guinet, E. Within reach but not so reachable: Obstacles matter in visual perception of distances. Psychon. Bull. Rev. 2013, 20, 462–467. [Google Scholar] [CrossRef] [PubMed]
- Tenhundfeld, N.L.; Witt, J.K. Distances on hills look farther than distances on flat ground: Evidence from converging measures. Atten. Percept. Psychophys. 2017, 79, 1165–1181. [Google Scholar] [CrossRef]
- Hanyu, K.; Itsukushima, Y. Cognitive Distance of Stairways Distance, Traversal Time, and Mental Walking Time Estimations. Environ. Behav. 1995, 27, 579–591. [Google Scholar] [CrossRef]
- Sun, S.S.; Zhou, Q.; Lal, S.; Xu, H.; Goh, K.; Wong, Y.D. Quantifying performance of sheltered link-way facility in Singapore using human-centric indicators. Int. J. Urban Sustain. Dev. 2021, 13, 187–198. [Google Scholar] [CrossRef]
- Iosa, M.; Fusco, A.; Morone, G.; Paolucci, S. Walking there: Environmental influence on walking-distance estimation. Behav. Brain Res. 2011, 226, 124–132. [Google Scholar] [CrossRef]
- Winter, S.; Tomko, M.; Vasardani, M.; Richter, K.-F.; Khoshelham, K.; Kalantari, M. Infrastructure-Independent Indoor Localization and Navigation. ACM Comput. Surv. 2019, 52, 1–24. [Google Scholar] [CrossRef]
- Frenz, H.; Lappe, M.; Kolesnik, M.; Bührmann, T. Estimation of travel distance from visual motion in virtual environments. ACM Trans. Appl. Percept. 2007, 4, 3. [Google Scholar] [CrossRef]
- Witt, J.K.; Proffitt, D.R.; Epstein, W. Tool use affects perceived distance; but only when you intend to use it. J. Exp. Psychol. Hum. Percept. Perform. 2005, 31, 880–888. [Google Scholar] [CrossRef] [PubMed]
- Ankomah, P.K.; Crompton, J.L.; Baker, D.A. A study of pleasure travellers’ cognitive distance assessments. J. Travel Res. 1995, 34, 12–18. [Google Scholar] [CrossRef]
- Walmsley, D.J.; Jenkins, J.M. Coginitive distance: A neglected issue in travel behavior. Journal of travel research 1992, 31, 24–29. [Google Scholar] [CrossRef]
- Zhou, F.; Wu, J.; Wu, P.; Li, J.; Yang, C.; Wu, B. Analysis of factors regarding the perceived distance of tourists. J. Zhejiang Univ. 2016, 43, 616–624. [Google Scholar]
- Chen, T.; Guestrin, C. Xgboost: A Scalable Tree Boosting System. In Proceedings of the 22nd ACM SIGKDD International Conference on Knowledge Discovery and Data Mining, San Francisco, CA, USA, 13–17 August 2016; ACM: New York, NY, USA, 2016; pp. 785–794. [Google Scholar]
- Parsa, A.B.; Movahedi, A.; Taghipour, H.; Derrible, S.; Mohammadian, A. Toward safer highways; application of XGBoost and SHAP for real-time accident detection and feature analysis. Accid. Anal. Prev. 2020, 136, 105405. [Google Scholar] [CrossRef] [PubMed]
- Asadi-Shekari, Z.; Saadi, I.; Cools, M. Applying Machine Learning to Explore Feelings about Sharing the Road with Autonomous Vehicles as a Bicyclist or as a Pedestrian. Sustainability 2022, 14, 1898. [Google Scholar] [CrossRef]
- Liu, D.; Rong, W.; Zhang, J.; Ge, Y.-E. Exploring the Nonlinear Effects of Built Environment on Bus-Transfer Ridership: Take Shanghai as an Example. Appl. Sci. 2022, 12, 5755. [Google Scholar] [CrossRef]
- Yang, C.; Chen, M.; Yuan, Q. The application of XGBoost and SHAP to examining the factors in freight truck-related crashes: An exploratory analysis. Accid. Anal. Prev. 2021, 158, 106153. [Google Scholar] [CrossRef]
- Alshboul, O.; Shehadeh, A.; Mamlook, R.E.A.; Almasabha, G.; Almuflih, A.S.; Alghamdi, S.Y. Prediction Liquidated Damages via Ensemble Machine Learning Model: Towards Sustainable Highway Construction Projects. Sustainability 2022, 14, 9303. [Google Scholar] [CrossRef]


Disclaimer/Publisher’s Note: The statements, opinions and data contained in all publications are solely those of the individual author(s) and contributor(s) and not of MDPI and/or the editor(s). MDPI and/or the editor(s) disclaim responsibility for any injury to people or property resulting from any ideas, methods, instructions or products referred to in the content. |
© 2023 by the authors. Licensee MDPI, Basel, Switzerland. This article is an open access article distributed under the terms and conditions of the Creative Commons Attribution (CC BY) license (https://creativecommons.org/licenses/by/4.0/).