Article

Contamination and Ecological Risk Evaluation of Metals in Sediments from a Wetland of International Importance (Ramsar Site)

1
Department of Fisheries and Marine Science, Noakhali Science and Technology University, Noakhali 3814, Bangladesh
2
Atmospheric and Environmental Chemistry Laboratory, Chemistry Division, Atomic Energy Centre, Dhaka 1000, Bangladesh
3
School of Engineering and Built Environment, Griffith University, Brisbane, QLD 4111, Australia
4
Department of Zoology, College of Science, King Saud University, P.O. Box 2455, Riyadh 11451, Saudi Arabia
5
Environmental and Life Sciences Programme, Faculty of Science, Universiti Brunei Darussalam, Jalan Tungku Link, Gadong BE1410, Brunei Darussalam
*
Author to whom correspondence should be addressed.
Sustainability 2023, 15(10), 7753; https://doi.org/10.3390/su15107753
Submission received: 2 March 2023 / Revised: 4 May 2023 / Accepted: 6 May 2023 / Published: 9 May 2023

Abstract

:
Wetlands are highly productive and diverse ecosystems providing home to thousands of organisms. These ecosystems reduce water pollution, sequester carbon, support livelihoods, and increase food security. However, these ecological functions are being impeded due to increased levels of metals in the environment. Therefore, the primary objective of this study was to evaluate the degree of metal contamination in the surface sediment of a wetland, Tanguar Haor, for the first time. The result demonstrated that the mean concentrations of Fe, Cu, Zn, As, Pb and Hg varied from 13140.39 to 45675, 40.07 to 46.29, 47.60 to 57.15, 18.89 to 35.23, 1.24 to 2.64, and 0.35 to 0.42, respectively. The concentration of As was found to be higher than the average shale value. The concentration of Cu (44.19 μg/g) and Hg (0.38 μ/g) was very close to the shale value (45 μg/g and 0.40 μg/g, respectively), indicating a moderate level of contamination. The contamination level was further evaluated by multi-indices, e.g., the contamination factor (CF), the enrichment factor (EF), and the geo-accumulation index (Igeo). The average EF values for As (115.41), Cu (57.68), and Hg (55.47) were >50, indicating a high degree of contamination (extremely severe enrichment). However, CF values showed varied levels of pollution; for example, the majority of the area was only somewhat contaminated with As, Cu, and Hg, but less contaminated with Fe, Zn, and Pb. According to Igeo, sampling sites were found to be unpolluted or less polluted by heavy metals. Based on potential ecological risk assessment (PERI), the degree of risk from the six heavy metals decreased in the following sequence: As > Cu > Zn > Pb > Cr > Ni. PERI values indicated the study area has been exposed to moderate risk to As and low risk to other metals. This study provides an opportunity for frequent monitoring of heavy metals in this ecologically critical environment, and thus curbing heavy metal pollution.

1. Introduction

Wetlands are the distinctive ecotones between terrestrial and aquatic systems and are regarded as one of the planet’s most productive ecosystems [1,2]. A wetland ecosystem can include a huge diversity of fish, amphibians, birds, mammals, plants, insects, amphibians, and reptiles. These wetlands offer a wide range of ecosystem services to humans, wildlife, and aquatic organisms, including water storage, water quality improvement, fish and wildlife habitats, and the maintenance of surface water flow [3,4,5]. Wetlands are home to numerous migrating birds as well as endangered and threatened species [2,6]. Even migratory bird species have a reliance on certain wetlands that would be destroyed if these wetlands were lost [3]. However, due to increasing human activities, at least 33% of global wetlands have been destroyed, including wetlands and 2.64 million km2 of open water [1].
Tanguar Haor, located in the northern haor basin of Bangladesh, is one of the most significant wetlands in South Asia. It plays a vital role in the complex hydrological and biological ecosystem, supporting a wide variety of rare and vulnerable aquatic flora and fauna including endemic species [7]. Being a natural freshwater wetland of Bangladesh, it has magnificent conservation value for its rich biodiversity and significant number of wildlife and migratory species. Over 60,000 migratory waterfowl harbor in Tanguar Haor seasonally together with the resident birds. Furthermore, it plays a vital role as the last vestige of a swamp forest with over 140 fish species [7]. Unfortunately, the diversified biodiversity of Tanguar Haor is under pressure of extinction due to extensive exploitation of natural resources [7]. Tanguar Haor was, thus, designated as an ecologically critical area by the Government of Bangladesh in 1999, taking into account the fragile state of this ecologically significant wetland [3]. Further, it was declared as the second Ramsar site in Bangladesh on 10 July 2000 for its unique ecosystem of national and international importance [7].
Heavy metals generally have relatively high densities or weights. These metals are broadly classified as essential (Zn, Fe, Se, Cu etc.), probably essential (V, Co) and potentially harmful (Hg, As, Cd, Pb, Ni). Some of them (Hg and As) are extremely poisonous to biota, even at low concentrations in the air or in food [7]. After being introduced by human activities or natural processes to an aquatic ecosystem, these metals are dispersed throughout the water column, deposited in sediments, or stored there. The metals are then devoured by inhabitant biota including fish [8]. These could contaminate water and sediment directly, killing or having a sub-lethal effect on the local fish population. Consuming fish or drinking water from these contaminated areas results in oxidative stress, which damages cells at the molecular level. Such damage can cause the development of several diseases (such as nausea, liver and kidney damage) and other health issues [7,9].
Heavy metal pollution in aquatic environments has drawn a great deal of attention due to its toxicity and persistence in the environment, and consequent build-up in the aquatic ecosystem. Because of the potential for accumulation in microbes, aquatic plants, and fauna, its remnants in aquatic ecosystems could infiltrate the human food chain and cause health issues [5,6]. These metals can enter into an aquatic ecosystem from two main sources, namely natural processes and human activities [7]. Volcanic eruptions, weathering, and erosion are examples of natural sources. On the other hand, human activities include the application of fertilizers and pesticides indiscriminately in agricultural areas, urbanization, and industrial waste as well as the dumping of partially or improperly treated household and municipal waste [8,9,10,11]. They are then transported into the aquatic ecosystem and ingested by biota [12]. Therefore, fish and sediment are useful markers for assessing the long-term buildup of heavy metals in aquatic environments [13].
The excessive pollution of Tanguar Haor has recently drawn the attention of scientists from Bangladesh [14,15]. Previously, a number of studies has been conducted in Tanguar Haor regarding biodiversity [7,16,17,18,19], birds [20], aquatic plants [21], water quality [17], radioactivity [15], and ecosystem management [22,23]. However, none of them focused on heavy metal contamination or its ecological risk to inhabitants. Sun et al. [9] reported that ecosystem services in terms of rice production and fish supply of Tanguar Haor have significantly reduced due to land use change, population growth and the resultant pollution in the catchment area. These reduced services have had profound aeffects on the food security of the area. More than 60,000 people in 88 surrounding villages directly depend on Tanguar Haor for their livelihood [7]. Therefore, it is crucial to identify the specific causes and sources of pollution in the study area. The objectives of this study were to quantify and reveal the extent of heavy metal (Cu, Zn, As, Pb, Fe and Hg) contamination, and assess associated ecological risks in the surface sediment from the study area for the first time.

2. Materials and Methods

2.1. Study Area Description

Tanguar Haor is located in the Sunamganj district of Bangladesh between 25°12′2.57″ to 25°5′47.98″ N and 90°58′49.43″ to 91°10′0.02″ E, covering an area of 160 km2 (Figure 1). The Haor is a part of the Surma–Kushiyara rivers basin wetland [24] and known as the “mother fishery” of Bangladesh for its significant contribution to fish production [25,26]. Administratively, 67% of Tanguar Haor lies in the Dharmapasha Upazila whereas the rest is in Tahirpur Upazila. Over 50% of this wetland is covered with water, and 31% of the land is used for agricultural activities [27,28]. The soil texture of Tanguar Haor varies from clay and clay loam to loam. The climatic conditions of Tanguar Haor are of a subtropical monsoon nature with three dominant seasons, namely summer, monsoon, and winter. The summertime temperature ranges from 30.9 to 33.4 °C, and the wintertime low temperature ranges from 8.5 to 16.6 °C [7]. Average annual rainfall is 8000 mm in the Haor area and flash floods in the area may occur due to high rainfall during the pre-monsoon period [29,30].

2.2. Selection of Study Site and Period

Study sites were selected based on a discussion with the Fisheries Extension Officer of the Department of Fisheries, Tahirpur Upazila,. Three sites named Hatirgatha (S1), Naindar Beel (S2), and Lechuamara (S3) were selected as sampling sites where there was no break in the riverbank and settlement of sediment. The people in these areas were directly engaged in crop cultivation and fishing activities. However, the distance between each site was approximately 3 km.

2.3. Sample Collection and Preparation

A total of 36 sediment samples was collected from 12 stations in 3 sites (Figure 1). The samples were then transported to the Atmospheric and Environmental Chemistry Laboratory of the Atomic Energy Centre, Dhaka, Bangladesh. Details of the sample preparation and laboratory analysis were described in Rahman et al. [31]. Briefly, after collection, the sediment samples were allowed to settle so that extra water could be removed. After that, each sample was placed into a separate porcelain dish. Every dish containing the specific sample was put into an oven set at about 70⁰C until a steady weight was achieved. Dried samples were then pulverized into fine powder using a pestle and mortar and stored within desiccators in a plastic vial with an identification mark. Finally, a pellet maker (Specac Ltd, Orpington, UK) was employed to form pellets under 10 tons of pressure. The elemental analyses in sediment samples were measured by energy dispersive X-ray fluorescence (EDXRF) spectrometry [31]. The pelleted samples were then placed into a sampling tube in the EDXRF system. In an X-ray tube, samples were blasted for about 18 min at a voltage of 25 V and a current of 50 µA. The X-ray properties of the samples were discovered using a solid-state Si-Li detector system. For quality assurance and control (QA/QC), the standard reference materials (Marine sediment, IAEA 433) were prepared and analyzed.

2.4. Contamination Indices for Sediment

In this study, a number of indicators, namely the enrichment factor (EF), the contamination factor (CF), and the geo-accumulation index (Igeo), was calculated using the following equations to assess the current status of sediment:
E n r i c h m e n t   f a c t o r E F = [ M x F e x ] s a m p l e [ M r e f F e r e f ] b a c k g r o u n d
where [ M x F e x ] is the load of metals in the soil samples and [ M r e f F e r e f ] indicates the background value of the metals and iron [31]. EF values of 2–5: deficiency to moderate enrichment, 5–10: moderately severe enrichment, 10–25: severe enrichment, 25–50: very severe enrichment, >50: extremely high enrichment [31].
C o n t a m i n a t i o n   f a c t o r C F = ( C m e t a l ) ( C b a c k g r o u n d )
where, C m e t a l = the metal concentration in the sediment and C b a c k g r o u n d = the metals’ background value. CF values were grouped into four groups to assess the contamination level [32]. CF values of <1: low contamination, 1 < CF > 3: moderate contamination, 3 < CF > 6: considerable contamination, CF > 6: very high pollution.
G e o a c c u m u l a t i o n   i n d e x I g e o = l o g 2 C n 1.5 B n
where, C n = the metal load in samples and Bn = the background value. Igeo values are classified into seven classes following Muller [33]. Igeo value of <0: practically unpolluted, 0–1: unpolluted to moderately polluted, 1–2: moderately polluted, 2–3: moderately to heavily polluted, 3–4: heavily polluted, 4–5: heavily to extremely polluted, >5: extremely polluted.

2.5. Potential Ecological Risk Assessment

When one or more stressors (e.g., heavy metals) are present, the process of assessing the potentially harmful ecological impacts that may follow exposure to such stressors is known as ecological risk assessment. According to the toxicity of heavy metals and the response of the environment, the potential ecological risk index (RI) was introduced to measure the level of heavy metal contamination in sediments [34].
E r i = T r i C f i
C f i = C n i / C o i
R I = E r i
where 𝑅𝐼 = the sum of all risk factors for heavy metals, E r i = the monomial potential ecological risk factor, T r i = the toxic response factor for a given substance, C f i = the monomial contamination factor, C n i = the metal content in the sediments and C o i = a background value (reference value of metals). PERI or RI value of <150: low pollution, 150–300: considerable pollution, 300–600: high pollution, ≥600: very high pollution [34].

2.6. Statistical Analysis

The statistical analysis of collected data was performed by using the Statistical Package for the Social Sciences (IBM SPSS, version 20.0). The significant differences in the mean levels of metals among sites were analyzed using one way ANOVA with the software Paleontological Statistics or PAST (Hammer et al., 2001). The degree of connection between the metals was calculated using Spearman’s rank correlation coefficient (r). The relationship between metals and research sites was visualized using principal component analysis (PCA) and cluster analyses. The study map was generated using ArcGIS (Esri).

3. Results and Discussion

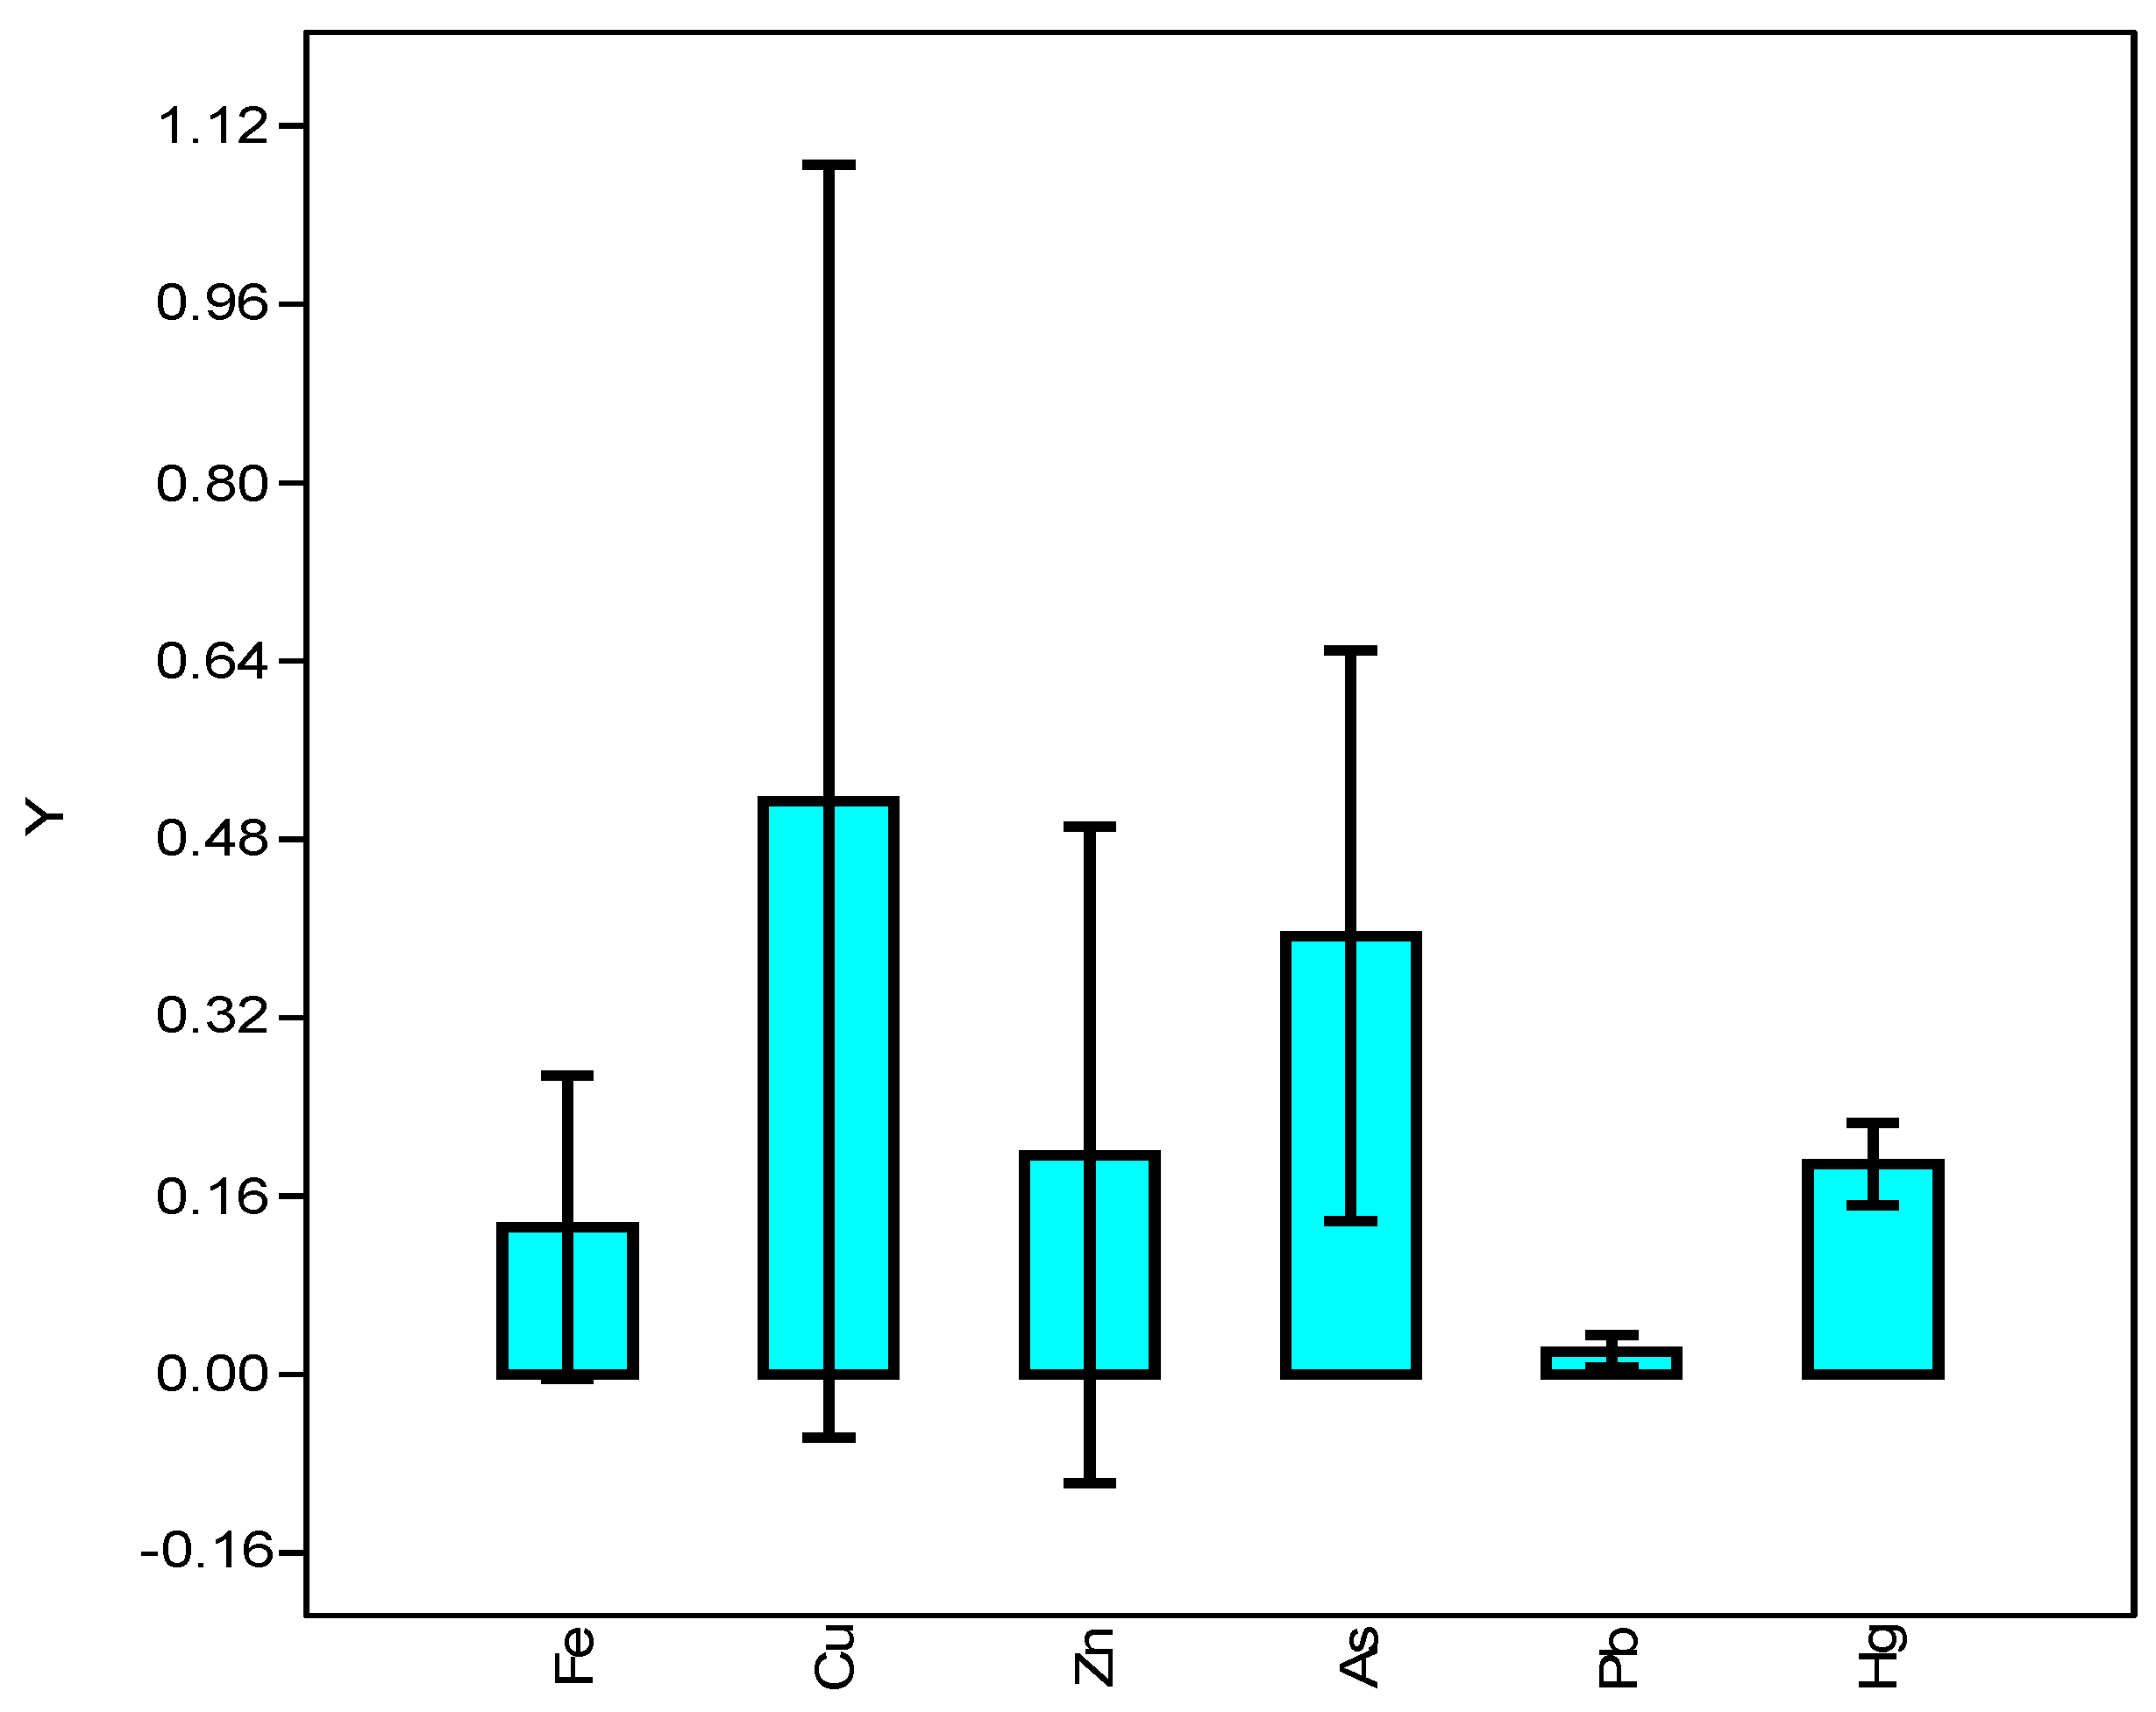
3.1. Metal Concentrations in Sediment of Tanguar Haor

The results of heavy metal concentration in the surface sediments of Tanguar Haor are shown in Table 1. The mean concentrations of Fe, Cu, Zn, As, Pb and Hg ranged from 13,140.39 to 45,675, 40.07 to 46.29, 47.60 to 57.15, 18.89 to 35.23, 1.24 to 2.64, and 0.35 to 0.42, respectively. The maximum concentration of Fe (45,675 ± 3390.22 μg/g) was recorded in site S1, whereas the highest load of Zn (57.15 ± 6.51 μg/g), Pb (2.64 ± 1.86 μg/g), and Hg (0.42 ± 0.04 μg/g) was in site S2. On the other hand, the highest concentration of Cu (46.29 ± 6.74 μg/g) and As (35.23 ± 8.40 μg/g) was documented in site S3 (Table 1). The one-way ANOVA revealed significant differences between locations in the mean metal values (F = 10.73; p = 0.0001). Tukey’s pairwise comparisons of stations for each metal showed substantially different results (p = 0.001 for each). Studies have reported that the high load of Zn, Cu, As, and Pb may be attributed to anthropogenic activities, e.g., agricultural activities, releasing untreated sewage waste and dumping electronic waste [33,34,35,36,37]. Further, the concentration of these metals could differ from station to station due to the river discharge, surface runoff from the land, population density, and proximity to the urbanized and industrial areas [38,39].
Table 2 represents the comparison of this study with the previous studies conducted worldwide together with different international standards. It was found that the mean concentration of Fe (31,677.18 μg/g) recorded in this study was lower than in the shipbreaking yard in Chittagong (68,260 μg/g) [31] but higher than in the Karnaphuli River (3297.38 μg/g) [40]. The average Cu load in this study (44.19 μg/g) was lower than the Karnaphuli River (45.79 μg/g) [40] and Ulsan Bay (95.6 μg/g) [41]. Again, the concentration of Zn (52.52 μg/g) and Pb (2.07 μg/g) in Tanguar Haor was found to be higher than in the Karnaphuli River [40], the shipbreaking area [31], Ulsan Bay [41], and the Fenghe River [42]. In contrast, the As (25.69 μg/g) and Hg (0.38 μg/g) load in this experiment was found to be lower than in the shipbreaking area [31] and Ulsan Bay [41]. The hydrogeological flow and some soil properties, inhabiting plants in the system, may be responsible for the variation in the metal loads in Tanguar Haor. For instance, flooding and changes in the water level lead to transitions in the soil’s oxidation-reduction potential, which is thought of as a key factor in the destiny of metals [31]. Freshwater wetlands have redox interfaces that are ideal for microaerophilic iron (II) oxidizing bacteria because they have circumneutral pH, steep O2 gradients, and a steady source of Fe (II). High Fe-rich sediment accumulations and artificial redox gradients are created when lowland marshes are extensively drained. This oxidation reduction process may have increased the level of Fe in the study area. However, the mean value of Fe in this study was lower than the natural shale value. The absorption by the roots and stems of existing plants may be responsible for the variable amount of Cu, Zn and Pb in Tanguar Haor because plants remove metals through cation exchange, filtering, absorption, and chemical changes via the process of root aggregation [31]. Many of these aquatic plants have the capacity to store large amounts of metal in their tissues. Heavy metals usually accumulate in the roots of halophytes and diffuse in minute amounts to the stems and leaves as well. Direct and untreated waste discharge from local industries in the ecosystem may be attributed to the high concentration of Zn and Pb [43,44]. Furthermore, extensive use of fertilizers and pesticides in crop cultivation may also lead to a high As load in the environment [45]. However, the values of Cu and As in Tanguar Haor exceeded some well-established standard values (Table 2). Arsenic is naturally abundant in the South Asian region, where it has been determined to originate from eroded Himalayan sediments. It is thought to reach a solution following reductive release from solid phases under anaerobic conditions. Though all the values of metal concentration in this study did not exceed the shale value, except for As, some of these (e.g., Cu, As, and Hg) crossed the TEL values.

3.2. Contamination Levels Assesemnt of Metals in Sediments

The values of the contamination factor (CF) and enrichment factor (EF) for studied metals are presented in Table 3. The average CF values of Fe, Cu, Zn, As, Pb, and Hg ranged from 0.28 to 0.97, 0.89 to 1.03, 0.50to 0.60,1.45to 2.71, 0.1to 0.2 and 0.88to 1.05, respectively in Tanguar Haor. In this study, it was found that the CF value for Fe, Zn, and Pb in all sampling sites was below 1, indicating a low contamination level. In contrast, As (arsenic) showed a moderate contamination level (1 < CF < 3) in all sampling sites. In the case of Cu, the CF values specified a moderate contamination rate in sampling sites S2 and S3 but a low contamination rate in site S1. On the other hand, Hg showed a moderate contamination level in S2 and a low contamination level in S1 and S3 (Table 3).
The average EF values of Fe, Cu, Zn, As, Pb, and Hg ranged from 16.25 to 56.60, 52.81to 60.6, 29.25 to 35.12, 84.85to 158.4, 3.62to 6.94, and 51.09to 61.31, respectively. The EF values in this study clearly indicated that the metals in the sediment of Tanguar Haor were severely enriched. However, an EF value of more than 1.5 indicates that the metals originated from anthropogenic activities [55]. Principal sources of these metals could be associated with urban and industrial waste, as well as domestic waste, fossil fuel incineration and agricultural runoff [36,37,43,44]. Hence, further investigations are recommended to identify the exact sources of heavy metals in this Ramsar site to protect its ecology from pollution.
The Igeo values in this study for six metals were below 1 (Figure 2) in the sediments of Tanguar Haor, indicating an unpolluted to low pollution level (0 ≤ Igeo < 1). Igeo values have been used to explain the sediment quality [56]. However, among the metals, Cu and As showed the highest accumulation of metals in the sediment.

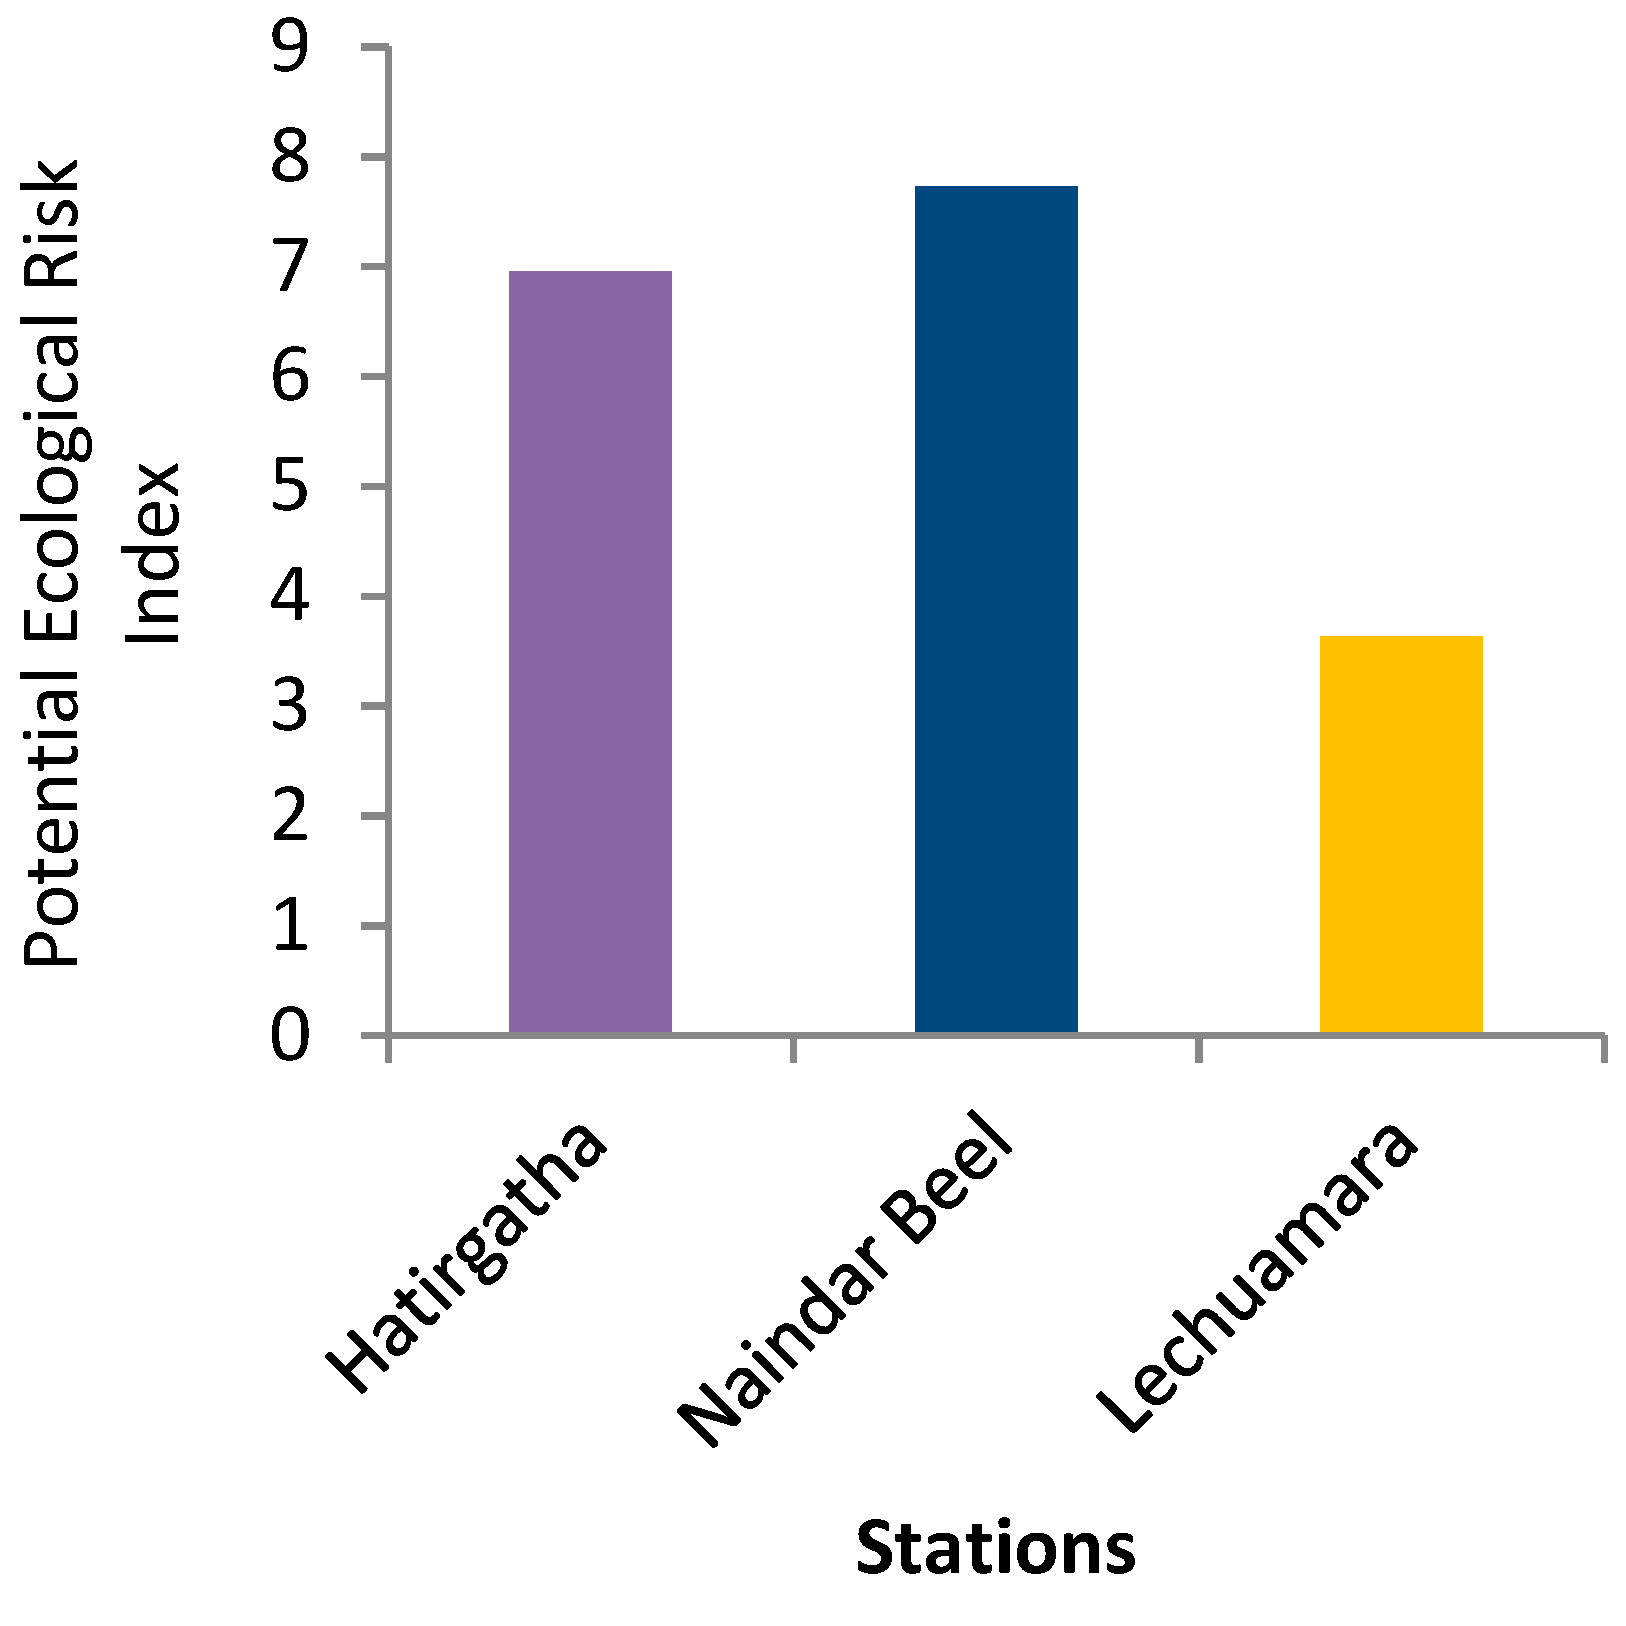
3.3. Potential Ecological Risk Assessment (PERI)

The calculated results for the potential ecological risk index of heavy metals in the surface sediment of Tanguar Haor are illustrated in Figure 3. Heavy metal pollution by a single element was obtained, and the degree of pollution from the six heavy metals decreased in the following sequence: As > Cu > Zn > Pb > Cr > Ni. In comparison with the other elements, the PERI for As was higher. However, the Eri values of Ni and Cr indicated low pollution in the sediment samples of Tanguar Haor.

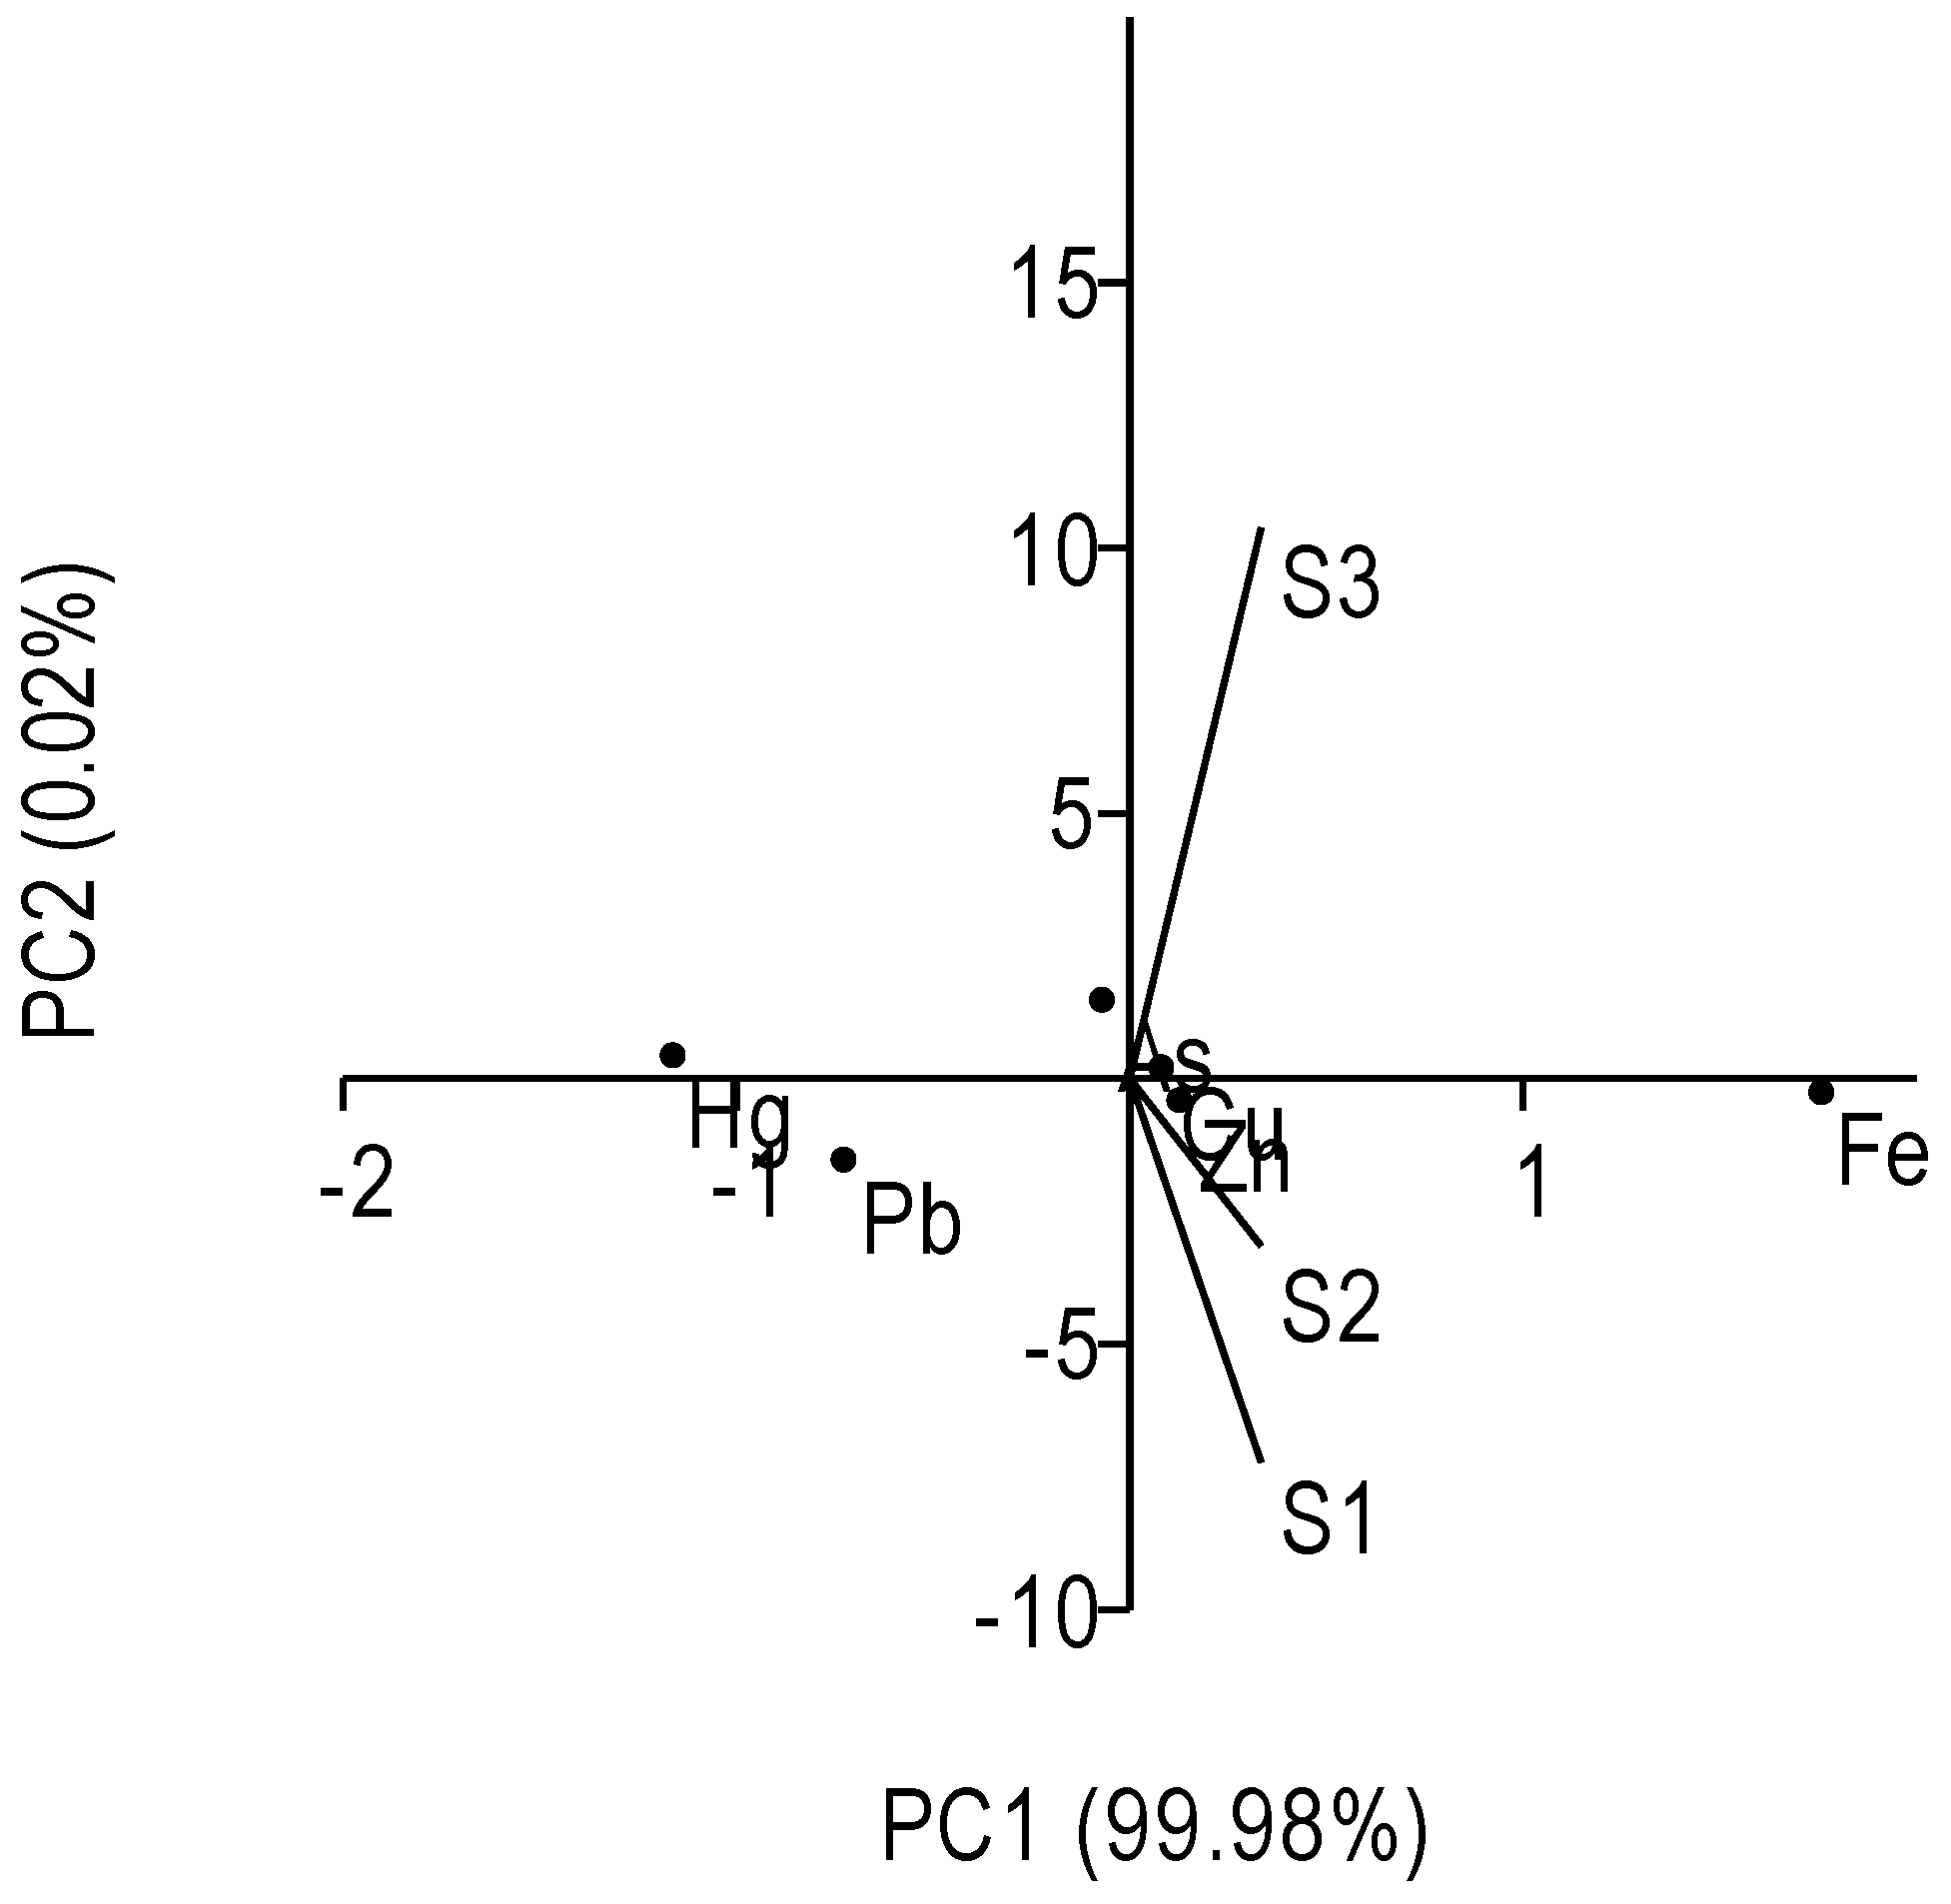
3.4. Source Identification of Heavy Metals Using Univariate and Multivariate Analyses

Correlations among heavy metals may reflect the origin and migration of these elements [57]. If no correlation exists among the elements, then the metals are not controlled by a single factor [58]. However, in this study, a very high positive correlation was observed in the case of Zn–Pb (r = 0.967), and a high positive correlation was found in Cu–As (r = 0.726). In contrast, a high negative correlation was documented between Zn–As (r = −0.758) and As–Pb (r = −0.898) (Table 4). Hence, the positive relationship between the identified metals specified that these originated from a common source, either natural or anthropogenic [59]. The Z score technique and log-transformed data were used to perform PCA. The original dataset dimension was decreased through PCA. Based on the PCA results, it was possible to separate the variables with eigenvalues >1 into two components. These two components, PC1 and PC2, contributed 99.98% and 0.019%, respectively, to the change (Figure 4). Fe is associated with the first component that accounts for the majority of the variation. Given that this metal was typically present in the soil’s parent material, lithogenic origins can be assumed for this component. The wetland’s soils were silted; hence, this region is referred to as an alluvial one. In addition, redox interfaces with circumneutral pH and a constant supply of Fe (II) from Fe-oxidizing bacteria (FeOB) raised Fe levels in freshwater wetlands. The concentration of this heavy metal in the soil as determined by this investigation is consistent with the ranges of concentration found in the parent material [6,15,60,61,62]. This finding suggests that the lithogenic component predominates the distribution of the majority of the studied elements. Hg and Pb, which may be linked to human activity, are included in the second component. Enrichment factor values also indicated their high levels, and it has been noted that Pb and Hg are easily accumulated in the topsoil [6]. Cu, Zn, and As are found at the base of the two axes, which shows that their origins are both lithogenic and anthropogenic. The results of CA, which divided the data into three groups to represent various areas, were nearly identical to those of PCA. The single metal (Fe) was in Group 1, followed by Groups 2 (Pb, Hg, and Zn), Group 3 (Cu, and As). Group 1 contained the most anthropogenic metal by volume.

3.5. Limitations of the Study

Although this is the first study to report heavy metal data from Tanguar Haor, it does have some drawbacks. Because of the project’s financial and time constraints, the sample size and the duration were limited, and the results should be considered preliminary. Other sediment characteristics, such as texture, organic matter, pH, and vegetation cover, which may affect the variation in metal concentrations at various sampling sites, were not feasible to include in this analysis because high levels of organic matter and clay allow plants to directly absorb or uptake metals from sediments. Due to these restrictions, longer investigations with a higher sample size are recommended. In addition, the contamination level of heavy metals in the water and organisms is still unknown.

3.6. Current Challenges and Future Perspectives

Few studies have documented the fact that the ecosystem services of the studied wetland have been reduced due to changes in land use, population growth and resultant anthropogenic pollution. However, the specific reasons for the reduced services are yet to be known. Pollution from various sources may be the reason. Therefore, future studies should focus on measuring the holistic ecological quality of the study area using water, sediment and biota, and identifying the specific sources of pollution.

4. Conclusions

This study assessed the trace element concentrations (Fe, Zn, Cu, Pb, As, and Hg) in the sediment of Tanguar Haor, the second Ramsar site in Bangladesh, for the first time. The results showed that the study area was in a low-to-moderate-pollution state. Arsenic concentrations were higher than the amounts found in natural shale. The concentration of Cu and Hg was very close to the shale value, indicating moderate levels of contamination. Land erosion, the use of agrochemicals and the disposal of untreated sewage may be attributed to this increased level. The findings suggest monitoring As, Cu, and Hg on a regular basis. Future studies should pay attention to identifying the specific sources of these metals. Different levels of contamination were evaluated by the use of several contamination assessment techniques. According to CF values, the area was moderately contaminated by As, Cu, and Hg. Additionally, the average EF values for As, Cu, and Hg were >50, indicating exceptionally severe enrichment. Arsenic levels are associated with a considerable risk, according to possible ecological risk assessment values. The results suggest that some areas could be impacted by anthropogenic sources that are highly contaminated with Cu, Fe, Zn, and As. Data on heavy metals and their possible risks at this Ramsar site of national and international importance are scant. As a result, our findings will be useful information for regulatory bodies, environmentalists, conservationists, and public health authorities to protect this area from further pollution. Furthermore, future researchers can use this data as a reference value for the evaluation of any further pollution status of this ecologically critical area.

Author Contributions

Conceptualization, M.B.H.; methodology, Y.N.J. and M.M.A.; formal analysis, M.M.A., A.-A.U.N., M.R.U.I. and S.A.; investigation, M.M.A., A.-A.U.N., M.S.R. and M.B.H.; resources, M.B.H. and M.F.A.; data curation, A.-A.U.N. and M.B.H.; writing—original draft preparation, M.M.A., A.-A.U.N. writing—review and editing, M.R.U.I., M.B.H., M.F.A., J.Y. and T.A.; visualization, M.F.A.; supervision, M.B.H. and M.F.A.; project administration, M.B.H.; funding acquisition, M.B.H., M.F.A. and T.A. All authors have read and agreed to the published version of the manuscript.

Funding

This research was funded by the Researchers Supporting Project Number (RSP2023R436), King Saud University, Riyadh, Saudi Arabia.

Institutional Review Board Statement

Not applicable as the study did not involve humans or animals.

Informed Consent Statement

Not applicable.

Data Availability Statement

Data are provided in the article.

Acknowledgments

The authors would like to extend their sincere appreciation to the Researchers Supporting Project number (RSP2023R436), King Saud University, Riyadh, Saudi Arabia.

Conflicts of Interest

The authors declare that there is no conflict of interest.

References

  1. Hu, S.; Niu, Z.; Chen, Y.; Li, L.; Zhang, H. Global wetlands: Potential distribution, wetland loss, and status. Sci. Total Environ. 2017, 586, 319–327. [Google Scholar] [CrossRef] [PubMed]
  2. Wantzen, K.M.; Alves, C.B.M.; Badiane, S.D.; Bala, R.; Blettler, M.; Callisto, M.; Zingraff-Hamed, A. Urban stream and wetland restoration in the Global South—A DPSIR analysis. Sustainability 2019, 11, 4975. [Google Scholar] [CrossRef]
  3. Shen, X.; Liu, B.; Jiang, M.; Lu, X. Marshland loss warms local land surface temperature in China. Geophys. Res. Lett. 2020, 47, e2020GL087648. [Google Scholar] [CrossRef]
  4. Shen, X.; Jiang, M.; Lu, X.; Liu, X.; Liu, B.; Zhang, J.; Wang, Z. Aboveground biomass and its spatial distribution pattern of herbaceous marsh vegetation in China. Sci. China Earth Sci. 2021, 64, 1115–1125. [Google Scholar] [CrossRef]
  5. Fluet-Chouinard, E.; Stocker, B.D.; Zhang, Z.; Malhotra, A.; Melton, J.R.; Poulter, B.; McIntyre, P.B. Extensive global wetland loss over the past three centuries. Nature 2023, 614, 281–286. [Google Scholar] [CrossRef]
  6. Costanza, R.; Anderson, S.J.; Sutton, P.; Mulder, K.; Mulder, O.; Kubiszewski, I.; Dee, G. The global value of coastal wetlands for storm protection. Glob. Environ. Change 2021, 70, 102328. [Google Scholar] [CrossRef]
  7. Alam, A.B.M.S.; Badhon, M.K.; Sarker, M.W. Biodiversity of Tanguar Haor: A Ramsar Site of Bangladesh Volume III: Fish; IUCN, International Union for Conservation of Nature, Bangladesh Country Office: Dhaka, Bangladesh, 2015; p. xii+216. [Google Scholar]
  8. GoB (Government of Bangladesh). Tanguar Haor Wetland. Biodiversity Conservation Project; Ministry of Environment and Forest, Goverment of the People’s Republic of Bangladesh: Dhaka, Bangladesh, 2004; p. 73.
  9. Sun, C.; Zhen, L.; Miah, M.G. Comparison of the ecosystem services provided by China’s Poyang Lake wetland and Bangladesh’s Tanguar Haor wetland. Ecosyst. Serv. 2017, 26, 411–421. [Google Scholar] [CrossRef]
  10. Pradit, S.; Noppradit, P.; Jitkaew, P.; Sengloyluan, K.; Kobkeatthawin, T.; Laerosa, A.; Sirivithayapakorn, S. Heavy Metal Contamination and Ecological Risk Assessment in the Sediment Cores of the Wetlands in Southern Thailand. J. Mar. Sci. Eng. 2022, 10, 1921. [Google Scholar] [CrossRef]
  11. Singh, J.; Sharma, P.; Mishra, V. Simultaneous removal of copper, nickel and zinc ions from aqueous phase by using mould. Int. J. Environ. Sci. Technol. 2023, 20, 1937–1950. [Google Scholar] [CrossRef]
  12. Kljaković-Gašpić, Z.; Herceg-Romanić, S.; Kožul, D.; Veža, J. Biomonitoring of organochlorine compounds and trace metals along the Eastern Adriatic coast (Croatia) using Mytilus galloprovincialis. Mar. Pollut. Bull. 2010, 60, 1879–1889. [Google Scholar] [CrossRef]
  13. Türkmen, A.; Türkmen, M.; Tepe, Y.; Akyurt, I. Heavy metals in three commercially valuable fish species from Iskenderun Bay, Northern East Mediterranean Sea, Turkey. Food Chem. 2005, 91, 167–172. [Google Scholar] [CrossRef]
  14. Hossain, M.S.; Nayeem, A.; Majumder, A.K. Impact of flash flood on agriculture land in Tanguar Haor Basin. Int. J. Res. Environ. Sci. 2017, 3, 42–45. [Google Scholar]
  15. Bhuiyan, M.A.; Asaduzzaman, K.; Kowser, A.; Islam, S.; Islam, M.; Kakoly, S.; Khondker, M. Natural Radioactivity Levels and Radiological Risk Assessment of Surface Water of Wetland Tanguar Haor, Sunamganj District, Bangladesh. Bangladesh J. Rad. Nucl. Appl. 2019, 4, 117–125. [Google Scholar]
  16. Bhuiyan, M.A.H.; Kowser, A.; Islam, S.A.M.S.; Mohid, M.; Islam, M.R.; Kakoly, S.A.; Khondker, M. Phytoplankton flora of Tanguar Haor Ecosystem of Bangladesh: Chlorophyta. J. Biodivers. Conserv. Bioresour. Manag. 2019, 5, 101–106. [Google Scholar] [CrossRef]
  17. Hossain, M.S.; Islam, M.S.; Mondal, P.; Hoq, M.E. Assessment of aquatic natural resources in the Tanguarhaor at Sunamgonj, Bangladesh. Bangladesh J. Fish. Res. 2012, 15, 81–92. [Google Scholar]
  18. Hussain, M.G. Biological Diversity Status of Fish Genetic Resources at Tanguar Haor Wetland in Bangladesh. Bangladesh Marit. J. 2021, 5, 193–206. [Google Scholar]
  19. Ara, D.; Islam, S.M.Z. Role of Stakeholders in Preserving Biodiversity in Bangladesh: A Study on Tanguar Haor. Int. J. Manag. 2019, 10, 17–38. [Google Scholar] [CrossRef] [PubMed]
  20. Khan, M.M.H.; Khan, T.A.N.I.A.; Ahmed, A.; Shovon, T.A. Notes on nesting Bristled Grassbird Chaetornis striata, Tanguar Haor, Bangladesh. Bird. ASIA 2015, 24, 93–95. [Google Scholar]
  21. Solayman, H.M.; Baten, M.A.; Khan, M.B. Status and economic valuation of ecosystem services of Tanguar haor: A wetland of Bangladesh. J. Bangladesh Agric. Univ. 2018, 16, 237–243. [Google Scholar] [CrossRef]
  22. Hasan, A.M.; Awoal, R.; Sumon, T.A.; Alal, M.; Hossen, T.A.; Chowdhury, M.A.; Uddin, M.S. Species diversity and seasonal composition of aquatic weeds in Tanguar haor area at Taherpur upazilla under Sunamganj district, Bangladesh. Int. J. Fish. Aquat. Stud. 2018, 6, 570–574. [Google Scholar]
  23. IUCN (International Union for Conservation of Nature). Tanguar Haor Management Plan Framework and Guidelines; IUCN Bangladesh Country Office: Dhaka, Bangladesh, 2015; p. xiv+202. [Google Scholar]
  24. Sobhan, I.; Alam, A.B.M.S.; Chowdhury, M.S.M. Biodiversity of Tanguar Haor: A Ramsar Site of Bangladesh, Vol. 2: Flora; IUCN Bangladesh: Dhaka, Bangladesh, 2012; p. xii+236. [Google Scholar]
  25. Chowdhury, A.H. The state of Community based Sustainable Management of Tanguar Haor. In Proceedings of the 16th Annual International Sustainable Development Research Conference, The Kadoorie Institute, University of Hong Kong, Hong Kong, 30 May–1 June 2010; Available online: http://www.kadinst.hku.hk/sdconf10/Papers_PDF/p35.pdf (accessed on 23 April 2022).
  26. IUCN (International Union for Conservation of Nature). Disaster Risk Reduction (DRR) on Tanguar Haor; IUCN Country Office: Dhaka, Bangladesh, 2010; p. 35. [Google Scholar]
  27. Rahaman, M.M.; Sajib, K.I.; Alam, I. Impacts of climate change on the livelihoods of the people in Tanguar Haor, Bangladesh. J Water Resour. Eng. Manag. 2016, 3, 1–9. [Google Scholar]
  28. IUCN (International Union for Conservation of Nature). Community Based Sustainable Management of Tanguar Haor: 2nd Phase Ministry of Environment and Forests, Government of Bangladesh; IUCN Country Office: Dhaka, Bangladesh, 2011. [Google Scholar]
  29. Bagchi, R.; Miah, M.A.; Hazra, P.; Hasan, R.; Mondal, H.S.; Paul, S.K. Exploring the effect of rainfall variability and water extent in Tanguar haor, Sunamganj. Aust. J. Eng. Innov. Technol. 2020, 2, 66–76. [Google Scholar]
  30. Mamun, S.A.; Roy, S.; Rahaman, M.S.; Jahan, M.; Islam, M.S. Status of Fisheries Resources and Water Quality of Tanguar Haor. J. Environ. Sci. Nat. Resour. 2013, 6, 103–106. [Google Scholar] [CrossRef]
  31. Rahman, M.S.; Hossain, M.B.; Babu, S.O.F.; Rahman, M.; Ahmed, A.S.; Jolly, Y.N.; Choudhury, T.R.; Beguma, B.A.; Kabir, J.; Akter, S. Source of metal contamination in sediment, their ecological risk, and phytoremediation ability of the studied mangrove plants in ship breaking area, Bangladesh. Mar. Pollut. Bull. 2019, 141, 137–146. [Google Scholar] [CrossRef] [PubMed]
  32. USEPA. Supplemental Guidance for Developing Soil Screening Levels for Superfund Sites; OSWER 9355.4-24; Office of Solid Waste and Emergency Response, U.S. Environmental Protection Agency: Washington, DC, USA, 2001.
  33. Alengebawy, A.; Abdelkhalek, S.T.; Qureshi, S.R.; Wang, M.Q. Heavy metals and pesticides toxicity in agricultural soil and plants: Ecological risks and human health implications. Toxics 2021, 9, 42. [Google Scholar] [CrossRef]
  34. Chen, H.; Wang, L.; Hu, B.; Xu, J.; Liu, X. Potential driving forces and probabilistic health risks of heavy metal accumulation in the soils from an e-waste area, southeast China. Chemosphere 2022, 289, 133182. [Google Scholar] [CrossRef]
  35. Dutta, D.; Goel, S.; Kumar, S. Health risk assessment for exposure to heavy metals in soils in and around E-waste dumping site. J. Environ. Chem. Eng. 2022, 10, 107269. [Google Scholar] [CrossRef]
  36. Lu, J.; Yuan, M.; Hu, L.; Yao, H. Migration and Transformation of Multiple Heavy Metals in the Soil–Plant System of E-Waste Dismantling Site. Microorganisms 2022, 10, 725. [Google Scholar] [CrossRef]
  37. Zhou, Y.; Jiang, D.; Ding, D.; Wu, Y.; Wei, J.; Kong, L.; Deng, S. Ecological-health risks assessment and source apportionment of heavy metals in agricultural soils around a super-sized lead-zinc smelter with a long production history, in China. Environ. Pollut. 2022, 307, 119487. [Google Scholar] [CrossRef]
  38. Silva, H.F.; Silva, N.F.; Oliveira, C.M.; Matos, M.J. Heavy metals contamination of urban soils—A decade study in the city of lisbon, portugal. Soil Syst. 2021, 5, 27. [Google Scholar] [CrossRef]
  39. Islam, M.S.; Hossain, M.B.; Matin, A.; Sarker, M.S.I. Assessment of heavy metal pollution, distribution and source apportionment in the sediment from Feni River estuary, Bangladesh. Chemosphere 2018, 202, 25–32. [Google Scholar] [CrossRef] [PubMed]
  40. Siddique, M.A.M.; Aktar, M. Heavy metals in salt marsh sediments of porteresia bed along the Karnafully River coast, Chittagong. Soil Water Res. 2012, 7, 117–123. [Google Scholar] [CrossRef]
  41. Ra, K.; Kim, J.-K.; Hong, S.H.; Yim, U.H.; Shim, W.J.; Lee, S.-Y.; Kim, Y.-O.; Lim, J.; Kim, E.-S.; Kim, K.-T. Assessment of pollution and ecological risk of heavy metals in the surface sediments of Ulsan Bay, Korea. Ocean Sci. J. 2014, 49, 279–289. [Google Scholar] [CrossRef]
  42. Luo, P.; Xu, C.; Kang, S.; Huo, A.; Lyu, J.; Zhou, M.; Nover, D. Heavy metals in water and surface sediments of the Fenghe River Basin, China: Assessment and source analysis. Water Sci. Technol. 2021, 84, 3072–3090. [Google Scholar] [CrossRef]
  43. Aktaruzzaman, M.; Chowdhury, M.A.Z.; Fardous, Z.; Alam, M.K.; Hossain, M.S.; Fakhruddin, A.N.M. Ecological risk posed by heavy metals contamination of ship breaking yards in Bangladesh. Int. J. Environ. Res. 2014, 8, 469–478. [Google Scholar]
  44. Mohiuddin, K.M.; Otomo, K.; Ogawa, Y.; Shikazono, N. Seasonal and spatial distribution of trace elements in the water and sediments of the Tsurumi River in Japan. Environ. Monit. Assess. 2012, 184, 265–279. [Google Scholar] [CrossRef]
  45. Gu, Y.G.; Li, Q.S.; Fang, J.H.; He, B.Y.; Fu, H.B.; Tong, Z.J. Identification of heavy metal sources in the reclaimed farmland soils of the pearl river estuary in China using a multivariate geostatistical approach. Ecotoxicol. Environ. Saf. 2014, 105, 7–12. [Google Scholar] [CrossRef]
  46. Harikrishnan, N.; Ravisankar, R.; Chandrasekaran, A.; Gandhi, M.S.; Kanagasabapathy, K.V.; Prasad, M.V.R.; Satapathy, K.K. Assessment of heavy metal contamination in marine sediments of east coast of Tamil Nadu affected by different pollution sources. Mar. Pollut. Bull. 2017, 121, 418–424. [Google Scholar] [CrossRef]
  47. Venkatramanan, S.; Ramkumar, T.; Anithamary, I.; Vasudevan, S. Heavy metal distribution in surface sediments of the Tirumalairajan river estuary and the surrounding coastal area, east coast of India. Arab. J. Geosci. 2014, 7, 123–130. [Google Scholar] [CrossRef]
  48. Pandiyan, J.; Mahboob, S.; Govindarajan, M.; Al-Ghanim, K.A.; Ahmed, Z.; Al-Mulahim, N.; Jagadheesan, R.; Krishnappa, K. An assessment of level of heavy metals pollution in the water, sediment and aquatic organisms: A perspective of tackling environmental threats for food security. Saudi J. Biol. Sci. 2021, 28, 1218–1225. [Google Scholar] [CrossRef]
  49. MOF (Ministry of Oceans and Fisheries). Marine Water and Sediment Quality Standard in Korea. 2013. Available online: http://www.mof.go.kr (accessed on 25 July 2022).
  50. Turekian, K.K.; Wedepohl, K.H. Distribution of the elements in some major units of the earth’s crust. Geol. Soc. Am. Bull. 1961, 72, 175–192. [Google Scholar] [CrossRef]
  51. GESAMP. The Review of the Health of the Oceans; Reports and Studies No. 15; GESAMP: Geneva, Switzerland, 1982; p. 108. [Google Scholar]
  52. Salomons, W.; Forstner, U. Metals in the Hydro-Cycle; Springer: Berlin/Heidelberg, Germany, 1984; p. 349. [Google Scholar]
  53. IAEA. Guidebook on Applications of Radiotracers in Industry; Technical Report Series No. 316; IAEA: Vienna, Austria, 1990. [Google Scholar]
  54. Center, China Environmental Monitoring. Chinese Soil Element Background Concentent; Chinese Environment Science Press: Beijing, China, 1990. [Google Scholar]
  55. Birch, G.F.; Olmos, M.A. Sediment-bound heavy metals as indicators of human influence and biological risk in coastal water bodies. ICES J. Mar. Sci. 2008, 65, 1407–1413. [Google Scholar] [CrossRef]
  56. Karbassi, A.R.; Monavari, S.M.; Bidhendi, G.R.N.; Nouri, J.; Nematpour, K. Metal pollution assessment of sediment and water in the Shur River. Environ. Monit. Assess. 2008, 147, 107. [Google Scholar] [CrossRef]
  57. Suresh, G.; Ramasamy, V.; Meenakshisundaram, V.; Venkatachalapathy, R.; Ponnusamy, V. Influence of mineralogical and heavy metal composition on natural radionuclide concentrations in the river sediments. Appl. Radiat. Isot. 2011, 69, 1466–1474. [Google Scholar] [CrossRef] [PubMed]
  58. Kükrer, S.; Şeker, S.; Abacı, Z.T.; Kutlu, B. Ecological risk assessment of heavy metals in surface sediments of northern littoral zone of Lake Çıldır, Ardahan, Turkey. Environ. Monit. Assess. 2014, 186, 3847–3857. [Google Scholar] [CrossRef] [PubMed]
  59. Singh, M.; Müller, G.; Singh, I.B. Heavy metals in freshly deposited stream sediments of rivers associated with urbanisation of the Ganga Plain, India. Water Air Soil Pollut. 2002, 141, 35–54. [Google Scholar] [CrossRef]
  60. IUCN (International Union for Conservation of Nature). Bio-Ecological Zones of Bangladesh; International Union for Conservation of Nature and Natural Resources: Dhaka, Bangladesh, 2002; p. 31. [Google Scholar]
  61. Mmolawa, K.B.; Likuku, A.S.; Gaboutloeloe, G.K. Assessment of heavy metal pollution in soils along major roadside areas in Botswana. Afr. J. Environ. Sci. Technol. 2011, 5, 186–196. [Google Scholar]
  62. Muller, G. Index of geo-accumulation in sediments of the Rhine River. Geo. J. 1969, 2, 108–118. [Google Scholar]
Figure 1. Map showing sampling sites in Tanguar Haor, Sunamganj, Bangladesh.
Sustainability 15 07753 g001
Figure 2. Geo−accumulation index (Igeo) of metals in the sediments of Tanguar Haor.
Sustainability 15 07753 g002
Figure 3. Potential ecological risk (PER) value of heavy metals in sediments.
Sustainability 15 07753 g003
Figure 4. Principal component and cluster analyses of the metals in the sediment of Tanguar Haor.
Sustainability 15 07753 g004aSustainability 15 07753 g004b
Table 1. The mean values of metal concentration in the sediment (μg /g) on dry weight basis.
MetalsS1S2S3
Fe45,675 ± 3390.2213,140.39 ± 17,777.2736,216.13 ± 22,170.19
Cu40.07 ± 4.9345.96 ± 8.5846.29 ± 6.74
Zn52.81 ± 3.1157.15 ± 6.5147.60 ± 1.87
As18.89 ± 1.6422.93 ± 2.2835.23 ± 8.40
Pb2.38 ± 0.622.64 ± 1.861.24 ± 1.03
Hg0.35 ± 0.050.42 ± 0.040.37 ± 0.03
Table 2. Comparison of metals in sediment (μg/g dw) with different international guidelines and other studies in the world.
CountryName of Sampling Area FeCuZnAsPbHgReferences
BangladeshTanguar Haor31,677.1844.1952.5225.692.070.38Present Study
Karnaphuli River,
Chittagong
3297.3845.79105.0NA26.7NA[40]
Sitakunda, Chittagong68,26018.7151.510.5590NA[31]
Feni River EstuaryNANANA0.856.470.71[39]
IndiaTamil Nādu NANA39.49NANANA[46]
Thirumalairajan River1736.3–314413.65–28.1723.4–56.32NA1.73–6.74NA[47]
Point Calimere Wildlife SanctuaryNA0.4 0.3 NA2.5 26.0 [48]
South KoreaUlsan BayNA95.6361.915.890.70.16[41]
ChinaFenghe River BasinNA28.7390.39250.32 30.20NA[42]
TEL -20.668.414.5440.11[49]
PEL -64.415775.51190.62[49]
Shale value 47,200459513200.4[50]
Standard values 41,000 a33 a95 b13 c19 b0.5 d
TEL: threshold effects level. PEL: probable effects level. a [51], b [52], c [53], d [54].
Table 3. Contamination factor (CF) and enrichment factor (EF) of heavy metals for sediments of all sites studied in Tanguar Haor.
StationsFeCuZnAsPbHg
CFEFCFEFCFEFCFEFCFEFCFEF
S10.97056.600.8952.810.5532.461.4584.850.1836.940.87551.09
S20.27816.251.0259.630.6035.121.76102.990.207.701.0561.31
S30.76744.801.02860.60.5029.252.71158.40.0953.620.92554.0
Table 4. Correlation matrix of the analyzed heavy metals in sediment samples.
FeCuZnAsPbHg
Fe1
Cu−0.6891
Zn−0.651−0.1021
As−0.0020.726−0.7581
Pb−0.437−0.3500.967 **−0.898 *1
Hg−0.367−0.2010.580.3110.4511
* indicates significant relation (p < 0.05). ** indicates highly significant relation (p < 0.01).
Disclaimer/Publisher’s Note: The statements, opinions and data contained in all publications are solely those of the individual author(s) and contributor(s) and not of MDPI and/or the editor(s). MDPI and/or the editor(s) disclaim responsibility for any injury to people or property resulting from any ideas, methods, instructions or products referred to in the content.

