Article

Exploring the Influence of Environmental Investment on Multinational Enterprises’ Performance from the Sustainability and Marketability Efficiency Perspectives

Department of International Business Administration, Chinese Culture University, Taipei 11114, Taiwan
*
Author to whom correspondence should be addressed.
Sustainability 2023, 15(10), 7779; https://doi.org/10.3390/su15107779
Submission received: 25 March 2023 / Revised: 20 April 2023 / Accepted: 4 May 2023 / Published: 9 May 2023

Abstract

:
Sustainable development strategies are necessary to ensure sustainable performance even though resources are scarce in a firm. In this study, a two-stage production process is designed to analyze a firm’s performance, including sustainability and marketability, using a two-stage network data envelopment analysis. This process will help managers of a firm understand how to improve sustainability and marketability efficiency. The relationship between environmental investment and firm performance is also investigated using truncated regression. The results show that the environmental innovation score (EIS) and resource use score (RUS) have significant negative relationships with firm performance in the short term due to the fact of additional expenses incurred during the innovative research and development of new products and services. Moreover, the study reveals that the emission score positively affects both sustainability efficiency and marketability efficiency, while EIS and RUS have no effects on the efficiencies. These empirical findings are meant to assist managers in better comprehending the characteristics of business sustainability across industries with varying scales and performance levels, offer better business strategies for resource allocation, and enhance a firm’s performance in the post-pandemic era.

1. Introduction

The COVID-19 pandemic has had a profound impact on all aspects of life globally. The impact on a variety of areas, including the economy, education, society, ecology, and globalization, has spawned both favorable and unfavorable consequences [1]. In today’s rapidly changing and competitive economy, multinational enterprises (MNEs) are faced with the pressure of developing corporate social responsibility and sustainability to enhance the firm’s performance beyond financial performance [2,3]. In addition, MNEs are now confronting many more challenges in relation to supply chain resilience and risk control under the ongoing pandemic. Industry trends and market volatility are key to guiding business executives in making strategic decisions that are both directly and indirectly affected by the pandemic. They have been eagerly seeking to build an agile and innovative production model with more flexibility to maintain the firm’s performance during the uncertain times that characterize the pandemic.
With the growth of global industrialization, MNEs have played a critical role in maintaining the ecological environment [4,5]. In 2008, the OECD published guidelines for the promotion and conduct of socially responsible businesses, ensuring that all MNEs aim to keep up with policies on the sustainable development of enterprises and societies and to devote themselves to stopping climate change [6]. Hence, managers of MNEs have mostly accepted corporate sustainability as a precondition for conducting their businesses.
The existing literature on corporate sustainability mostly focuses on discussing the relationship among three practical elements: (1) degree of a company’s financial performance, (2) sustainability performance, and (3) caliber of its sustainability disclosure. In addition, the most wildly accepted assessment of sustainability is the three-pillar concept: environmental, social, and governance (ESG). The relationship between the organizational level and social responsibility is thus a common topic of ESG research [7]. Despite the concept of sustainability being viewed as a distinct research field, the definition of the concept is often found to be ambiguous and incoherent. Additionally, in searching for its universal applicability across different industries, the existing literature on sustainability is scares in terms of cross-industry research. Whereas research on a specific industry is limited in its generalizability, multi-industry research offers greater universal applicability to organizations in different industries [8]. With the growing interest in ESG across industries, the relationship between the sustainability and firm performance of an MNE in different sectors is hardly known, with very limited published literature [7]. Some researchers claim that there is a positive relationship between sustainability and profitability but not for all industries. In addition, recent studies on US MNEs suggests that prioritizing ESG goals in a firm may not make a positive difference in the firm’s ESG performance but engender poor firm performances instead.
The objectives of this study are twofold. First, we investigated the competitiveness of MNEs across sectors from the perspectives of sustainability efficiency and marketability efficiency. Second, this study explored the relationship between environmental investment and firm performance in different sectors. Our research contributes to the development of production processes for multinational enterprises (MNEs) by introducing two stages of efficiency measurement, namely, sustainability efficiency and marketability efficiency, to evaluate the overall firm performance of MNEs. The traditional data envelopment analysis (DEA) model and other methods are limited in their ability to evaluate efficiency at different stages of production, which is where our two-stage network DEA model comes in. Our model allows for the decomposition of the efficiency value of a decision-making unit (DMU) and benchmarking of the best performance of firms across sectors in each stage. Since environmental investment has become an inevitable business strategy for MNEs, our study contributes to the existing literature by integrating undesired variables into the two-stage network DEA model as the mechanism through an investigation of the relationship between environmental investment and firm performance. Moreover, our model demonstrates that each MNE’s performance can be measured by different returns to scale in order to study the effects of firm scale on a production process in the post-pandemic era for future decision-making reference.
We intend to use these empirical results to help managers of firms better understand the characteristics of sustainability in enterprises across industries with varying scales and performance levels. Moreover, we want to provide enterprises with useful business strategies for resource allocation to boost firm performance in the post-pandemic era.

2. Literature Review

2.1. Environmental Management and ESG

With the publication of the Brundtland Report, the idea of sustainability first became an international policy and has since been regarded as a crucial business and investment strategy [9] that aims to balance the demands of both present and future generations [10]. According to this definition, three critical elements of corporate sustainability can be identified as the integration of economic, ecological, and social aspects, known as Bennett and James’s “triple-bottom line” [11,12]. Sustainability has been recognized as intergenerational equity, which has also become an essential core value and goal to contribute to global society and commit to preserving the natural environment for future generations [11]. The awareness of environmental issues by society and stakeholders influences a firm’s behavior and strategies to implement sustainability practices [13]. In particular, an MNE plays a significant role in the advancement of ecological sustainability; thus, discussions about corporate behaviors and supervisors concerning ecological sustainability have rapidly increased through the corporate world [14].
Bowen proposed one of the very first definitions of CSR (corporate social responsibility) in 1953, stating that it is “the obligation of a businessman to pursue those policies, to make those decisions, or to follow those lines of actions which are desirable in terms of the objectives and values of our society” [15]. CSR refers to a firm’s social responsibility towards society and aims to develop beneficial activities in different aspects, such as financial, environmental, and social influences. Later, the ESG principle was developed in 2004 and practiced eagerly in developed countries, mostly in Europe and North America. Firms from across countries joined together in promoting the development of ESG principles [16]. Following the European Banking Authority’s Annual Report [17], the definition of ESG was addressed as follows: “ESG factors are environmental, social, or governance matters that may have a positive or negative impact on the financial performance or solvency of an entity, sovereign, or individual”. Thus, ESG has been recognized as a standard and investment concept to evaluate the sustainable development of an enterprise with its corporate behavior and financial performance. The three factors are the key elements to be considered in decision-making process and investment strategy analysis [7,16]. Subsequently, a growing number of countries pay attention to sustainability due to the fact of severe environmental pollution and exhaustion of natural resources. To minimize negative environmental effects, many leading countries, such as the United States, enact related policies to promote sustainable manufacturing [18]. The number of ESG regulations has been rapidly growing globally. In the US, national regulations have become seriously strict since 2015, especially in the utilities, financial services, and health care pharmaceutical industries [19]. On the key issue of global carbon reduction, at the 2022 United Nations Climate Change Conference of the Parties (COP27), the US government launched the Net-Zero Government Initiative to invite 18 countries to lead and achieve net-zero emissions by the year 2050. Before this, MNEs announced that they would achieve net-zero emissions by 2030. In conclusion, based on prior literature reviews, it is generally understood that environmental managerial development inevitably becomes a priority for MNEs. The issues of environmental management ought to be discussed by different industries and enterprises associated with ESG in the major sectors in the US.

2.2. Firm Performance—Sustainability Efficiency and Marketability Efficiency

Farrell [20] was one of the first authors to define efficiency measurement and present techniques for evaluating efficiency scores. A mathematical programming technique called data envelopment analysis (DEA) uses a data-oriented approach to assess the performance of groups of entities known as decision-making units (DMUs), which transform numerous inputs into multiple outputs [21]. DEA is known as an effective tool to evaluate the efficiency of DMUs, which utilizes the concept of the efficient frontier as a measurement of performance. The efficient frontier shall be calculated by DEA and serve as an empirical standard of excellence appropriately [22,23]. Previous authors examined banks’ marketability performance by the revenue and profit generated, which were found to serve as intermediate factors and outputs from the first stage and inputs into the second [24]. This research adopted a two-stage network DEA to characterize the relationships among multiple inputs and multiple outputs for measuring firm performance in sustainability and marketability perspectives. Since opportunities for production are so different among firms, such as the input–output combinations, efficiency researchers have examined separate production frontiers across industries [25]. In our analysis, we include desirable outputs and an undesirable output (CO2 emission), which require distinct treatment for evaluating regional performance. By utilizing the classification invariance property [26], we can implement the two-stage network DEA model to improve performance through increased desirable outputs and decreased undesirable outputs.
Accordingly, a firm’s sustainability performance is measured by its utilization of resources, invested from the perspective of economic, environmental, social, and governance factors, making an impact on the firm and society [27,28]. The critical challenge of a business model is to gain economic value by delivering social and environmental benefits. Previous authors examined the relationship between 243 firms’ economic performance and their environmental performance over two years, and the results indicate that it pays to be green [29,30]. To analyze financial efficiency and eco-efficiency, a study used DEA to measure firm performance for 272 firms in 16 industries based in South Korea in 2010 with data on equity, assets, profit, and sales amounts. Some researchers pointed out that the key route of DEA applications in sustainability concentrates on environmental sustainability, with the research literature regarding corporate sustainability assessment, sustainability performance analysis, etc. [31,32]. This presents the academic trend of adopting the DEA method in sustainability issues. Compared to the traditional quantitative analysis of efficiency, DEA allows for assessing the relative efficiency by determining multiple inputs and outputs simultaneously with flexibility in a wide range of datasets. The advantage of DEA is to identify the most efficient unit by an optimization process. In summary, although many investigations have used DEA methods in firms and various industries worldwide, they mostly concentrated on a single industry’s aggregated ESG dimensions with different DEA methods [33,34,35]. Very few studies precisely investigated and compared different sectors in this context. To address the aforementioned research gap, this study applied two-stage techniques to investigate the affiliation between environmental investment and firm performance within the US market, and this is first study that focuses on an environmental perspective using hybrid DEA methods and truncated regression.

2.3. Environmental Investment and Firm Performance

Environmental sustainability is increasingly becoming a crucial factor in determining a company’s present performance and future promises [36]. The competitive advantages of ESG-responsible firms, including better efficiency and competitiveness, minimized operation costs and financial risks, and enhanced reputation and consumer trust, are factors that lead to higher organizational sustainable performance [37]. Numerous researchers have claimed that sustainability developments, including environmental investment [38], positively affect financial performance [39,40]. A bank’s investment in social responsibility has positive effects on its firm performance, especially from an environmental aspect, according to stakeholder- and resource-based theories [41]. The leading corporate sustainability-developed firm had a much larger scale and a higher percentage of return on equity than its competitors in terms of financial performance [27], which is consistent with previous findings for those firms in the US. Targeting US firms, CSR performance is positively associated with firm value because of successful risk avoidance [41]. Again, a positive relationship was found between corporate environmental and financial performance from a total of 617 companies in Europe and the United States [42]. A meta-analysis suggested that pursuing corporate environmental management can be a strategy for raising corporate financial performance [43]. In addition, firms with a higher ESG performance were found to have higher firm profitability; however, it differed in Australia for financial firms and nonfinancial firms [44]. On the contrary, some researchers found a negative relationship between environmental investment and corporate efficiency. One discovered that corporate social responsibility measured by Tobin’s Q had a negative influence on corporate value for Brazilian firms [45]. Some studies also investigated the banking sector to determine how ESG influences bank value and performance. Some found that their relationship may not be linear [42]. By examining the correlation between environmental performance and the value of shareholders, it was found that the market does not react significantly to corporate environmental initiatives [46]. Although ESG profile and events were claimed to be significantly related to its market, leadership, performance, and value [16], there still exist hypotheses that are not resolved. Management scholars often mention the ambiguity of this field [47,48], and Montiel and Delgado-Ceballos [49] highlighted evidence of a lack of a common definition for corporate sustainability. Researchers have struggled to discover a universal understanding of corporate sustainability and the proper way to measure individual factors associated with environmental practices [8]. An overview of the mixed empirical literature presented that a total of only 5 out of 24 works of literature focused on sustainability engagement from an environmental perspective [50]. This current research contributes to filling the gap in the literature by examining corporate performance and sustainability performance from an environmental perspective by applying the DEA method.

3. Research Method

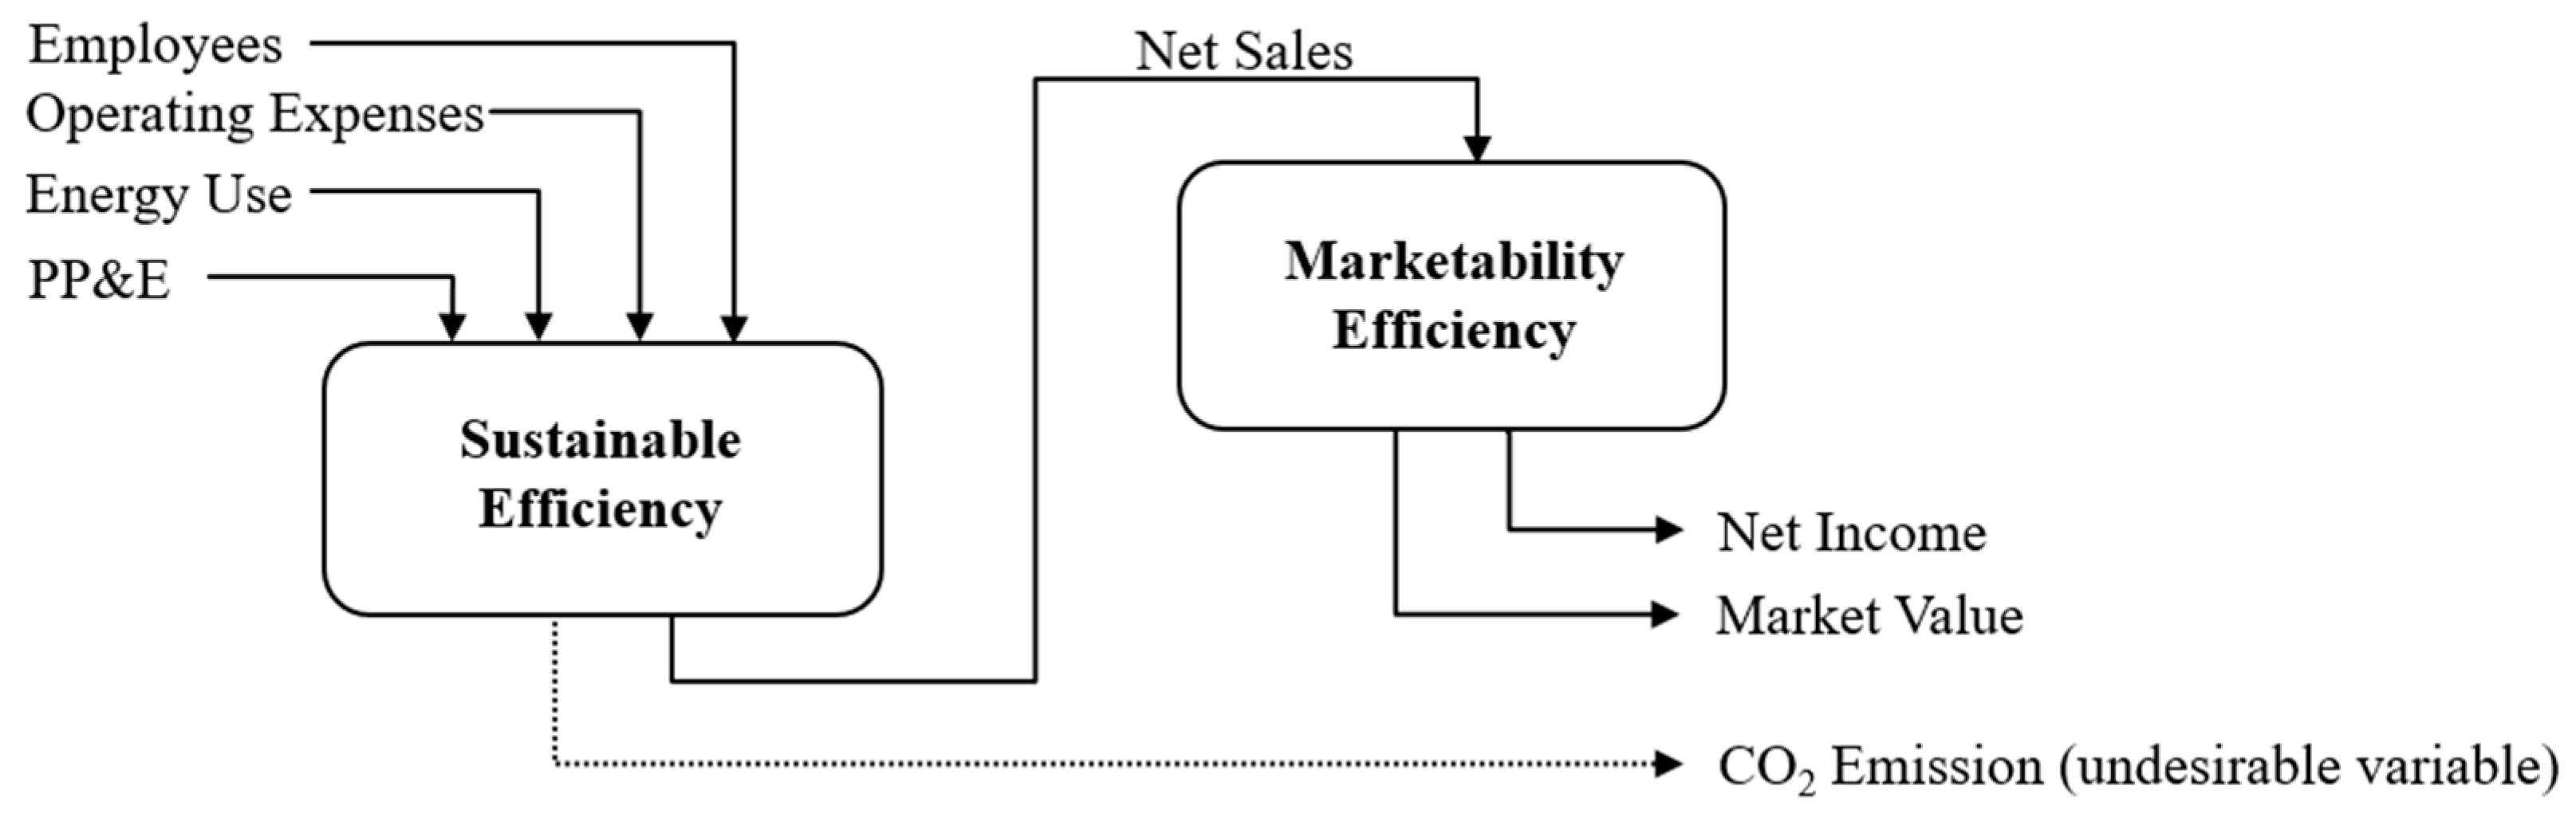
3.1. Two-Stage Production Process of Multinational Enterprises

We utilized a two-stage network DEA to measure the technical efficiency in two performance models—sustainability efficiency and marketability efficiency—to assess firm performance.
Figure 1 illustrates that in stage one, sustainability efficiency estimates a firm’s capability to transform its manpower and operating costs, including employee expenses, operating expenses, property, plant and equipment, and energy use as input variables [23,35,51], into two output items, namely, net sales and CO2 emissions [23,52], which are considered undesired variables. In the DEA framework, various alternatives exist for addressing undesirable outputs, such as ignoring them or treating them as outputs and adjusting the distance measurement in a nonlinear DEA model, which restricts their expansion [53]. The approach proposed by Seiford and Zhu [26] for addressing undesirable outputs in the DEA framework can accurately reflect the actual production process and is insensitive to data transformation. Although these variables do not cover all factors of production, they are considered key factors in production effectiveness [54]. In stage two, marketability efficiency measures a firms’ ability to increase the return from net sales from a market-oriented perspective. Property, plant, and equipment was chosen as a carryover variable of the input in the second stage; net incomes and market value are the output variables employed to measure financial factors. The definitions of input and output variables are described in Table 1.

3.2. Measuring Efficiency Using a Two-Stage Network DEA Model

DEA is a well-known method for assessing the efficiency of DMUs. It is considered an indicator of the synthetic measurement of efficiency that allows for the evaluation of various units across disciplines [60]. The measurement of the efficiency score depends on the input and output indices applied in the DEA model. There are two commonly used DEA models: the CCR model, first developed by Charnes, Cooper [61], and the BCC model, later proposed by Banker, Charnes [62].
According to Farrell’s concept of the frontier production function, the DEA technique analyzes efficiency using a nonparametric production function Farrell [20]. Nevertheless, the traditional models presented in [61] and [62] overlook the entirety of the production process, failing to capture crucial management information at different stages within the organization. A black-box system results from this assessment. An organization’s overall efficiency is assessed by utilizing numerous stages as opposed to just one [24,63,64,65]. In this respect, the network DEA model may be created to investigate the entire production process, as well as the impacts on the internal process of financial operations within a firm [66]. The single-stage network-based ranking method was expanded by Liu and Lu [67] upon investigating DMUs’ efficiency ranking, with a proposed benchmarking unit for improvements and acknowledgment of the advancements of the efficient units.
Kao and Hwang [63] crated a relational model that can be utilized to evaluate each division’s efficiency in a two-stage production process. This model can also further be developed as a network DEA [68]. However, the relational model can only be used when constant returns to scale (CRS) are accepted. Network DEA was the first to use the slacks-based measure (SBM) to assess DMU performance [69]. This measurement of efficiency uses the probability of no proportional variations in both the input and output indicators and assigns weights to each division’s significance when assessing both the overall and departmental efficiency. The two-stage production model was introduced by Chen and Cook [70]. They suggested the additive efficiency decomposition approach; the overall efficiency is the weighted sum of the efficiency of each stage. When considering CRS and VRS (variable returns to scale), this strategy can be used. The network DEA method was extended by Cook, Zhu [71], who also looked at the weighted outcome of each division.
The current study, therefore, used a two-stage network DEA [70] to assess both sustainability and marketability efficiency, while accounting for allocative inefficiency [72]. The following are explanations of the related mathematical equations:
The MNEs produce p outputs ( z d j ,   d = 1 , , p ) in the first stage, utilizing m inputs ( x i j , i = 1 , , m ); in the 2nd stage, the outputs generated in the 1st stage are converted into intermediates to produce the final outputs s ( y r j , r = 1 , , s ). v i , w d , and u r are the multipliers for input i , intermediate d , and output r , respectively. Input- or output-oriented methods can be used to measure the technical efficiency (TE) of a firm. The input-oriented VRS-based network DEA model, described below, was developed in this study for predicting firm k ’s TE ( T E V R S ), which is the overall efficiency, calculated as:
T E V R S = M a x   r = 1 s u r y r k ω 1 ω 2
i = 1 m v i x i k = 1 ,
d = 1 p w d z d j i = 1 m v i x i j ω 1 0 , j = 1 , , n
r = 1 s u r y r j d = 1 p w d z d j ω 2 0 ,   j = 1 , , n
v i , w d , u r 0 ; ω 1 , ω 2 free .
Liang, Cook [73] used identical weights for excellent planning between the two stages. Constraints (3) and (4) correspond to stages T E V R S S 1 as sustainability efficiency and T E V R S S 2 as marketability efficiency, respectively, whose particular intercept multipliers are ω 1 and ω 2 , i.e., addictive T E V R S . This indicates that the multipliers of intermediate indicators, which are considered as both inputs and outputs, follow an additive structure. Using the optimal multipliers obtained from (1), we can determine the input-oriented technical efficiency of firm k as T E V R S and the stages T E V R S S 1 and T E V R S S 2 , calculated as:
T E V R S , k = r = 1 s u r * y r k ω 1 * ω 2 * / i = 1 m v i * x i k T E V R S , k S 1 = d = 1 p w d * z d k ω 1 * / i = 1 m v i * x i k T E V R S , k S 2 = r = 1 s u r * y r k ω 2 * / d = 1 p w d * z d k
It should be noted that the best multipliers found in (1) may not be distinguishable, indicating that T E V R S S 1 and T E V R S S 2 do not appear to be singular. According to Kao and Hwang [63], who consider that T E V R S S 1 is more significant, we initially presupposed the highest value of T E V R S S 1 via:
T E V R S S 1 = M a x d = 1 p w d z d k ω 1   i = 1 m v i x i k = 1 , r = 1 s u r y r k ω 1 ω 2 = T E k d = 1 p w d z d j i = 1 m v i x i j ω 1 0 , j = 1 , , n r = 1 s u r y r j d = 1 p w d z d j ω 2 0 ,   j = 1 , , n v i , w d , u r 0 ; ω 1 , ω 2 free .
To determine the returns to scale of network firm k , we used the dual model (7) of the multiplier model (1) to project the efficiency of the inefficient firm k . T E V R S utilizes λ j and γ j as intensity weights to form a linear combination of n firms.
T E V R S = M i n   β k s . t . j = 1 n x i j λ j β k x i k ,       i = 1 , , m   , j = 1 n z d j λ j z ˜ d k 0 ,       d = 1 , , p   ,   j = 1 n λ j = 1 , sub - technology   1 j = 1 n z d j γ j z ˜ d k 0 ,       d = 1 , , p   ,   j = 1 n y r j γ j y r k ,       r = 1 , , s   , j = 1 n γ j = 1 , sub - technology   2 β h 1 , λ j , γ j 0 , z ˜ d k f r e e .
Let the optimum solution vector be β k * , λ j * , γ j * , z ˜ d k * . The inefficient company k can be projected onto the network frontier using the formula below:
x i k * = β i k * x i k s k , z ˜ d k * , y r k * = y r k + s k +
where s k and s k + are, respectively, the input and output slacks under model (7).
Baumol [74] and Sahoo and Zhu [72] defined the input-oriented RTS of firm k in T E V R S ,   T E V R S S 1 , and T E V R S S 2 . RTS (returns to scale) describes the changes that occur in a production function with variable inputs as the scale effects change. There are three possible outcomes: increasing RTS, constant RTS, and decreasing RTS.
ε i k N x i k * , z ˜ d k * , y r k * i = 1 m x i k F N x i k / r = 1 s y r k F N y r k = β k * i = 1 m v i * x i k r = 1 s u r * y r k = β k * β k * + ω 1 * + ω 2 * .
Note that in (9), i = 1 m v i * x i k = 1 , due to the fact of (2), and r = 1 s u r * y r k = β k * + ω 1 * + ω 2 * . On the concept of duality, the objective function values of (1) and (7) are identical, for instance, β k * = r = 1 s u r * y r k + ω 1 * + ω 2 * . The input-oriented network is increasing returns to scale (IRS), according to (9) (i.e., ε i k N ( ) > 1) if ( ω 2 * + ω 2 * ) < 0 in all optimal solutions, constant (CRS) (i.e., ε i k N ( ) = 1 ) if ( ω 2 * + ω 2 * ) = 0 in all optimal solutions, and decreasing (DRS) (i.e., ε i k N ( ) < 1 ) if ( ω 2 * + ω 2 * ) > 0 in all optimal solutions. The RTS in T E V R S S 1 and T E V R S S 2 can be determined by utilizing the same approach.

3.3. Measurement of Firm Performance

The stochastic frontier approach (SFA) DEA model was first proposed in 2002 by Battese and Rao [75]. Later, in 2004, O’Donnell et al. presented a modified model that enabled the calculation and comparison of the technical efficiencies of Indonesian companies employing various technologies [76]. In 2008, a study analyzed both the metafrontiers and group frontiers and used country-level data from the agricultural sector, which were classified into different country groups. The study broke down disparities in performance into technical efficiency and technological gap effects [25].
This study utilized the metafrontier approach to investigate the technology gap between the metafrontier and group frontier. The former are firms in all five sectors and the latter ones are those that belong to the same sector. DMUs from all groups comprise the metafrontier, and DMUs in individual groups comprise group frontiers, which are both utilized to examine the impact of technological heterogeneity. The technology gap for firms that were in different sectors under technological heterogeneity was further discovered.
We modified Equation (1) to include the input-oriented VRS model, which allowed us to assess the pure technical efficiency of all DMUs as the metafrontier, including those in all sectors. The optimized θ o * V R S represents the PTE of the DMUs, enabling us to identify the metafrontier that included firms in other sectors. To estimate the PTE value of the group frontier, which includes firms in the sth region, we need to estimate the individual sector frontiers. This is calculated by utilizing the input-oriented VRS model, as follows:
Consider n firms in H regions h = 1 H n h = n , where h = 1 , , H ; consequently, the linear programming for the target firm k can be explicated as:
T E V R S , k h = M a x   r = 1 s u r h y r k h ω 1 h ω 2 h ,   k = 1 , , n h ; h = 1 , , H
i = 1 m v i h x i k h = 1 ,
d = 1 p w d h z d j h i = 1 m v i h x i j h ω 1 h 0 ,   j = 1 , , n h
r = 1 s u r h y r j h d = 1 p w d h z d j h ω 2 h 0 ,   j = 1 , , n h
v i h , w d h , u r h 0 ; ω 1 h , ω 2 h free .
Using the optimal multipliers from (10), we can acquire the input-oriented TE of firm k in T E V R S h S 1 and T E V R S h S 2 as:
T E V R S , k h S 1 = d = 1 p w d h * z d k h ω 1 h * / i = 1 m v i h * x i k h
T E V R S , k h S 2 = r = 1 s u r h * y r k h ω 2 h * / d = 1 p w d h * z d k h
where the superscripted h represents the sector frontier. The optimized T E V R S h S 1 and T E V R S h S 2 values that solve the linear program are defined in Equation (14) and stand for the TE of the target firm compared with the r e g i o n h frontier. Furthermore, the closeness of the r e g i o n h frontier and the metafrontier is measured. In particular, the technology gap ratio between the sector frontier and the metafrontier is defined as follows:
M T R h , k S 1 = T E V R S , k S 1 * / T E V R S , k h S 1 * ,   k = 1 , , n h , h = 1 , , H
M T R h , k S 2 = T E V R S , k S 2 * / T E V R S , k h S 2 * ,   k = 1 , , n h , h = 1 , , H
The metatechnology ratio ( M T R h , k S 1 and   M T R h , k S 2 ) is considered the same as the technology gap ratio, which is between 0 and 1. For participating firms between the metafrontier and sector frontier, the increases in M T R h , k S 1 and   M T R h , k S 2 indicate decreases in the technology gap.

3.4. Truncated Regression

To assess the unit performance, numerous researchers have adopted Tobit regression, according to the literature review on DEA, and it was often affected by exogenous factors. In this study, the regression condition was applied as below:
T E e = α + X e β + δ e ,         e = 1 , , n
As in Equation (7), α represents the intercept, δ e represents the residual value, and X e represents the vector variable, which is observed and assumed to be related to the efficiency score of the participating firms e, and it is expected to be related to the firms’ efficiency score, which is a proxy by T E e . Simar and Wilson [77] argued that Tobit regression was inappropriate for analyzing the efficiency score using the DEA approach. Hence, instead of the Tobit regression model, a truncated regression with bootstrap was developed, and it illustrated the satisfactory performance in the Monte Carlo method.
This study employed the methodology of Simar and Wilson to examine the environmental variables that would affect a firm’s performance. Then, this study noted that the distribution δ e was restricted by the condition in Equation (5). This study adapted Equation (5) and assumed that the distribution before truncation was a truncated normal distribution with zero means, unknown variance, and a truncation point that was selected by various factors. The consequence of the adjustment is Equation (6).
T E ^ e α + X e β + δ e ,         e = 1 , , n
where δ e ~ N 0 , σ ε 2 such that δ e 1 α X e β ,   e = 1 , , n . This work employed the regression process of parametric bootstrap to estimate parameters β , σ ε 2 and estimated Equation (5) by maximizing the associated likelihood function while taking into account the β , σ ε 2 parameter. Readers unfamiliar with the algorithm for detail estimate are referred to Simar and Wilson [77].

4. Empirical Results

4.1. Data Collection and Descriptive Statistics

This study investigated 306 firms based on the S&P 500 listed firms in 2021 in the United States. They were categorized by GICS (Global Industry Classification Standard) as the leading performance firms divided into 11 groups [27]. Each firm was treated as a DMU as the sample in a two-stage DEA analysis. Financial and business data on these samples were collected from the Thomson Reuters DataStream database. The selected data year (2021) was the second year of the pandemic outbreak, which allowed for investigating a firm’s performance across industries in the post-pandemic era. The ESG scores from the DataStream database are designed to measure a company’s ESG performance and effectiveness based on publicly reported information, such as CSR reports or annual reports. They are categorized into 10 items that form three pillar scores. As for the environment pillar score, it measures resource use (such as energy and water), emissions (such as waste, CO2 emissions, and environmental management system), and innovation (such as green revenues, product innovation, and R&D). The measurement definitions are described in Table 2 [78].
The initial sample consists of 510 publicly listed firms. To maintain the sample’s consistency and comparability, those with any missing financial data and ESG scores were eliminated, resulting in 306 DMUs. Table 3 shows the total number of observations in 11 sectors as the first tiers of S&P Global’s GICS. The total assets of 306 DMUs accounted for 70.72% of the population which suggests that the sample can represent 500 S&P across industries.
Table 4 presents the statistical descriptive results for the input and output variables dataset across all sectors. The results show that, firstly, the FI and HC sectors have the lowest energy use and CO2 emissions, with IT ranking as the third lowest in energy use and RE ranking as the third lowest in CO2 emissions. Secondly, the EN sector has the highest amount of energy use and the largest CO2 emissions. The MA sector ranks second in energy use, and the CD sector ranks third. Thirdly, the average number of total employees in the UT and RE sectors is much less, resulting in the lowest net sales and net income, but they rank fifth and sixth in energy use. On the other hand, the CS sector holds both the largest operating expenses and net sales, with only half the energy use on average. Additionally, the normality test value (p-value) was less than 1%, which implies that all input and output variables used as DEA indicators have non-normal distributions and can effectively estimate the efficiency of all DMUs.
Table 5 presents the correlation coefficients matrix of the input and output variables adopted in the study. The results show that those indicators with statistical significance at 1% have a positive relationship in both stages, except for market capitalization, which has no significance. Thus, both variables, output and oriented-input, were “isotonicity” compliance alignments under the DEA framework [22], supporting the requirement of variable selection in a DEA evaluation.
The descriptive statistics of the input and output variables with means in all sectors are presented in Table 6. Regarding the environmental dimension, energy use as an input variable was expected to decrease for a higher efficiency. CO2 emission as an output variable was considered an undesirable variable, and it was moved to the input side in this study. In addition, the result of the K-W test shows that all variables are highly significant at the 0.01 level, except market capitalization is fairly significant at the 0.05 level, which indicates that all variables are remarkably different across industries.

4.2. Analysis of Environmental Pillar Score

The objective of an ESG evaluation is to promote corporate sustainability development, increase business profitability, improve risk management, and enhance corporate brand image, among other things [79]. Many studies have sought to measure the effect of the three overall dimensions of ESG on firm performance. Recent researchers have shown that estimating ESG tends to improve firm performance [80]. It was also found that positive ESG news can mitigate financial penalties resulting from negative ESG news in the market. Therefore, having a good ESG reputation not only enhances financial performance but also helps to alleviate risks that come with negative news [81]. Another study suggested that economic growth has a positive and significant effect on environmental degradation by examining the concept of the environmental Kuznets curve (EKC) [81]. However, some companies disclose ESG primarily for “legitimacy-seeking” rather than profit-oriented purposes. Consequently, opinions regarding the different dimensions of ESG and their effects on firm performance need to be discussed individually. Additionally, it is observed that research tends to focus predominantly on environmental factors.
Environmental sustainability is one of the fundamental dimensions of ESG, considered a critical core indication of the environmental pillar that consists of resource use, emissions, and environmental innovation categories. The score is a sum of these three categories weighted differently. Resource use and environmental innovation were both weighted at 11%, and emissions was weighted at 12%, summing to 34%. Prior research examined the relationship between environmental degradation and economic growth from the perspective of economic development and different industries in the United States. In this study, we intended to discuss the relationship between environmental investment and firm performance from both sustainability and marketability perspectives in the post-pandemic era.
Table 7 shows the environmental pillar scores and the three associated elements’ indices in 11 sectors that have significant differences in environmental innovation as per the K-W test, and p-values are significant at the 0.05 level. According to Datamarnan’s Global Insights Report in 2018, the total number of regulations covering environmental and social topics increased numerically in policies from 2015 to 2018. Practically in the environmental dimension, the number of regulations grew by 67% within those three years in the US [82]. Thus, most firms need to reach the minimum requirements in terms of resource use and CO2 emissions during the production process for standard compliance. The results of the resource use and CO2 emission scores range from 74 to 86 without significant differences. The MA, IN, and RE sectors are more efficient in environmental innovation, with scores over 50, indicating that they focus more on research and development to innovate green products and create green revenues. On the contrary, HC has the lowest score at 26.34 in environmental innovation, but the highest score (85.96) in resource use, which means it has better performance in saving water and energy, managing emissions and waste, biodiversity, and environmental management systems but lacks environmental innovation. Overall, RE, MA, and CD are evaluated as having higher environment pillar scores, and the FI sector has lower scores, indicating that financial firms need more endeavors for environmental innovation regarding sustainability.

4.3. Analysis of Sustainability Efficiency and Marketability Efficiency

Table 8 demonstrates the overall efficiency results, including both the sustainability and marketability efficiencies of 11 sectors. The MTE (meta technical efficiency) mean values of all sectors vary from 0.201 to 0.705, and the GTE (group technical efficiency) mean values vary from 0.387 to 0.956, resulting in the TGR (technological gap ratio) varying from 0.229 to 0.831. This outcome suggests that firms in different sectors face varying levels of technological gaps due to the fact of operating with the use of different technologies. The objective of MNEs is to achieve high efficiency while manufacturing or providing services. The model allows for the estimation of technological gaps for those relative to the potential technology available to the industry as a whole. The TGR values can be obtained from the group frontiers (GTE) and metafrontiers (MTE) together with the technical efficiency scores [76]. As a result, in the overall efficiency analysis, RE (0.705) and FI (0.619) have higher efficiencies with fewer technology gaps. CD, IN, MA, and CT are more inefficient, with mean scores under 0.3. The TGR shows that they only produce approximately 22.9% to 56.7%, on average, of the potential output. These results imply that firms with larger technological gaps are more inefficient. Therefore, all managerial administration should prioritize engaging new technology in their production process to raise their overall efficiency.
In the sustainability analysis, the MTE mean values of all sectors vary from 0.535 to 0.830, which is more efficient than the marketability analysis (from 0.151 to 0.378). The GTE mean values vary from 0.826 to 0.991, and the TGR varies from 0.229 to 0.831. FI still performs the highest for sustainability efficiency (MTE = 0.830) and has very few technology gaps (TGR = 0.971). MTE for IN, CD, and MA is lower than 0.6, which is considered relatively inefficient. It is generally perceived that corporations that provide service products are less harmful to the environment than those that produce tangible products, such as manufacturing industries [83], which may be caused by higher pollutant emissions during production processes. The GTE of all sectors is fairly high, from 0.826 to 0.975. This indicates that all firms pay great attention to sustainability development and compliance with related industry regulations in terms of energy use and CO2 emissions.
As for the marketability analysis, IT performs the highest efficiency (MTE = 0.378) and has smaller technology gaps (TGR = 0.670). EN performed technically inefficient (0.151) but with fairly high level in GTE (0.744), with the largest gaps (TGR = 0.194). Furthermore, there are a total of 45 efficient firms, as the benchmark was distributed mainly in IT (8), FI (10), RE (6), and EN (8) in terms of sustainability efficiency, and only 6 firms are considered the benchmark for marketability efficiency.
The findings suggest that corporate management must reconsider the technological differences and refer to the clear benchmark firms that are both within and across sectors, especially for firms in MA. Improving technical inefficiency and reducing technical gaps in sustainability efficiency need to be given priority.
The study of the reasons for the wide variations in the TGRs and technical efficiencies in different sectors as a benchmark is worthy of further investigation, as technical inefficiency could be caused by scale inefficiency. We further investigated the returns to scale (RTS) of firms across 11 sectors. Table 9 presents the RTS efficiency of firms in two stages. In the overall efficiency, only 6.2% of the firms are managed at CRS, 74.5% at IRS, and 19.28% at DRS (59 DMUs). In stage one, approximately 7.5% of the firms manage at CRS (23 DMUs) as the benchmark, while approximately 63.07% manage at IRS (193 DMUs). On the contrary, nearly 29.41% manage at DRS (90 DMUs). In stage two, 304 firms manage at DRS, accounting for 99.3%, while only 1 firm manages at IRS and 1 manages at CRS. These results indicate that for marketability, all firms were still affected by the changes due the pandemic, even after reopening. The consideration of its scale development would still be critical. However, overall, firms managed at IRS take a larger proportion, which might be caused by the reopening and increase in raw material prices, especially in the RE and UT sectors.
Real estate plays a crucial role in driving economic growth in the US and can be affected by the local economy and employment rates. The number of housing starts and residential construction projects are key economic indicators. In addition, clean energy has initiated analysts’ forecasts for strong growth in the utility industry from 2020.

4.4. Influence of Environmental Investment on Firm Performance—Truncated Regression

We further adopted the truncated regression model to evaluate the impact of exogenous factors [71], specifically the proxy variable of environmental investment, on firm performance. The dependent variables employed in this regression analysis were the environmental innovation score (EIS), resource use score (RUS), and emissions score (ES), while sustainable performance (MTE1) and corporate performance (MTE2) were the independent variables. The truncated regression model is estimated as follows:
T E e   =   β 0   + β 1 E I S e + β 2 R U S e + β 3 E S e + β 4 D EB T e + β 5 ROA e + β 6 ROE e + ε e
Here, T E e   represents firm e’s performance score, and β 0 is the intercept; ε e is the error term, and subscript e represents the firm.
Three control variables, namely, debt ratio, ROA, and ROE, were introduced as independent variables. The debt ratio is generated by calculating the ratio of total liabilities to total assets. The ROA is calculated by dividing a company’s net income by the average total assets, while ROE is calculated by dividing the firm’s net income by its average shareholders’ equity. Table 10 presents the relationship between environmental investment and firm performance using truncated regression model analysis.
The study’s findings reveal that the independent variables EIS and RUS had a negative relationship with overall efficiency (MTE) and were statistically significant (p < 0.01). On the other hand, ES had a significantly positive effect on sustainability efficiency (MTE1) and marketability efficiency (MTE2) in both stages (p < 0.05). These results suggest that higher EIS and RUS could lead to a significant decrease in overall firm performance, potentially due to the high costs associated with investing in environmentally friendly products or services. The short-term increase in expenses could negatively impact firm performance. However, upon examining the two-stage results, there were neither significant relationships between EIS and MTE1 and MTE2 nor between RUS and MTE1 and MTE2.
In this study, a high emission score (ES) means lower CO2 emissions. The results indicate a significant relationship between ES and both sustainability efficiency (MTE1) and marketability efficiency (MTE2) but no significant relationship between ES and overall firm performance. These findings may be due to the US government’s recent announcement of its goal to achieve net zero emissions by 2050, which requires action across all economic sectors. As a result, multinational enterprises (MNEs) are transforming their operations to develop a green supply chain and partner with leading organizations to accelerate progress towards a clean energy economy [19]. Therefore, energy use and CO2 emissions are critical input and output items regarding firm performance for all MNEs worldwide. Although the results indicate that environmental investment may have negative economic benefits for firms, the importance of environmental investment must be considered for firms in all sectors.

5. Conclusions

This study presents the first assessment of multinational enterprise (MNE) performance across sectors in the United States using a two-stage data envelopment analysis (DEA) method. The research framework offers an in-depth perspective on the environmental dimension of ESG, accompanied by a comprehensive empirical analysis of firm performance. The analysis identified sustainability and marketability efficiencies of firms and explored the influence of environmental investment on firm performance. The findings suggest that the environmental innovation score (EIS) and resource use score (RUS) have significantly negative impacts on firm performance in the short term due to the additional expenses incurred during the innovative research and development of new products and services, while the emission score (ES) has positive effects on both sustainability and marketability efficiencies. The energy, utilities, and materials sectors were found to be the most severely impacted from an environmental perspective, with high levels of CO2 emissions and energy and material used for energy production. Conversely, the finance and health care sectors had the lowest energy use and CO2 emissions.
It is suggested that environmental investment significantly influences firm performance for firms across sectors. Thus, decision-makers in multinational enterprises (MNEs) must reconsider their sustainability development policy to improve firm performance and strive for higher marketability. While it can be challenging to operationalize environmental investments in traditional industrial sectors, such as consumer discretionary and industrials, due to the differences in the environmental conditions across locations, emphasizing such investments is expected to bring more opportunities and competitive advantages in the future.
In summary, there has been the question of which factors related to the ESG components actually impact on sustainability and marketability performance. Business models that prioritize environmental innovations for sustainability may not be financially feasible initially but could become so in the future due to the fact of regulatory or societal changes. To improve firm performance from both the sustainability and marketability perspectives, managers should prioritize environmental management, leading to better resource allocation and business opportunities.

5.1. Implications

This study offers critical implications for firm managers of MNEs practicing ESG.
First, our research data were gathered from the 2021 DataStream database, which covers the COVID-19 pandemic period. The pandemic had a significant impact on the marketability of the MNEs under study, particularly in the real estate and utility sectors, with respect to the ESG factors. Despite this, the firms that operated at increasing returns to scale still had a larger proportion in 2021. However, we also observed the global issue of inflation, which emerged in 2021 and continues now, and this could potentially slow down the environmental investments of MNEs. Nevertheless, ESG investment is a strategic decision for a firm’s long-term sustainability. Therefore, it is crucial to consider a firm’s scale development for maintaining or enhancing its competitiveness in its sector, even after the pandemic and regardless of the inflation factor.
Second, analysts predicted robust growth for the utility industry for 2020 and onwards, thanks to the adoption of clean energy. Energy usage and CO2 emissions are crucial factors that impact the performance of multinational enterprises (MNEs) worldwide. Although short-term financial benefits may not always be evident, environmental investment, particularly in green energy, is crucial for all firms in all sectors. MNEs must take charge of their operational processes and participate in the journey towards achieving net-zero emissions to comply with updated mandatory regulations and achieve sustainable development. Furthermore, developing new environmental technologies that effectively meet market demands will be critical to firms’ future success.
Moreover, this study highlights the importance for corporate management to address technical inefficiencies, particularly for MNEs in traditional industries. Firms operating in sectors such as materials, utilities, consumer staples, consumer discretionary, and industrials should prioritize efforts to bridge technical gaps in order to enhance both their sustainability and market efficiency and gain a competitive edge. While some of these industries may already be investing in environmental innovations during their business operations, they continue to face challenges in reducing resource usage and emissions during production processes and in establishing a green supply chain to achieve the objective of zero carbon.

5.2. Limitation and Future Research

To evaluate firm performance across sectors, this study applied DEA to integrate multiple input and output variables. CO2 emission and energy use were employed as indicators of environmental investment collected from financial statements to evaluate sustainability efficiency. CO2 emission was also used as a variable to link the two stages, and net sales were used to evaluate marketability efficiency. Furthermore, net sales were connected to the two stages using carry-over. Therefore, we suggest adding ROE, ROA, and debt ratio as control variables to the framework.
However, we were unable to obtain the dataset we initially expected due to the fact of missing data. After screening out the missing data, we collected data from 306 DMUs across 11 sectors. Different scales of the dataset could result in different empirical results regarding the relationship between environmental investment and firm performance. The quality and impact of corporate environmental management will depend on how well it matches the specific company’s situation and its market, political, and social circumstances.
Thus, we suggest further studies that focus on individual industries and consider their characteristics to explore the crucial factors for the efficiency analysis of a particular industry, especially for industrials, consumer discretionary, information technology, and health care, which have received less attention in previous studies.
In addition, the number of ESG regulations has been rapidly growing globally. National regulations have become increasingly strict after 2015, especially in utilities, financial services, and health care pharmaceutical industries in the US, the UK, and Canada. Previous authors have proposed that the positive relationship between corporate environmental management and corporate financial performance seems to be stronger when regulatory scrutiny is less restrictive. Therefore, regulatory restrictions can also be considered control variables.
Moreover, sustainability is a major trend and requires continuous effort from MNEs to move forward. Future research should investigate the changes in the relationship between environmental investment and firm performance from panel data over the long term.
Finally, while our study focused on financial variables, we agree that the nonfinancial firm characteristic variables were limited in this study. We think that nonfinancial variables could also be considered a control variable or a potential factor for future research to complete the investigation.

Author Contributions

Conceptualization, H.-Y.S.; methodology, H.-Y.S.; software, H.-Y.S.; validation, H.-Y.M., W.-M.L. and H.-Y.S.; formal analysis, H.-Y.S.; investigation, H.-Y.M., W.-M.L. and H.-Y.S.; resources, H.-Y.S.; data curation, H.-Y.S.; writing—original draft preparation, H.-Y.S.; writing—review and editing, H.-Y.M., W.-M.L. and H.-Y.S.; visualization, H.-Y.S.; supervision, H.-Y.M.; project administration, H.-Y.S. All authors have read and agreed to the published version of the manuscript.

Funding

This research received no external funding.

Institutional Review Board Statement

Not applicable.

Informed Consent Statement

Not applicable.

Data Availability Statement

All relevant study data are contained within the article.

Conflicts of Interest

The authors declare no conflict of interest.

References

  1. Maliszewska, M.; Mattoo, A.; Van Der Mensbrugghe, D. The Potential Impact of COVID-19 on GDP and Trade: A Preliminary Assessment; World Bank Policy Research Working Paper; World Bank: Washington, DC, USA, 2020. [Google Scholar]
  2. Fernández-Gago, R.; Cabeza-García, L.; Nieto, M. Independent directors’ background and CSR disclosure. Corp. Soc. Responsib. Environ. Manag. 2018, 25, 991–1001. [Google Scholar] [CrossRef]
  3. Lee, K.-H.; Saen, R.F. Measuring corporate sustainability management: A data envelopment analysis approach. Int. J. Prod. Econ. 2012, 140, 219–226. [Google Scholar] [CrossRef]
  4. Fisher, D.R.; Freudenburg, W.R. Postindustrialization and environmental quality: An empirical analysis of the environmental state. Soc. Forces 2004, 83, 157–188. [Google Scholar] [CrossRef]
  5. Shrivastava, P. The role of corporations in achieving ecological sustainability. Acad. Manag. Rev. 1995, 20, 936–960. [Google Scholar] [CrossRef]
  6. Tracey, S.; Anne, B. OECD Insights Sustainable Development Linking Economy, Society, Environment: Linking Economy, Society, Environment; OECD Publishing: Paris, France, 2008. [Google Scholar]
  7. Li, T.-T.; Wang, K.; Sueyoshi, T.; Wang, D.D. ESG: Research progress and future prospects. Sustainability 2021, 13, 11663. [Google Scholar] [CrossRef]
  8. Alshehhi, A.; Nobanee, H.; Khare, N. The impact of sustainability practices on corporate financial performance: Literature trends and future research potential. Sustainability 2018, 10, 494. [Google Scholar] [CrossRef] [Green Version]
  9. Hariem Brundtland, G. World Commission on environment and development. Environ. Policy Law 1985, 14, 26–30. [Google Scholar] [CrossRef]
  10. Sharma, S.; Henriques, I. Stakeholder influences on sustainability practices in the Canadian forest products industry. Strateg. Manag. J. 2005, 26, 159–180. [Google Scholar] [CrossRef]
  11. Dyllick, T.; Hockerts, K. Beyond the business case for corporate sustainability. Bus. Strategy Environ. 2002, 11, 130–141. [Google Scholar] [CrossRef]
  12. Perrini, F.; Tencati, A. Sustainability and stakeholder management: The need for new corporate performance evaluation and reporting systems. Bus. Strategy Environ. 2006, 15, 296–308. [Google Scholar] [CrossRef]
  13. Gadenne, D.L.; Kennedy, J.; McKeiver, C. An Empirical Study of Environmental Awareness and Practices in SMEs. J. Bus. Ethics 2009, 84, 45–63. [Google Scholar] [CrossRef]
  14. Andersson, L.; Shivarajan, S.; Blau, G. Enacting Ecological Sustainability in the MNC: A Test of an Adapted Value-Belief-Norm Framework. J. Bus. Ethics 2005, 59, 295–305. [Google Scholar] [CrossRef]
  15. Cruz, J.M. Dynamics of supply chain networks with corporate social responsibility through integrated environmental decision-making. Eur. J. Oper. Res. 2008, 184, 1005–1031. [Google Scholar] [CrossRef]
  16. Gillan, S.L.; Koch, A.; Starks, L.T. Firms and social responsibility: A review of ESG and CSR research in corporate finance. J. Corp. Financ. 2021, 66, 101889. [Google Scholar] [CrossRef]
  17. EBA. Annual Report 2021; European Banking Authority, Publications Office of the European Union: Luxembourg, 2022; Available online: https://www.eba.europa.eu/sites/default/documents/files/document_library/About%20Us/Annual%20Reports/2021/1035237/EBA%202021%20Annual%20Report.pdf (accessed on 16 October 2022).
  18. Meng, Y.; Yang, Y.; Chung, H.; Lee, P.-H.; Shao, C. Enhancing Sustainability and Energy Efficiency in Smart Factories: A Review. Sustainability 2018, 10, 4779. [Google Scholar] [CrossRef] [Green Version]
  19. President, USDoSatUSEOot. The Long-Term Strategy of the United States: Pathways to Net-Zero Greenhouse Gas Emissions by 2050. Available online: https://www.whitehouse.gov/ (accessed on 23 March 2023).
  20. Farrell, M.J. The Measurement of Productive Efficiency. J. R. Stat. Soc. Ser. A 1957, 120, 253–290. [Google Scholar] [CrossRef]
  21. Cook, W.D.; Zhu, J. Classifying inputs and outputs in data envelopment analysis. Eur. J. Oper. Res. 2007, 180, 692–699. [Google Scholar] [CrossRef]
  22. Golany, B.; Roll, Y. An application procedure for DEA. Omega 1989, 17, 237–250. [Google Scholar] [CrossRef]
  23. Sueyoshi, T.; Wang, D. Sustainability development for supply chain management in US petroleum industry by DEA environmental assessment. Energy Econ. 2014, 46, 360–374. [Google Scholar] [CrossRef]
  24. Seiford, L.M.; Zhu, J. Profitability and marketability of the top 55 US commercial banks. Manag. Sci. 1999, 45, 1270–1288. [Google Scholar] [CrossRef] [Green Version]
  25. O’Donnell, C.J.; Rao, D.S.; Battese, G.E. Metafrontier frameworks for the study of firm-level efficiencies and technology ratios. Empir. Econ. 2008, 34, 231–255. [Google Scholar] [CrossRef]
  26. Seiford, L.M.; Zhu, J. Modeling undesirable factors in efficiency evaluation. Eur. J. Oper. Res. 2002, 142, 16–20. [Google Scholar] [CrossRef]
  27. Artiach, T.; Lee, D.; Nelson, D.; Walker, J. The determinants of corporate sustainability performance. Account. Financ. 2010, 50, 31–51. [Google Scholar] [CrossRef]
  28. Trumpp, C.; Endrikat, J.; Zopf, C.; Guenther, E. Definition, conceptualization, and measurement of corporate environmental performance: A critical examination of a multidimensional construct. J. Bus. Ethics 2015, 126, 185–204. [Google Scholar] [CrossRef]
  29. Schaltegger, S.; Lüdeke-Freund, F.; Hansen, E.G. Business cases for sustainability: The role of business model innovation for corporate sustainability. Int. J. Innov. Sustain. Dev. 2012, 6, 95–119. [Google Scholar] [CrossRef]
  30. Russo, M.V.; Fouts, P.A. A Resource-Based Perspective On Corporate Environmental Performance And Profitability. Acad. Manag. J. 1997, 40, 534–559. [Google Scholar] [CrossRef]
  31. Suh, Y.; Seol, H.; Bae, H.; Park, Y. Eco-efficiency Based on Social Performance and its Relationship with Financial Performance. J. Ind. Ecol. 2014, 18, 909–919. [Google Scholar] [CrossRef]
  32. Zhou, P.; Ang, B.W.; Poh, K.L. Measuring environmental performance under different environmental DEA technologies. Energy Econ. 2008, 30, 1–14. [Google Scholar] [CrossRef]
  33. Le, M.-H.; Lu, W.-M. An integrated multiple objective decision making approach for exploring the competitiveness of pharmaceutical multinational enterprises. Ann. Oper. Res. 2022, 1–26. [Google Scholar] [CrossRef]
  34. Le, M.-H.; Lu, W.-M.; Kweh, Q.L. The moderating effects of power distance on corporate social responsibility and multinational enterprises performance. Rev. Manag. Sci. 2022, 1–31. [Google Scholar] [CrossRef]
  35. Pham, T.N.; Tran, P.P.; Le, M.-H.; Vo, H.N.; Pham, C.D.; Nguyen, H.-D. The Effects of ESG Combined Score on Business Performance of Enterprises in the Transportation Industry. Sustainability 2022, 14, 8354. [Google Scholar] [CrossRef]
  36. Eccles, R.G.; Ioannou, I.; Serafeim, G. The Impact of Corporate Sustainability on Organizational Processes and Performance. Manag. Sci. 2014, 60, 2835–2857. [Google Scholar] [CrossRef] [Green Version]
  37. Alsayegh, M.F.; Abdul Rahman, R.; Homayoun, S. Corporate Economic, Environmental, and Social Sustainability Performance Transformation through ESG Disclosure. Sustainability 2020, 12, 3910. [Google Scholar] [CrossRef]
  38. Bostian, M.; Färe, R.; Grosskopf, S.; Lundgren, T. Environmental investment and firm performance: A network approach. Energy Econ. 2016, 57, 243–255. [Google Scholar] [CrossRef] [Green Version]
  39. Chen, Y.; Ma, Y. Does green investment improve energy firm performance? Energy Policy 2021, 153, 112252. [Google Scholar] [CrossRef]
  40. Shabbir, M.S.; Wisdom, O. The relationship between corporate social responsibility, environmental investments and financial performance: Evidence from manufacturing companies. Environ. Sci. Pollut. Res. 2020, 27, 39946–39957. [Google Scholar] [CrossRef]
  41. Harjoto, M.; Laksmana, I. The Impact of Corporate Social Responsibility on Risk Taking and Firm Value. J. Bus. Ethics 2018, 151, 353–373. [Google Scholar] [CrossRef]
  42. Ersoy, E.; Swiecka, B.; Grima, S.; Özen, E.; Romanova, I. The Impact of ESG Scores on Bank Market Value? Evidence from the U.S. Banking Industry. Sustainability 2022, 14, 9527. [Google Scholar] [CrossRef]
  43. Albertini, E. Does Environmental Management Improve Financial Performance? A Meta-Analytical Review. Organ. Environ. 2013, 26, 431–457. [Google Scholar] [CrossRef]
  44. Gholami, A.; Sands, J.; Rahman, H.U. Environmental, Social and Governance Disclosure and Value Generation: Is the Financial Industry Different? Sustainability 2022, 14, 2647. [Google Scholar] [CrossRef]
  45. Lima Crisóstomo, V.; de Souza Freire, F.; Cortes de Vasconcellos, F. Corporate social responsibility, firm value and financial performance in Brazil. Soc. Responsib. J. 2011, 7, 295–309. [Google Scholar] [CrossRef] [Green Version]
  46. Jacobs, B.W.; Singhal, V.R.; Subramanian, R. An empirical investigation of environmental performance and the market value of the firm. J. Oper. Manag. 2010, 28, 430–441. [Google Scholar] [CrossRef]
  47. Reinecke, J.; Manning, S.; von Hagen, O. The Emergence of a Standards Market: Multiplicity of Sustainability Standards in the Global Coffee Industry. Organ. Stud. 2012, 33, 791–814. [Google Scholar] [CrossRef] [Green Version]
  48. Valente, M. Theorizing Firm Adoption of Sustaincentrism. Organ. Stud. 2012, 33, 563–591. [Google Scholar] [CrossRef]
  49. Montiel, I.; Delgado-Ceballos, J. Defining and Measuring Corporate Sustainability: Are We There Yet? Organ. Environ. 2014, 27, 113–139. [Google Scholar] [CrossRef]
  50. Hussain, N.; Rigoni, U.; Cavezzali, E. Does it pay to be sustainable? Looking inside the black box of the relationship between sustainability performance and financial performance. Corp. Soc. Responsib. Environ. Manag. 2018, 25, 1198–1211. [Google Scholar] [CrossRef] [Green Version]
  51. Kao, F.C.; Le, M.-H. Effects of corporate social responsibility on pharmaceutical multinational enterprises performance: Research and development and business efficiency perspectives. Manag. Decis. Econ. 2022, 43, 3419–3434. [Google Scholar] [CrossRef]
  52. Kuo, K.-C.; Lu, W.-M.; Kweh, Q.L.; Le, M.-H. Determinants of cargo and eco-efficiencies of global container shipping companies. Int. J. Logist. Manag. 2020, 31, 753–775. [Google Scholar] [CrossRef]
  53. Faere, R.; Grosskopf, S.; Lovell, C.A.K.; Pasurka, C. Multilateral Productivity Comparisons When Some Outputs are Undesirable: A Nonparametric Approach. Rev. Econ. Stat. 1989, 71, 90–98. [Google Scholar] [CrossRef]
  54. Wang, D.; Li, S.; Sueyoshi, T. DEA environmental assessment on US Industrial sectors: Investment for improvement in operational and environmental performance to attain corporate sustainability. Energy Econ. 2014, 45, 254–267. [Google Scholar] [CrossRef]
  55. Wang, M.; Feng, C. Regional total-factor productivity and environmental governance efficiency of China’s industrial sectors: A two-stage network-based super DEA approach. J. Clean. Prod. 2020, 273, 123110. [Google Scholar] [CrossRef]
  56. Belu, C. Ranking corporations based on sustainable and socially responsible practices. Sustain. Dev. 2009, 17, 257–268. [Google Scholar] [CrossRef]
  57. Chen, X.; Liu, Z.; Zhu, Q. Performance evaluation of China’s high-tech innovation process: Analysis based on the innovation value chain. Technovation 2018, 74, 42–53. [Google Scholar] [CrossRef]
  58. Yang, A.S.; Okada, H. Corporate innovations as institutional anomie: Patent activities and financial performance of the international aerospace industry. Financ. Res. Lett. 2019, 28, 328–336. [Google Scholar] [CrossRef]
  59. Wang, W.-K.; Lu, W.-M.; Kweh, Q.L.; Liu, Y.-L. Decentralized and concentrated investments in China and the performance of Taiwanese listed electronic companies. Appl. Econ. 2017, 49, 2443–2455. [Google Scholar] [CrossRef]
  60. Lim, S.; Oh, K.W.; Zhu, J. Use of DEA cross-efficiency evaluation in portfolio selection: An application to Korean stock market. Eur. J. Oper. Res. 2014, 236, 361–368. [Google Scholar] [CrossRef]
  61. Charnes, A.; Cooper, W.W.; Rhodes, E. Measuring the efficiency of decision making units. Eur. J. Oper. Res. 1978, 2, 429–444. [Google Scholar] [CrossRef]
  62. Banker, R.D.; Charnes, A.; Cooper, W.W. Some Models for Estimating Technical and Scale Inefficiencies in Data Envelopment Analysis. Manag. Sci. 1984, 30, 1078–1092. [Google Scholar] [CrossRef] [Green Version]
  63. Kao, C.; Hwang, S.-N. Efficiency decomposition in two-stage data envelopment analysis: An application to non-life insurance companies in Taiwan. Eur. J. Oper. Res. 2008, 185, 418–429. [Google Scholar] [CrossRef]
  64. Premachandra, I.; Zhu, J.; Watson, J.; Galagedera, D.U. Best-performing US mutual fund families from 1993 to 2008: Evidence from a novel two-stage DEA model for efficiency decomposition. J. Bank. Financ. 2012, 36, 3302–3317. [Google Scholar] [CrossRef]
  65. Galagedera, D.U.; Watson, J.; Premachandra, I.; Chen, Y. Modeling leakage in two-stage DEA models: An application to US mutual fund families. Omega 2016, 61, 62–77. [Google Scholar] [CrossRef]
  66. Färe, R.; Grosskopf, S. Network dea. Socio-Econ. Plan. Sci. 2000, 34, 35–49. [Google Scholar] [CrossRef]
  67. Liu, J.S.; Lu, W.M. Network-based method for ranking of efficient units in two-stage DEA models. J. Oper. Res. Soc. 2012, 63, 1153–1164. [Google Scholar] [CrossRef]
  68. Kao, C. Efficiency decomposition in network data envelopment analysis: A relational model. Eur. J. Oper. Res. 2009, 192, 949–962. [Google Scholar] [CrossRef]
  69. Tone, K.; Tsutsui, M. Network DEA: A slacks-based measure approach. Eur. J. Oper. Res. 2009, 197, 243–252. [Google Scholar] [CrossRef] [Green Version]
  70. Chen, Y.; Cook, W.D.; Li, N.; Zhu, J. Additive efficiency decomposition in two-stage DEA. Eur. J. Oper. Res. 2009, 196, 1170–1176. [Google Scholar] [CrossRef]
  71. Cook, W.D.; Zhu, J.; Bi, G.; Yang, F. Network DEA: Additive efficiency decomposition. Eur. J. Oper. Res. 2010, 207, 1122–1129. [Google Scholar] [CrossRef]
  72. Sahoo, B.K.; Zhu, J.; Tone, K.; Klemen, B.M. Decomposing technical efficiency and scale elasticity in two-stage network DEA. Eur. J. Oper. Res. 2014, 233, 584–594. [Google Scholar] [CrossRef]
  73. Liang, L.; Cook, W.D.; Zhu, J. DEA models for two-stage processes: Game approach and efficiency decomposition. Nav. Res. Logist. 2008, 55, 643–653. [Google Scholar] [CrossRef]
  74. Baumol, W.J. Applied fairness theory and rationing policy. Am. Econ. Rev. 1982, 72, 639–651. [Google Scholar]
  75. Battese, G.E.; Rao, D.P. Technology gap, efficiency, and a stochastic metafrontier function. Int. J. Bus. Econ. 2002, 1, 87. [Google Scholar]
  76. Battese, G.E.; Rao, D.S.; O’donnell, C.J. A metafrontier production function for estimation of technical efficiencies and technology gaps for firms operating under different technologies. J. Product. Anal. 2004, 21, 91–103. [Google Scholar] [CrossRef]
  77. Simar, L.; Wilson, P.W. Estimation and inference in two-stage, semi-parametric models of production processes. J. Econom. 2007, 136, 31–64. [Google Scholar] [CrossRef]
  78. Refinitiv. Environmental, Social and Governance (esg) Scores from Refinitiv. Refinitiv. 2020. Available online: https://www.refinitiv.com/content/dam/marketing/en_us/documents/methodology/refinitiv-esg-scores-methodology.pdf (accessed on 3 December 2022).
  79. Kwon, H.-B.; Lee, J. Exploring the differential impact of environmental sustainability, operational efficiency, and corporate reputation on market valuation in high-tech-oriented firms. Int. J. Prod. Econ. 2019, 211, 1–14. [Google Scholar] [CrossRef]
  80. Landi, G.C.; Iandolo, F.; Renzi, A.; Rey, A. Embedding sustainability in risk management: The impact of environmental, social, and governance ratings on corporate financial risk. Corp. Soc. Responsib. Environ. Manag. 2022, 29, 1096–1107. [Google Scholar] [CrossRef]
  81. Capelle-Blancard, G.; Petit, A. Every Little Helps? ESG News and Stock Market Reaction. J. Bus. Ethics 2019, 157, 543–565. [Google Scholar] [CrossRef]
  82. Datamarancom. Global Insights Report (GIR) 2018: The Rise of ESG Regulations. 2018. Available online: https://pages.datamaran.com/hubfs/Ebooks/GIR%20report%20-%20Updated%20Jan%202020.pdf (accessed on 9 January 2023).
  83. Dangelico, R.M.; Pontrandolfo, P. Being ‘Green and Competitive’: The Impact of Environmental Actions and Collaborations on Firm Performance. Bus. Strategy Environ. 2015, 24, 413–430. [Google Scholar] [CrossRef]
Figure 1. Two-stage production process of MNEs.
Sustainability 15 07779 g001
Table 1. Definition of variables.
VariableDescriptionUnitReferences
1st Stage Input
EmployeesTotal number of people employed by the company including full time and part time workers.Number of peopleSueyoshi and Wang [23], Wang and Feng [55], Belu [56]
Operating ExpensesThe expense that incurs in a business through its daily operations.USDWang and Feng [55]
Energy UseThe total direct and indirect energy that has been consumed within the boundaries of the company’s operations.Thousands of TonsSueyoshi and Wang [23];
Carry Over
Property, Plant, and EquipmentThe tangible assets, which are also called fixed assets, that are long-term and vital to business operations and not easily converted into cash.USDWang and Feng [55], Chen, Liu [57]
1st Stage Output
Link
Net Sales
The sum of a company’s gross sales deducting its returns, allowances, and discounts.USDSueyoshi and Wang [23]
CO2 EmissionTotal carbon dioxide and CO2 equivalent emission released annually by the company.Thousands of TonsSueyoshi and Wang [23], Wang, Li [54], Wang and Feng [55]
2nd Stage Output
Market ValueThe price or the value that the investment community gives to a particular equity or business, which is calculated by multiplying a company’s outstanding shares by its current market price.USDYang and Okada [58], Wang, Lu [59]
Net IncomeThe entity’s sales income, deducting the cost of goods sold, administrative and operating expenses, and other expenses, including tax expenses and depreciation interest.USDSueyoshi and Wang [23], Belu [56]
Table 2. Definitions of the environmental pillar score categories.
Environmental Pillar Score CategoryMeasurement Definition
Resource UseThe resource use score measures a firm’s capacity to minimize the usage of energy, water, or materials and to find ecofriendly solutions by improving supply chain management, which reflects the firm’s performance.
EmissionsThe emission score measures a firm’s environmental emissions in its production and operations, which reflects its commitment and effectiveness.
Environmental InnovationThe environmental innovation score measures a firm’s capacity to create new market opportunities through innovative processes, technologies, and ecofriendly products that reduces environmental costs and burdens towards its customers.
Table 3. Sample analysis by sector of the S&P GICS.
SectorInitial SampleAfter Deleting Missing DataTotal Assets Percentage
Industrials (IN)865579.87%
Consumer Discretionary (CD)704675.91%
Information Technology (IT)664275.17%
Health Care (HC)663273.35%
Financials (FI)663163.42%
Real Estate (RE)322178.09%
Energy (EN)221785.56%
Materials (MA)231781.92%
Utilities (UT)341744.10%
Consumer Staples (CT)241534.69%
Communication Services (CS)211360.06%
Total51030670.72%
Table 4. Descriptive statistics summary of all sectors (2021).
VariablesValid (N)MeanMedianStd. Dev.SkewnessK-S Test
Employees30664,23124,150161,76610.900p < 0.01
Operating Expenses30624,231,49610,094,73140,431,9443.456p < 0.01
Property, Plant, and Equip.30613,648,9244,468,50024,568,1034.356p < 0.01
Energy Use Total30636,507,9464,431,631124,806,7287.186p < 0.01
CO2 Emission3063,634,933398,03810,112,7975.496p < 0.01
Net Sales30629,126,66512,732,10347,449,4423.553p < 0.01
Net Income3063,877,3591,467,2569,226,2256.185p < 0.01
Market Capitalization30692,344,58337,269,581254,807,9418.695p < 0.01
Industrials (IN)
Employees5565,73245,00083,5213.812
Operating Expenses5519,271,45711,708,60024,246,9962.640
Property, Plant, and Equip.558,867,2863,506,00012,807,3572.663
Energy Use Total5525,791,8685,945,57654,378,2343.811
CO2 Emission552,299,678580,1004,288,6312.729
Net Sales or Revenues5521,925,77913,750,00026,015,4832.619
Net Income552,063,1231,356,0003,362,1342.332
Market Capitalization5551,348,54644,233,54039,573,7091.216
Consumer Discretionary (CD)
Employees46131,12539,000362,0966.010
Operating Expenses4633,459,4269,945,67755,932,4682.932
Property, Plant, and Equip.4614,273,2095,667,36320,079,7212.700
Energy Use Total4643,489,22710,904,41989,546,2613.164
CO2 Emission463,201,019985,6945,954,2473.005
Net Sales4635,721,05912,034,59558,425,1402.890
Net Income461,556,6431,338,1383,417,321−0.095
Market Capitalization4652,336,93833,627,10962,538,3202.399
Information Technology (IT)
Employees4257,35018,191108,8114.043
Operating Expenses4221,114,8688,243,14441,876,7134.725
Property, Plant, and Equip.427,025,8931,572,48216,290,1633.151
Energy Use Total425,126,1941,221,30010,996,4703.149
CO2 Emission42692,016141,1281,476,1013.248
Net Sales4228,756,35912,640,89860,702,3754.680
Net Income426,599,6831,389,00017,030,4194.375
Market Capitalization42227,186,33552,924,800580,812,0694.129
Health Care (HC)
Employees3244,89628,25039,3290.948
Operating Expenses3227,674,9637,927,05044,093,2022.368
Property, Plant, and Equip.324,661,4372,647,5005,307,4051.957
Energy Use Total324,178,3241,564,0115,131,1081.339
CO2 Emission32325,384113,800360,2471.095
Net Sales3232,914,12210,884,85047,203,6732.014
Net Income324,103,3961,713,8005,596,6442.148
Market Capitalization3298,290,30651,947,498109,217,3691.680
Financials (FI)
Employees3152,65119,11274,7692.171
Operating Expenses3120,218,67310,199,00021,443,5161.239
Property, Plant, and Equip.314,039,8761,411,0006,716,9502.525
Energy Use Total311,437,894616,4392,292,4232.311
CO2 Emission31133,15150,480217,2562.308
Net Sales3129,619,85114,262,70032,610,0471.542
Net Income317,527,3872,760,00010,769,0492.466
Market Capitalization3188,974,87534,036,402124,961,4002.217
Real Estate (RE)
Employees217611205322,5104.456
Operating Expenses213,852,8512,124,7805,392,5073.874
Property, Plant, and Equip.2117,951,59116,728,1939,929,7621.091
Energy Use Total218,059,3602,640,24711,925,5091.673
CO2 Emission21395,179113,525673,3422.234
Net Sales214,954,7342,890,0005,878,6713.183
Net Income211,049,918563,399913,1770.873
Market Capitalization2141,904,36333,985,21135,854,9641.558
Energy (EN)
Employees1721,276990027,1991.474
Operating Expenses1746,087,42713,483,00068,956,4212.110
Property, Plant, and Equip.1741,863,68923,485,00058,000,6532.519
Energy Use Total17225,809,66826,409,809405,215,2732.321
CO2 Emission1718,825,3886,340,00026,338,5912.158
Net Sales1751,686,73617,870,00073,806,8052.179
Net Income174,256,9081,517,0006,468,9802.032
Market Capitalization1756,717,24931,755,92073,233,1792.290
Materials (MA)
Employees1727,16320,87519,8190.954
Operating Expenses1713,939,36610,233,00011,658,3701.786
Property, Plant, and Equip.1711,824,1626,238,20011,968,2611.710
Energy Use Total17150,582,89344,887,896184,967,1571.117
CO2 Emission179,983,5963,392,11012,391,9691.181
Net Sales1717,049,14811,656,00014,296,1121.677
Net Income171,931,1271,129,9001,867,7811.331
Market Capitalization1745,227,35730,373,22341,041,1402.249
Utilities (UT)
Employees1710,357911675931.139
Operating Expenses177,064,0176,183,0005,218,6991.307
Property, Plant, and Equip.1730,722,74423,506,00029,013,1591.585
Energy Use Total1725,655,4055,077,24656,826,0073.386
CO2 Emission1715,492,0518,205,06019,798,2862.181
Net Sales178,782,4787,329,0006,452,2691.327
Net Income171,197,1921,220,5271,025,7921.581
Market Capitalization1729,484,92624,102,38218,763,4841.617
Consumer Staples (CT)
Employees15157,724100,0001667041.034
Operating Expenses1535,369,78918,214,000381672881.488
Property, Plant, and Equip.159,869,7185,925,799103752041.328
Energy Use Total157,887,5355,875,68376478131.216
CO2 Emission15684,120373,0397557591.168
Net Sales1541,435,62521,111,000431649221.599
Net Income154,716,9512,454,00050527381.335
Market Capitalization1586,986,75940,194,5621065469242.675
Communication Services (CS)
Employees1377,28955,60068,5650.846
Operating Expenses1351,120,87923,503,33556,985,0311.313
Property, Plant, and Equip.1338,677,1813,770,02654,057,1201.317
Energy Use Total1318,186,0042,283,35024,095,1151.200
CO2 Emission131,790,589246,4662,399,8591.246
Net Sales1364,695,59428,586,00077,530,3951.621
Net Income1310,861,4402,699,00020,841,7362.961
Market Capitalization13243,180,09951,830,406513,366,8593.365
Normality test: Kolmogorov–Smironv test, p < 0.01. Energy use is in units of gigajoules; CO2 emission is in units of metric tons; market capitalization is in USD 1000; other variables are in units of USD, except for employees.
Table 5. Correlations coefficients among the input and output variables.
(1)(2)(3)(4)(5)(6)(7)(8)
1st Stage Input
(1) Employees1
(2) Operating Expenses0.2541 ***1
(3) Property, Plant, and Equip.0.09380.5502 ***1
(4) Energy Use0.01350.3982 ***0.5764 ***1
(5) CO2 Emission−0.01020.3159 ***0.6527 ***0.8120 ***1
1st Stage Output
(6) Net Sales (Link)0.2513 ***0.9839 ***0.5651 ***0.3617 ***0.2877 ***1
2st Stage Output
(7) Net Income0.1901 ***0.5790 ***0.4283 ***0.1296 **0.1050 *0.7109 ***1
(8) Market Capitalization0.1244 **0.4691 ***0.3102 ***0.03370.02640.5936 ***0.8832 ***1
*, **, and *** correlations are significant at the 10%, 5%, and 1% levels, respectively.
Table 6. Variables difference test on all sectors.
SectorEmployeesOperating ExpensesProperty, Plant, and Equip.Energy UseCO2 EmissionNet SalesNet IncomeMarket Capitalization
IN65,73219,271,4578,867,28625,791,8682,299,67821,925,7792,063,12351,348,546
CD131,12533,459,42614,273,20943,489,2273,201,01935,721,0591,556,64352,336,938
IT57,35021,114,8687,025,8935,126,194692,01628,756,3596,599,683227,186,335
HC44,89627,674,9634,661,4374,178,324325,38432,914,1224,103,39698,290,306
FI52,65120,218,6734,039,8761,437,894133,15129,619,8517,527,38788,974,875
RE76113,852,85117,951,5918,059,360395,1794,954,7341,049,91841,904,363
EN21,27646,087,42741,863,689225,809,66818,825,38851,686,7364,256,90856,717,249
MA27,16313,939,36611,824,162150,582,8939,983,59617,049,1481,931,12745,227,357
UT10,3577,064,01730,722,74425,655,40515,492,0518,782,4781,197,19229,484,926
CT157,72435,369,7899,869,7187,887,535684,12041,435,6254,716,95186,986,759
CS77,28951,120,87938,677,18118,186,0041,790,58964,695,59410,861,440243,180,099
K-W Test
(p-Value)
0.0000 ***0.0000 ***0.0000 ***0.0000 ***0.0000 ***0.0000 ***0.0001 ***0.0274 **
**, and *** correlations are significant at the 5%, and 1% levels, respectively.
Table 7. Environmental pillar score difference in all sectors.
Environmental Dimension
SectorEnvironment Pillar ScoreEnvironmental InnovationResource UseEmissions
IN69.6352.2181.6275.90
CD72.7942.9879.7876.29
IT63.4041.3982.2779.69
HC69.6026.3485.9680.25
FI59.7943.7980.6782.08
RE76.5554.3077.0181.70
EN69.8638.4382.0079.08
MA75.7856.2679.4684.43
UT65.1244.9974.4474.02
CT69.0241.4477.0677.98
CS62.9934.4879.4276.96
K-W Test (p-Value)0.0321 **0.0386 **0.63560.6267
** correlations are significant at the 5% levels.
Table 8. Efficiency analysis by sector using metafrontier and group frontier analysis.
Overall EfficiencySustainability EfficiencyMarketability Efficiency
SectorMTEGTETGRMTEGTETGRMTEGTETGR
Mean
IN0.2520.4990.5670.5830.8800.6610.1870.5340.342
CD0.2010.3870.5480.5350.8260.6320.2040.4130.491
IT0.4990.6710.7170.7190.8700.8150.3780.5550.670
HC0.3860.7970.4680.6780.9020.7450.3020.6250.472
FI0.6160.7180.8310.8300.8540.9710.3300.5720.578
RE0.7050.9470.7500.7830.9350.8370.3560.7670.474
EN0.4350.9560.4460.8140.9750.8320.1510.7440.194
MA0.2080.9160.2290.5500.9500.5770.1690.7660.220
UT0.3570.8480.4380.6200.9910.6250.1840.6890.254
CT0.2610.4660.5050.6230.9170.6700.2360.4660.475
CS0.3500.5740.5170.7050.8710.8090.2760.5680.472
K-W Test (p-Value)0.000 ***0.000 ***0.000 ***0.000 ***0.000 ***0.000 ***0.000 ***0.000 ***0.000 ***
Std. Dev.
IN0.2690.3560.2910.1560.1260.1340.1380.2840.099
CD0.2060.3090.1940.1950.1830.1270.2090.3100.182
IT0.3100.2990.2020.1890.1340.1120.2500.2750.212
HC0.2650.2830.2210.1820.1090.1380.1760.3200.089
FI0.2930.2540.1630.1570.1480.0410.2450.2480.249
RE0.2620.1130.2640.1590.0940.1360.1550.2420.147
EN0.2980.0990.2900.2290.0600.2180.0940.2850.075
MA0.1010.1870.0980.1110.0670.0950.0720.2480.045
UT0.2860.2500.2960.1560.0220.1540.1090.2250.090
CT0.3390.3980.2680.1950.0860.1590.2410.3110.164
CS0.3360.3310.2370.1820.1470.1450.2470.3200.237
Minimum Value
IN0.0330.0870.0550.3190.5860.5230.0440.1330.164
CD0.0110.0190.1450.1150.2250.4350.0220.0940.200
IT0.0530.0550.3510.4100.6080.6740.0170.0210.263
HC0.0520.1740.1940.4350.6810.5670.0100.0330.178
FI0.1860.3340.4990.5440.5590.8560.0860.1480.161
RE0.1180.5990.1180.5040.7330.6380.1020.2180.163
EN0.0560.6900.0560.4240.8170.4240.0250.1830.095
MA0.0940.4850.1180.4160.8010.4190.0720.3010.102
UT0.0620.0850.1440.4980.9310.4980.0420.3260.129
CT0.0440.0960.1550.4180.7470.4840.0600.1450.293
CS0.0680.1830.2230.4820.5690.5430.0610.1710.202
Number of Efficient Firms
IN415 320 07
CD17 210 24
IT712 816 36
HC215 314 08
FI912 1012 03
RE716 613 05
EN213 814 07
MA013 09 06
UT28 214 04
CT25 25 12
CS04 16 04
Total36120 45133 656
*** correlations are significant at the 1% levels.
Table 9. Returns to scale on all sectors.
Overall EfficiencySustainability EfficiencyMarketability Efficiency
SectorCRSDRSIRSCRSDRSIRSCRSDRSIRS
IN41140214390550
CD1243117281441
IT41424313260420
HC2920611140310
FI1102139200320
RE401731170210
EN14123590170
MA031404130170
UT101612140170
CT12121770150
CS0490760130
Total1959228239019313041
Table 10. Truncated regression result on overall efficiency.
ItemMTE MTES1 MTES2
Environmental Innovation Score (EIS)−0.003656***−0.000939 −0.000266
Resource Use Score (RUS)−0.006789***−0.001130 −0.001582
Emissions Score (ES)0.003012 0.005343**0.003903**
ROA0.017618***0.017379***0.013102***
ROE−0.000041 −0.000219 −0.000121
Debt Ratio−0.004864**0.000429 −0.000489
_cons0.623627***−0.426119**−0.141300
/sigma0.329686***0.302446***0.2416755***
Log Likelihood92.1760 130.3373 150.3907
Wald chi2(6)16.9 37.09 21.33
Prob > chi20.0096 0.0000 0.0016
**, and *** correlations are significant at the 5%, and 1% levels, respectively.
Disclaimer/Publisher’s Note: The statements, opinions and data contained in all publications are solely those of the individual author(s) and contributor(s) and not of MDPI and/or the editor(s). MDPI and/or the editor(s) disclaim responsibility for any injury to people or property resulting from any ideas, methods, instructions or products referred to in the content.

