Article

Perceived Restorative Potential of Urban Parks by Citizens—A Case Study from Wrocław, Poland

by
Aleksandra Szkopiecka
,
Joanna Patrycja Wyrwa
*,
Grzegorz Chrobak
,
Iga Kołodyńska
and
Szymon Szewrański
Institute of Spatial Management, Wroclaw University of Environmental and Life Sciences, 50-375 Wroclaw, Poland
*
Author to whom correspondence should be addressed.
Sustainability 2023, 15(10), 7912; https://doi.org/10.3390/su15107912
Submission received: 4 April 2023 / Revised: 4 May 2023 / Accepted: 5 May 2023 / Published: 11 May 2023

Abstract

:
Providing restorative green areas is important, especially in the city, where the level of stress and noise is relatively high. Therefore, green areas, such as urban parks, should provide coherent audio–visual stimuli to achieve positive perception by the residents. Therefore, this study aims to investigate the potential for psychological regeneration in urban parks in terms of visual and soundscape assessment as well as to assess the role of the intensity of different types of sound contributing to the positive perception of the soundscape. In order to achieve this aim, we chose eight urban parks in the city of Wrocław to provide audio and visual stimuli and used a group of young adults as survey respondents. The results show that visual stimuli are perceived as undoubtedly more important than the soundscape, and that talking, footsteps, music, children (playing), birds, and vehicles are the most significant types of sound that contribute to the perception of soundscape depending on the level of intensity of the sound (with children and vehicles being beneficial if they are completely inaudible). We conclude that the quality of the soundscape is essential to improve the restorative potential of urban parks and, in consequence, to improve the well-being and health of the city dwellers, and there is a necessity for strategies and development plans including sensually coherent and inclusive public parks in the city of Wrocław.

1. Introduction

Natural elements or urban landscapes play great role in protecting landscapes from climate change [1] by building urban resilience [2,3] and reducing the carbon footprint [4], as well as significantly impacting the health and well-being of the citizens [5,6,7]. The presence of green areas, such as urban parks, is often considered in the context of quantity (area per capita) in planning documents. However, what is also important in the urban context is the quality of urban parks. We use our senses to perceive the landscape; however, mostly research concerns the visual aspects of landscapes. Nevertheless, sound is increasingly proving to contribute to the positive or negative evaluation of “visible” landscapes. Therefore, the consistency between sound and image is believed to lead to a better appreciation of the landscape [8]. For example, Carles [9] showed that people perceived pairs of audio–visual stimuli that were coherent more positively (e.g., the image and sound of water) than incoherent stimuli (e.g., the image of water and the sound of a busy street). Natural sounds can improve an overall perception of a landscape (e.g., bird song and an agricultural landscape) [10]. Natural sounds, such as birds singing, can reduce stress, anxiety, and contribute to improvements in emotional state [11]. This is supported by physiological indicators, such as heart rate and heart rate variability [12,13]. Sounds determine our perception of a space, and they are crucial in creating friendly urban spaces for citizens [8]. Furthermore, the lack of proper care for the environment can lead to a decrease in the attractiveness of a space and the quality of a soundscape, which can also hinder the development of a human-friendly environment [14].
Previous studies examined the positive influence of coherent audio–visual stimuli on the respondents [9] as well as the positive influence of natural sounds and negative influence of traffic noise on the citizens [5]. However, evidence as to how much urban parks can provide coherent audio–visual stimuli and provide a restorative space for citizens is still scarce. The influence of different types of sounds on the overall perception of soundscapes was researched, but the intensity of those sounds was not, except for traffic noise [15,16]. Therefore, this study aims to investigate the potential for psychological regeneration in urban parks in terms of visual and soundscape assessment by answering the following research questions:
To what extent does the visual and auditory environment of urban parks support the psychological regeneration of the citizens?
How do different types of sounds at different intensity levels affect the overall perception by citizens of the soundscape in urban parks?

2. Methodology

This study applies a mixed methods approach to collect and analyze the data. The detailed research procedure is provided below.

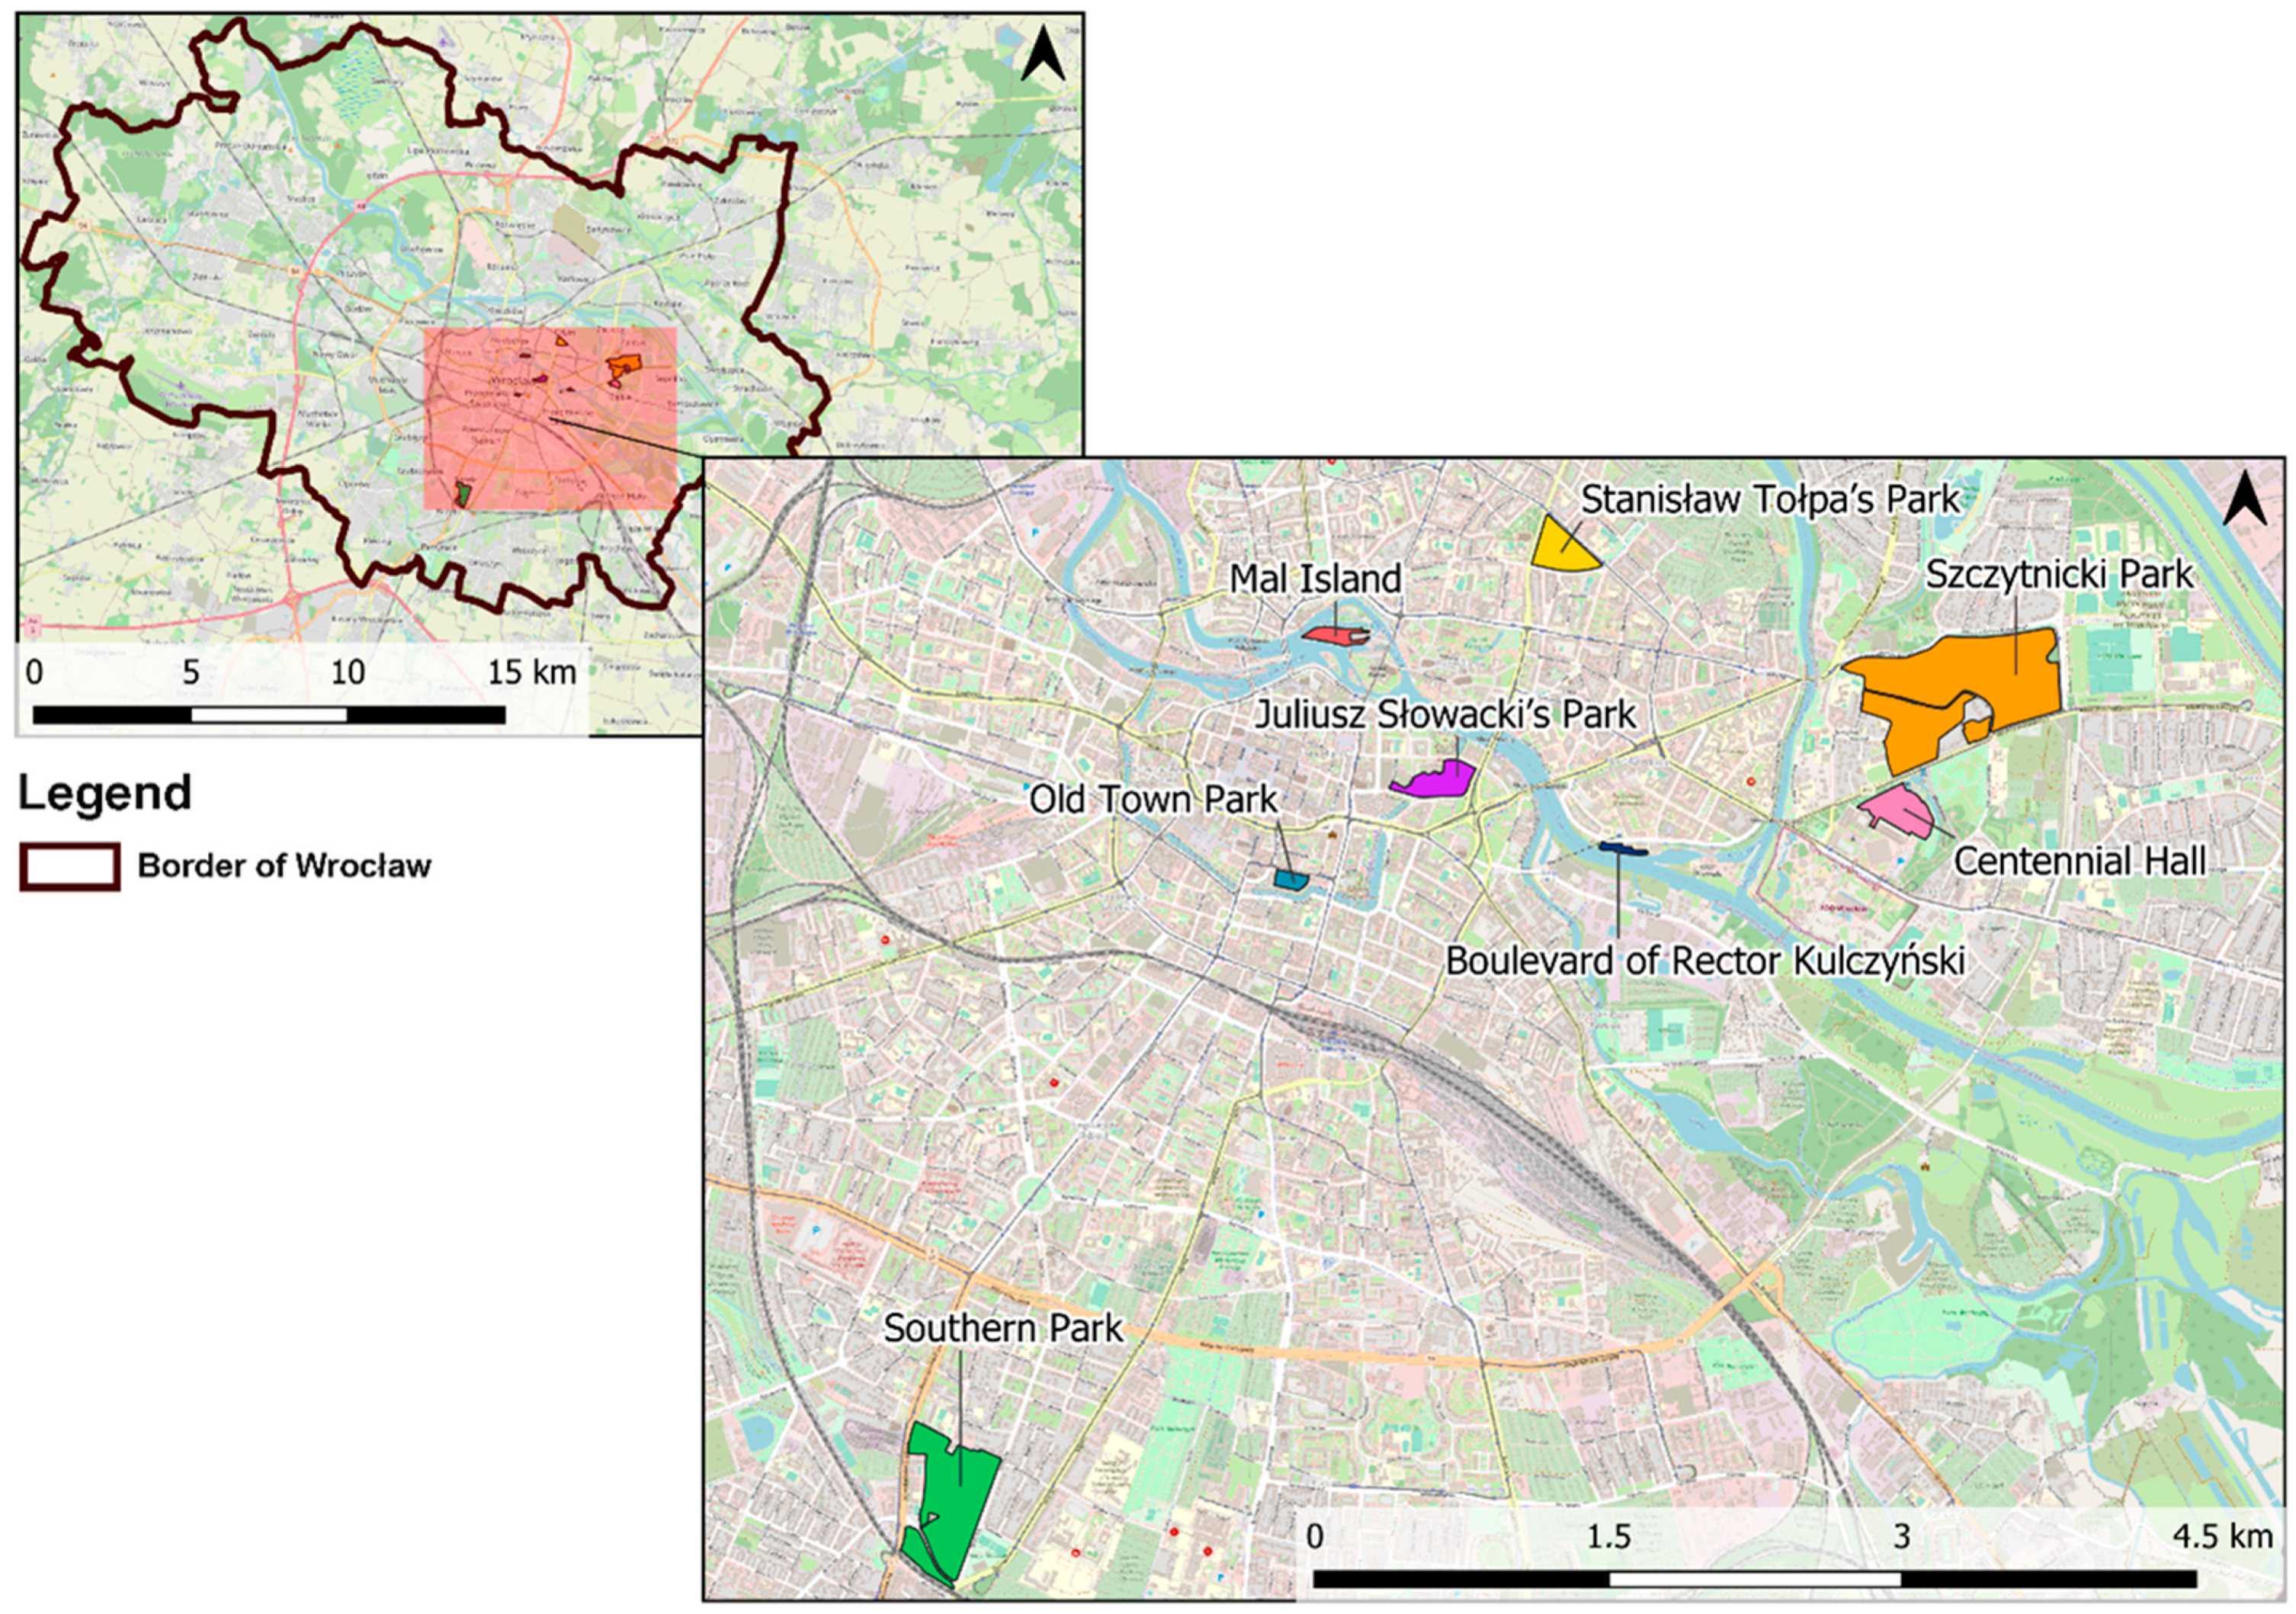
2.1. Case Study Area

The spatial scope of the study includes parks and public spaces for leisure and recreation in the city of Wrocław, Poland. Wrocław is located in southwestern Poland, on the banks of the Odra River. It has approximately 640,000 inhabitants and is the capital of the Lower Silesia region. Before selecting urban parks for further analysis, various parks were observed using the method outlined by Apanowicz [17]. For the analysis, eight places were chosen, with seven located in the city center (Figure 1). These are as follows:
  • Old Town Park (Park Staromiejski), located in the old town, is a very well-maintained small park located by the puppet theater (2.75 ha).
  • Mal Island Park (Wyspa Słodowa) is located on an island in the Odra River (about 2.5 ha).
  • Stanisław Tołpa’s Park (Park Stanisława Tołpy), located in the Ołbin district, has a small reservoir, playground for children, and a dog park (8.96 ha).
  • Centennial Hall (Hala Stulecia) has green scenery, multimedia fountains, and pergolas (about 6.5 ha of green area).
  • Juliusz Słowacki’s Park (Park Juliusza Słowackiego) is located in the very center of the city, accompanied by high-traffic roads and the museum of the Battle of Racławice.
  • Szczytnicki Park (Park Szczytnicki) is located to the east of Plac Grunwaldzki and the old Oder River (5.74 ha).
  • The Boulevard of Rector Kulczyński (Bulwar im. Rektora Stanisława Kulczyńskiego) is located by the Odra River, and is a recreational place with a beach (about 300 m long).
  • Southern Park (Park Południowy) is a big park with many attractions, including a playground, cafes, a dog park, and reservoir (25 ha).

2.2. Sound Recordings

The recordings were made between April and May 2022. The tools that was used to record the sound in a binaural way were in-ear headphones equipped with microphones placed at the entrance of the listener’s ear canal. This option was chosen after taking into account all the advantages and disadvantages of various sets used to record the soundscape [12]. The microphone allows the user to record the acoustics of the environment so that a given sound is assigned the location of its occurrence. The listener then hears the sound from the side from which it was originally made. Binaural recordings are the closest representation of human hearing, and they also have good spatial quality. With current methods of reproduction, we have good enough imitation of natural sound to give listeners a chance to interpret it correctly [12]. Raw recordings lasted up to 10 min; however, 1 min was selected for the surveys, which was the audio-card of a given place. The exact study sites in parks and recreation areas were selected in such a way that they were as close to the city center as possible. Before starting the recordings, an initial evaluation was carried out to determine the correctness of the selection. It consisted of spending a minimum of 10 min in a given location and listening to sounds coming from different directions. This allowed for better familiarization with the audio environment of the place. Recordings from a total of eight locations in Wrocław were analyzed. Each of them has its own distinguishing features, with a different intensity of visitor flow and area. Panoramas and results of the survey of each place are presented in the Supplementary Materials S2.

2.3. Panoramas

The view of each panorama reflects the actual place of the recording. Each individual place was chosen fairly in the middle of the park or boulevard. The first step in choosing a place was to walk through the studied area and focus on hearing and registering sounds. Then, a potential place was chosen. The visual aspect of a place was also considered, but it was not the main factor while making the decision—rather, it was the sound which was more important. After about 10 min of evaluating sounds, the final decision for choosing a place was made. For each panorama, locations that face nature rather than people or busy roads were selected.

2.4. Survey

During the preparation of the survey, attention was paid to the methods and questions contained in scientific articles on similar topics. Some of them focused on the hearing scale and feelings towards each sound, which was a great example for this study [18]. Sound grouping was proposed in a paper by Yang [19]. Other studies suggest that there exist various categories of sounds that can be heard in public spaces [20]. Based on the Swedish Soundscape-Quality Protocol (SSQP) [19] the respondent was given the opportunity to define the characteristics of a given place and indicate the isolated sounds against the background of the whole. The sounds belonged to the following groups:
  • People/anthropogenic: conversations (talking), walking (footsteps), music, and children (playing).
  • Traffic: car engines, tram sounds (vehicles), braking, and horns.
  • Natural: sounds of birds, insects, wind, and water.
Some of them clearly presented the results in a cluster, which was an inspiration to create a comparative analysis cluster for each study site [8,21,22] (Supplementary Materials S2).
The prepared survey consisted of seven questions about each examined place, which were divided into visual and audio–visual questions. The first part only showed a panoramic view of the place and the second part consisted of the binaural recording and previously viewed photo. Similar questions were asked for each of the two parts, so as to allow for a subsequent comparative analysis and interpretation of the answers (Supplementary Materials S1).
Before proceeding with the interpretation, a table was prepared to help assess the sight and sounds of a given place (questions 3 and 5). Each view and then view combined with a soundscape recording were evaluated in terms of the level of perceived pleasantness, calm, and diversity on a scale from 1 to 5, where 1 meant annoying, chaotic, or monotonous, and 5 meant pleasant, calm, and various (Table 1).
Depending on how many people indicated a given rating, this result was multiplied by the number of points assigned to each category and added from each scale row. The higher the score, the more positive the assessment of the sight or sounds.

2.5. Statistical Analysis

Variance Explainability Screening

In the first phase, we used multidimensional scaling (MDS) to assess the survey’s different question combinations and the findings’ ability to explain variation (or variance) over the whole survey. (Table 2). Due to this, it was possible for us to complete a relevant variance visual search in response to specific question and answer sets.
The sets of questions and answers were analyzed in the following five variants:
  • All questions (Var. 1)—attained consistency (explainability of variation in the two main dimensions of around 11%; full explainability requires 68 dimensions).
  • Visual (view) assessment-based questions, such as “How would you rate the place?” (Var. 2)—attained consistency of about 30%; full explainability requires 12 dimensions.
  • Questions based on sound assessment (Var. 3)—attained consistency of approximately 11%; 56 dimensions are required to reach full explainability.
  • “What are you hearing?”—a question used in sound examination (Var. 4)—attained a consistency of approximately 12% of the variation accounted for by the two leading dimensions; 44 dimensions are required to account for all of the variance.
  • “How would you rank the location?” is a good evaluation question (possible target value for modelling). Var. 5—attained consistency of around 32%; full explainability requires 12 dimensions.
Referring to the measures of explanatory variance obtained, decisions about the nature of the variables were made (Table 3). Given the relatively low explanatory power (11%) for the survey as a whole, we decided to treat the responses to questions, such as “What do you hear?”, as independent variables with the potential to describe the relatively high variance obtained in the responses to the question “How would you rate…?” (32%).
Furthermore, it can be seen that in variant 3, where we combined the questions from variants 4 and 5, the explanatory power drops again to around 11%. This means that variant 5, which generates a larger signal in the survey, can only be treated as the dependent variable to maintain its variance consistency. In contrast, only the responses from variant 4 can be treated as independent variables, since expanding the set of independent variables to include the other questions (variants 1 and 3) does not increase the explanatory power while increasing the number of variables describing the results of the responses from variant 5. This provided a rationale for the following further actions:
  • Create a consistent, resultant opinion indicator which would act as a target variable for the feature selection process.
  • Encode the responses to the questions in version 3 into bit encoders so that correlation analysis can be carried out for individual responses.
  • Perform a principal component analysis for the encoded results to check the similarity between the answers and their scree plot on the vector map.
  • Perform a feature selection procedure to identify responses relating to sound impressions (variant 3) that significantly influence the resultant opinion indicator.

2.6. 3D Matrix for Landscape Restorative Potential

The respondents were asked to evaluate the pictures and pictures with a soundscape recorded in the park in three aspects: pleasantness, calm, and diversity. We believe that all three aspects equally contribute to the restorative potential. Therefore, following the 3D matrix solution used in the risk assessment of landslides and flood events [23], the results determined for each of the three axes were transferred to a 3D cube space (Figure 2).
The numerical values obtained should be interpreted as a measure of the location of the respondent’s opinion, which consists of three partial answers from 1 to 5. On each response, this position was coded in values from 1 to 125. For a detailed discussion of this method, see the paper cited above.
The use of three-dimensional space to find the resultant opinion on visual assessment, as well as soundscape assessment, made it possible to compare the public places included in the study in a concise manner.

2.7. Variables Encoding and Correlation Analysis

The one-hot encoding procedure involved creating binary columns for each category and particular sound characteristics from questions related to acoustic experience (variant 4). The answers were given in relation to several categories (talking, music, birds, and others). We created 11 binary columns, 1 for each sound category, where a value of 1 indicated that the answer on a characteristic was obtained in that category, and 0 indicated otherwise. We then focused on the coding of individual responses shared within categories; for example, for the birds category, the possible responses were within a range of five intensity characteristics to choose from. In view of this, the matrix as coded consisted of 55 fields taking the values 1 or 0 for each of the responses. Once the one-hot encoding was complete, we performed exploratory data analysis to better understand the dataset. We examined the correlation of the variables and their relationship with the resultant indicator.
First, we investigated the correlation between 11 variables related to the sound category. The variables included in the analysis were talking, footsteps, music, children, birds, insects, water, wind, vehicles, braking, and horns. We have checked which of these categories are correlated to each other in terms of answers given by respondents. The correlation was performed with the use of Pearson’s correlation measure. The results (Figure 3) point to strong positive correlation (0.5 to 1.0) between horns and braking (0.51) and footsteps and talking (0.62).
Next, an analogous analysis was performed for the coded responses on given characteristics in each category (Figure 4). Again, Pearson’s correlation measure was used. Strong positive correlation was found for the pairs Talking_5 and Footsteps_5, Braking_3 and Horns_5, and Braking_5 and Horns_5. All of the observed negative correlations were due to answers excluding each other within one category, for instance, Horns_1 and Horns_4.

2.8. Dimensionality Reduction

Principal component analysis (PCA) was performed on the set of sound categories to identify underlying patterns or structures in these sound groups (Figure 5). Each arrow in the scree plot represents a different eigenvalue of each sound category, and each column represents a different principal component (PC). The values in the scree plot indicate the degree to which each sound category is associated with each PC. Specifically, a higher absolute value indicates a stronger association or correlation between the sound category and the PC, and the sign of the value indicates the direction of the association (i.e., positive or negative). The first PC is strongly associated with the “Talking” and “Footsteps” categories, as evidenced by their large and positive loadings. This suggests that these two categories are highly correlated and likely share common acoustic features that distinguish them from the other sound categories in the dataset. The second PC is associated with a more diverse set of sound categories, including “Vehicles”, “Horns”, and “Music”, among others. This suggests that these categories share some underlying patterns of variability that are distinct from those captured by the first PC.
PCA was also performed for the set of sound characteristics (Figure 6). In the first principal component, the variables “Talking_2” and “Footsteps_2” have the highest loadings, indicating that they have the strongest relationship with this component. In contrast, the variable “Music_2” has a negative loading, indicating an inverse relationship with this component.

2.9. Feature Selection (Boruta Algorithm)—Performed on Categories

To determine the value of the impact of a given sound (and its intensity) on the result (ratio), we used the following method of selecting variables: the Bortz–Boehnke approach, also referred to as the “Boruta” algorithm. When initiating the algorithm, we first calculated the frequency of each response for each category in the data set. We then identified any responses that occur with a frequency of less than five and grouped them together into a single, new (temporary) category. Next, within the algorithm, the chi-squared statistic was calculated for each pair of categories in the data set. The chi-squared statistic measured the degree of association between two categories, and a high value indicated a strong association. The algorithm then identified any pairs of categories with a statistically significant association (p-value less than 0.05). Finally, the algorithm performed a cluster analysis on the categories with significant associations. The cluster analysis grouped together variables that were highly correlated, revealing underlying patterns in the data.
The results of the algorithm include the following information:
  • Sound category: different sound categories that were analyzed using the Boruta algorithm.
  • MeanImp: the mean importance score of the features in each sound category. Higher scores indicate greater importance.
  • MedianImp: the median importance score of the features in each sound category.
  • MinImp: the minimum importance score of the features in each sound category.
  • MaxImp: the maximum importance score of the features in each sound category.
  • NormHits: the normalized number of times that each feature was identified as important in the iterations of the Boruta algorithm. Higher scores indicate greater importance.
  • Decision: the final decision for each sound category based on the Boruta algorithm’s analysis. The options are “Confirmed” if the sound category is important, and “Rejected” if it is not.
The Boruta algorithm has identified five sound categories as important: talking, footsteps, music, children, and birds. These categories have relatively high mean and median importance scores, as well as high normalized hits. The algorithm has rejected three sound categories: insects, water, and wind, with negative or very low importance scores and zero normalized hits. Two other sound categories, vehicles and braking, have mixed results, with moderate mean importance scores and high median importance scores, but very low or zero normalized hits. The sound category of horns has a relatively high mean importance score, but a low median score and high variability in importance scores, resulting in a rejection decision by the algorithm (Figure 7).
In the next step, the algorithm was also performed on results indicating the characteristics of particular sounds. Looking at the results (Figure 8), we see that only a few variables were confirmed as important by the Boruta algorithm, as indicated by the “Confirmed” label in the decision column. For example, the footsteps described as definitely loud have a normHits value of 919191919191919, which is the highest in the table, and has been confirmed as important.

3. Results

A total of 43 people responded to the survey (Figure 9). More than half (72%) of all the respondents were females (31 people). All of the respondents were adults aged 18–54, in which the most numerous age group was 18 years old, who made up almost half of the respondents (46%, 29 people). The 25–34 years old and 35–44 years old age groups were similar to each other in terms of the number of people in the group, with 9 and 11 people, respectively. Only three people (<1%) declared themselves to be in the age range of 45–54. No people over 55 years old participated in the survey. Collected data on education shows that the majority of the respondents had received higher education (67%), while a quarter of them were still students. Almost 7% of the respondents had obtained a vocational or technical secondary school education. In summary, most of the respondents were females in the age range 18–24 with an incomplete higher education.

3.1. Landscape Restorative Potential of Visual and Sound Stimuli

The minimum value in the visual results dataset is 2, while the maximum is 125, resulting in a range of 123. The dataset contains 344 numbers. The median value in the dataset is 50, and the mode is 100. The quartiles are Q1 = 27, Q2 = 50, and Q3 = 100. The interquartile range is 73, and there are no outliers in the dataset. The minimum value in the soundscape resultant opinion data set is 1, and the maximum value is 125. The range of the data is 124, and there are 344 data points. The median is 27. The mode is 27. The mid-range is 63, and the quartiles are Q1 = 16, Q2 = 27, and Q3 = 60, with an interquartile range of 44. There are no outliers in the data set.
The median visual opinion result of each park ranges from 27 to 80, with Park Juliusza Słowackiego having the highest median at 50, while Bulwar im. Rektora Stanisława Kulczyńskiego has the lowest median at 16. The soundscape opinion result also ranges from 18 to 75, with Park Szczytnicki having the highest resultant opinion and Hala Stulecia/Pergole having the lowest. Overall, Park Juliusza Słowackiego and Park Szczytnicki have the highest median and resultant opinion, respectively, while Bulwar im. Rektora Stanisława Kulczyńskiego and Hala Stulecia/Pergole have the lowest. In all cases the resultant opinion on the soundscape remains lower than the resultant opinion on the visual attributes. For an overall view, please see Figure 10.

3.2. The Impact of Different Types of Sound in Overall Perception of Parks in Wrocław

Each sound category had an assigned variable of intensity level: inaudible, definitely silent, silent, moderate, loud, and definitely loud. The analysis revealed that sounds of specific intensities from the aforementioned categories impact the perception of the researched parks in Wrocław (Table 4). The six-scale hierarchy of importance, based on their influence on the increase in the ratio in the statistical model, is as follows: moderate music (is the most statistically significant when moderately audible), next completely inaudible vehicles, quiet birds, and definitely loud footsteps. The fifth statistically significant variable is the completely inaudible sound of children, and the last variable is the sound of talking. The statistical model suggests that talking is important, but not at a specific intensity, and each intensity has a degree of impact.

4. Discussion and Conclusions

4.1. Landscape Restorative Potential of Visual and Sound Stimuli

The restorative potential of soundscapes was found to be lower than that of visual aspects in all case studies. This demonstrates the significant role that sounds play in shaping the overall perception of landscapes and highlights the need for more improvements in the soundscape compared to the visual aspects of urban parks in Wrocław. This is in agreement with the results of Gozalo [24], which suggest that sound is the most important factor to consider when designing green areas. It has been established that traffic is a fundamental source of noise in urban green areas [25].

4.2. The Impact of Different Types of Sound in Overall Perception of Parks in Wrocław

The sounds that influenced the high rating of the parks in Wrocław were birds, but only when at a low-intensity level (quiet). The high rating given to birds with low intensity may be due to and support the idea that birdsong is best perceived at a height of 4 m, compared to 0.5–2 m, as shown in a study by Zhao [26]. The height affects the intensity of the birdsong by reducing it, which respondents perceive as better. Other studies have shown that birdsong generally has a positive influence on the perception of park soundscapes [27,28], but the intensity level was not tested, so our research fills this gap. For further analysis, it is also important to check birdsong perception during different seasons and with different kinds of birds. For example, crow birdsong has the worst effect on the perceived restorativeness of an urban park [26].
In the model, water was rejected as having no influence on the assessment of the parks as perceived by respondents. Other research confirmed the importance of water in the positive perception of park space, and, additionally, water can mask unpleasant sounds [22,29]. The significance of water sounds in city design has gained increasing attention due to the growing interest in innovative hydro-sounds and their positive impact on the health and well-being of urban residents [11,30]. However, the urban soundscape is dominated by mechanical and engine sounds that tend to suppress the sounds of nature, including water [11]. In our analysis, the sound of vehicles supported the overall positive perception of a park if it was completely inaudible, so a park was better assessed without vehicle sounds. This supports the findings from other studies that street noise is perceived unfavorably and has a negative impact on the perception of parks [31].

4.3. Limitations and Recommendations for Future Research

Around half of the respondents were between the ages of 18 and 24, mainly with high education levels (two-thirds of respondents) or students (one-quarter of respondents). Therefore, this study can only refer to the results as perceived by young adults. In that respect, we mainly followed people, according to biological and psychosocial aspects, at the peak of their sensual possibilities. The capital of Lower Silesia is a student city. Students have a huge impact, especially during the academic season, in shaping the image and soundscape of Wrocław. According to the Statistical Office of Poland, around 16% of Wrocław’s dwellers are students (in the academic year 2020/21, a total of 107.9 thousand students studied in Wrocław). Taking that to the foreground, we fill the gap in Wrocław city council’s strategies, which mainly evaluate the needs and opinions of registered or adult citizens (according to our knowledge, there was not any research until now about students’ urban needs or especially the visual and sound perception of parks, which is interesting in the context of visual identification of the city and follows the increasing interest in the subject).
Several factors need to be further explored. First, the visual and sound perception of the green areas by people over 55 must be taken into deeper consideration in future research, because this age group was not represented in this study. An important aspect is the fact that older people are regular visitors to green spaces. This approach is important nowadays in the context of increasing the health and well-being of older adults [32]. It is important to compare the results of our study with the age group of >55, as hearing loss is a common issue in older adults (age-related hearing loss, ARHL). According to data from WHO in 2021, approximately one-third of people aged 65 and older experience significant hearing loss. Similar conclusions may be applied regarding problems linked to the elderly. Older adults may perceive the soundscape of green areas more conservatively, and they may have different expectations and needs based on health conditions and life stage. This is especially important due to the issue of aging societies not only in Poland but also in Europe and globally. The global aging of urban populations is driving the adoption of age-friendly approaches [33] and it is a special consideration for planners of urban parks, which are the fundamental places for recreation and improving health and well-being for older adults in cities [32]. The role of sociocultural variables in the perception of urban parks should also be considered in the future research because of a growing number of Ukrainian refugees in Wrocław [34].
It could also be recommended to conduct further research on the issue of the research method and the questions asked of respondents. Sound alone generates 24% of the signal in two dimensions, while the image alone generates 21% of the signal in two dimensions (which are the most efficient), and, when we combine them, they cancel each other out and give 18% of the signal. It would be worth asking why the images exclude each other when combined with sound.

4.4. Recommendations for Urban Planning

It is important in the context of challenges in the near future for city planners to provide health issue prevention in public spaces. Due to the necessity of increasing support for public health, it is also important to provide a financial background for the regeneration and multiplication of public parks and green areas which should be suitable for social needs and should refer to the results of soundscape research, which has repeatedly proven its importance [15,29] We can compare city dwellers’ satisfaction from two self-experienced (based on our team study visits) perspectives: Albanian and English. There is high pressure in Tirana (Albania) to reshape the chaotic and unplanned city life sphere, which could be an example of the progressive meanings of non-places. On the other hand, in London (England) stabilized park life is positively supported by the authorities with good results, which is suitable with conservative meanings [35].
A significant factor which influences the acceptance of sound pollution caused by traffic is the ability to control it to have the possibility of changing a chosen place [36]. The answers of the users of the Nicolaus Copernicus Park to the final question showed that the majority of people—72%—would choose the park despite the sounds of traffic and the general failure expectations of the soundscape of this place (please see Supplementary Materials S2). In other research, the highest related parks are those with good access to private and public transport [37], which the parks of Stanislaw Tolpa and Nicolaus Copernicus certainly have, as these green areas are situated in city centers, adjacent to the streets and public transport stops. On the other hand, human attention is drawn to sudden noises, and sounds that are stable over time are easier to ignore [38]. As other researchers proved, city dwellers spend their leisure time in public spaces mostly in the vicinity of their place of residence [39]. Taking that approach, there is also a department of higher education institution in front of the park (Politechnika Wrocławska), so students have easy access to this green area, and it is a popular place among them, which is assumed to be important in the context of the leading age group of surveys takers.
Our findings are in the agreement with the study of Soares and Coelho [40] as well as the standard ISO 12913-1, which confirms that the soundscape of a public park depends on geography, urban architecture, park infrastructure, sound sources, and, most importantly, the visitors’ expectations together with their other sensorial responses, which are different in distinct sociocultural and environmental contexts. This research is significant as it aligns with the current interest in soundscapes and how people perceive public spaces through different senses. It also aims to address the unique needs of Wrocław’s citizens, ultimately contributing to higher life satisfaction. Thus, it is crucial to implement strategies and development plans that prioritize inclusive and sensually coherent public parks in the city [5]. Additionally, it is important to take into account people’s preferences in landscape assessments during urban planning and management, as their perception of the environment and its values may differ from that of experts [41]. Furthermore, the importance of participation in planning processes and environment-related decision-making is growing [42,43].

Supplementary Materials

The following supporting information can be downloaded at: https://www.mdpi.com/article/10.3390/su15107912/s1.

Author Contributions

Conceptualization, A.S., J.P.W. and I.K.; Methodology, A.S., G.C., I.K. and S.S.; Software, G.C.; Validation, I.K.; Investigation, G.C.; Resources, A.S., J.P.W., I.K. and S.S.; Data curation, G.C. and S.S.; Writing—original draft, A.S., J.P.W., G.C., I.K. and S.S.; Writing—review & editing, J.P.W. and I.K.; Visualization, G.C.; Supervision, I.K. and S.S.; Project administration, I.K. All authors have read and agreed to the published version of the manuscript.

Funding

This research was funded by the Polish National Science Centre, grant number 2021/43/D/HS4/00321.

Institutional Review Board Statement

Not applicable.

Informed Consent Statement

Informed consent was obtained from all subjects involved in the study.

Data Availability Statement

Not applicable.

Conflicts of Interest

The authors declare no conflict of interest.

References

  1. Kazak, J.K.; Hodor, K.; Wilkosz-Mamcarczyk, M. Climate Change and Current Challenges for Landscapes and Cultural Heritage. Land 2022, 11, 2323. [Google Scholar] [CrossRef]
  2. Li, B.; Wang, Y.; Wang, T.; He, X.; Kazak, J.K. Scenario Analysis for Resilient Urban Green Infrastructure. Land 2022, 11, 1481. [Google Scholar] [CrossRef]
  3. Perwenis, P.; Szewrański, S. Spatial planning for reducing the epidemic risk—The state of knowledge and practice from the perspective of the COVID-19 pandemic. J. Water Land Dev. 2022. [Google Scholar] [CrossRef]
  4. Świąder, M.; Szewrański, S.; Kazak, J.K. Environmental Carrying Capacity Assessment—The Policy Instrument and Tool for Sustainable Spatial Management. Front. Environ. Sci. 2020, 8, 579838. [Google Scholar] [CrossRef]
  5. He, B.-J.; Ouyang, X.; Yang, L.; Yao, W. Usage Behavior and Health Benefit Perception of Youth in Urban Parks: A Case Study from Qingdao, China. Front. Public Health 2022. [Google Scholar] [CrossRef]
  6. Kamińska, J.A.; Turek, T.; Van Poppel, M.; Peters, J.; Hofman, J.; Kazak, J.K. Whether cycling around the city is in fact healthy in the light of air quality—Results of black carbon. J. Environ. Manag. 2023, 337, 117694. [Google Scholar] [CrossRef]
  7. Kang, J. Soundscape in city and built environment: Current developments and design potentials. City Built Environ. 2023, 1, 1. [Google Scholar] [CrossRef]
  8. Aletta, F.; Kang, J.; Axelsson, Ö. Soundscape descriptors and a conceptual framework for developing predictive soundscape models. Landsc. Urban Plan. 2016, 149, 65–74. [Google Scholar] [CrossRef]
  9. Carles, J.; Bernáldez, F.; De Lucio, J. Audio-visual interactions and soundscape preferences. Landsc. Res. 1992, 17, 52–56. [Google Scholar] [CrossRef]
  10. Ren, X.; Kang, J.; Zhu, P.; Wang, S. Effects of soundscape on rural landscape evaluations. Environ. Impact Assess. Rev. 2018, 70, 45–56. [Google Scholar] [CrossRef]
  11. Beatley, T. Biophilic Cities. Integrating Nature into Urban Design and Planning; Island Press: Washington, DC, USA, 2011. [Google Scholar]
  12. Hong, J.Y.; Jeon, J.Y. Relationship between spatiotemporal variability of soundscape and urban morphology in a multifunctional urban area: A case study in Seoul, Korea. Build. Environ. 2017, 126, 382–395. [Google Scholar] [CrossRef]
  13. Li, Z.; Kang, J. Sensitivity analysis of changes in human physiological indicators observed in soundscapes. Landsc. Urban Plan. 2019, 190, 103593. [Google Scholar] [CrossRef]
  14. Sztubecka, M.; Skiba, M.; Mrówczyńska, M.; Mathias, M. Noise as a Factor of Green Areas Soundscape Creation. Sustainability 2020, 12, 999. [Google Scholar] [CrossRef]
  15. Lercher, P. Noise in cities: Urban and transport planning determinants and health in cities. In Integrating Human Health into Urban and Transport Planning: A Framework; Springer: Berlin/Heidelberg, Germany, 2018; pp. 443–481. [Google Scholar] [CrossRef]
  16. Payne, S.R. The production of a Perceived Restorativeness Soundscape Scale. Appl. Acoust. 2013, 74, 255–263. [Google Scholar] [CrossRef]
  17. Apanowicz, J. Metodologia Ogólna; Wydawnictwo Diecezji IVlplińskiej Bernardinum: Gdynia, Poland, 2002. [Google Scholar]
  18. Mitchell, A.; Oberman, T.; Aletta, F.; Erfanian, M.; Kachlicka, M.; Lionello, M.; Kang, J. The Soundscape Indices (SSID) Protocol: A Method for Urban Soundscape Surveys—Questionnaires with Acoustical and Contextual Information. Appl. Sci. 2020, 10, 2397. [Google Scholar] [CrossRef]
  19. Yang, D.; Cao, X.; Meng, Q. Effects of a human sound-based index on the soundscapes of urban open spaces. Sci. Total. Environ. 2021, 802, 149869. [Google Scholar] [CrossRef]
  20. Jeon, J.Y.; Hong, J.Y. Classification of urban park soundscapes through perceptions of the acoustical environments. Landsc. Urban Plan. 2015, 141, 100–111. [Google Scholar] [CrossRef]
  21. Manzano, J.V.; Pastor, J.A.A.; Quesada, R.G. The importance of changing urban scenery in the assessment of citizens’ soundscape perception. On the need for different time-related points of view. Noise Mapp. 2021, 8, 138–161. [Google Scholar] [CrossRef]
  22. Xiaohong, L.; Jinxiao, W.; Hongxuan, Z. Research on Interactive Soundscape Design for Urban Landscape. E3S Web Conf. 2021, 236, 03033. [Google Scholar] [CrossRef]
  23. Choi, J.-R.; Co, L.S.E.; Jee, Y. A Study on the Precise Debris-flow Risk Assessment Techniques Using 3D Risk Matrix Concept in Urban Area. J. Korean Soc. Hazard Mitig. 2017, 17, 533–539. [Google Scholar] [CrossRef]
  24. Gozalo, G.R.; Morillas, J.M.B.; González, D.M.; Moraga, P.A. Relationships among satisfaction, noise perception, and use of urban green spaces. Sci. Total. Environ. 2018, 624, 438–450. [Google Scholar] [CrossRef]
  25. Nożyński, S. Środowiska Audialne. Kilka Uwag na Temat Otoczenia Dźwiękowego; Walter, N., Ed.; Wydawnictwo Naukowe Uniwersytetu im. Adama Mickiewicza: Poznaniu, Poland, 2016. [Google Scholar]
  26. Zhao, W.; Li, H.; Zhu, X.; Ge, T. Effect of Birdsong Soundscape on Perceived Restorativeness in an Urban Park. Int. J. Environ. Res. Public Health 2020, 17, 5659. [Google Scholar] [CrossRef] [PubMed]
  27. Stobbe, E.; Sundermann, J.; Ascone, L.; Kühn, S. Birdsongs alleviate anxiety and paranoia in healthy participants. Sci. Rep. 2022, 12, 16414. [Google Scholar] [CrossRef] [PubMed]
  28. Zhou, Y.; Dai, P.; Zhao, Z.; Hao, C.; Wen, Y. The Influence of Urban Green Space Soundscape on the Changes of Citizens’ Emotion: A Case Study of Beijing Urban Parks. Forests 2022, 13, 1928. [Google Scholar] [CrossRef]
  29. Jaszczak, A.; Małkowska, N.; Kristianova, K.; Bernat, S.; Pochodyła, E. Evaluation of Soundscapes in Urban Parks in Olsztyn (Poland) for Improvement of Landscape Design and Management. Land 2021, 10, 66. [Google Scholar] [CrossRef]
  30. Rewers, E. Miejski soundscape z wodą w roli głównej. AVANT. J. Philos. Vanguard 2020, 11, 1–7. [Google Scholar] [CrossRef]
  31. Romanowska, M. Urban soundscape preferences in relation to the function of a place: Case studies in Warsaw. Misc. Geogr. Reg. Stud. Dev. 2018, 22, 237–242. [Google Scholar] [CrossRef]
  32. Polko, P.; Kimic, K. Gender as a factor differentiating the perceptions of safety in urban parks. Ain Shams Eng. J. 2021, 13, 101608. [Google Scholar] [CrossRef]
  33. Van Hoof, J.; Marston, H.R.; Kazak, J.K.; Buffel, T. Ten questions concerning age-friendly cities and communities and the built environment. Build. Environ. 2021, 199, 107922. [Google Scholar] [CrossRef]
  34. Wang, D.; Brown, G.; Liu, Y. The physical and non-physical factors that influence perceived access to urban parks. Landsc. Urban Plan. 2014, 133, 53–66. [Google Scholar] [CrossRef]
  35. Lewicka, M.; Rowiński, K.; Iwańczak, B.; Bałaj, B.; Kula, A.M.; Oleksy, T.; Prusik, M.; Toruńczyk-Ruiz, S.; Wnuk, A. On the essentialism of places: Between conservative and progressive meanings. J. Environ. Psychol. 2019, 65, 101318. [Google Scholar] [CrossRef]
  36. Bruce, N.S.; Davies, W.J. The effects of expectation on the perception of soundscapes. Appl. Acoust. 2014, 85, 827–842. [Google Scholar] [CrossRef]
  37. Szopińska, K. Hałas drogowy jako czynnik wpływający na atrakcyjność miejskich terenów rekreacyjno-wypoczynkowych. Logistyka 2015, 3, 4740–4749. [Google Scholar]
  38. Miterska, M.; Kompała, J. Soundscapes of Urban parks in cities with populations of over 100,000 in the Silesian Voivodeship. Arch. Acoust. 2021, 46, 147–154. [Google Scholar] [CrossRef]
  39. Maksymiuk, G. Rozwój terenów rekreacyjnych-wspomaganie czy ograniczenie w przyrodniczej rewitalizacji miast. Teka Kom. Archit. Urban. I Stud. Kraj. 2005, 1, 149–156. [Google Scholar]
  40. Soares, A.C.L.; Coelho, J.L.B. Urban park soundscape in distinct sociocultural and geographical contexts. Noise Mapp. 2016, 3, 232–246. [Google Scholar] [CrossRef]
  41. Solecka, I.; Rinne, T.; Caracciolo, R.; Kytta, M.; Albert, C. Important places in landscape—Investigating the determinants of perceived landscape value in the suburban area of Wroc ł aw, Poland. Landsc. Urban Plan. 2022, 218, 104289. [Google Scholar] [CrossRef]
  42. Kiełkowska, J.; Tokarczyk-Dorociak, K.; Kazak, J.; Szewranski, S.; Van Hoof, J. Urban Adaptation to Climate Change Plans and Policies–The Conceptual Framework of a Methodological Approach. J. Ecol. Eng. 2018, 19, 50–62. [Google Scholar] [CrossRef]
  43. Tokarczyk-Dorociak, K.; Kazak, J.K.; Anna, H.; Szewrański, S.; Świąder, M. Effectiveness of strategic environmental assessment in Poland. Impact Assess. Proj. Apprais. 2019, 37, 279–291. [Google Scholar] [CrossRef]
Figure 1. Locations of the urban parks within the city of Wrocław.
Sustainability 15 07912 g001
Figure 2. 3D matrix solution to integrate pleasantness, calm and diversity and assess landscape restorative potential.
Sustainability 15 07912 g002
Figure 3. The correlation plot between sound categories points to a strong positive correlation between the following pairs: talking–footsteps and braking–horns.
Sustainability 15 07912 g003
Figure 4. The correlation plot between particular answers within sound categories points to a strong positive correlation between the following pairs: Talking_5–Footsteps_5 and Braking_3–Horns_5.
Sustainability 15 07912 g004
Figure 5. The amount of variance explained by each of 10 extracted dimensions points to a percentage of around 55 obtained with the 2 leading dimensions. The scree plot shows which of the categories add up to results.
Sustainability 15 07912 g005
Figure 6. The amount of variance explained by each of ten extracted dimensions points to a percentage of around 30 obtained with the two leading dimensions. The scree plot shows which of the particular characteristics from categories add up to results.
Sustainability 15 07912 g006
Figure 7. Box plots showing the distribution of feature importance scores for the Boruta algorithm. The green boxes represent the scores for the confirmed features, while the red boxes represent the scores for the rejected features. The dashed line represents the tentative cutoff threshold used by the algorithm to determine feature importance. The blue boxes are markers that demark the algorithm’s boundaries between categories.
Sustainability 15 07912 g007
Figure 8. Box plots showing the distribution of feature importance scores for the Boruta algorithm when performed on particular sound characteristics. The vertical lines extending from the boxes represent the range of scores, excluding outliers. Outliers are plotted as individual points beyond the whiskers. The plot provides a visual summary of the distribution of feature importance scores and allows for easy identification of important features that significantly outperform their corresponding shadow features.
Sustainability 15 07912 g008
Figure 9. The background characteristics of the survey respondents.
Sustainability 15 07912 g009
Figure 10. Visual and soundscape resultant opinion for each park based on a 3D matrix for landscape restorative potential.
Sustainability 15 07912 g010
Table 1. Scale used for perceived pleasantness, calm, and diversity.
Category and Fixed ValueCat. 5—
1 Point
Cat. 4—
2 Points
Cat. 3—
3 Points
Cat. 2—
4 Points
Cat. 1—
5 Points
Numerical range for assessment<0–43)<43–86)<86–129)<129–172)<172–215>
EvaluationAnnoyingSlightly irritatingAcceptablePartly pleasantPleasant
ChaoticSlightly chaoticModeratePartly calmCalm
MonotonousSlightly monotonousAveragePartly variedVaried
Table 2. Multidimensional scaling results for different combinations of questions in the survey.
Q-NumQuestionVar. 1Var. 2Var. 3Var. 4Var. 5
Q1Do you know this place?
Q2What theorem allows you to evaluate the view of this place? [Annoying (1)—Pleasant (5)]~11%~30%
Q3What theorem allows you to evaluate the view of this place? [Chaotic (1)—Calm (5)]
Q4What theorem allows you to evaluate the view of this place? [Monotonous (1)—Varied (5)]
Q5What sounds and in what scale did you manage to hear on the recording? [Talks] ~11%~12%
Q6What sounds and in what scale did you manage to hear on the recording? [Footsteps]
Q7What sounds and in what scale did you manage to hear on the recording? [Music]
Q8What sounds and in what scale did you manage to hear on the recording? [Children (playing)]
Q9What sounds and in what scale did you manage to hear on the recording? [Birds]
Q10What sounds and in what scale did you manage to hear on the recording? [Insect sounds]
Q11What sounds and in what scale did you manage to hear on the recording? [Water]
Q12What sounds and in what scale did you manage to hear on the recording? [Wind]
Q13What sounds and in what scale did you manage to hear on the recording? [Vehicles]
Q14What sounds and in what scale did you manage to hear on the recording? [Braking]
Q15What sounds and in what scale did you manage to hear on the recording? [Horns]
Q16What theorem allows you to evaluate the sounds of this place? [Annoying (1)—Pleasant (5)] ~32%
Q17What theorem allows you to evaluate the sounds of this place? [Chaotic (1)—Calm (5)]
Q18What theorem allows you to evaluate the sounds of this place? [Monotonous (1)—Varied (5)]
Q19Would you like to visit this place?
Q20Please enter your gender
Q21Which age group do you belong to?
Q22What is your education level?
~11%the percentage of variance explained by the first two dimensions
questions used in a given variant
questions not used in this variant
Table 3. The results of the MDS analysis carried out allowed decisions to be made on the way forward. Variants 2 and 5 were identified as, respectively, a potential target and a potential independent variable.
VariantsDim1Dim2Dim3Dim4Dim5Dims Needed for 100%Decision
Var. 16.3244.8223.9693.3393.21268noise
Var. 216.78113.36211.710.2368.58212potential target dependent
Var. 37.0994.9264.6663.8143.45156noise
Var. 46.6135.6714.5694.434.07544potential target independent
Var. 516.53215.97112.23311.2378.47612potential target dependent
Table 4. Importance of different types of sounds in overall soundscape perception with related intensity.
Type of SoundIntensityImporance (1-Most Important)
TalkingNo significant6
FootstepsDefinitely loud4
MusicModerately audible1
ChildrenCompletly inaudible5
BirdsQuiet3
VehiclesCompletly inaudible2
Disclaimer/Publisher’s Note: The statements, opinions and data contained in all publications are solely those of the individual author(s) and contributor(s) and not of MDPI and/or the editor(s). MDPI and/or the editor(s) disclaim responsibility for any injury to people or property resulting from any ideas, methods, instructions or products referred to in the content.

