

Effects of Sound Source Landscape in Urban Forest Park on Alleviating Mental Stress of Visitors: Evidence from Huolu Mountain Forest Park, Guangzhou

Abstract
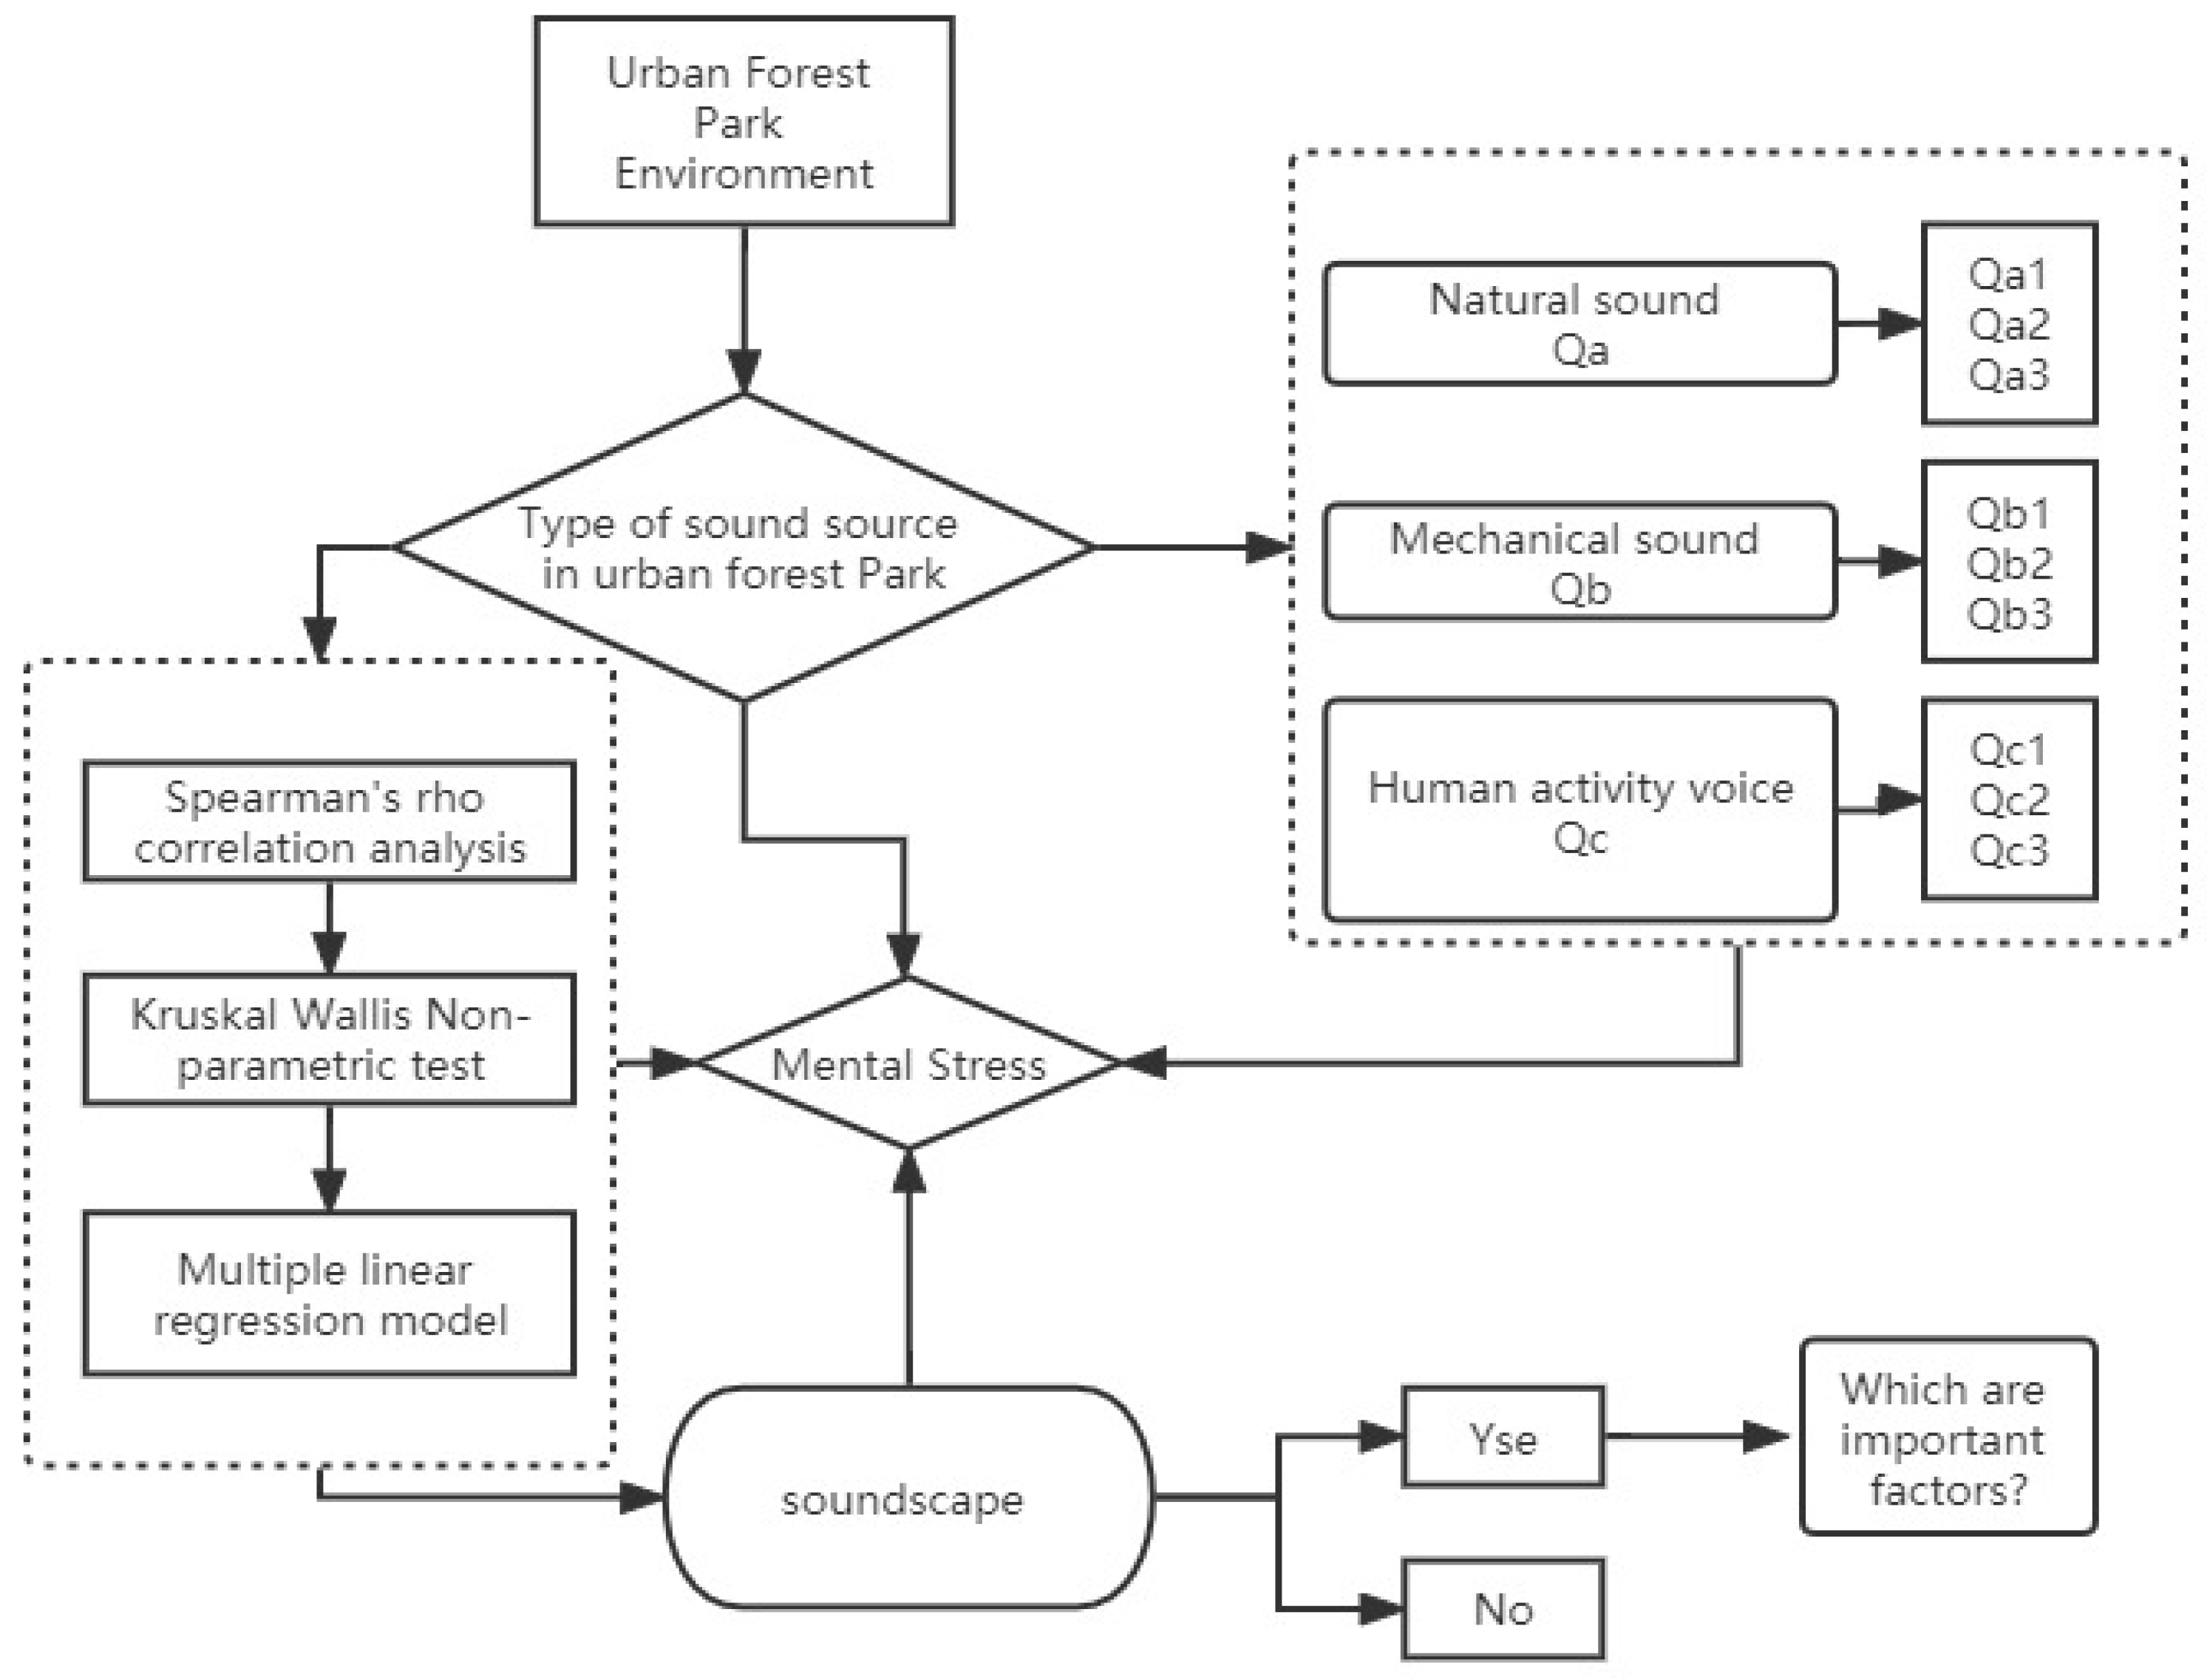
:1. Introduction
- (1)
- Will the soundscape of the forest park have an impact on relieving mental stress?
- (2)
- Which soundscapes are the important factors to relieve mental stress soundscape?
- (3)
- How can we use soundscape design strategy in forest park restoration?
2. Literature Review
2.1. Urban Forest Park Acoustic Environment Study
2.2. Theoretical Studies Related to Stress Relief
3. Materials and Methods
3.1. Study Areas
3.1.1. Site Survey of the Study Area
3.1.2. Types of Sound Sources in the Study Area
3.2. The Questionnaire Design
3.2.1. Basic User Information
3.2.2. Evaluation Scale
3.2.3. Assessment System Construction
3.3. Methods
3.3.1. Survey Methodology
3.3.2. Confidence Analysis
3.3.3. Validity Analysis
4. Results
4.1. Analysis of the Role of Soundscape Perception Recovery
4.1.1. Sound Source Restorative Perception Characterization
4.1.2. Analysis of the Effect of Soundscape Perception on Psychological Stress
4.1.3. Sound Source Perception Restorative Effects
4.2. Relationship between Demographic and Social Factors and the Restorative Evaluation of Sound Source Perceived Pressure
4.3. Key Factors in Stress Relief Effectiveness
5. Discussion
5.1. Forest Park Soundscape Will Have an Impact on Relieving Mental Stress
5.2. Natural Sound Is an Important Factor in Mental Stress Relief in the Sound Landscape
5.3. Forest Park Restoration Soundscape Design Strategy
6. Conclusions
- (1)
- The stress-relieving effect of urban parks is altered by the addition of soundscapes, which are an important part of the overall landscape, and the two are closely related. In the restorative results of this study, in terms of sound source types, the most restorative potential in urban forest parks is not only for natural sounds but also for anthropogenic sounds. The individual perception of soundscapes in urban forest parks is related to the fact that urban forest parks are less affected by traffic and that crowd activities are mostly ornamental and restful, and the positive contribution of birdsong, running water and breeze blowing leaves to the stress-reducing effect is significant and consistent with previous studies.
- (2)
- The positive impact of the Guangzhou Urban Forest Park on the restorative evaluation of emotionally stressful soundscapes is mainly reflected in the levels of pleasure and arousal, with significant differences between different types of soundscapes in terms of pleasure and arousal levels, and no meaningful differences in terms of control. Attractiveness has a greater cumulative contribution value relative to compatibility and coherence, and attractiveness is a more important trait for restorative soundscapes in this study compared to others.
- (3)
- In the relationship between the demographic, social and overall perception of the human soundscape, there were significant individual differences and correlations between respondents’ perceptions of specific sound sources and soundscapes, with the effects of age and educational background on the perceived restorability of sound sources being more pronounced. Non-acoustic elements such as gender, age, academic historical past and time length of visits have been additionally influenced. In terms of emotional stress relief, there is a vast distinction in the stress-relieving consequences of park soundscapes for men and women, and therefore research and the design of restorative soundscapes for stress responses between men and women should focus on gender differences.
7. Limitations and Future Work
Author Contributions
Funding
Institutional Review Board Statement
Informed Consent Statement
Data Availability Statement
Conflicts of Interest
References
- Xue, F.; Gou, Z.; Lau, S. The green open space development model and associated use behaviors in dense urban settings: Lessons from Hong Kong and Singapore. Urban Des. Int. 2017, 22, 287–302. [Google Scholar] [CrossRef]
- George, J.S.; Paul, S.K.; Dhawale, R. Multilayer network structure and city size: A cross-sectional analysis of global cities to detect the correlation between street and terrain. Environ. Plan. B Urban Anal. City Sci. 2022, 49, 1448–1463. [Google Scholar] [CrossRef]
- Ki, K.-S.; Gim, J.-Y.; Yoon, K.-S.; Lee, J.-Y. Effects of tropical night and light pollution on cicadas calls in urban areas. Korean J. Environ. Ecol. 2016, 30, 724–729. [Google Scholar] [CrossRef]
- Park, H.-K.; Han, M.-H. Relationship between living environment and soundscapes at the folk village of naganeupseong. J. Korean Soc. Living Environ. Syst. 2019, 26, 507–528. [Google Scholar] [CrossRef]
- Shao, Y.; Hao, Y.; Yin, Y.; Meng, Y.; Xue, Z. Improving soundscape comfort in urban green spaces based on aural-visual interaction attributes of landscape experience. Forests 2022, 13, 1262. [Google Scholar] [CrossRef]
- Hong, X.; Liu, J.; Wang, G.; Jiang, Y.; Wu, S.; Lan, S. Factors Influencing the Harmonious Degree of Soundscapes in Urban Forests: A Comparison of Broad-Leaved and Coniferous Forests. Urban For. Urban Green. 2019, 2, 18–25. [Google Scholar] [CrossRef]
- Reinoso Carvalho, F.; Wang, Q.; Van Ee, R.; Spence, C. The influence of soundscapes on the perception and evaluation of beers. Food Qual. Prefer. 2016, 52, 32–41. [Google Scholar] [CrossRef]
- Hao, Z.; Wang, C.; Sun, Z.; Bosch, C.; Pei, N. Soundscape mapping for spatial-temporal estimate on bird activities in urban forests. Urban For. Urban Green. 2020, 57, 126822. [Google Scholar] [CrossRef]
- Sudarsono, A.S.; Sarwono, J. The Development of a Web-Based Urban Soundscape Evaluation System. IOP Conf. Ser. Earth Environ. Sci. 2018, 158, 012052. [Google Scholar] [CrossRef]
- Pálsdóttir, A.M.; Stigsdotter, U.K.; Persson, D.; Thorpert, P.; Grahn, P. The qualities of natural environments that support the rehabilitation process of individuals with stress-related mental disorder in nature-based rehabilitation. Urban For. Urban Green. 2018, 29, 312–321. [Google Scholar] [CrossRef]
- Sachs, A.L.; Coringrato, E.; Sprague, N.; Turbyfill, A.; Tillema, S.; Litt, J. Rationale, feasibility, and acceptability of the Meeting in Nature Together (MINT) program: A novel nature-based social intervention for loneliness reduction with teen parents and their peers. Int. J. Environ. Res. Public Health 2022, 19, 11059. [Google Scholar] [CrossRef] [PubMed]
- Noise, I.T.S. ISO 12913-1:2014 Acoustics—Soundscape—Part 1: Definition and Conceptual Framework. Available online: https://www.iso.org/standard/52161.html (accessed on 30 August 2022).
- Maruf, G.W. Tackling anthropogenic underwater noise through the Convention on Biological Diversity: Progress and future development. Mar. Policy 2022, 146, 105293. [Google Scholar] [CrossRef]
- Aletta, F.; Kang, J.; Axelsson, Ö. Soundscape descriptors and a conceptual framework for developing predictive soundscape models. Landsc. Urban Plan. 2016, 149, 65–74. [Google Scholar] [CrossRef]
- Wang, P.; Zhang, C.; Xie, H.; Yang, W.; He, Y. Perception of National Park soundscape and its effects on visual aesthetics. Int. J. Environ. Res. Public Health 2022, 19, 5721. [Google Scholar] [CrossRef]
- Sun, M.; Dong, L. Impact of the classic Chinese garden soundscape with focus on physiological and psychological effects, tested through eye-tracking, and subjective evaluation. Front. Psychol. 2022, 13, 902630. [Google Scholar] [CrossRef] [PubMed]
- Marafa, L.M.; Wang, Z.; Tsang, F.K.H. Tranquillity in urban classical Chinese gardens and modern parks: The effect of natural and contextual features. Sustainability 2022, 14, 9555. [Google Scholar] [CrossRef]
- Li, R.; Ou, D.; Pan, S. An improved service quality measurement model for soundscape assessment in urban public open spaces. Indoor Built Environ. 2020, 30, 985–997. [Google Scholar] [CrossRef]
- Wang, P.; He, Y.; Yang, W.; Li, N.; Chen, J. Effects of Soundscapes on Human Physiology and Psychology in Qianjiangyuan National Park System Pilot Area in China. Forests 2022, 13, 1461. [Google Scholar] [CrossRef]
- Li, L.; Zhang, W.; Zhang, M.; Zhang, G.; Hu, X.; Liu, C.; Cao, X.; Liang, W. Applications of phytoremediation to treat reclaimed water in urban parks using aquatic macrophytes. Aquat. Ecol. 2022, 56, 75–88. [Google Scholar] [CrossRef]
- Zhao, Y.; Sheppard, S.; Sun, Z.; Hao, Z.; Jin, J.; Bai, Z.; Bian, Q.; Wang, C. Soundscapes of urban parks: An innovative approach for ecosystem monitoring and adaptive management. Urban For. Urban Green. 2022, 71, 127555. [Google Scholar] [CrossRef]
- Jo, H.I.; Jeon, J.Y. Urban soundscape categorization based on individual recognition, perception, and assessment of sound environments. Landsc. Urban Plan. 2021, 216, 104241. [Google Scholar] [CrossRef]
- Lu, Y.-H.; Zhang, J.; Zhang, H.; Xiao, X.; Liu, P.; Zhuang, M.; Hu, M. Flow in soundscape: The conceptualization of soundscape flow experience and its relationship with soundscape perception and behaviour intention in tourism destinations. Curr. Issues Tour. 2022, 25, 2090–2108. [Google Scholar] [CrossRef]
- Bian, Q.; Wang, C.; Sun, Z.; Yin, L.; Jiang, S.; Cheng, H.; Zhao, Y. Research on Spatiotemporal Variation Characteristics of Soundscapes in a Newly Established Suburban Forest Park. Urban For. Urban Green. 2022, 78, 127766. [Google Scholar] [CrossRef]
- Zhao, X.; Zhang, S.; Meng, Q.; Kang, J. Influence of contextual factors on soundscape in urban open spaces. Appl. Sci. 2018, 8, 2524. [Google Scholar] [CrossRef] [Green Version]
- Schneider, P.; Wengenroth, M. The neural basis of individual holistic and spectral sound perception. Contemp. Music Rev. 2009, 28, 315–328. [Google Scholar] [CrossRef]
- Coffey, E.B.J.; Colagrosso, E.M.G.; Lehmann, A.; Schönwiesner, M.; Zatorre, R.J. Individual differences in the frequency-following response: Relation to pitch perception. PLoS ONE 2016, 11, e0152374. [Google Scholar] [CrossRef]
- Erfanian, M.; Mitchell, A.; Aletta, F.; Kang, J. Psychological well-being and demographic factors can mediate soundscape pleasantness and eventfulness: A large sample study. J. Environ. Psychol. 2021, 77, 101660. [Google Scholar] [CrossRef]
- Xiao, J.; Hilton, A. An investigation of soundscape factors influencing perceptions of square dancing in urban streets: A case study in a county level city in China. Int. J. Environ. Res. Public Health 2019, 16, 840. [Google Scholar] [CrossRef] [Green Version]
- Tervo, S. Preferences of critical listening environments among sound engineers. J. Audio Eng. Soc. 2014, 62, 300–314. [Google Scholar] [CrossRef]
- Hedblom, M.; Gunnarsson, B.; Iravani, B.; Knez, I.; Schaefer, M.; Thorsson, P.; Lundström, J.N. Reduction of physiological stress by urban green space in a multisensory virtual experiment. Sci. Rep. 2019, 9, 10113. [Google Scholar] [CrossRef]
- Walker, D.C.; White, E.K.; Srinivasan, V.J. A Meta-Analysis of the Relationships between Body Checking, Body Image Avoidance, Body Image Dissatisfaction, Mood, and Disordered Eating. Int. J. Eat. Disord. 2018, 51, 745–770. [Google Scholar] [CrossRef]
- Stavitskyi, O.; National University of Water Management and Nature Management. Demographic Differences to Attitude for the Construction of Close Relations with Disabilities. Psychol. Prospect. J. 2018, 32, 261–271. [Google Scholar] [CrossRef] [Green Version]
- De Silva, V.R.S.; Ranjith, P.G.; Perera, M.S.A.; Wu, B. Artificial Fracture Stimulation of Rock Subjected to Large Isotropic Confining Stresses in Saline Environments: Application in Deep-Sea Gas Hydrate Recovery. Nat. Resour. Res. 2019, 28, 563–583. [Google Scholar] [CrossRef]
- Akbay, E.; Akinci, S.; Coner, A.; Adar, A. Association of Morning Surge and Postexercise Heart Rate and Blood Pressure Recovery. High Blood Press. Cardiovasc. Prev. 2022, 29, 253–261. [Google Scholar] [CrossRef] [PubMed]
- Zander, M.; Lewsey, M.G.; Clark, N.M.; Yin, L.; Bartlett, A.; Guzmán, J.P.S.; Hann, E.; Langford, A.E.; Jow, B.; Wise, A.; et al. Publisher Correction: Integrated Multi-Omics Framework of the Plant Response to Jasmonic Acid. Nat. Plants 2020, 6, 1065. [Google Scholar] [CrossRef]
- Lu, F.; Esbach, M. Philip, A. Loring: Finding Our Niche: Toward a Restorative Human Ecology. Hum. Ecol. 2021, 49, 505–507. [Google Scholar] [CrossRef]
- Hartig, T.; Staats, H. Guest Editors’ Introduction: Restorative Environments. J. Environ. Psychol. 2003, 23, 103–107. [Google Scholar] [CrossRef]
- Nordh, H.; Evensen, K.H.; Skår, M. A Peaceful Place in the City—A Qualitative Study of Restorative Components of the Cemetery. Landsc. Urban Plan. 2017, 167, 108–117. [Google Scholar] [CrossRef]
- Twedt, E.; Rainey, R.M.; Proffitt, D.R. Beyond Nature: The Roles of Visual Appeal and Individual Differences in Perceived Restorative Potential. J. Environ. Psychol. 2019, 65, 101322. [Google Scholar] [CrossRef]
- Payne, S.R. The Production of a Perceived Restorativeness Soundscape Scale. Appl. Acoust. 2013, 74, 255–263. [Google Scholar] [CrossRef]
- Guo, X.; Liu, J.; Albert, C.; Hong, X.-C. Audio-Visual Interaction and Visitor Characteristics Affect Perceived Soundscape Restorativeness: Case Study in Five Parks in China. Urban For. Urban Green. 2022, 77, 127738. [Google Scholar] [CrossRef]
- Guo, Y.; Geng, X.; Chen, D.; Chen, Y. Sustainable Building Design Development Knowledge Map: A Visual Analysis Using CiteSpace. Buildings 2022, 12, 969. [Google Scholar] [CrossRef]
- Seeland, K.; Dübendorfer, S.; Hansmann, R. Making Friends in Zurich’s Urban Forests and Parks: The Role of Public Green Space for Social Inclusion of Youths from Different Cultures. For. Policy Econ. 2009, 11, 10–17. [Google Scholar] [CrossRef]
- Kang, J.; Ma, H.; Xie, H.; Zhang, Y.; Li, Z. Research Progress on the Acoustic Environments of Healthy Buildings. Ko Hsueh Tung Pao 2020, 65, 288–299. [Google Scholar] [CrossRef] [Green Version]
- Joshi, S.; Stavrianakis, K.; Das, S. Substituting Restorative Benefits of Being Outdoors through Interactive Augmented Spatial Soundscapes. In The 22nd International ACM SIGACCESS Conference on Computers and Accessibility; ACM: New York, NY, USA, 2020. [Google Scholar]
- Ou, D.; Mak, C.M.; Pan, S. A Method for Assessing Soundscape in Urban Parks Based on the Service Quality Measurement Models. Appl. Acoust. 2017, 127, 184–193. [Google Scholar] [CrossRef]
- Brown, A.L.; Kang, J.; Gjestland, T. Towards Standardization in Soundscape Preference Assessment. Appl. Acoust. 2011, 72, 387–392. [Google Scholar] [CrossRef]
- Riedel, N.; Köckler, H.; Scheiner, J.; van Kamp, I.; Erbel, R.; Loerbroks, A.; Claßen, T.; Bolte, G. Urban Road Traffic Noise and Noise Annoyance-a Study on Perceived Noise Control and Its Value among the Elderly. Eur. J. Public Health 2019, 29, 377–379. [Google Scholar] [CrossRef]
- Bestgen, A.-K.; Schulze, P.; Kuchinke, L. Odor Emotional Quality Predicts Odor Identification. Chem. Senses 2015, 40, 517–523. [Google Scholar] [CrossRef] [Green Version]
- Huang, S.; Qi, J.; Li, W.; Dong, J.; van den Bosch, C.K. The Contribution to Stress Recovery and Attention Restoration Potential of Exposure to Urban Green Spaces in Low-Density Residential Areas. Int. J. Environ. Res. Public Health 2021, 18, 8713. [Google Scholar] [CrossRef]
- Yu, B.; Funk, M.; Hu, J.; Feijs, L. Unwind: A Musical Biofeedback for Relaxation Assistance. Behav. Inf. Technol. 2018, 37, 800–814. [Google Scholar] [CrossRef]
- Jo, H.; Song, C.; Ikei, H.; Enomoto, S.; Kobayashi, H.; Miyazaki, Y. Physiological and Psychological Effects of Forest and Urban Sounds Using High-Resolution Sound Sources. Int. J. Environ. Res. Public Health 2019, 16, 2649. [Google Scholar] [CrossRef] [PubMed] [Green Version]
- Medvedev, O.; Shepherd, D.; Hautus, M.J. The Restorative Potential of Soundscapes: A Physiological Investigation. Appl. Acoust. 2015, 96, 20–26. [Google Scholar] [CrossRef]
- Fisher, J.C.; Irvine, K.N.; Bicknell, J.E.; Hayes, W.M.; Fernandes, D.; Mistry, J.; Davies, Z.G. Perceived Biodiversity, Sound, Naturalness and Safety Enhance the Restorative Quality and Wellbeing Benefits of Green and Blue Space in a Neotropical City. Sci. Total Environ. 2021, 755, 143095. [Google Scholar] [CrossRef] [PubMed]
- Mancini, L.; Paganoni, A.M. Marked Point Process Models for the Admissions of Heart Failure Patients. Stat. Anal. Data Min. 2019, 12, 125–135. [Google Scholar] [CrossRef]
- Ferrara, F.; Gargani, L.; Armstrong, W.F.; Voilliot, D.; Vriz, O.; Naeije, R.; Bossone, E. The Right Heart International Network (RIGHT-NET): Rationale, Objectives, Methodology, and Clinical Implications. Heart Fail. Clin. 2018, 14, 443–465. [Google Scholar] [CrossRef]
- Chen, S.; Yokoyama, Y. Restorative Effect of Green Design Office: Experimental Verification on the View of Office in the Virtual Environment. J. Archit. Plan. Trans. AIJ 2021, 86, 2257–2267. [Google Scholar] [CrossRef]
- Liu, J.; Xiong, Y.; Wang, Y.; Luo, T. Soundscape Effects on Visiting Experience in City Park: A Case Study in Fuzhou, China. Urban For. Urban Green. 2018, 31, 38–47. [Google Scholar] [CrossRef]
- Van Hedger, S.C.; Nusbaum, H.C.; Clohisy, L.; Jaeggi, S.M.; Buschkuehl, M.; Berman, M.G. Of Cricket Chirps and Car Horns: The Effect of Nature Sounds on Cognitive Performance. Psychon. Bull. Rev. 2019, 26, 522–530. [Google Scholar] [CrossRef] [Green Version]
- Sona, B.; Dietl, E.; Steidle, A. Recovery in Sensory-Enriched Break Environments: Integrating Vision, Sound and Scent into Simulated Indoor and Outdoor Environments. Ergonomics 2019, 62, 521–536. [Google Scholar] [CrossRef] [Green Version]
- Ratcliffe, E.; Korpela, K.M. Time- and Self-Related Memories Predict Restorative Perceptions of Favorite Places Via Place Identity. Environ. Behav. 2017, 50, 690–720. [Google Scholar] [CrossRef]
- Ratcliffe, E.; Gatersleben, B.; Sowden, P.T. Associations with Bird Sounds: How Do They Relate to Perceived Restorative Potential? J. Environ. Psychol. 2016, 47, 136–144. [Google Scholar] [CrossRef]
- Jahani, A.; Kalantary, S.; Alitavoli, A. An Application of Artificial Intelligence Techniques in Prediction of Birds Soundscape Impact on Tourists’ Mental Restoration in Natural Urban Areas. Urban For. Urban Green. 2021, 61, 127088. [Google Scholar] [CrossRef]
- Jo, H.I.; Jeon, J.Y. Effect of the Appropriateness of Sound Environment on Urban Soundscape Assessment. Build. Environ. 2020, 179, 106975. [Google Scholar] [CrossRef]
- Lugten, M.; Karacaoglu, M.; White, K.; Kang, J.; Steemers, K. Improving the soundscape quality of urban areas exposed to aircraft noise by adding moving water and vegetation. J. Acoust. Soc. Am. 2018, 144, 2906–2917. [Google Scholar] [CrossRef] [Green Version]
- Kogan, P.; Arenas, J.P.; Bermejo, F.; Hinalaf, M.; Turra, B. A Green Soundscape Index (GSI): The Potential of Assessing the Perceived Balance between Natural Sound and Traffic Noise. Sci. Total Environ. 2018, 642, 463–472. [Google Scholar] [CrossRef]
- Kou, L.; Kwan, M.-P.; Chai, Y. The Effects of Activity-Related Contexts on Individual Sound Exposures: A Time–Geographic Approach to Soundscape Studies. Environ. Plan. B Urban Anal. City Sci. 2021, 48, 2073–2092. [Google Scholar] [CrossRef]
- Hong, J.Y.; Lam, B.; Ong, Z.-T.; Ooi, K.; Gan, W.-S.; Kang, J.; Yeong, S.; Lee, I.; Tan, S.-T. A Mixed-Reality Approach to Soundscape Assessment of Outdoor Urban Environments Augmented with Natural Sounds. Build. Environ. 2021, 194, 107688. [Google Scholar] [CrossRef]


| Sampling Point Classification | Figure Code | Sampling Point | Environmental Characteristics | |
|---|---|---|---|---|
| Park sound source environment E | Waterfront landscape area Ea | Ea1 | According to the moon lake view scenic spot | Rich water, big lawn, camping |
| Ea2 | Longdong Reservoir fishing area | The water is clear and clean | ||
| Ea3 | Colorful jade tan edge playing water area | Stream leisure, water edge entertainment | ||
| Plant landscape area Eb | Eb4 | Zhuyuan View Scenic Spot | Bamboo forest plants are dense. | |
| Eb5 | Lotus pond side | The lotus is open. | ||
| Eb6 | Under the youth forest streetlamp | The dense trees and the level of the plant landscape | ||
| Cultural landscape area Ec | Ec7 | White frame top stone steps road | The main peak of the furnace mountain, round mountain, gentle slope, natural stone slide | |
| Ec8 | Zhutou stone viewing platform | Supported by two small boulders, round rolling stone, big stones everywhere, overlooking the city view, stone steps road | ||
| Ec9 | Jizhen Stone breeze pavilion | The rocks are composed of black mica granite, ladder path, ancient style charm |
| Sound Source Type 2 | Sound Source Name 3 | |
|---|---|---|
| Q: Furnve Mountain Forest Park | Qa: Natural sound | Qa1: The sound of the leaves |
| Qa2: The sound of water flow | ||
| Qa3: bird song | ||
| Qb: Artificial equipment sound | Qb1: traffic sound | |
| Qb2: Broadcast music sound | ||
| Qb3: construction site construction sound | ||
| Qc: Human activity voice | Qc1: talk | |
| Qc2: footsteps | ||
| Qc3: sweeping the floor |
| Level 1 Indicator (Target Layer) | Secondary Index (Standard Layer) | Specific Description (Evaluation Factor Layer) |
|---|---|---|
| V1: Evaluation of sound source perception recovery | V1a: compatibility | Unaccustomed, uncomfortable, incompatible-customary, adaptive, compatible |
| V1b: Extent | Diligent, messy, uncoordinated-consistent, harmonious and coordinated | |
| V1c: Fascination | Annoying, repellent-fascinated, engaging | |
| V2: Emotional stress relief | V2a: Pleasure | Nasty, bad, sad, upset (negative mood) -Like, good, happy, happy (positive mood) |
| V2b: Arousal | Calm, relaxed, sleepy-tense, exciting, exciting | |
| V2c: Dominance | Feel weak to control the voice-feel strong and able to control the voice |
| Cronbach’s α | Cronbach’s α Based on Standardized Items | Number of Terms | Number of Samples |
|---|---|---|---|
| 0.967 | 0.969 | 33 | 266 |
| KMO Price | 0.968 | |
|---|---|---|
| Bartlett sphericity test | Approximate chi square | 14,675.780 |
| df | 703.000 | |
| p | 0.000 *** | |
| Sound Source Type Q/Soundscape Perception V | Natural Sound Qa | Artificial Equipment Sound Qb | Human Activity Sound Qc | ||||||
|---|---|---|---|---|---|---|---|---|---|
| Qa 1 | Qa 2 | Qa 3 | Qb 1 | Qb 2 | Qb 3 | Qc 1 | Qc 2 | Qc 3 | |
| Compatibility V1a | 6.96 * (2.11) | 6.37 * (2.73) | 6.67 * (2.25) | 3.14 * (2.54) | 3.33 * (2.32) | 2.85 * (2.46) | 5.14 * (2.09) | 4.82 * (2.03) | 5.26 * (2.07) |
| Extent V1b | 6.38 * (2.73) | 6.41 * (2.73) | 6.66 * (2.33) | 3.01 * (2.40) | 3.27 * (2.45) | 2.75 * (2.33) | 5.27 * (2.15) | 4.84 * (1.98) | 5.32 * (2.13) |
| Fascination V1c | 6.38 * (2.80) | 6.71 * (2.28) | 6.70 * (2.36) | 3.05 * (2.54) | 3.33 * (2.41) | 2.76 * (2.44) | 5.23 * (2.17) | 4.90 * (1.98) | 5.28 * (2.18) |
| F | 1.096 | 0.804 | 1.571 | 6.954 | 7.211 | 10.775 | 9.677 | 3.647 | 2.433 |
| P | 0.296 | 0.371 | 0.211 | 0.009 *** | 0.008 *** | 0.001 *** | 0.002 *** | 0.057 * | 0.12 |
| Pleasure * | Arousal | Dominance | ||||
|---|---|---|---|---|---|---|
| Average | SD | Average | SD | Average | SD | |
| Natural sound | 6.823 * | 2.244 | 3.173 * | 2.234 | 4.053 * | 1.899 |
| mechanic sound | 2.756 * | 2.441 | 6.959 * | 2.109 | 4.838 * | 1.981 |
| Man-made sound | 4.898 * | 1.976 | 5.316 * | 2.128 | 4.898 * | 1.976 |
| F | 1.870 | 4.595 | 9.900 | |||
| P | 0.000 *** | 0.002 ** | 0.066 * | |||
| Project | All the Sound | Natural Sound | Artificial Equipment Sound | Human Activity Sound | ||||||||
|---|---|---|---|---|---|---|---|---|---|---|---|---|
| Considerations 1 18.39% | Considerations 2 20.53% | Considerations 3 22.01% | Considerations 1 30.33% | Considerations 2 31.60% | Considerations 3 32.65% | Considerations 1 30.93% | Considerations 2 30.93% | Considerations 3 31.20% | Considerations 1 30.44% | Considerations 2 30.36% | Considerations 3 30.53% | |
| 1 | 0.864 | 0.865 | 0.878 | 0.937 | 0.930 | 0.919 | ||||||
| 2 | 0.871 | 0.885 | 0.844 | 0.948 | 0.933 | 0.906 | ||||||
| 3 | 0.843 | 0.876 | 0.864 | 0.937 | 0.925 | 0.921 | ||||||
| 4 | 0.224 | 0.262 | 0.272 | 0.954 | 0.947 | 0.910 | ||||||
| 5 | 0.334 | 0.381 | 0.334 | 0.954 | 0.936 | 0.908 | ||||||
| 6 | 0.229 | 0.247 | 0.237 | 0.936 | 0.926 | 0.909 | ||||||
| 7 | 0.888 | 0.884 | 0.879 | 0.928 | 0.947 | 0.912 | ||||||
| 8 | 0.880 | 0.879 | 0.877 | 0.954 | 0.942 | 0.911 | ||||||
| 9 | 0.899 | 0.888 | 0.908 | 0.954 | 0.903 | 0.935 | ||||||
| Health Benefit Research | Gender | Age | Educational Background | Weekly Tour Frequency | Access Time Period | |
|---|---|---|---|---|---|---|
| Sound source perception recovery | Compatibility | 0.394 | 0.000 *** | 0.000 *** (0.000 ***) | 0.004 *** (0.001 ***) | 0.002 *** (0.005 ***) |
| Extent | 0.087 * | 0.026 ** | 0.992 | 0.259 | 0.554 | |
| Fascination | 0.019 ** (0.018 **) | 0.386 | 0.834 | 0.523 | 0.219 (0.016 **) | |
| Emotional stress recovery | Pleasure | 0.102 | 0.191 | 0.776 | 0.442 | 0.260 (0.018 **) |
| Arousal | 0.001 *** (0.001 ***) | 0.063 * | 0.001 *** (0.000 ***) | 0.004 *** (0.000 ***) | 0.000 *** (0.000 ***) | |
| Dominance | 0.270 | 0.000 *** | 0.000 *** (0.001 ***) | 0.011 ** (0.006 ***) | 0.005 *** (0.016 **) | |
| Results of the Linear Regression Analysis n = 266 | ||||||||
|---|---|---|---|---|---|---|---|---|
| Dependent Variable | Argument | Non-Standardized Coefficients | Standardization Coefficient | t | p | VIF | F | |
| B | Standard Error | Beta | ||||||
| compatibility V1a (R2 = 0.809) | constant | 0.752 | 0.227 | 0 | 3.317 | 0.001 *** | - | F = 275.977, p = 0.000 *** |
| Qa3 twitter | 0.297 | 0.061 | 0.298 | 4.864 | 0.000 *** | 5.134 | ||
| Qc1 People’s voice | 0.244 | 0.046 | 0.227 | 5.33 | 0.000 *** | 2.469 | ||
| Qa2 The sound of water | 0.244 | 0.046 | 0.227 | 5.33 | 0.000 *** | 2.469 | ||
| Qa3 The breeze blows through the leaves | 0.188 | 0.053 | 0.229 | 3.583 | 0.000 *** | 5.571 | ||
| extent V2b (R2 = 0.797) | constant | 0.529 | 0.271 | 0 | 1.952 | 0.052 * | - | F = 255.534, p = 0.000 *** |
| Qa3 twitter | 0.411 | 0.062 | 0.422 | 6.594 | 0.000 *** | 5.249 | ||
| Qc3 The floor sound | 0.254 | 0.046 | 0.238 | 5.471 | 0.000 *** | 2.425 | ||
| Qa2 The sound of water | 0.246 | 0.053 | 0.296 | 4.684 | 0.000 *** | 5.125 | ||
| Q4 Browse frequency | 0.204 | 0.066 | 0.087 | 3.088 | 0.002 *** | 1.019 | ||
| Fascinate V3c (R2 = 0.807) | constant | 0.957 | 0.323 | 0 | 2.968 | 0.003 *** | - | F = 180.002, p = 0.000 *** |
| Qa3 twitter | 0.337 | 0.06 | 0.351 | 5.619 | 0.000 *** | 5.236 | ||
| Qc1 People’s voice | 0.26 | 0.043 | 0.249 | 6.002 | 0.000 *** | 2.306 | ||
| Qa2 The sound of water | 0.198 | 0.051 | 0.245 | 3.854 | 0.000 *** | 5.422 | ||
| Qa3 The breeze blows through the leaves | 0.138 | 0.067 | 0.059 | 2.054 | 0.041 ** | 1.107 | ||
| Q4 browse frequency | −0.077 | 0.036 | −0.06 | −2.135 | 0.034 ** | 1.074 | ||
| Q5 access time period | 0.122 | 0.06 | 0.123 | 2.025 | 0.044 ** | 4.96 | ||
| Pleasure V2a (R2 = 0.833) | constant | 0.226 | 0.219 | 0 | 1.032 | 0.303 | - | F = 166.225, p = 0.000 *** |
| Qa3 twitter | 0.145 | 0.064 | 0.145 | 2.249 | 0.025 ** | 6.628 | ||
| Qc3 The floor sound | 0.148 | 0.047 | 0.14 | 3.145 | 0.002 *** | 3.16 | ||
| Qa1 The sound of water | 0.198 | 0.051 | 0.245 | 3.854 | 0.000 *** | 5.422 | ||
| Qc2 People’s voice | 0.139 | 0.05 | 0.129 | 2.782 | 0.006 *** | 3.429 | ||
| Qa2 The breeze blows through the leaves | −0.077 | 0.036 | −0.06 | −2.135 | 0.034 ** | 1.074 | ||
| Arousal V2b (R2 = 0.852) | constant | 0.433 | 0.093 | 0 | 4.643 | 0.000 *** | - | F = 254.511, p = 0.000 *** |
| Qb1 The sound of vehicles walking through | 0.166 | 0.059 | 0.189 | 2.803 | 0.005 *** | 8.144 | ||
| Qb3 Site construction sound | 0.171 | 0.064 | 0.179 | 2.664 | 0.008 *** | 8.043 | ||
| Qb2 Radio music | 0.131 | 0.058 | 0.144 | 2.277 | 0.024 ** | 7.123 | ||
| Dominance V2c (R2 = 0.786) | constant | 0.175 | 0.227 | 0 | 0.769 | 0.443 | - | F = 109.171, p = 0.000 *** |
| Qb1 The sound of vehicles walking through | 0.192 | 0.053 | 0.248 | 3.604 | 0.000 *** | 5.853 | ||
| Qb3 Site construction sound | 0.122 | 0.059 | 0.127 | 2.076 | 0.039 ** | 4.661 | ||
| Qb2 Radio music | 0.17 | 0.045 | 0.22 | 3.748 | 0.000 *** | 4.265 | ||
| Qc2 footstep | 0.138 | 0.05 | 0.155 | 2.783 | 0.006 *** | 3.826 | ||
| Qc3 The floor sound | 0.154 | 0.053 | 0.207 | 2.915 | 0.004 *** | 6.23 | ||
| Qa1 The sound of water | 0.142 | 0.045 | 0.21 | 3.148 | 0.002 *** | 5.507 | ||
| Qa2 The breeze blows through the leaves | −0.134 | 0.049 | −0.161 | −2.749 | 0.006 *** | 4.257 | ||
| Qc2 People’s voice | 0.119 | 0.05 | 0.131 | 2.383 | 0.018 ** | 3.722 | ||
| Q3 educational background | 0.142 | 0.056 | 0.075 | 2.527 | 0.012 ** | 1.103 | ||
Publisher’s Note: MDPI stays neutral with regard to jurisdictional claims in published maps and institutional affiliations. |
© 2022 by the authors. Licensee MDPI, Basel, Switzerland. This article is an open access article distributed under the terms and conditions of the Creative Commons Attribution (CC BY) license (https://creativecommons.org/licenses/by/4.0/).
Share and Cite
Guo, Y.; Jiang, X.; Zhang, L.; Zhang, H.; Jiang, Z. Effects of Sound Source Landscape in Urban Forest Park on Alleviating Mental Stress of Visitors: Evidence from Huolu Mountain Forest Park, Guangzhou. Sustainability 2022, 14, 15125. https://doi.org/10.3390/su142215125
Guo Y, Jiang X, Zhang L, Zhang H, Jiang Z. Effects of Sound Source Landscape in Urban Forest Park on Alleviating Mental Stress of Visitors: Evidence from Huolu Mountain Forest Park, Guangzhou. Sustainability. 2022; 14(22):15125. https://doi.org/10.3390/su142215125
Chicago/Turabian StyleGuo, Yanlong, Xuemei Jiang, Linfu Zhang, Han Zhang, and Zuoqing Jiang. 2022. "Effects of Sound Source Landscape in Urban Forest Park on Alleviating Mental Stress of Visitors: Evidence from Huolu Mountain Forest Park, Guangzhou" Sustainability 14, no. 22: 15125. https://doi.org/10.3390/su142215125