Article

Experimental Study on the Seismic Performance of a Steel Slag CFDST T-Joint

1
School of Civil Engineering, Sanming University, Sanming 365004, China
2
Key Laboratory of Engineering Material & Structure Reinforcement in Fujian Province College, Sanming University, Sanming 365004, China
3
College of Civil Engineering, Tongji University, Shanghai 200092, China
*
Author to whom correspondence should be addressed.
Sustainability 2023, 15(10), 7991; https://doi.org/10.3390/su15107991
Submission received: 22 March 2023 / Revised: 30 April 2023 / Accepted: 10 May 2023 / Published: 13 May 2023

Abstract

:
In this paper, a kind of steel slag, concrete-filled double-skin steel tube (CFDST) T-joint is proposed to promote sustainable structural development. In order to examine the seismic performance of the steel slag CFDST T-joint, a series of hysteresis experiments were carried out on 4 CFDST T-joints with the main pipe under axial compression load and the brace pipe subjected to cyclic axial loading. The seismic performance of the CFDST T-joint was experimentally investigated in terms of the failure mode, load–displacement hysteresis relationship, stiffness degradation, energy dissipation and ductility. The effects of the hollow ratio and the steel slag concrete of the CFDST main pipe on the seismic performance of CFDST T-joint specimens were compared and analyzed. The experimental results show that the failure modes of the CFDST T-joint mainly included two kinds of failure, with those being main pipe fracture and joint area compression-bending failure. The seismic performance of the joints could be improved with a 12% ultimate bearing capacity and 54% ultimate deformation capacity with the hollow ratio of the CFDST main pipe increasing from 0 to 0.5. The seismic performance of the joints could be improved with a 54% ultimate deformation capacity by filling the steel slag concrete with a 0.5 hollow ratio.

1. Introduction

Steel slag is a kind of industrial waste with more than 10% being produced in steel production [1,2]. According to incomplete statistics, the amount of steel slag is estimated to be more than 180 million tons globally; however, in China, the utilization rate is only 22% [3]. Steel slag causes environmental pollution through disposal in landfills without proper processing; moreover, it has resulted in a considerable economic burden for steel companies [4]. Therefore, it is urgent for increased recycling practices and comprehensive utilization of steel slag to achieve sustainable development of the steel industry. With the development of steel slag as a construction material, scholars have conducted many studies on the application of steel slag in concrete [5,6,7]. The results show that the use of steel slag powder in concrete could improve the workability and viscosity of concrete, while also reducing the self-shrinkage of the concrete. Therefore, steel slag powder can be used to configure self-compacting concrete [8]. In order to compensate for the void effect of the concrete-filled steel tube, the application of steel slag powder in the concrete-filled steel tube structure needs to be discussed.
The CFDST has the advantages of good mechanical performance and convenient construction performance. In addition, it is widely used in high-rise buildings, bridges and other practical projects [9,10,11,12]. Due to the complicated structure area of the CFDST joint, many studies have focused on experimental research on the mechanical behavior of the CFDST joint. Wang (2017) conducted an experimental study on the T-shaped joints of high-strength CFDST. The results showed that under the tension condition of the branch pipe, the final failure mode of the member was the cracking of the outer steel pipe and the separation of the steel and concrete at the joints; the initial position of the fracture was mostly at the crown point [13]. Gao (2018) conducted experimental research and a finite element analysis on CFDST K-shaped joints. The results showed that when the hollow ratio is 0.529, the seismic performance of K-shaped joints is the best [14]. Ma (2018) studied the static properties of CFDST T-joints under horizontal axial compression and vertical axial compression. The results showed that there were mainly four failure modes of CFDST T-joints [15]. Shi (2019) conducted experimental and theoretical investigations on the behavior and mechanism of circular CFDST T-joints. The results show that the failure mode of CFDSTs is similar to that of concrete-filled steel tubular T-joints, and the failure mode of the member is mainly controlled by the outside diameter ratio of the abdominal chord [16]. More attention to the static performance of CFDST T-joints in the literature is necessary [17]. In the case of an earthquake, the CFDST T-joints are the most integral feature as the failure of the joint will lead to total structural collapse. It can be seen that it is necessary to study the failure mechanism and seismic performance of the joint experiencing an earthquake.
Compared with uniaxial compressive strength, the triaxial compressive strength of the steel slag concrete was greater, and the influence of the stress ratio on the triaxial compressive strength was obvious. At present, some researchers have carried out experiments and theoretical studies on the mechanical behavior of steel slag CFST columns. Fang et al. (2020) studied the axial compression performance of steel slag concrete columns with circular steel tubes, and the analysis results showed that, compared with ordinary concrete-filled steel tubes, the restraint effect of steel slag concrete columns with circular steel tubes was more obvious. However, the whole process of loading was similar when they were subjected to axial pressure [18]. Shen (2021) studied the axial compression performance of steel tubular slag concrete short columns with elliptical sections, and the results showed that the failure modes of steel tubular slag concrete short columns with elliptical sections mainly included local buckling of the steel tube, local crushing and shear failure of the concrete. As the replacement rate of the steel slag increased, the axial compression strength and stiffness of the components increased but the ductility decreased [19]. Yu et al. (2020; 2022) studied the interfacial bonding and sliding behavior of steel tubular slag concrete and analyzed the influence of parameters such as diameter to thickness ratio and expansion rate on the bonding and sliding behavior. The results showed that shear failure at the bonding interface was the main failure mode [20,21]. At present, there are few studies on the application of steel slag concrete-filled double-skin steel tubes. There is even less research on the seismic performance of steel slag CFDST joints.
This paper aimed to make full use of the advantages of steel tube and steel slag concrete, promote the reuse of solid waste and reduce project costs. In this paper, a kind of steel slag concrete-filled double-skin steel tube (CFDST) main pipe and circular hollow section (CHS) brace pipe composite T-joint was proposed and 4 specimens of CFDST T-joints were made to investigate their seismic behavior.

2. Experimental Program

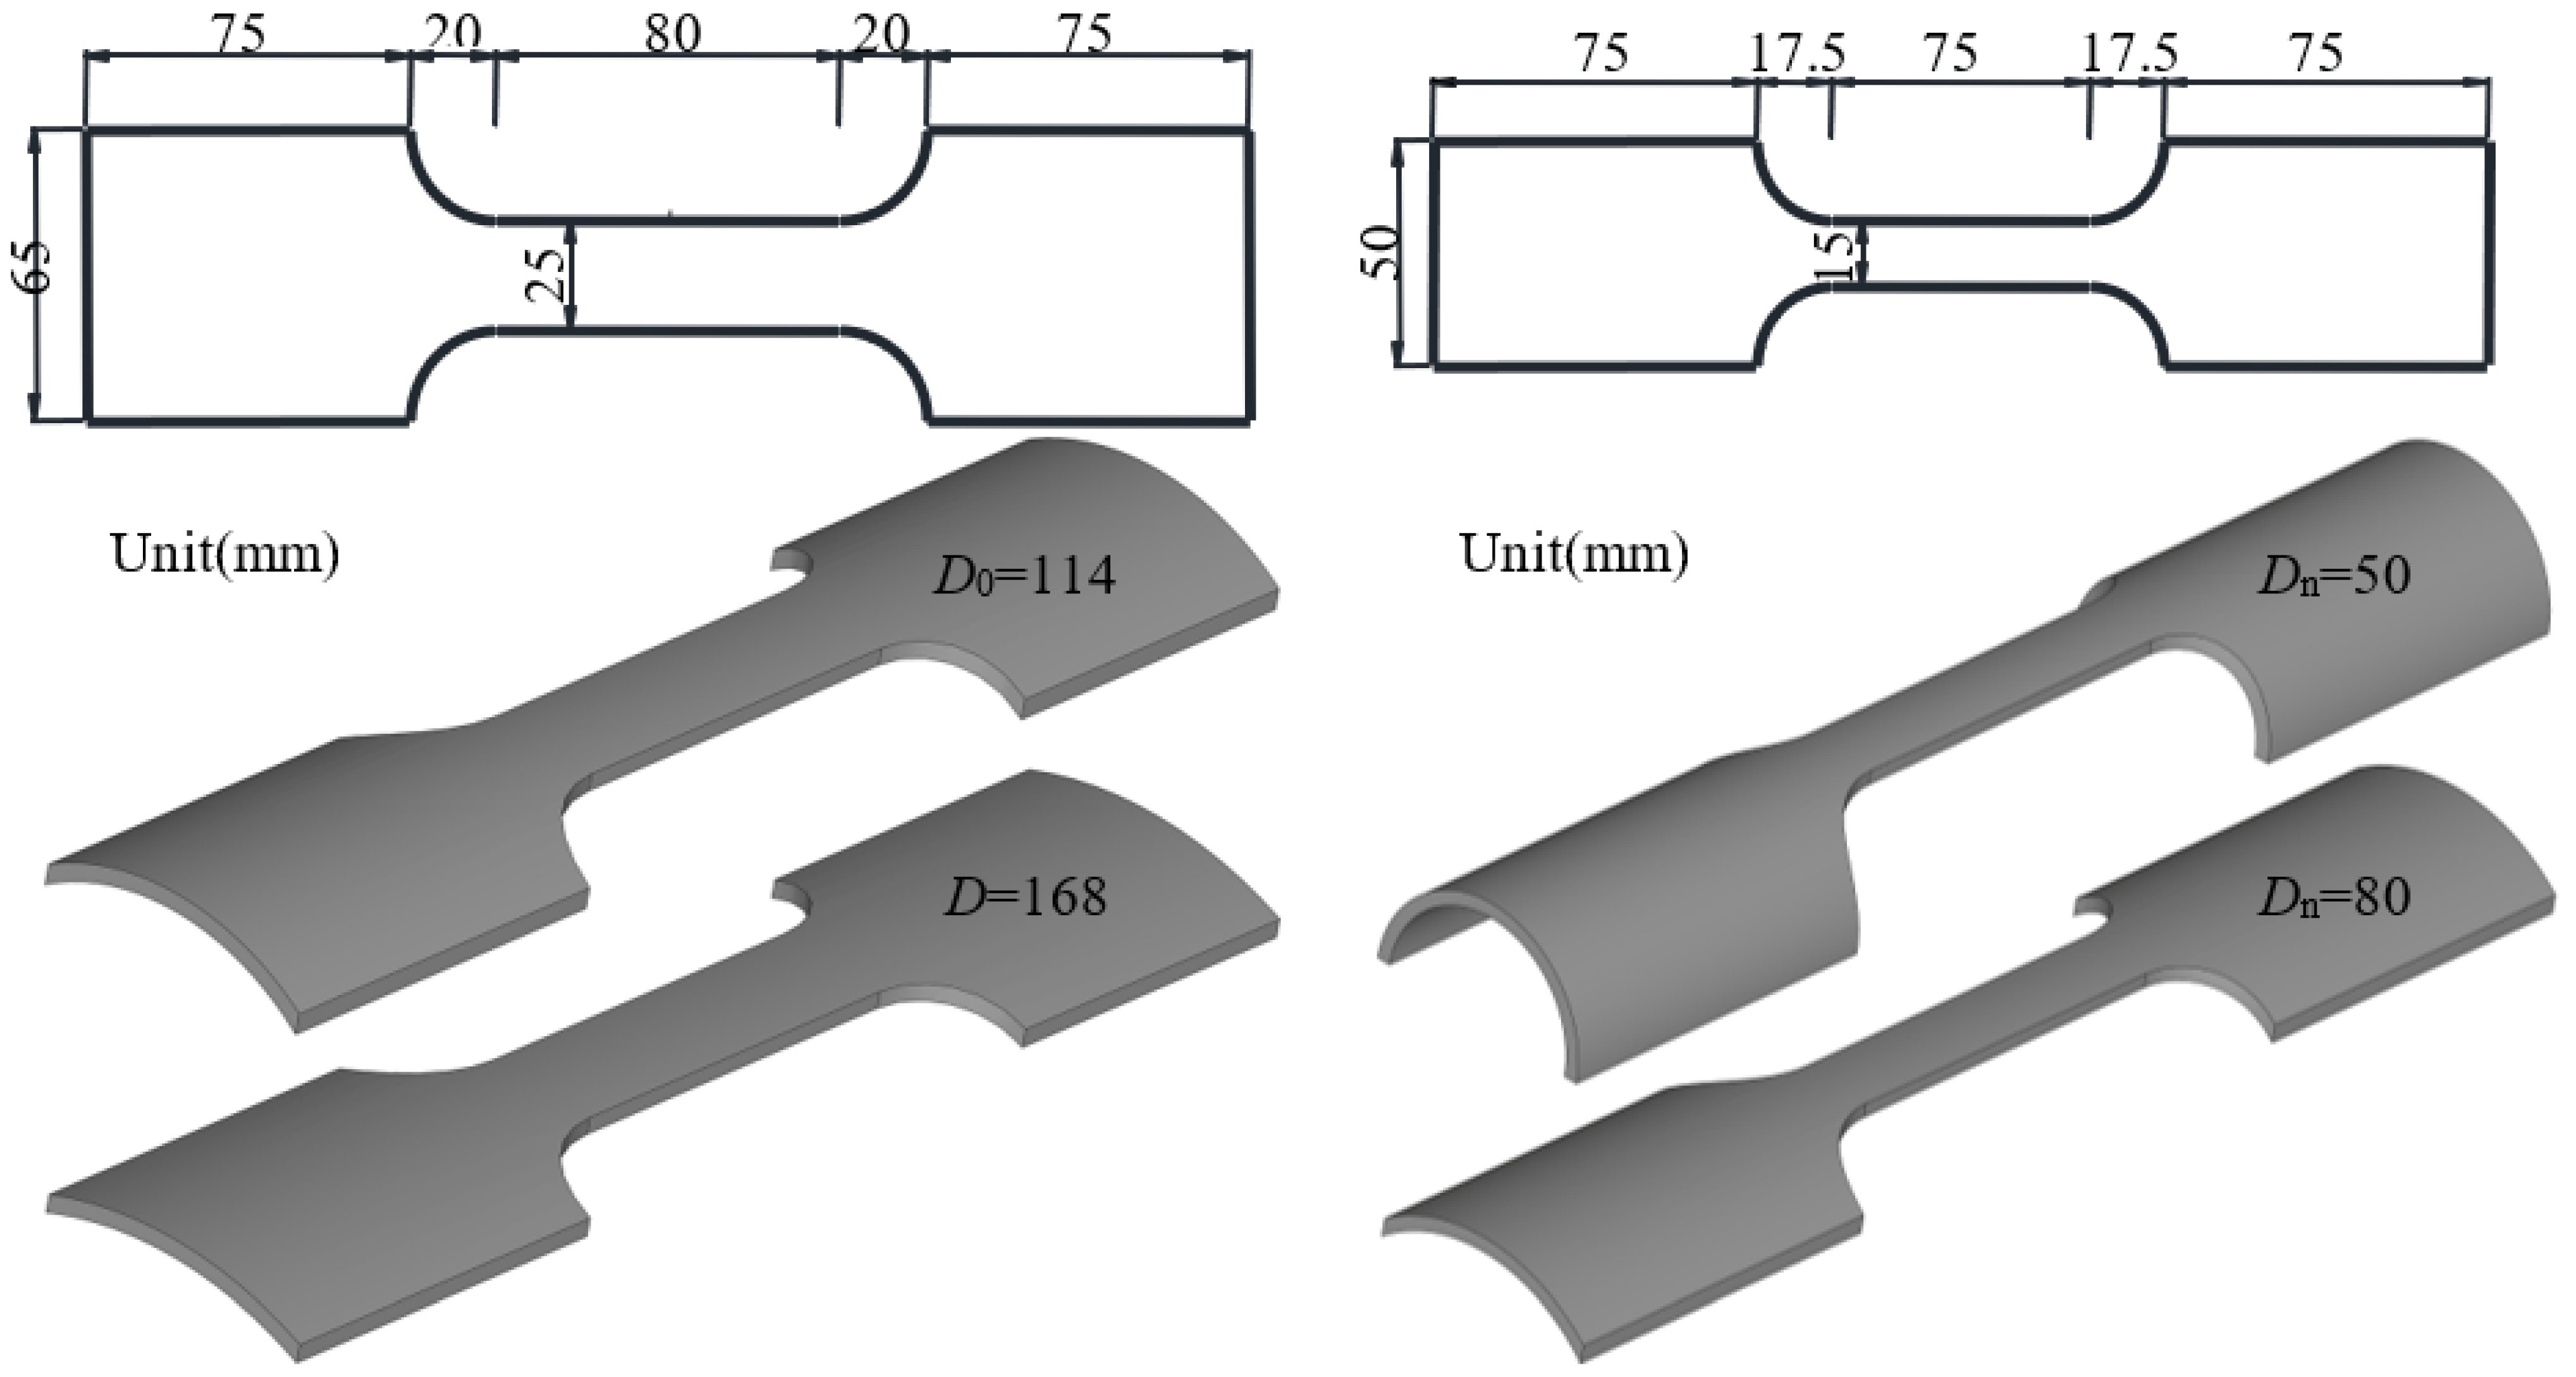
2.1. Specimen Design

In this paper, a total of 4 specimens (1 commercial Portland CFDST T-joint and 3 steel slag CFDST T-joints) were designed (Table 1). The influences of hollow ratio and steel slag concrete of the CFDST main pipe on hysteretic behavior were compared and studied, and the design diagram of the specimens are exhibited in Figure 1. Table 1 lists the design parameters of the CFDST T-joint specimens. The length of the CFDST main pipes was 900 mm. The outer diameters of the CFDST main pipes were 50 mm, 80 mm and 168 mm, respectively. The thickness of the CFDST main pipe outer tubes was 4 mm. The thickness of the CFDST main pipe inner tubes was 3 mm. The outer diameter, length and thickness of the CHS brace pipe were 114 mm, 400 mm and 4 mm, respectively. The brace-to-main pipe diameter ratio of the CFDST was 0.68. The axial compression ratio of the CFDST main pipe was 0.1.

2.2. Mechanical Properties of Materials

Q235 steel tubes with straight-welded main pipes and seamless welded branch pipes were used in this experiment. Size specifications of the material specimens are shown in Figure 2. The mechanical properties of the steel were tested according to the Chinese metallic materials—tensile testing code GB/T228.1-2021 [22]. The yield and ultimate strength of the 3-mm and 4-mm thick steel are shown in Table 2, respectively, by tensile experiment.
The steel slag concrete was used to filled the CFDST main pipe. The concrete-filled double-skin steel tube was prepared according to Chinese specifications for mix proportions expressed in the design of ordinary concrete code JGJ55-2011 [23]. The ordinary Portland cement with a strength grade of 42.5 was used. The steel slag was obtained from the local enterprise of Fujian Sangang (Group) Co., Ltd. (Sanming, China) [3]. Table 3 shows the chemical compositions of the commercial Portland cement and steel slag powder. Table 4 lists the mix proportions of the commercial Portland concrete and steel slag concrete. The steel slag powder was added to replace part of the ash and cement.
The mechanical properties of the commercial Portland concrete and steel slag concrete were experimentally measured according to the specifications for the standard test methods for the physical and mechanical properties of concrete, expressed in Chinese code GB/T 50081-2019 [24]. Table 5 lists the concrete’s working behavior and the measured compressive strength. It can be seen from the result listed in Table 5 that the elastic modulus and cube compressive strength of the steel slag concrete were increased within 10% of the commercial Portland concrete.

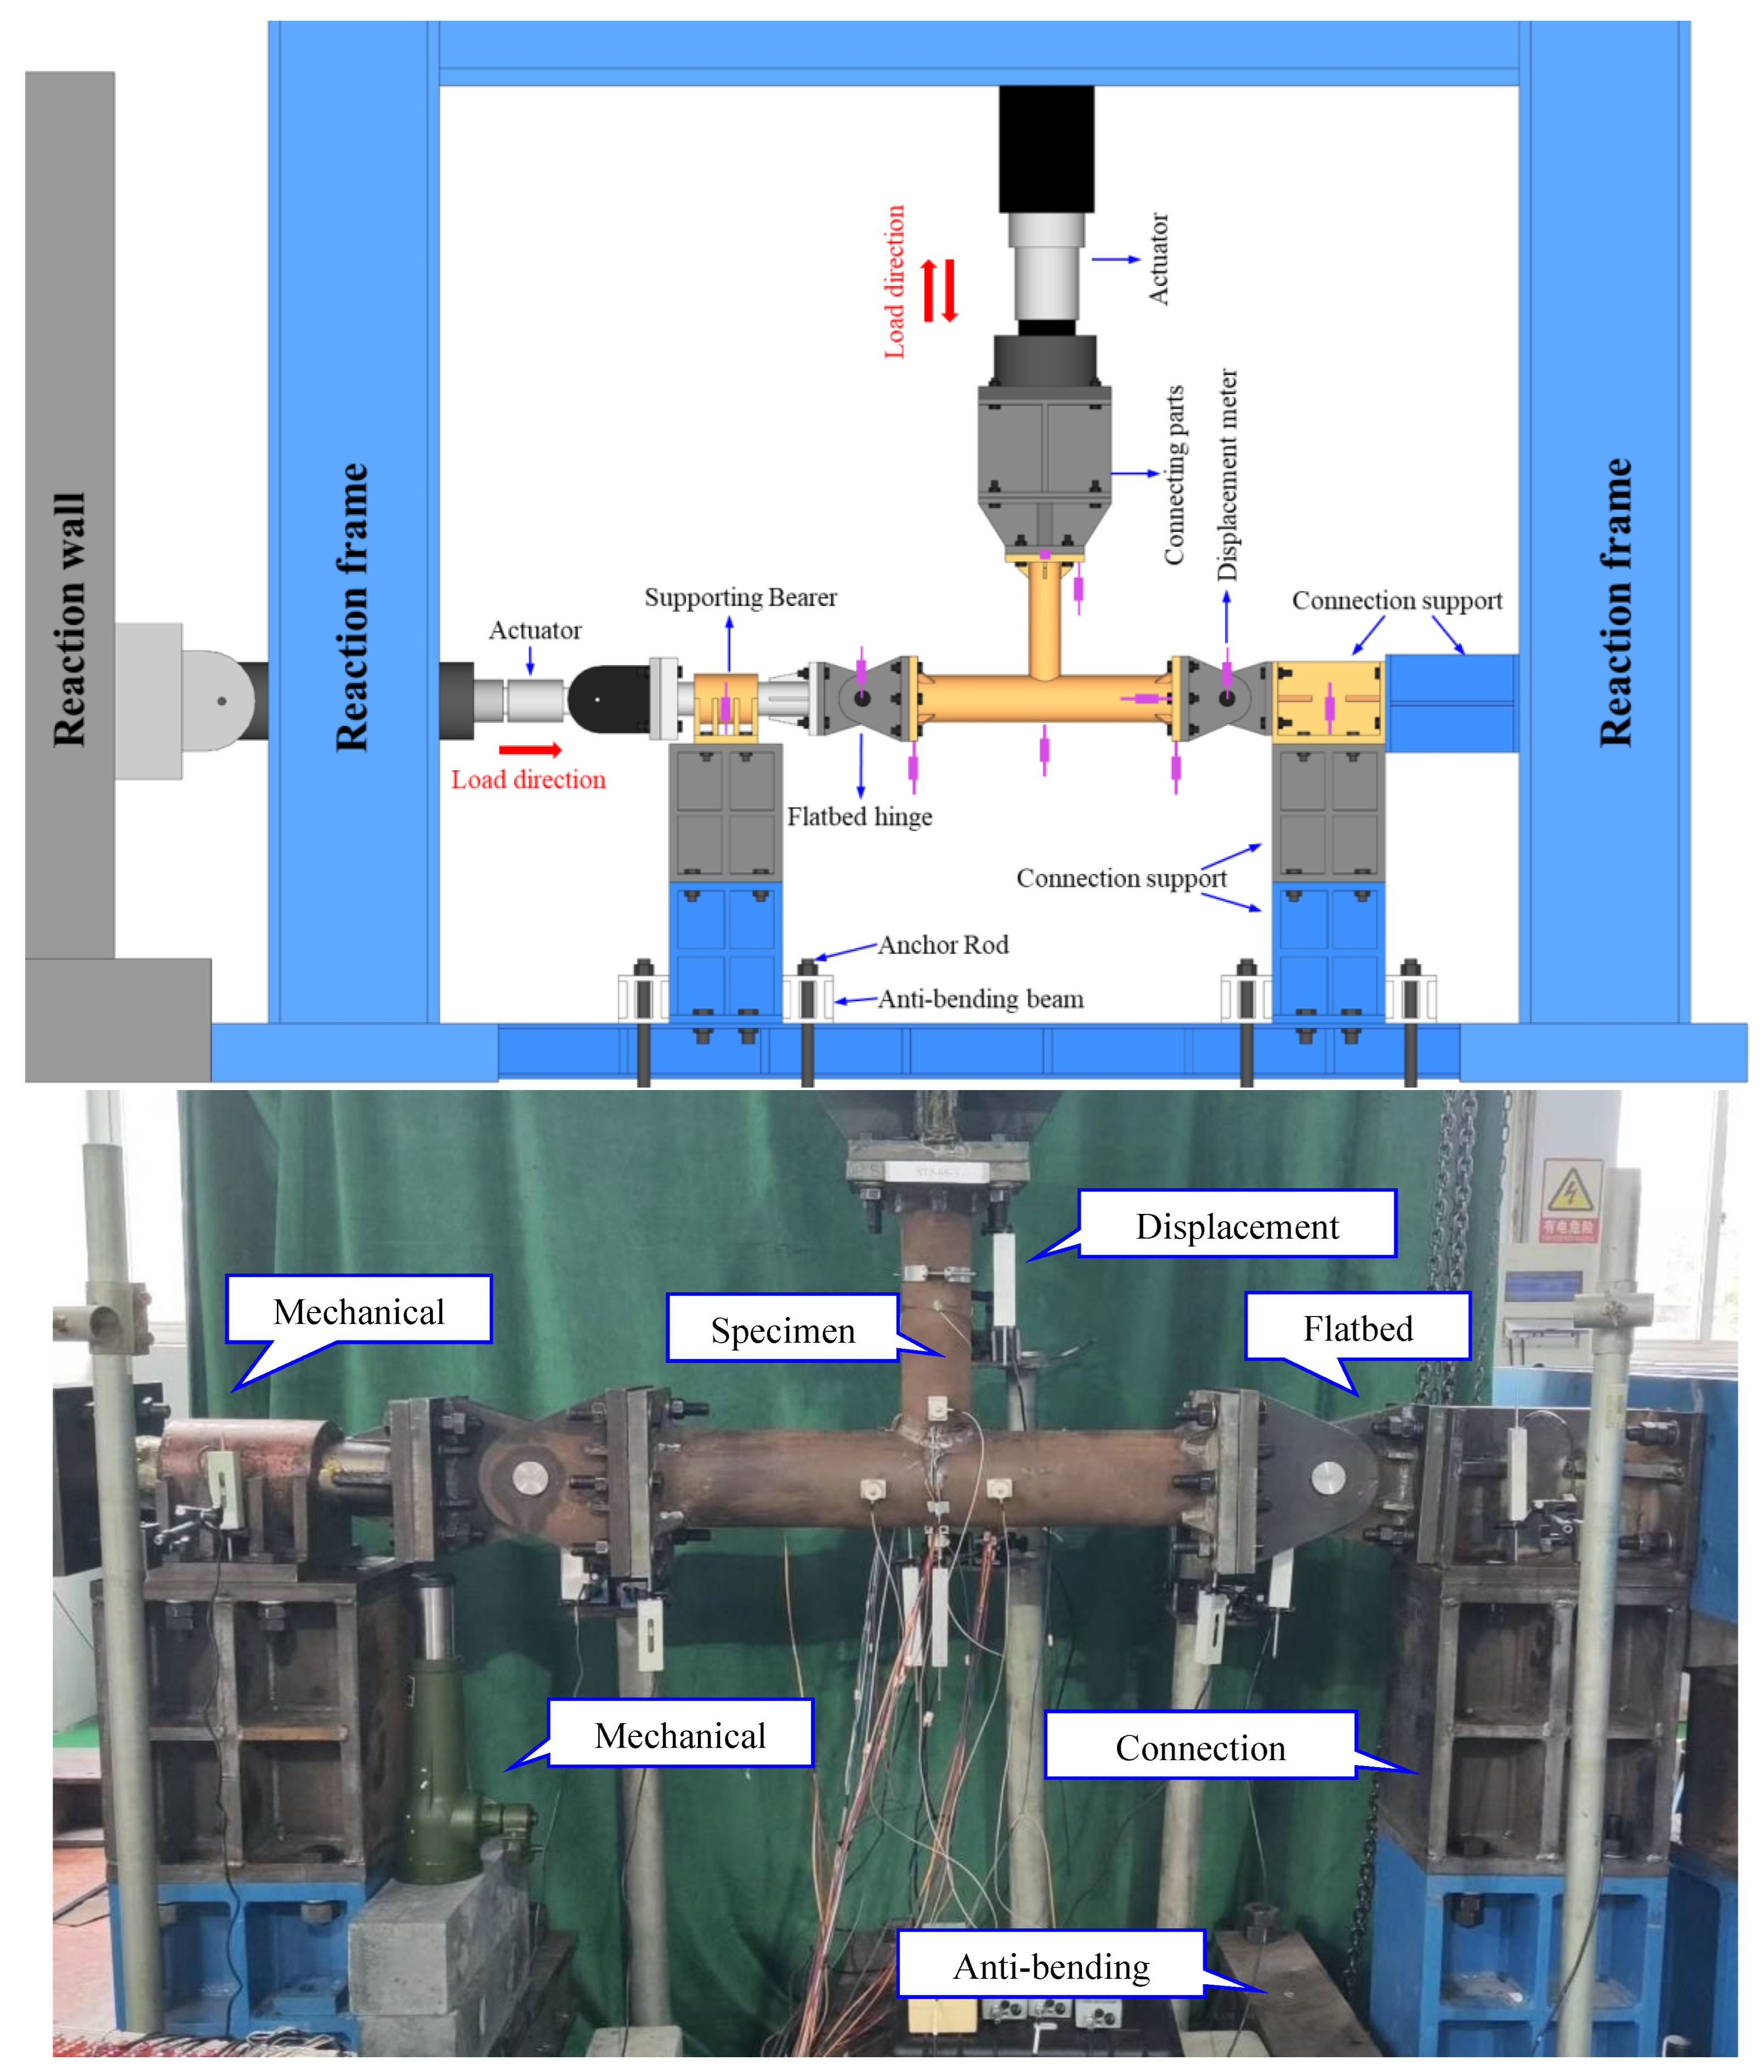
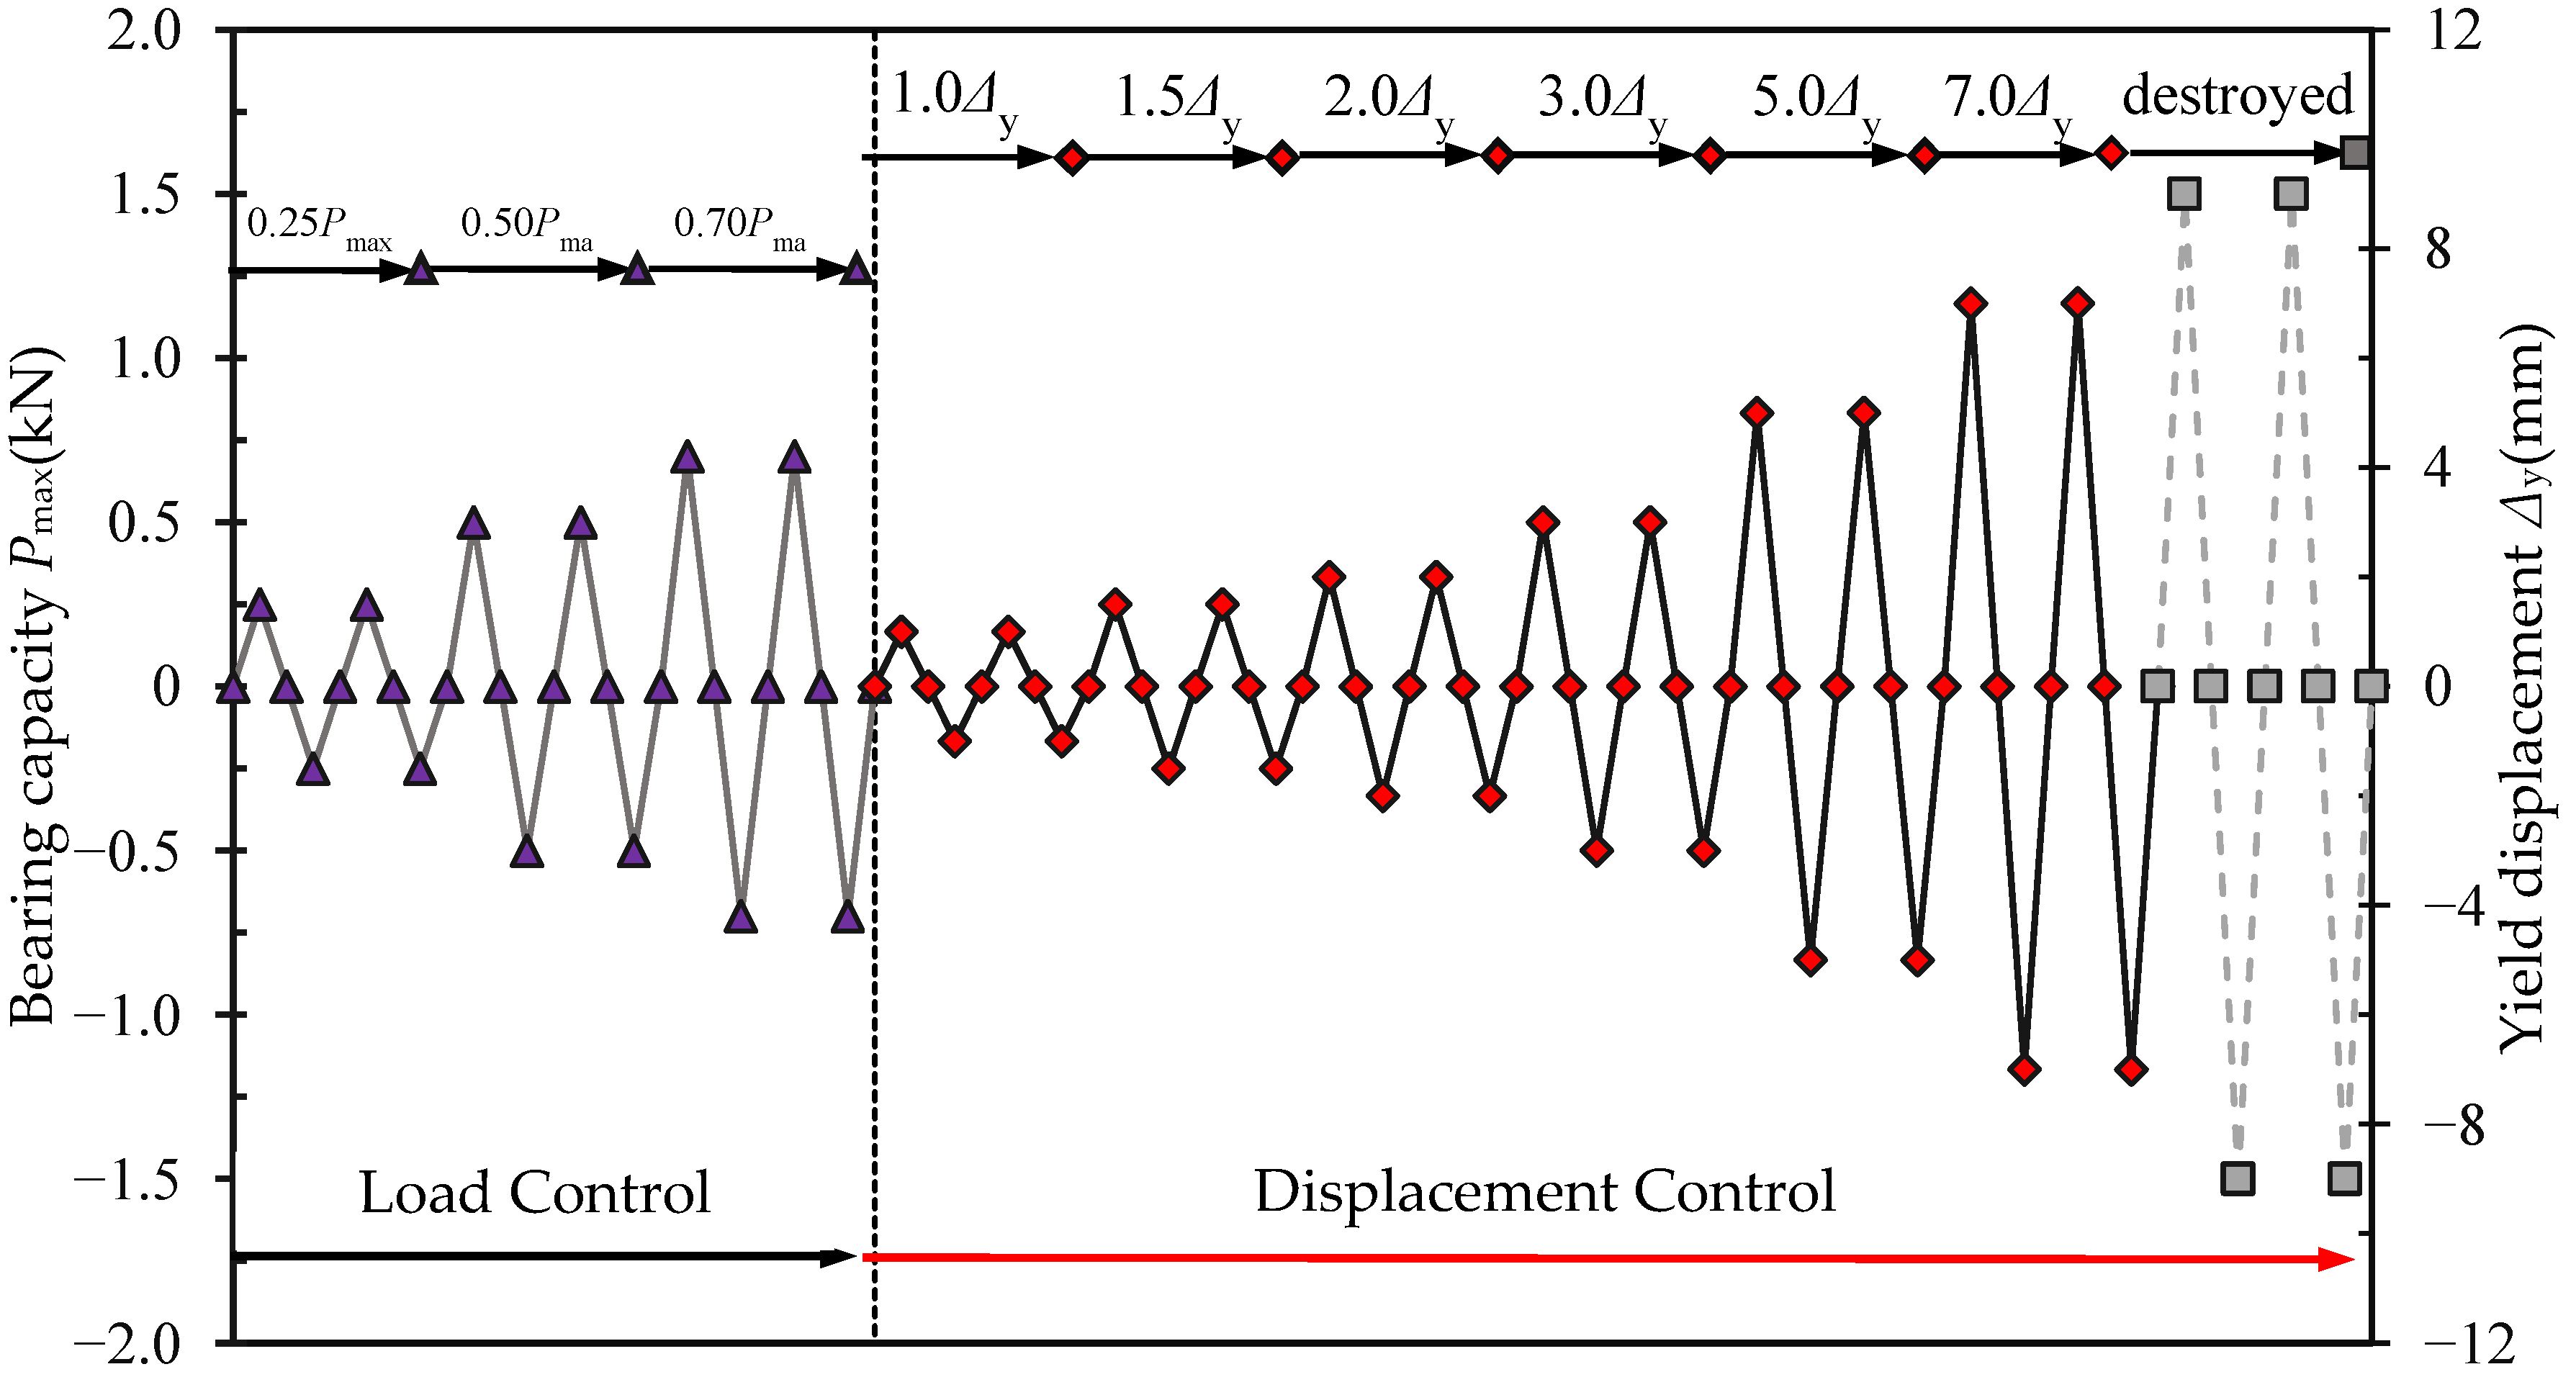
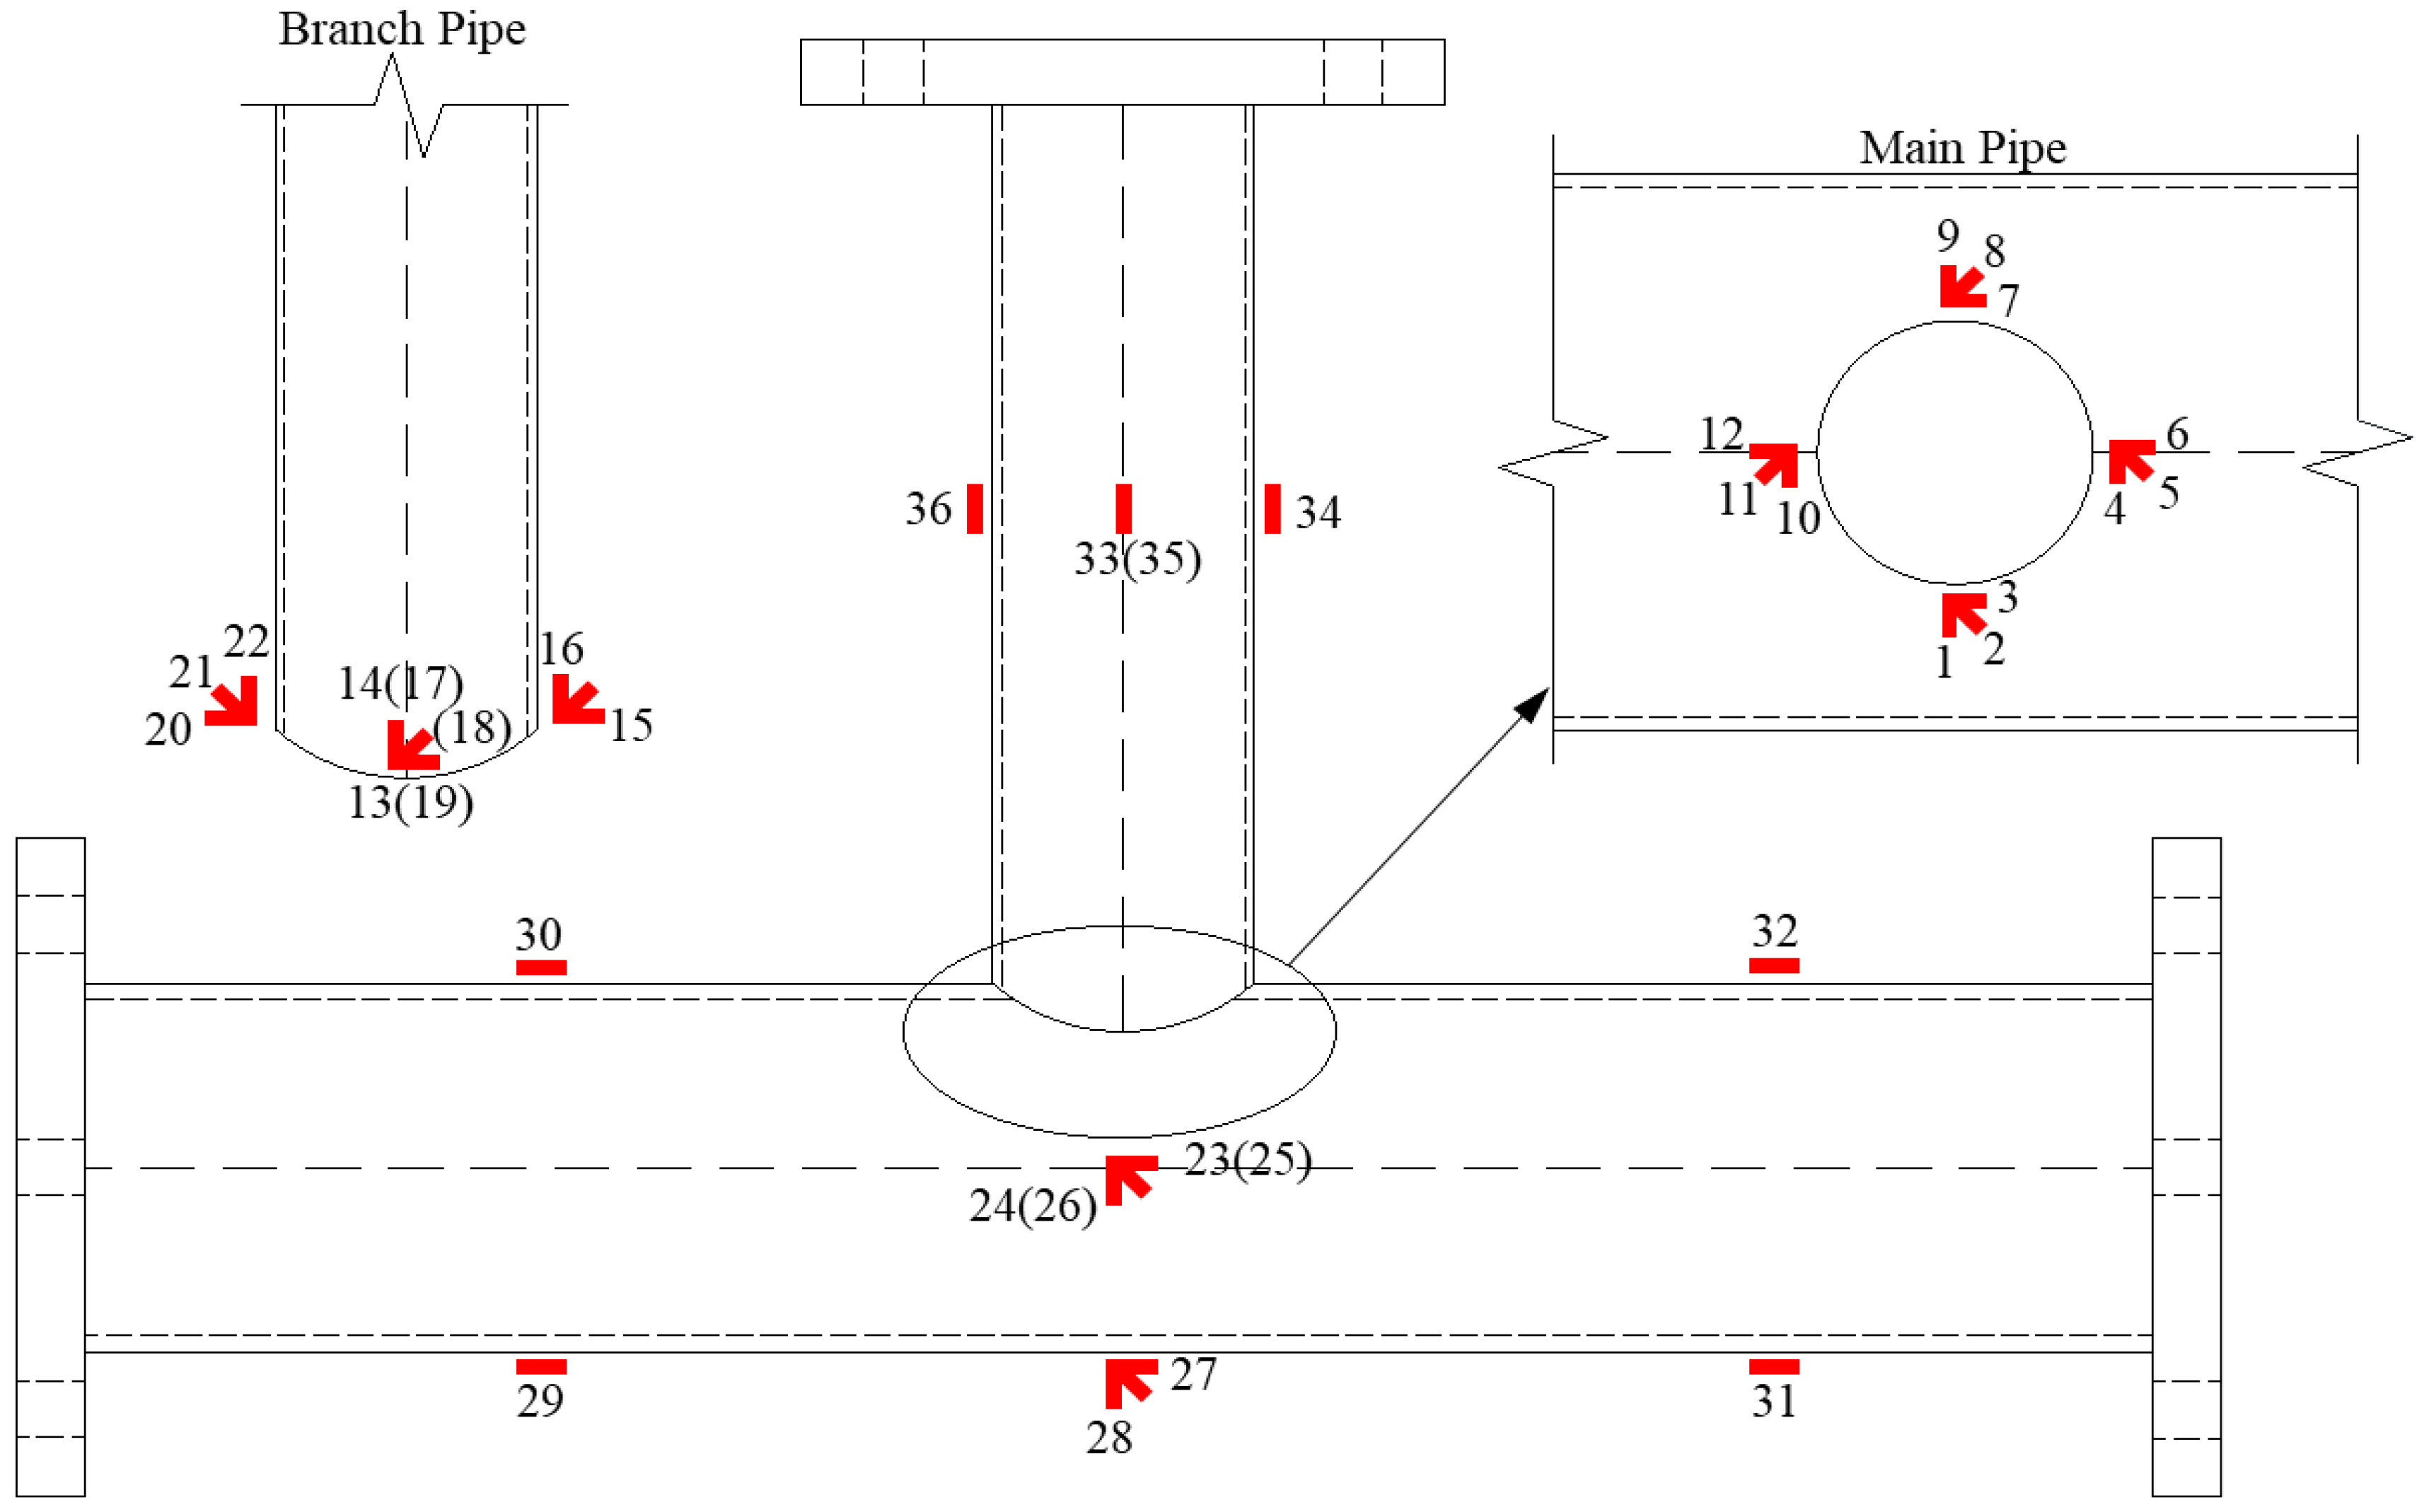
2.3. Experiment Setup and Loading Scheme

All CFDST T-joint specimens were completed through the self-balancing reaction rack experiment system in which the horizontal and vertical hydraulic actuator could provide a force of 1000 kN and 2000 kN, respectively. The experiment equipment is shown in Figure 3. During the experiment, the hollow sandwich steel tubular of the CFDST T-joint main pipe was placed horizontally to apply vertical cycle load. The experiment boundary condition of CFDST T-joint specimens were hinged. The end plates at both ends of the string rod were connected to the flat hinge, with one side of the flat hinge connected to the support seat and the other side of the support seat connected to the side actuator to facilitate the transmission of axial load. The other side of the plate is hinged with the lateral connection support, which can transfer the force to the reaction frame and improve the lateral boundary stiffness. During the experiment, the actuator was controlled by the system to keep the axial pressure constant. Cyclic loading was transferred to the belly rod by the vertical actuator through the connector.
To study the seismic performance of the CFDST T-joint, cyclic loading with varying amplitude vertical loading schemes was applied to the joints. The vertical loading experiment adopts a load–displacement dual control loading system. The loading scheme of the CFDST T-joint was generated according to the specification for the seismic testing of buildings code JGJ/T 101-2015 [25], which can be seen in Figure 4. Before the specimen reaches the yield strength, its load–displacement curve shows a roughly linear relationship. Therefore, in this stage, the loading is controlled by force with an increment of 0.25 Pmax, where Pmax is the bearing capacity calculated by finite element analysis. The loading rate is 1 KN/s during this stage. When the specimen reaches the plastic stage, the loading is controlled by the displacement, with the increment of yield displacement and each displacement being cycled two times. The loading rate was 1 mm/min during this stage. The loading is terminated if one of the following conditions is met: the steel tube is fractured, the steel tube is loaded to the point where the load drops beyond the 15% peak load or the joint is subjected to significant plastic deformation failure.
The real-time curve of the load–displacement relationship can be collected by the data acquisition system of the servo actuator. The longitudinal displacement in the direction of the cyclic load of the branch pipe can be measured by the displacement meter and verified with the data collected by the system. In order to measure the vertical displacement of the CFDST main pipe, a total of 11 displacement sensors were installed in the device. The measuring No. 1, No. 2 and No. 8 displacement meters were installed in the middle of the main span, the left of the middle of the span and the end plate of the branch pipe. The No. 3 and No. 4 displacement meters were installed at the bottom of the left end plate of the main pipe and the left hinge center of the plate. The No. 5 and No. 6 displacement meters were installed at the bottom of the right end plate of the main pipe and the right hinge center of the plate. The No. 7 displacement measurement was used to measure the relative displacement of the branch main pipe, and to measure whether the change in the lower main pipe displacement was consistent with the branch pipe displacement. The No. 9 displacement meter was used to measure whether out-of-plane displacement occurs, and the No. 10 and No. 11 displacement meters were used to measure the vertical displacement of the support. Strain gauges were installed on the main pipe and branch pipe to measure the strain distribution, as shown in Figure 5.

3. Results

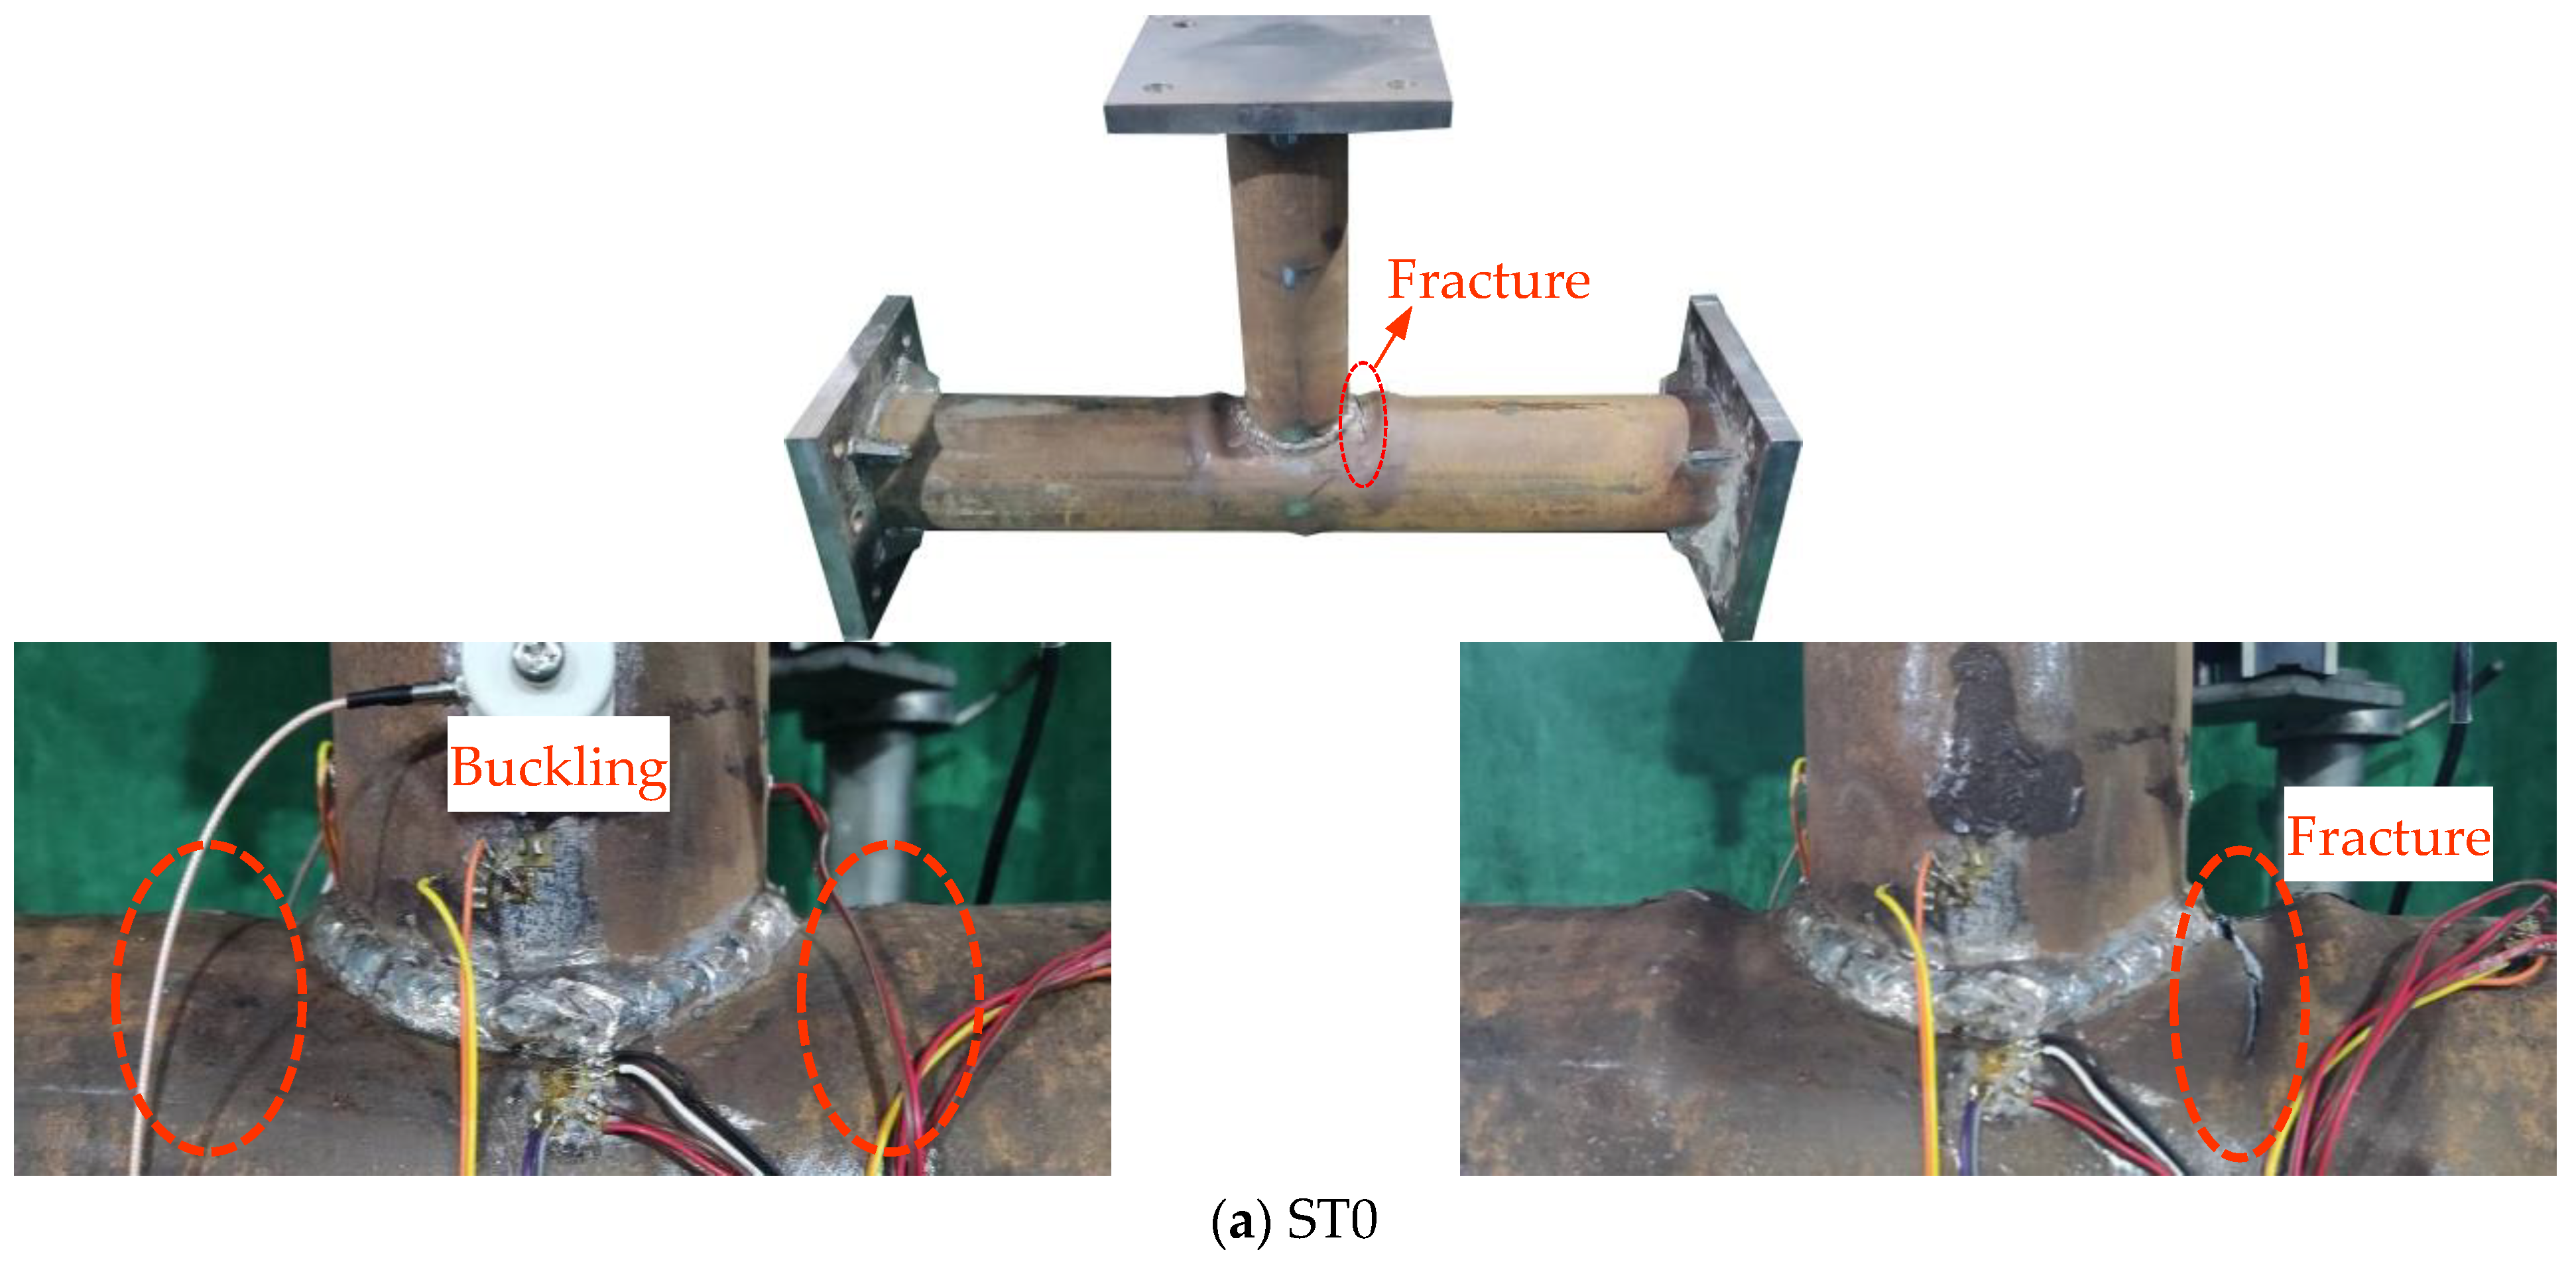
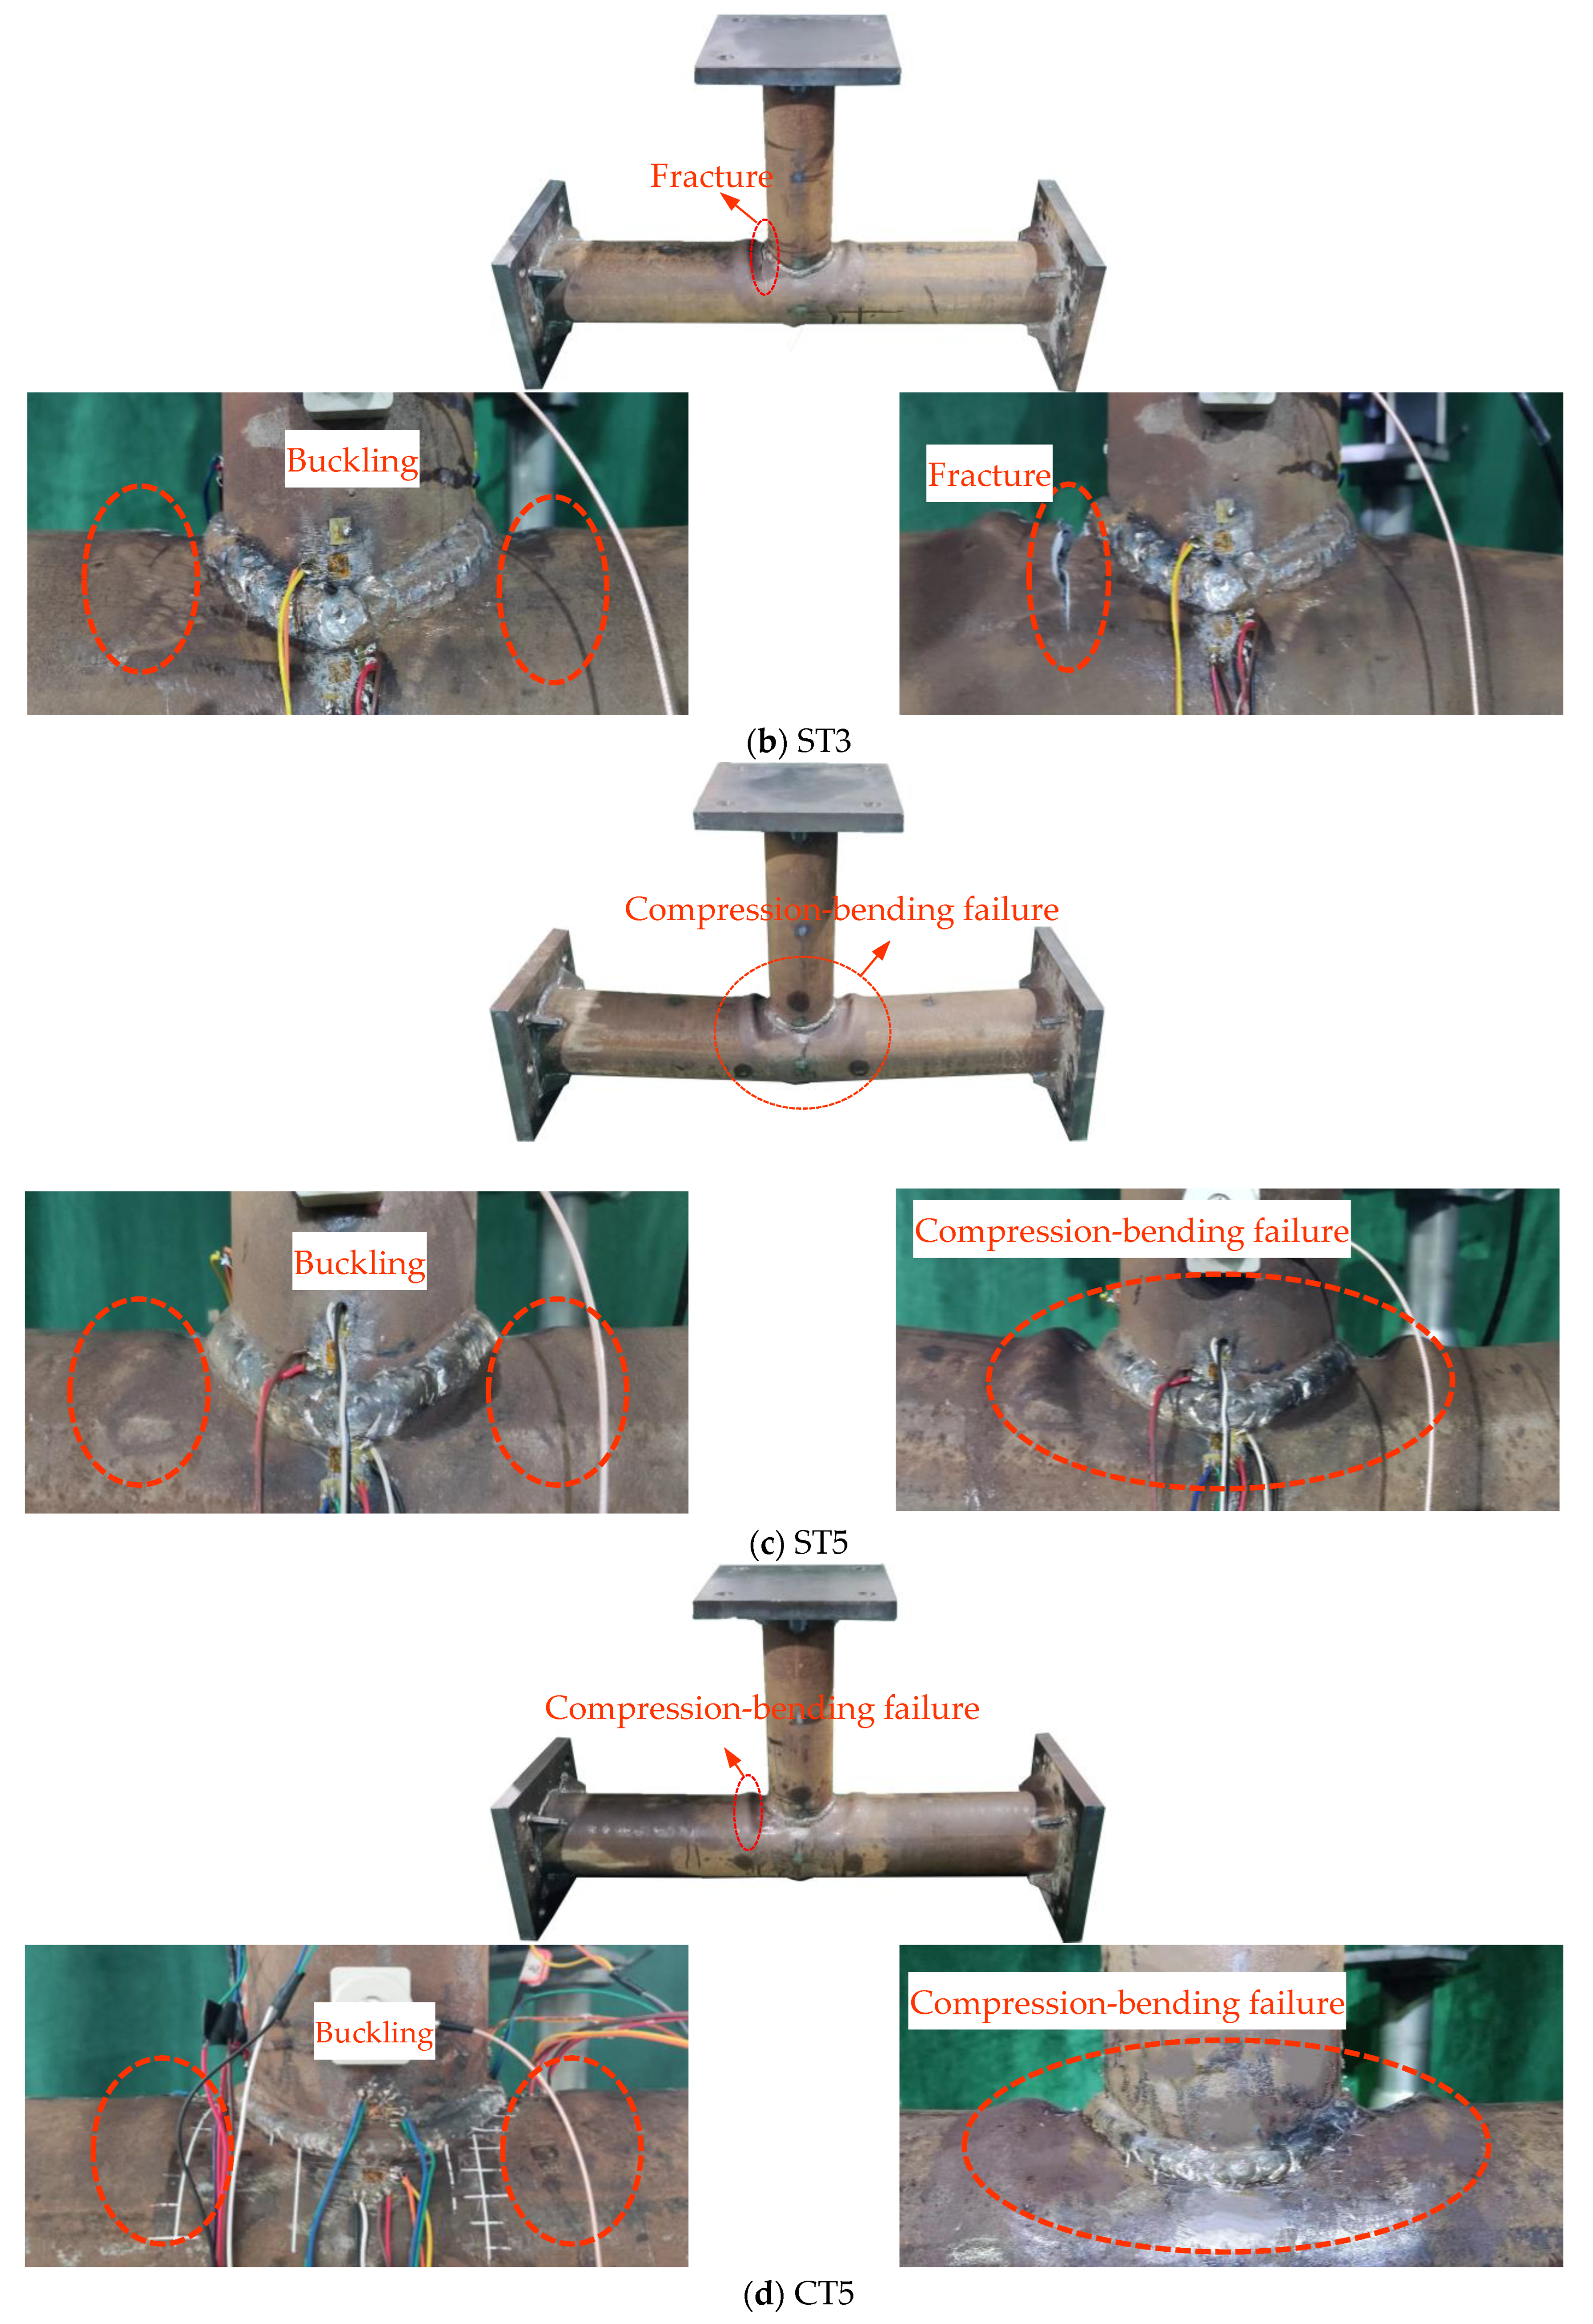
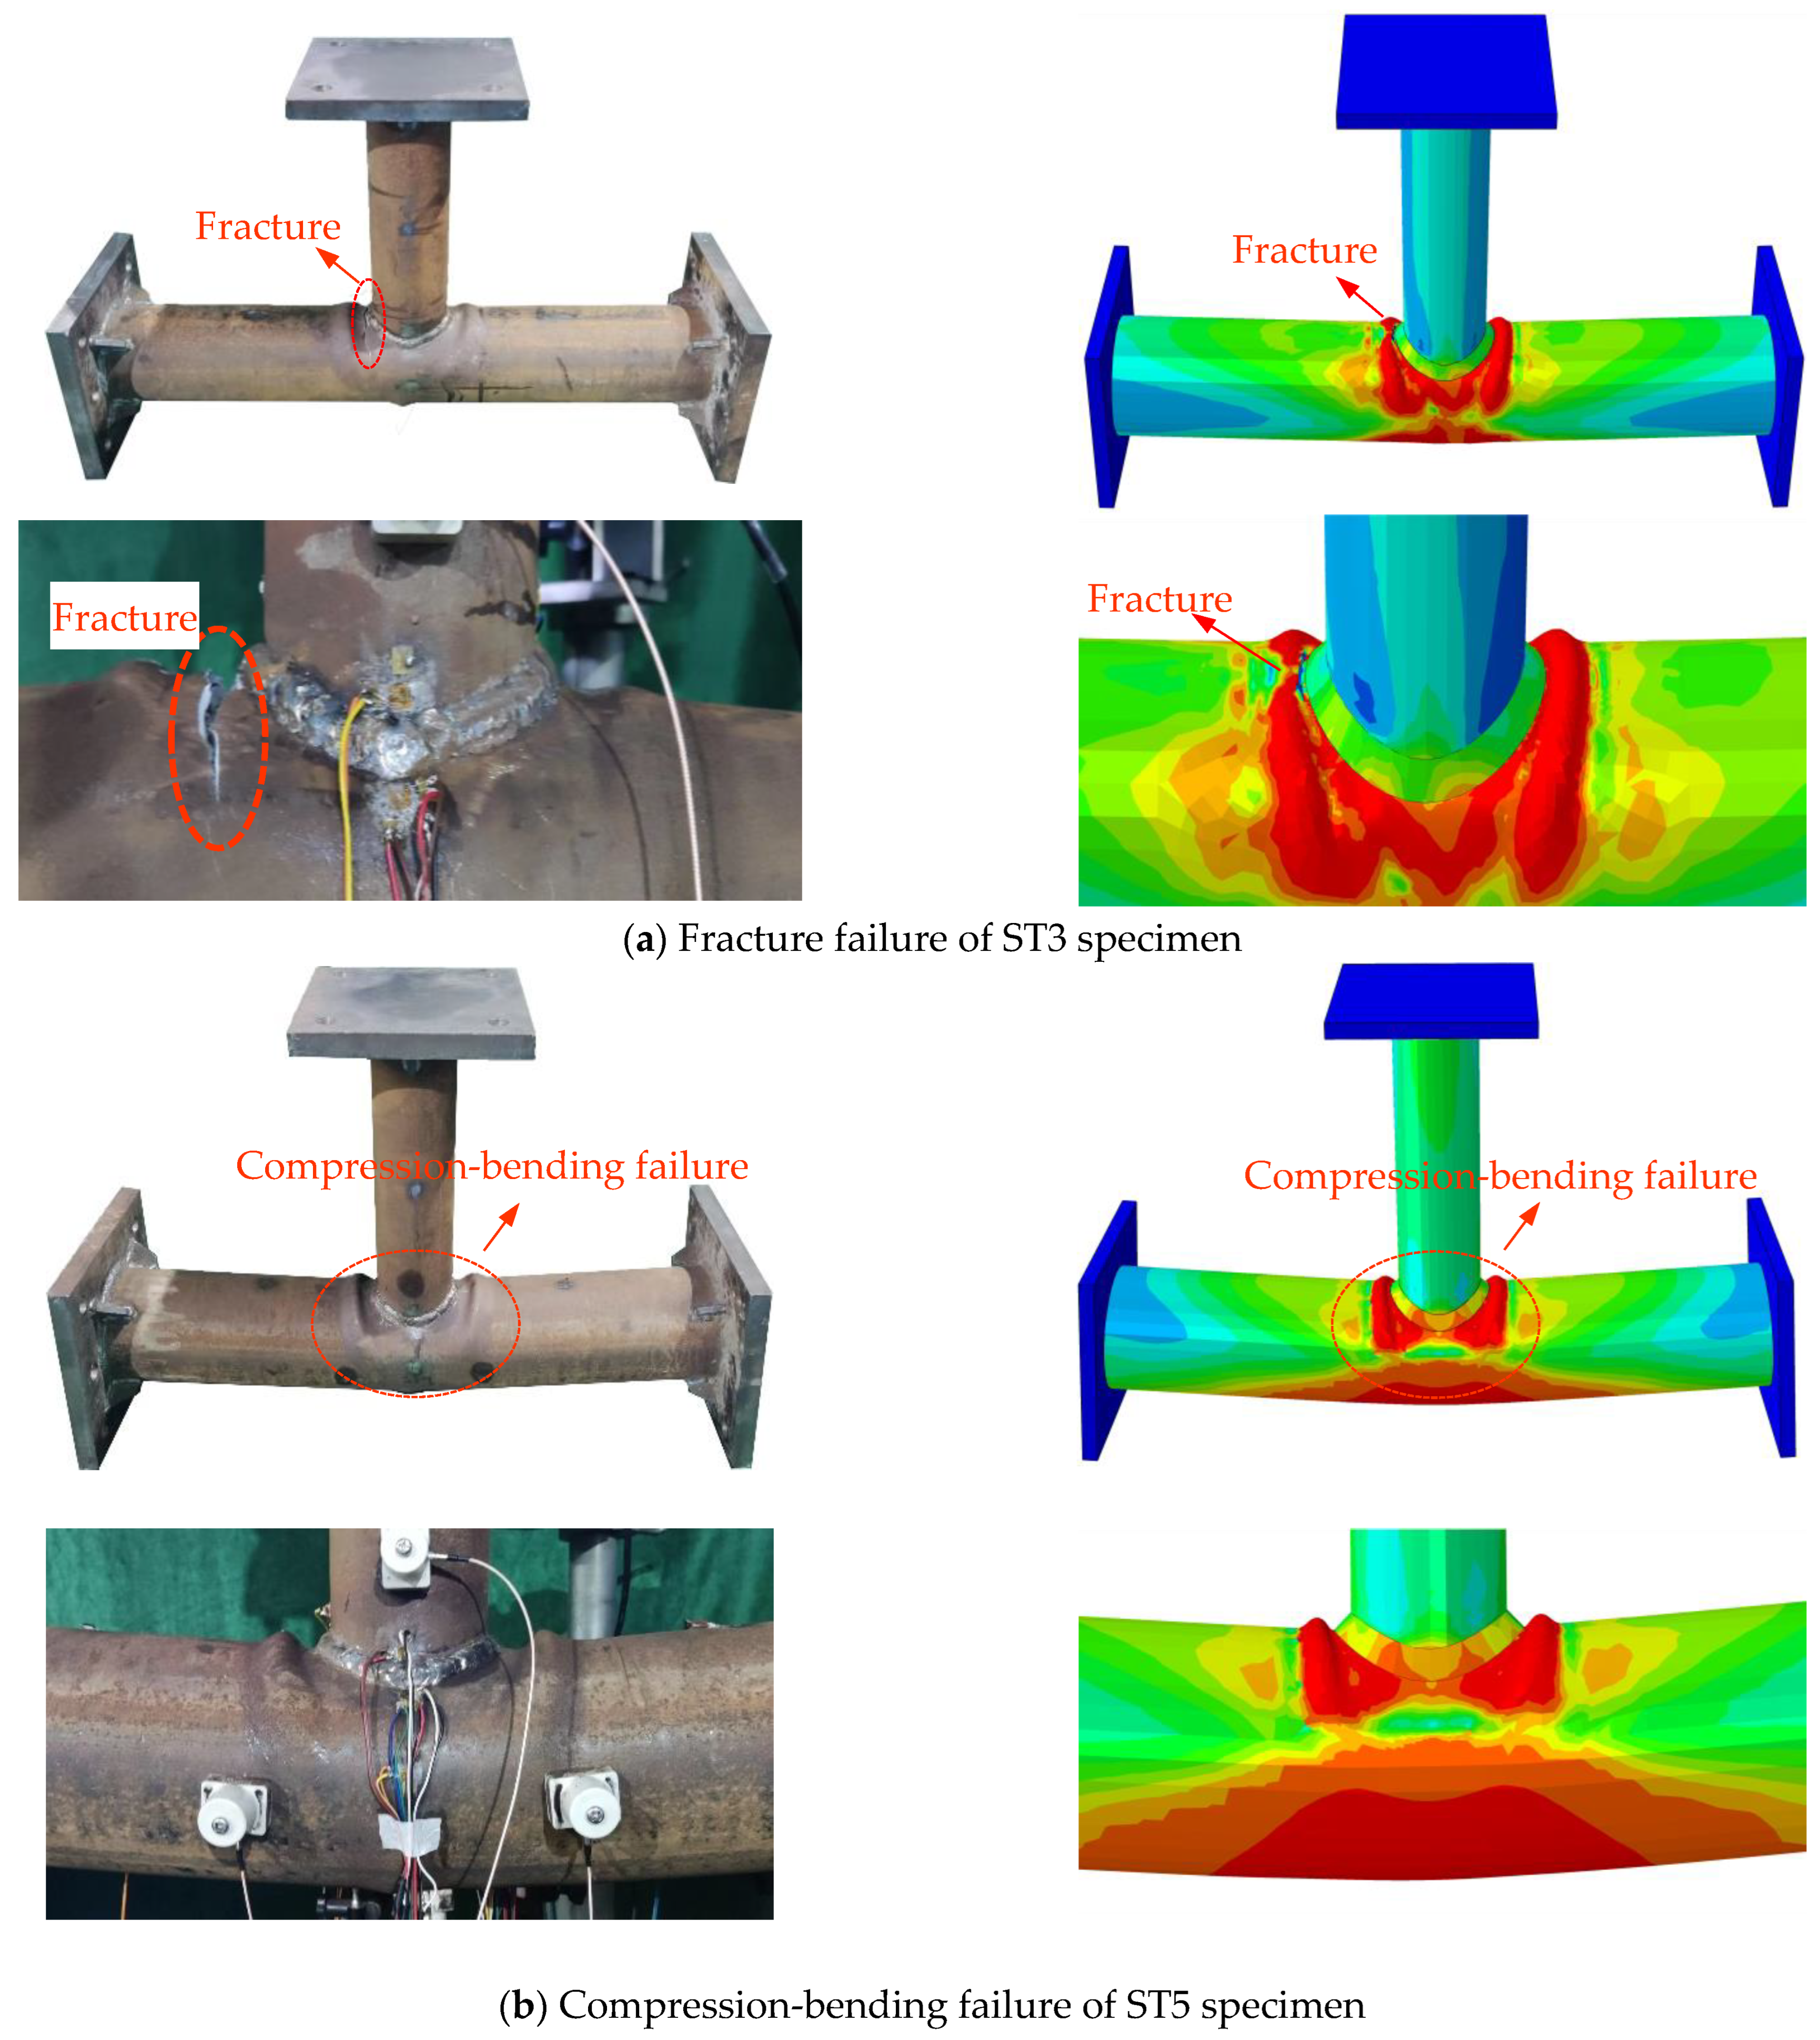
3.1. Failure Modes of Specimens

In order to study the failure process and failure mode influence law of CFDST T-joints under cyclic loading, the whole process of experimental observation was conducted on each specimen. It was found that none of the specimens had obvious appearance changes before the yield stage. With further increases of the loading displacement at the branch end, the components eventually failed and there were two failure modes: the regional head of the joint fracture and compression-bending failure in the joint area (see Figure 6).

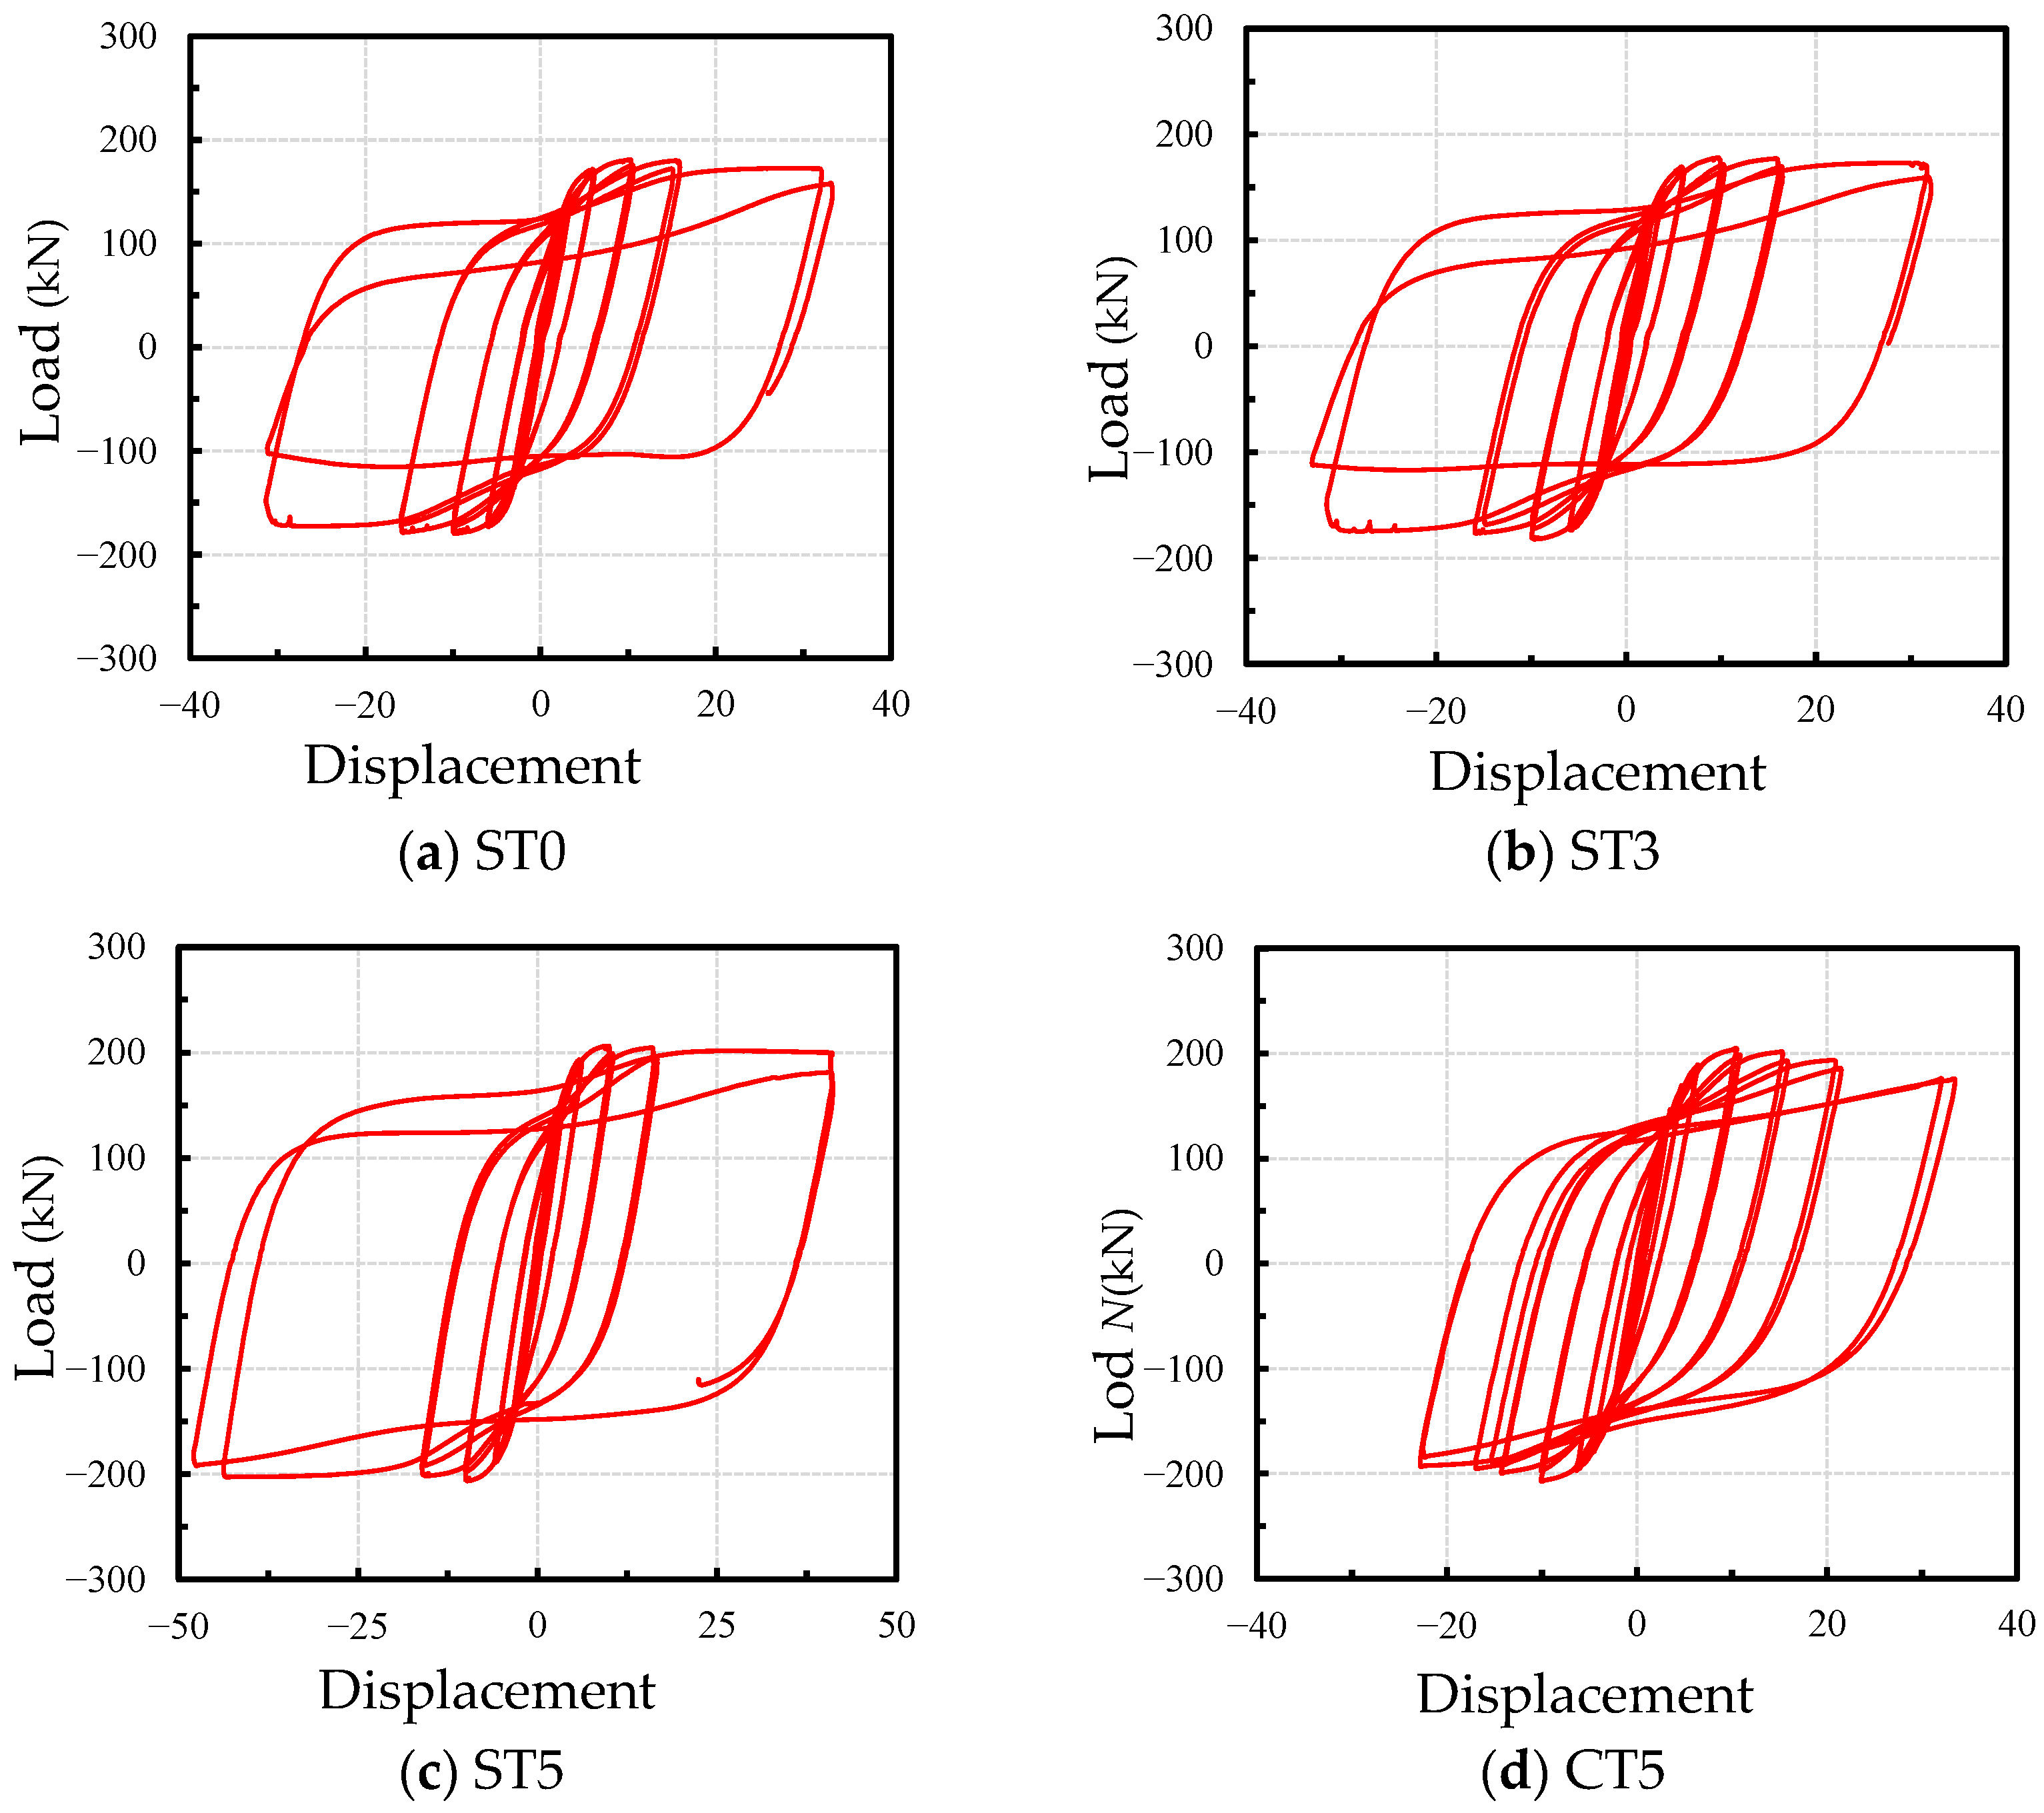
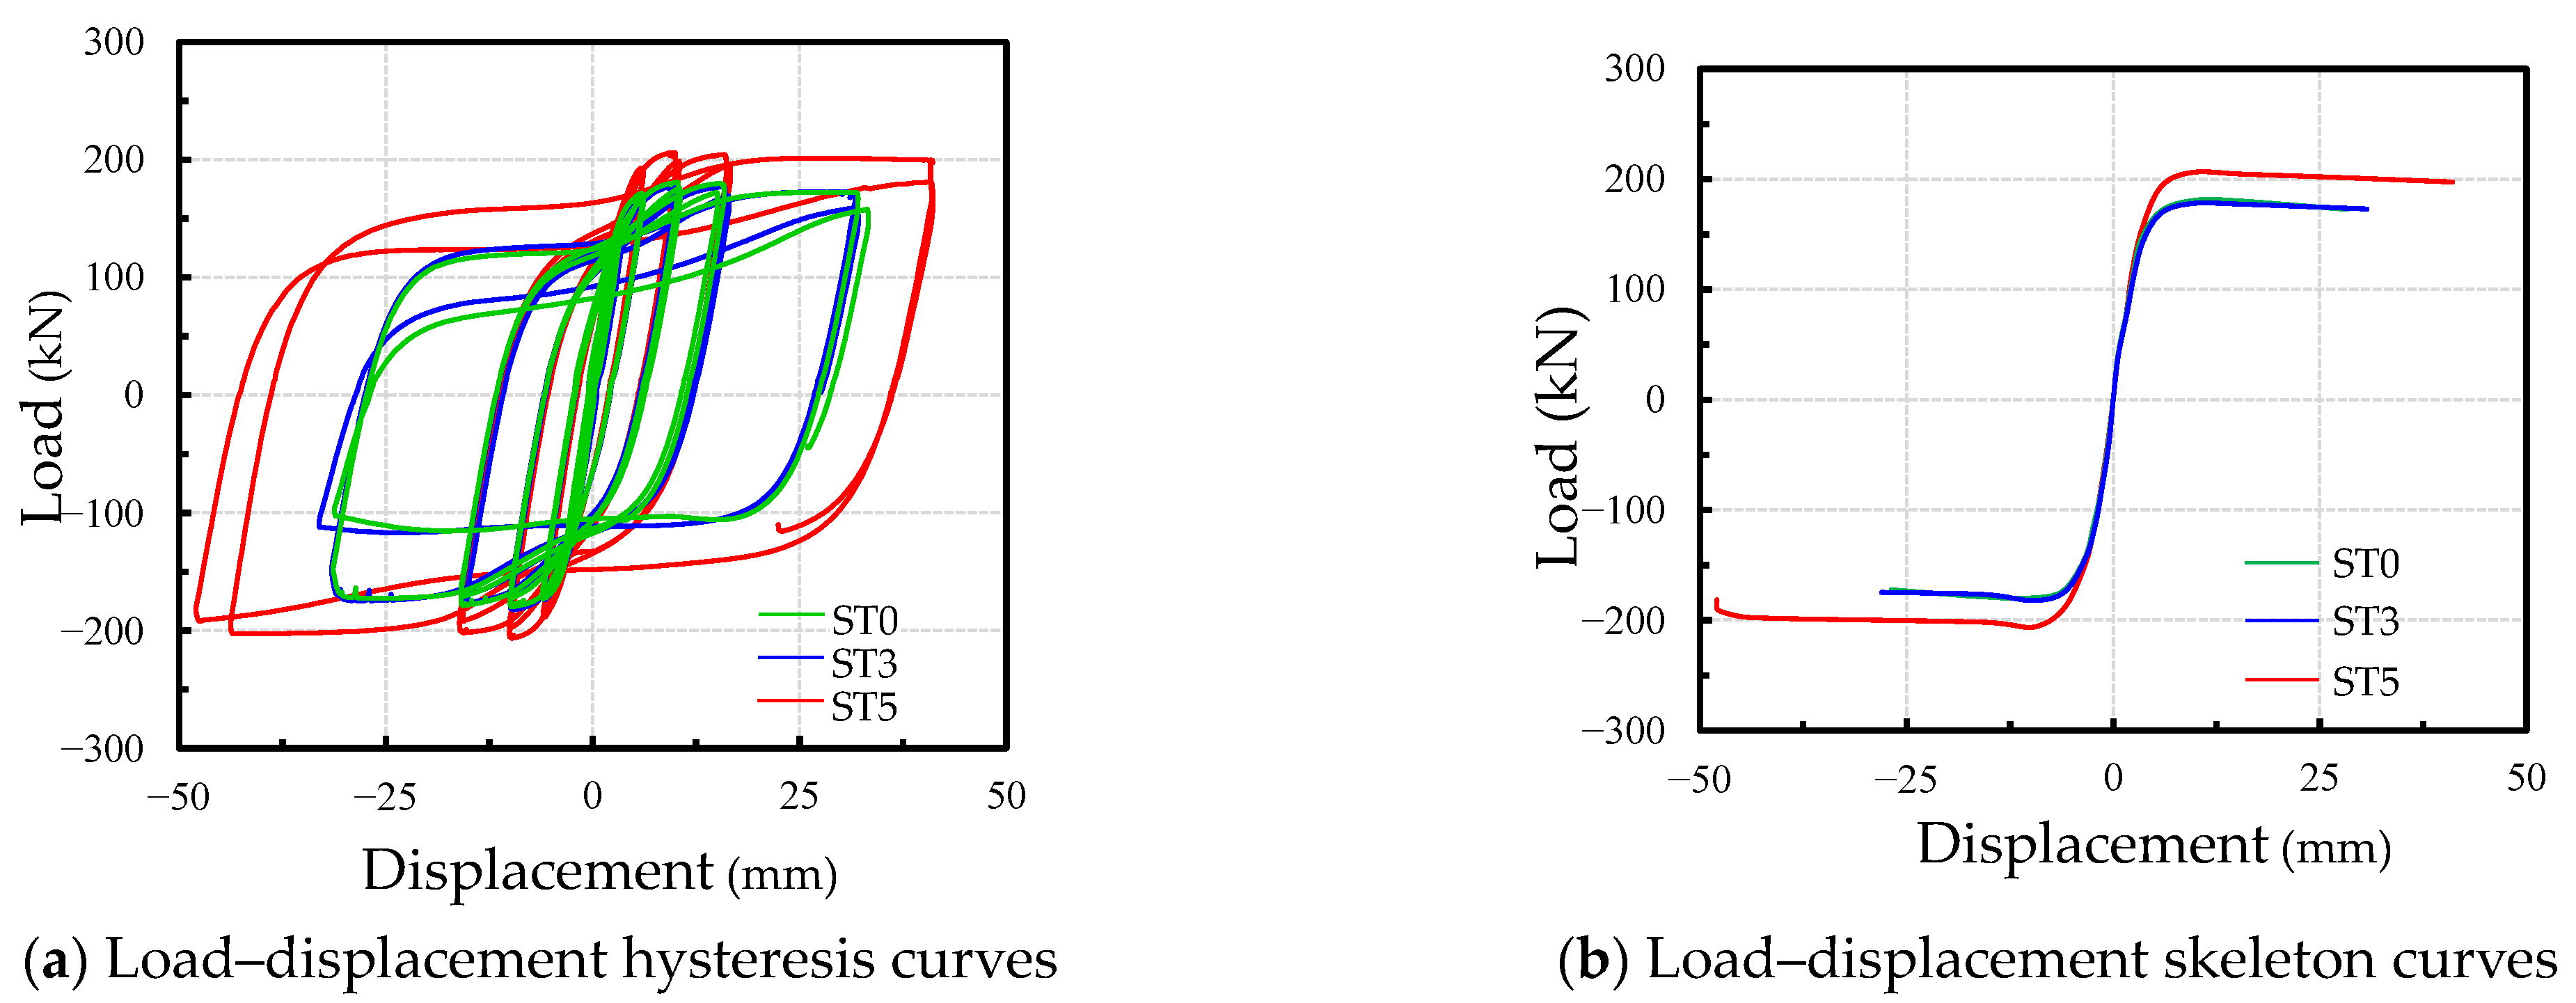
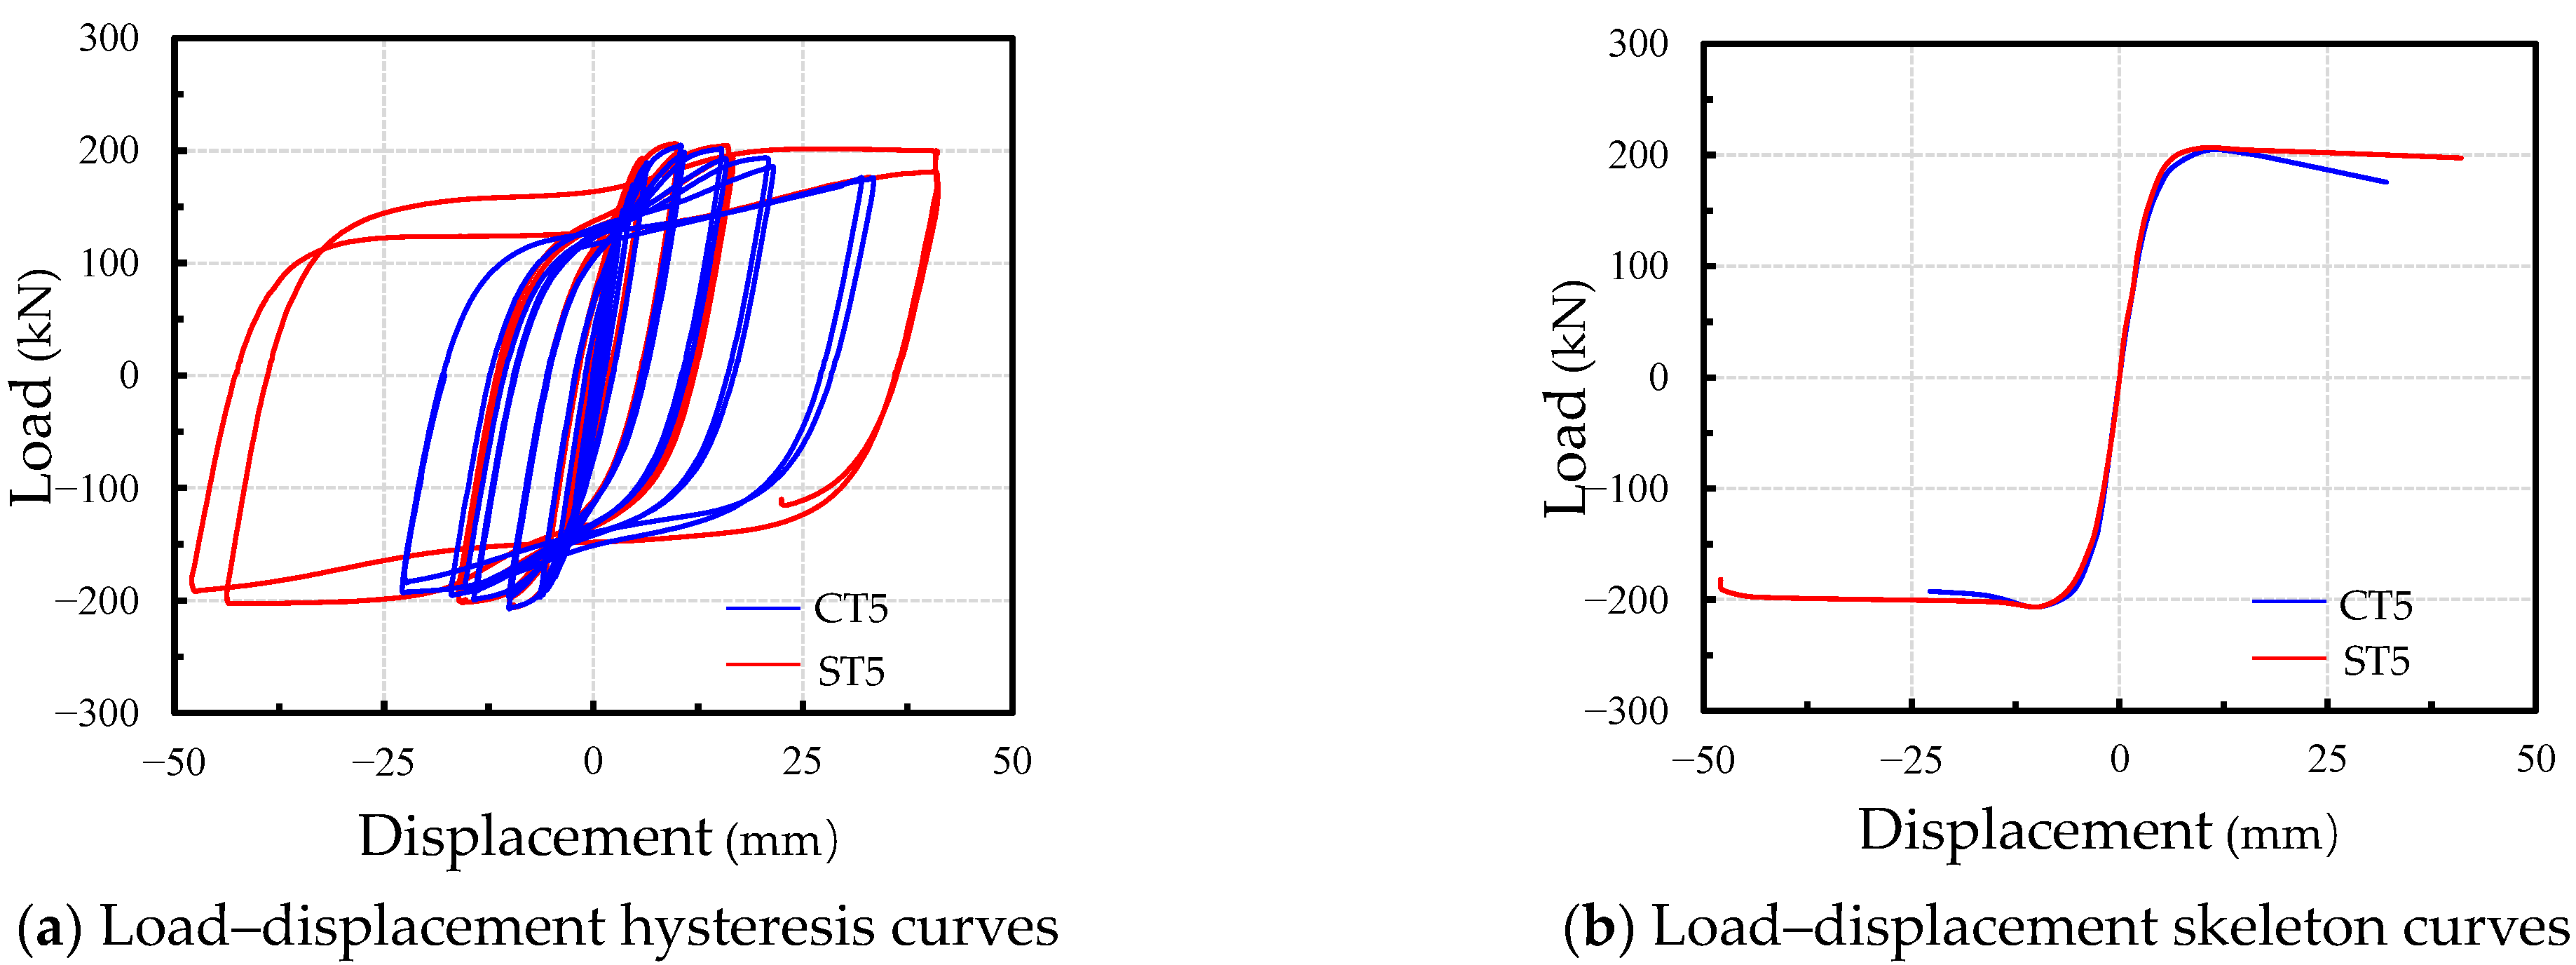
3.2. Load–Displacement Curves

Figure 7 shows the measured load–displacement curves of each experimental specimen. It can be seen that the hysteretic curves of each component are fusiform, full and symmetrical in the positive direction, without obvious pinching phenomena, indicating that the CFDST T-joint specimens have good energy dissipation capacity.
The skeleton curves of the CFDST T-joint specimens were formed by connecting the peak load point of the first circle of each stage of the hysteresis curve [25]. The skeleton curve in this paper is an “S” shape, indicating that the curve has experienced yield, maximum bearing capacity, maximum displacement and other characteristic points, according to which the ductility, stiffness and strength of the joint can be analyzed. Figure 8 shows the characteristic points of the skeleton curve. The experiment results of the specimens at the characteristic points are shown in Table 6.
The influence of various parameters on the characteristic points of the specimen was quantitatively compared. Taking CT5 as the benchmark, the standardization coefficient of characteristic points were calculated by average values of benchmark. Table 7 lists the standardization experiment results of specimens during the cycle loading. It can be seen from Table 5 that the ultimate capacity of the specimens could be improved with 12% load and 54% displacement and the hollow ratio of the CFDST main pipe increasing from 0 to 0.5. The reason for this is that the steel slag powder, with its properties of slight expansion, can strengthen the inter-reaction between the concrete and steel tube. The ultimate capacity of the specimens could be improved with 54% displacement by filling the steel slag concrete with the 0.5 hollow ratio of the CFDST main pipe. The filling of the steel slag concrete in the CFDST T-joint main pipe has no effect on its ultimate bearing capacity, but results in a larger ultimate displacement value and a fuller hysteresis curve.
The load–displacement curve’s effect on the hollow ratio of the CFDST T-joint specimens are shown in Figure 9. It can be seen from the Figure 9 that changing the hollow ratio on the CFDST T joint main pipe has little influence on the elastic stiffness. The ultimate load and deformation all increased when the hollow ratio increased from 0 to 0.5. The load–displacement curve’s effect on the CFDST specimen with steel slag or commercial Portland concrete is shown in Figure 10. The stiffness of the elastoplastic stage and ductility of the CFDST specimen with steel slag (ST5) all increased compared with the commercial Portland concrete (CT5).

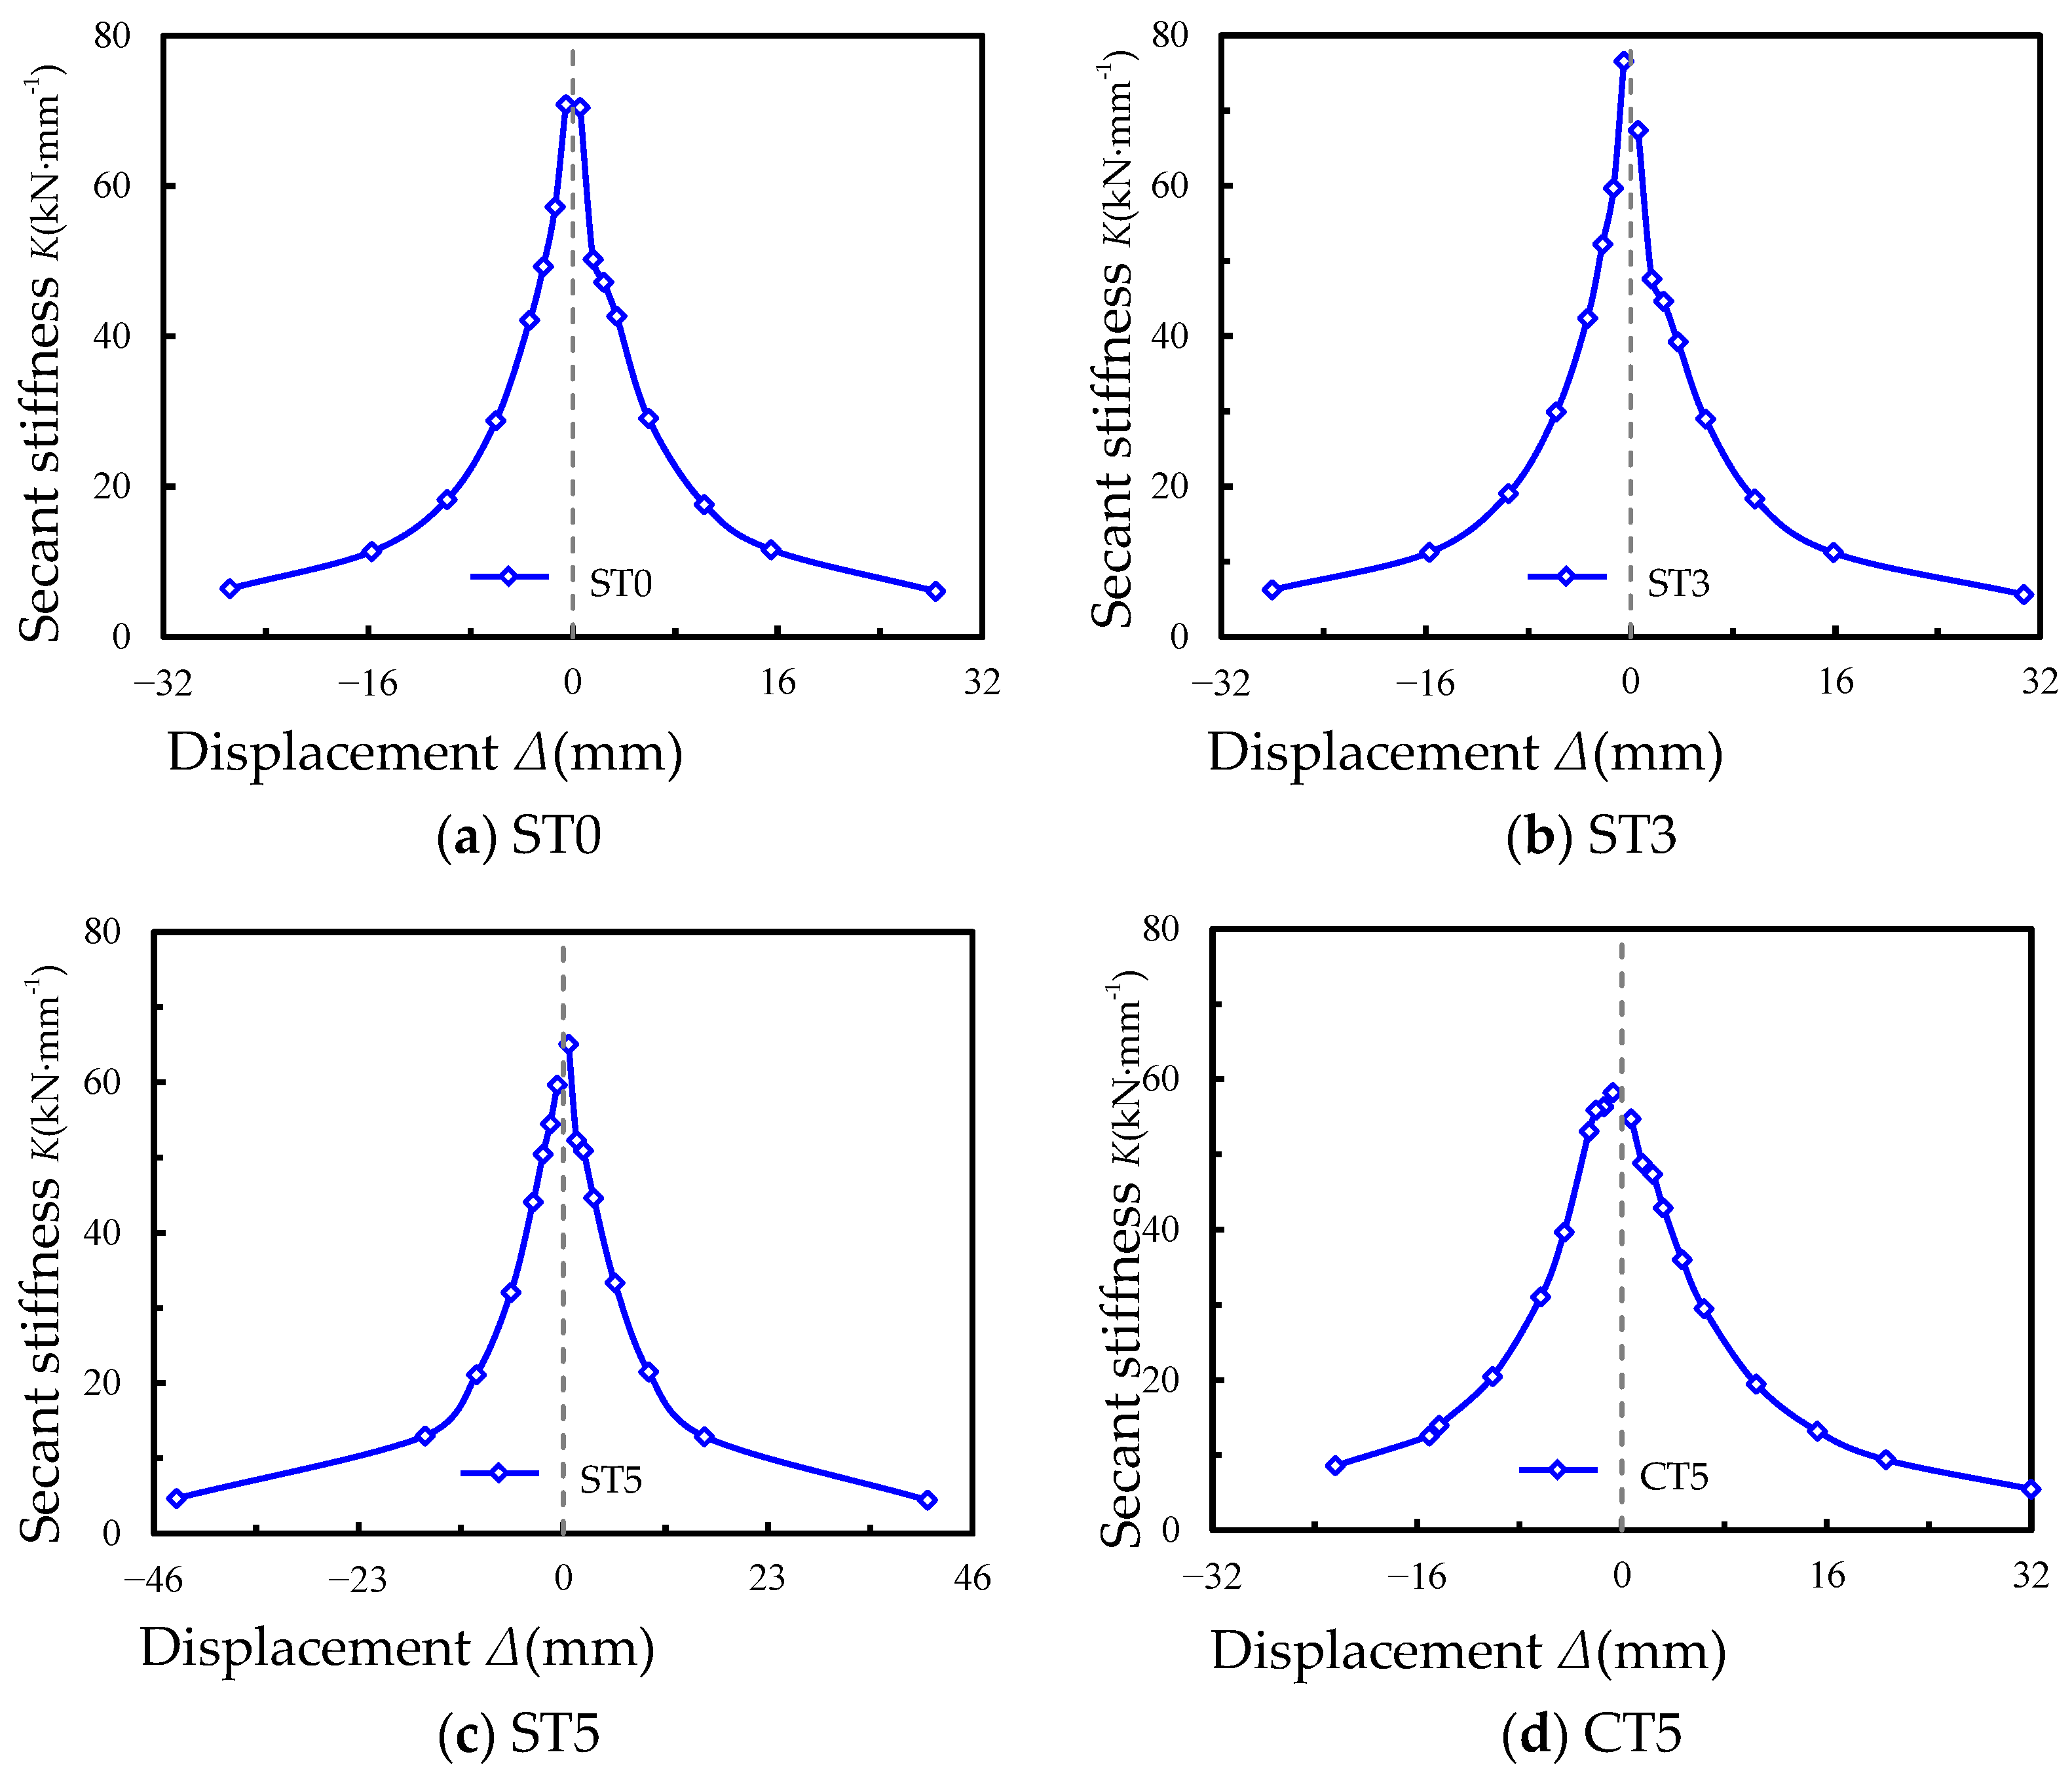
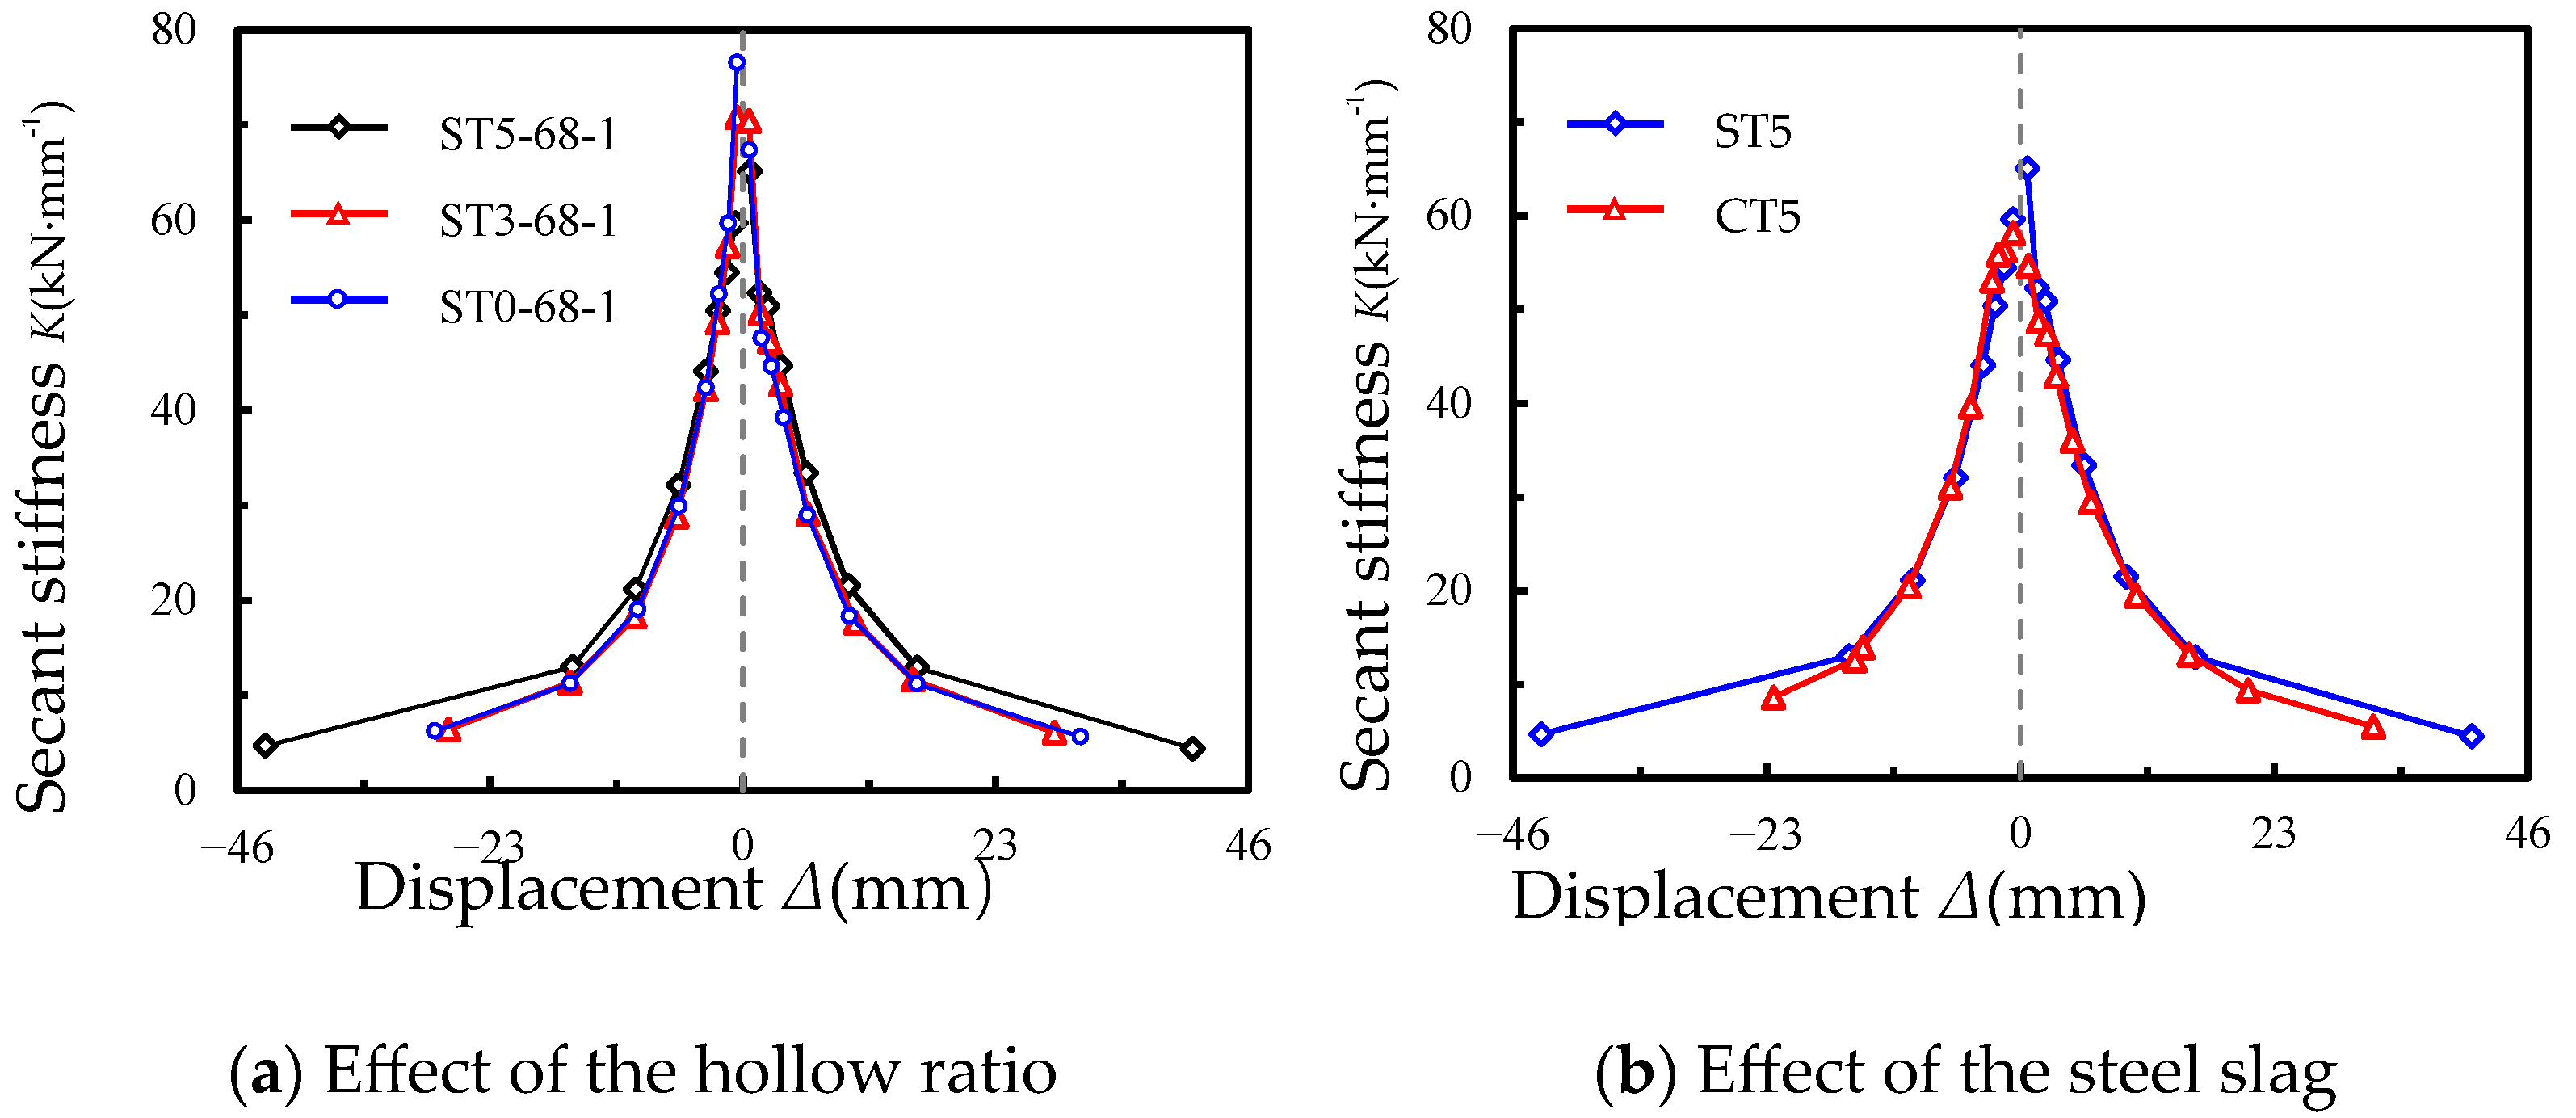
3.3. Stiffness Degradation

In this paper, the stiffness can be expressed by the secant stiffness of the peak point of the hysteresis ring. The average secant stiffness of each loading stage is calculated by the following Formula (1) [25].
K i = i = 1 j N j i i = 1 j Δ j i
where Ki is the secant stiffness under the i-th cycle and Nji, Δji is the i-th cycle peak load and peak displacement at j-level loading.
The stiffness degradation curve of each specimen is shown in Figure 11. It can be seen from Figure 11 that the trend and shape of the stiffness degradation curve of each specimen is almost identical and the stiffness degradation curve is relatively symmetrical. The stiffness degradation curves show that the stiffness decreases with the increase of loading displacement. The stiffness degradation is fast in the early stage and slower in the late loading stage. The interaction between the steel tube and concrete makes the failure of the concrete inside steel tube change from brittle failure to plastic failure; therefore, the stiffness degradation is slower in the late loading stage.
At the beginning of loading, the stiffness degradation curves almost coincide (see Figure 11). Furthermore, the hollow rate increases to 0.5 and the stiffness degradation curve of the early stage coincides; however, the stiffness degrades more slowly (see Figure 12a). It can be seen from Figure 12b that the steel slag concrete has a greater stiffness in the plastic stage and wider stiffness degradation range than ordinary concrete.

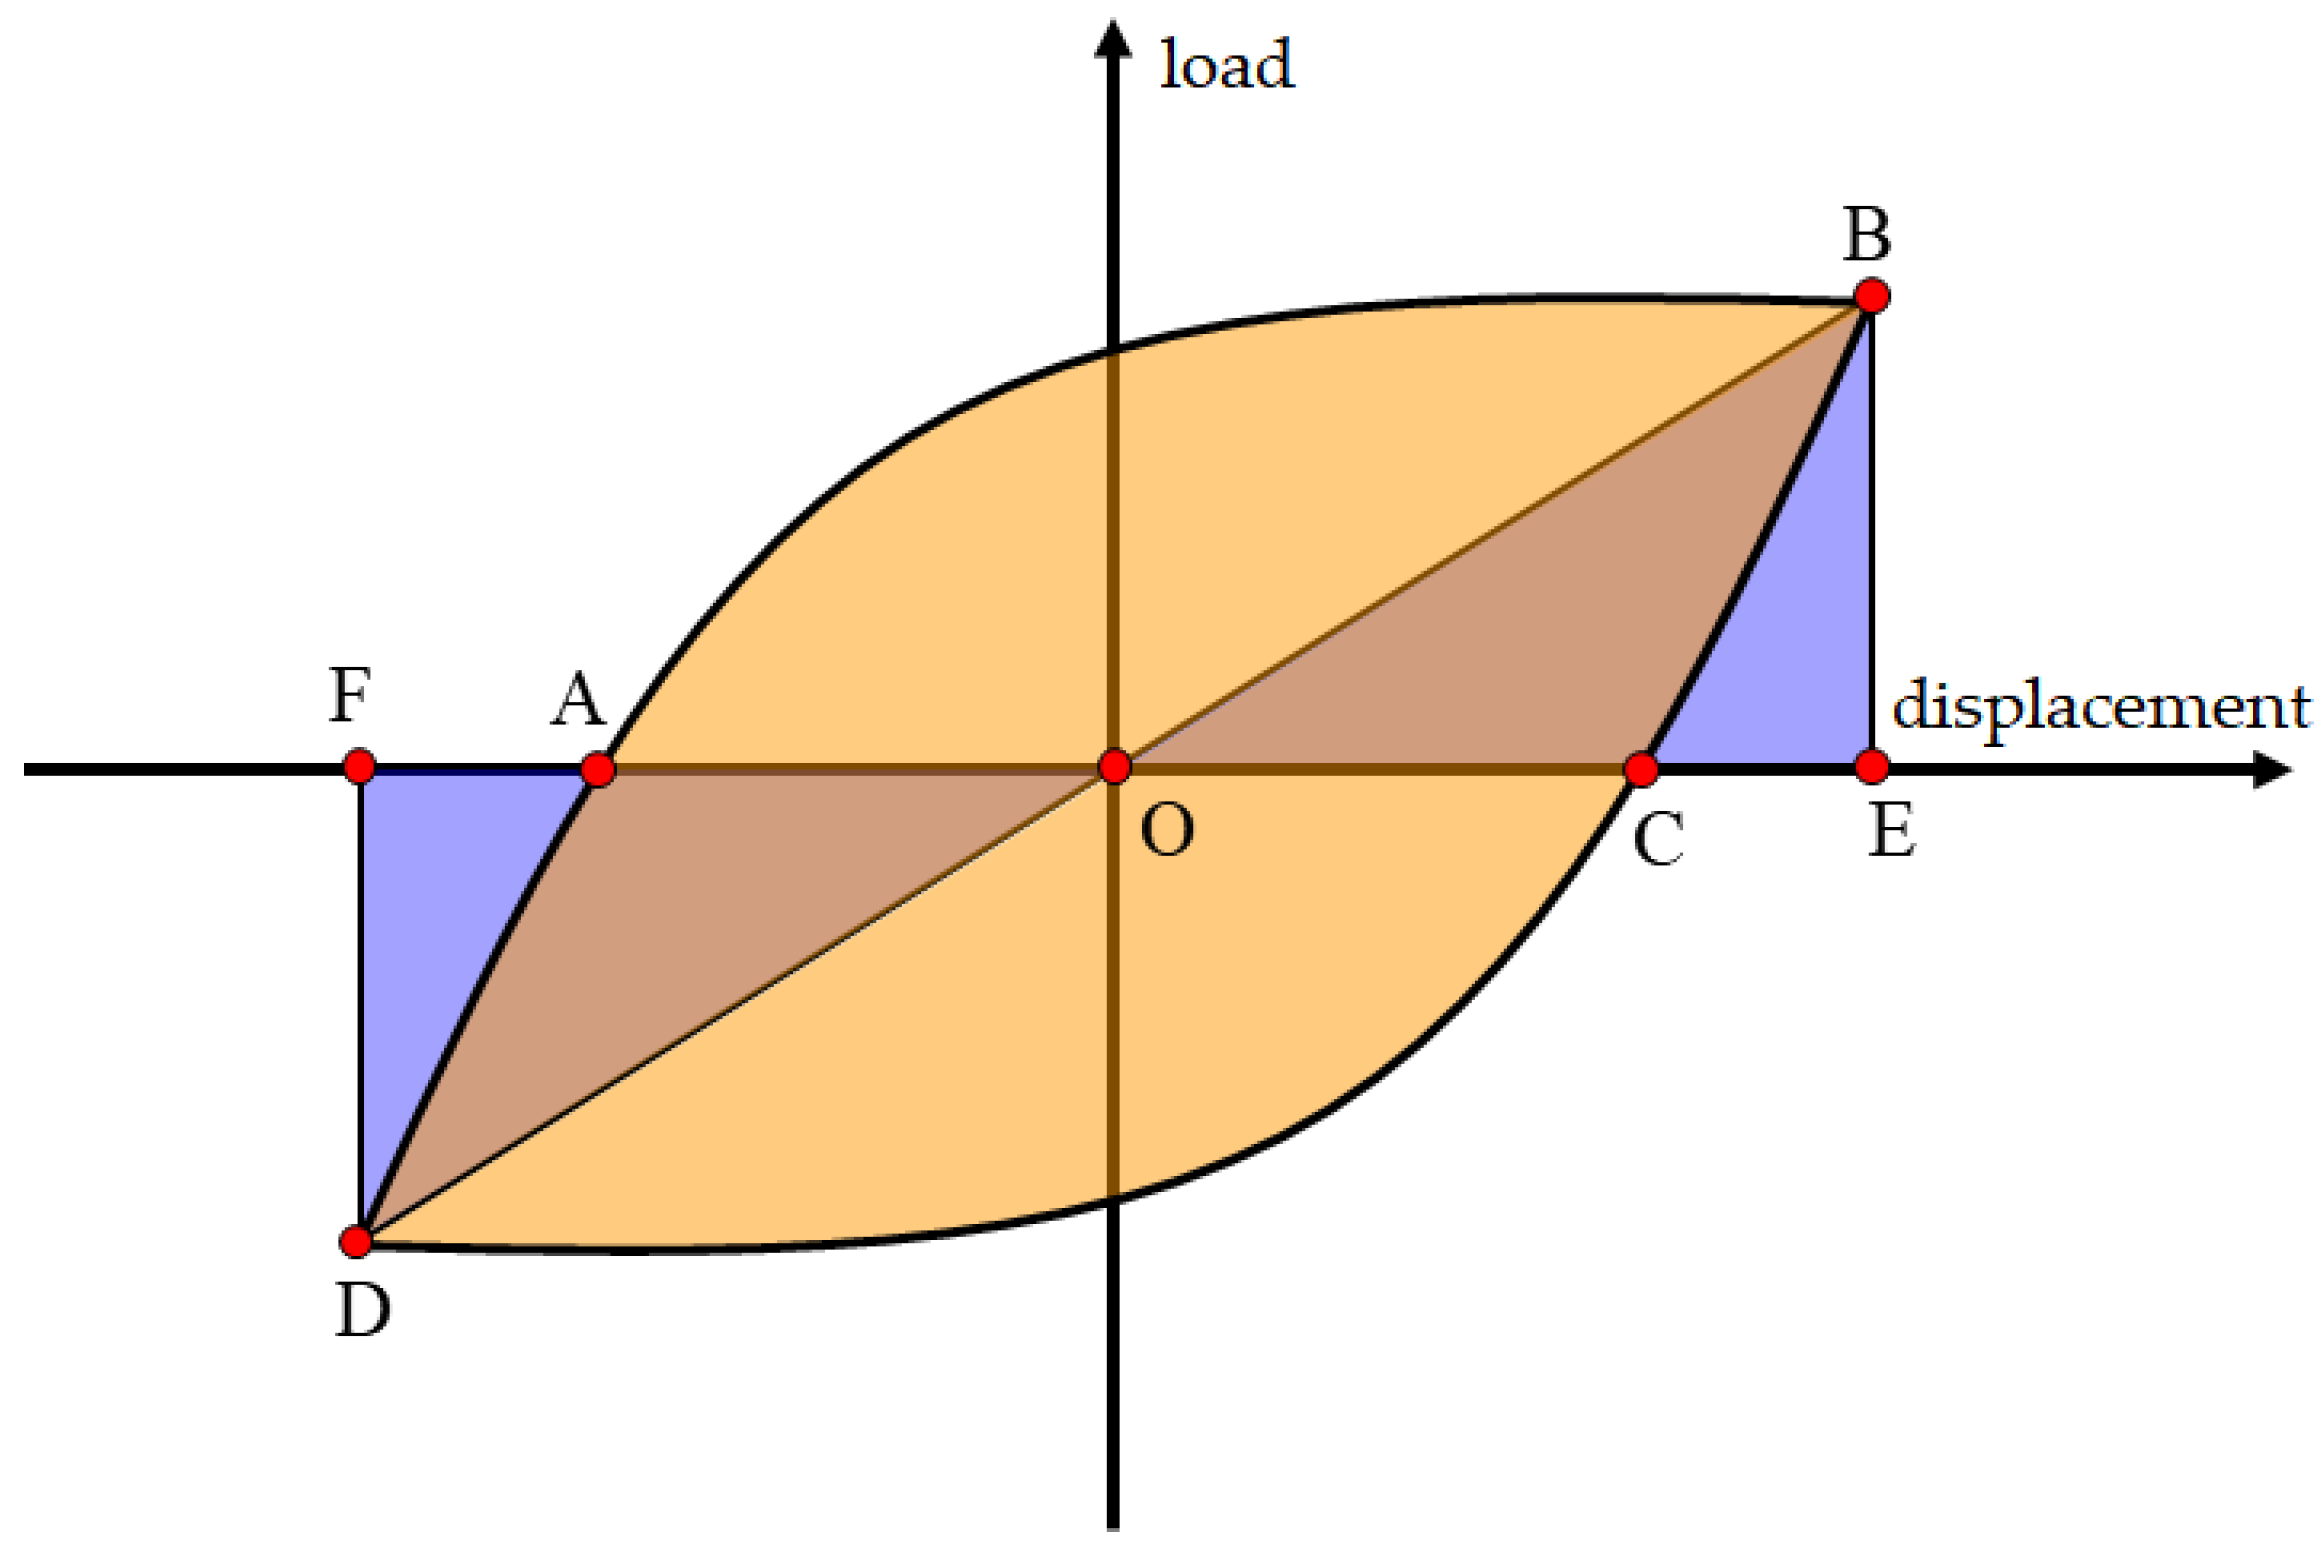
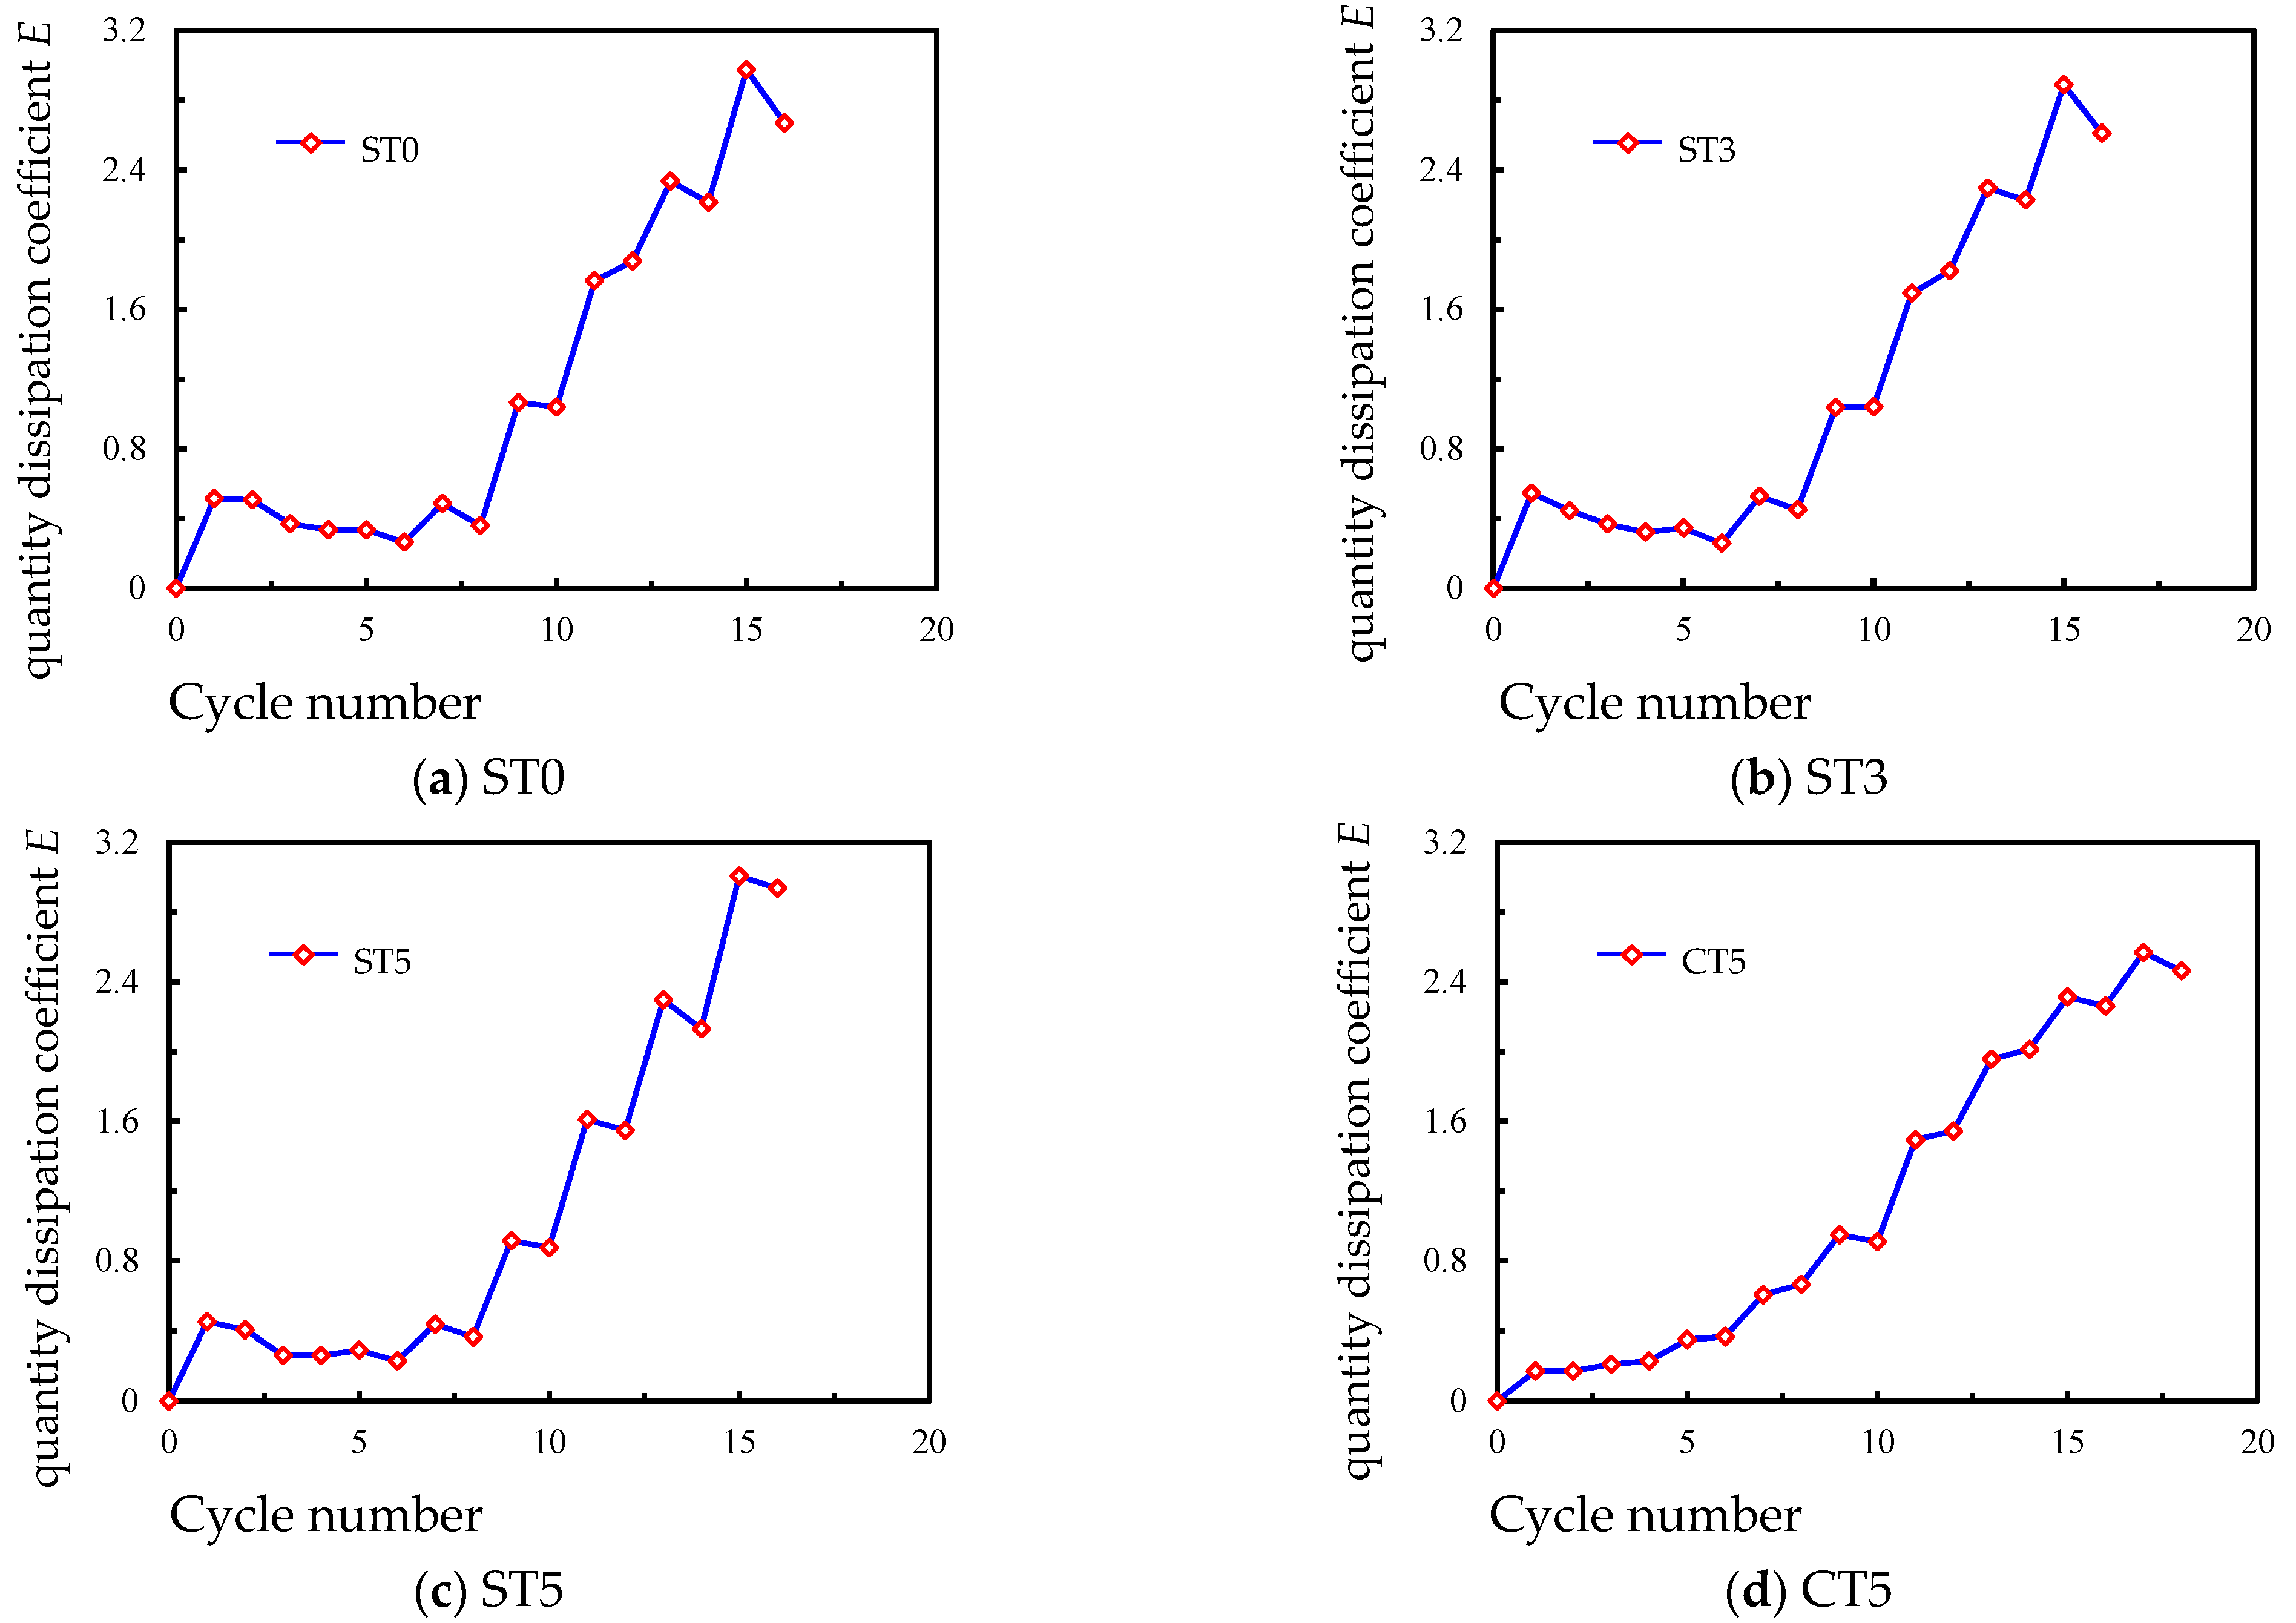
3.4. Energy Dissipation
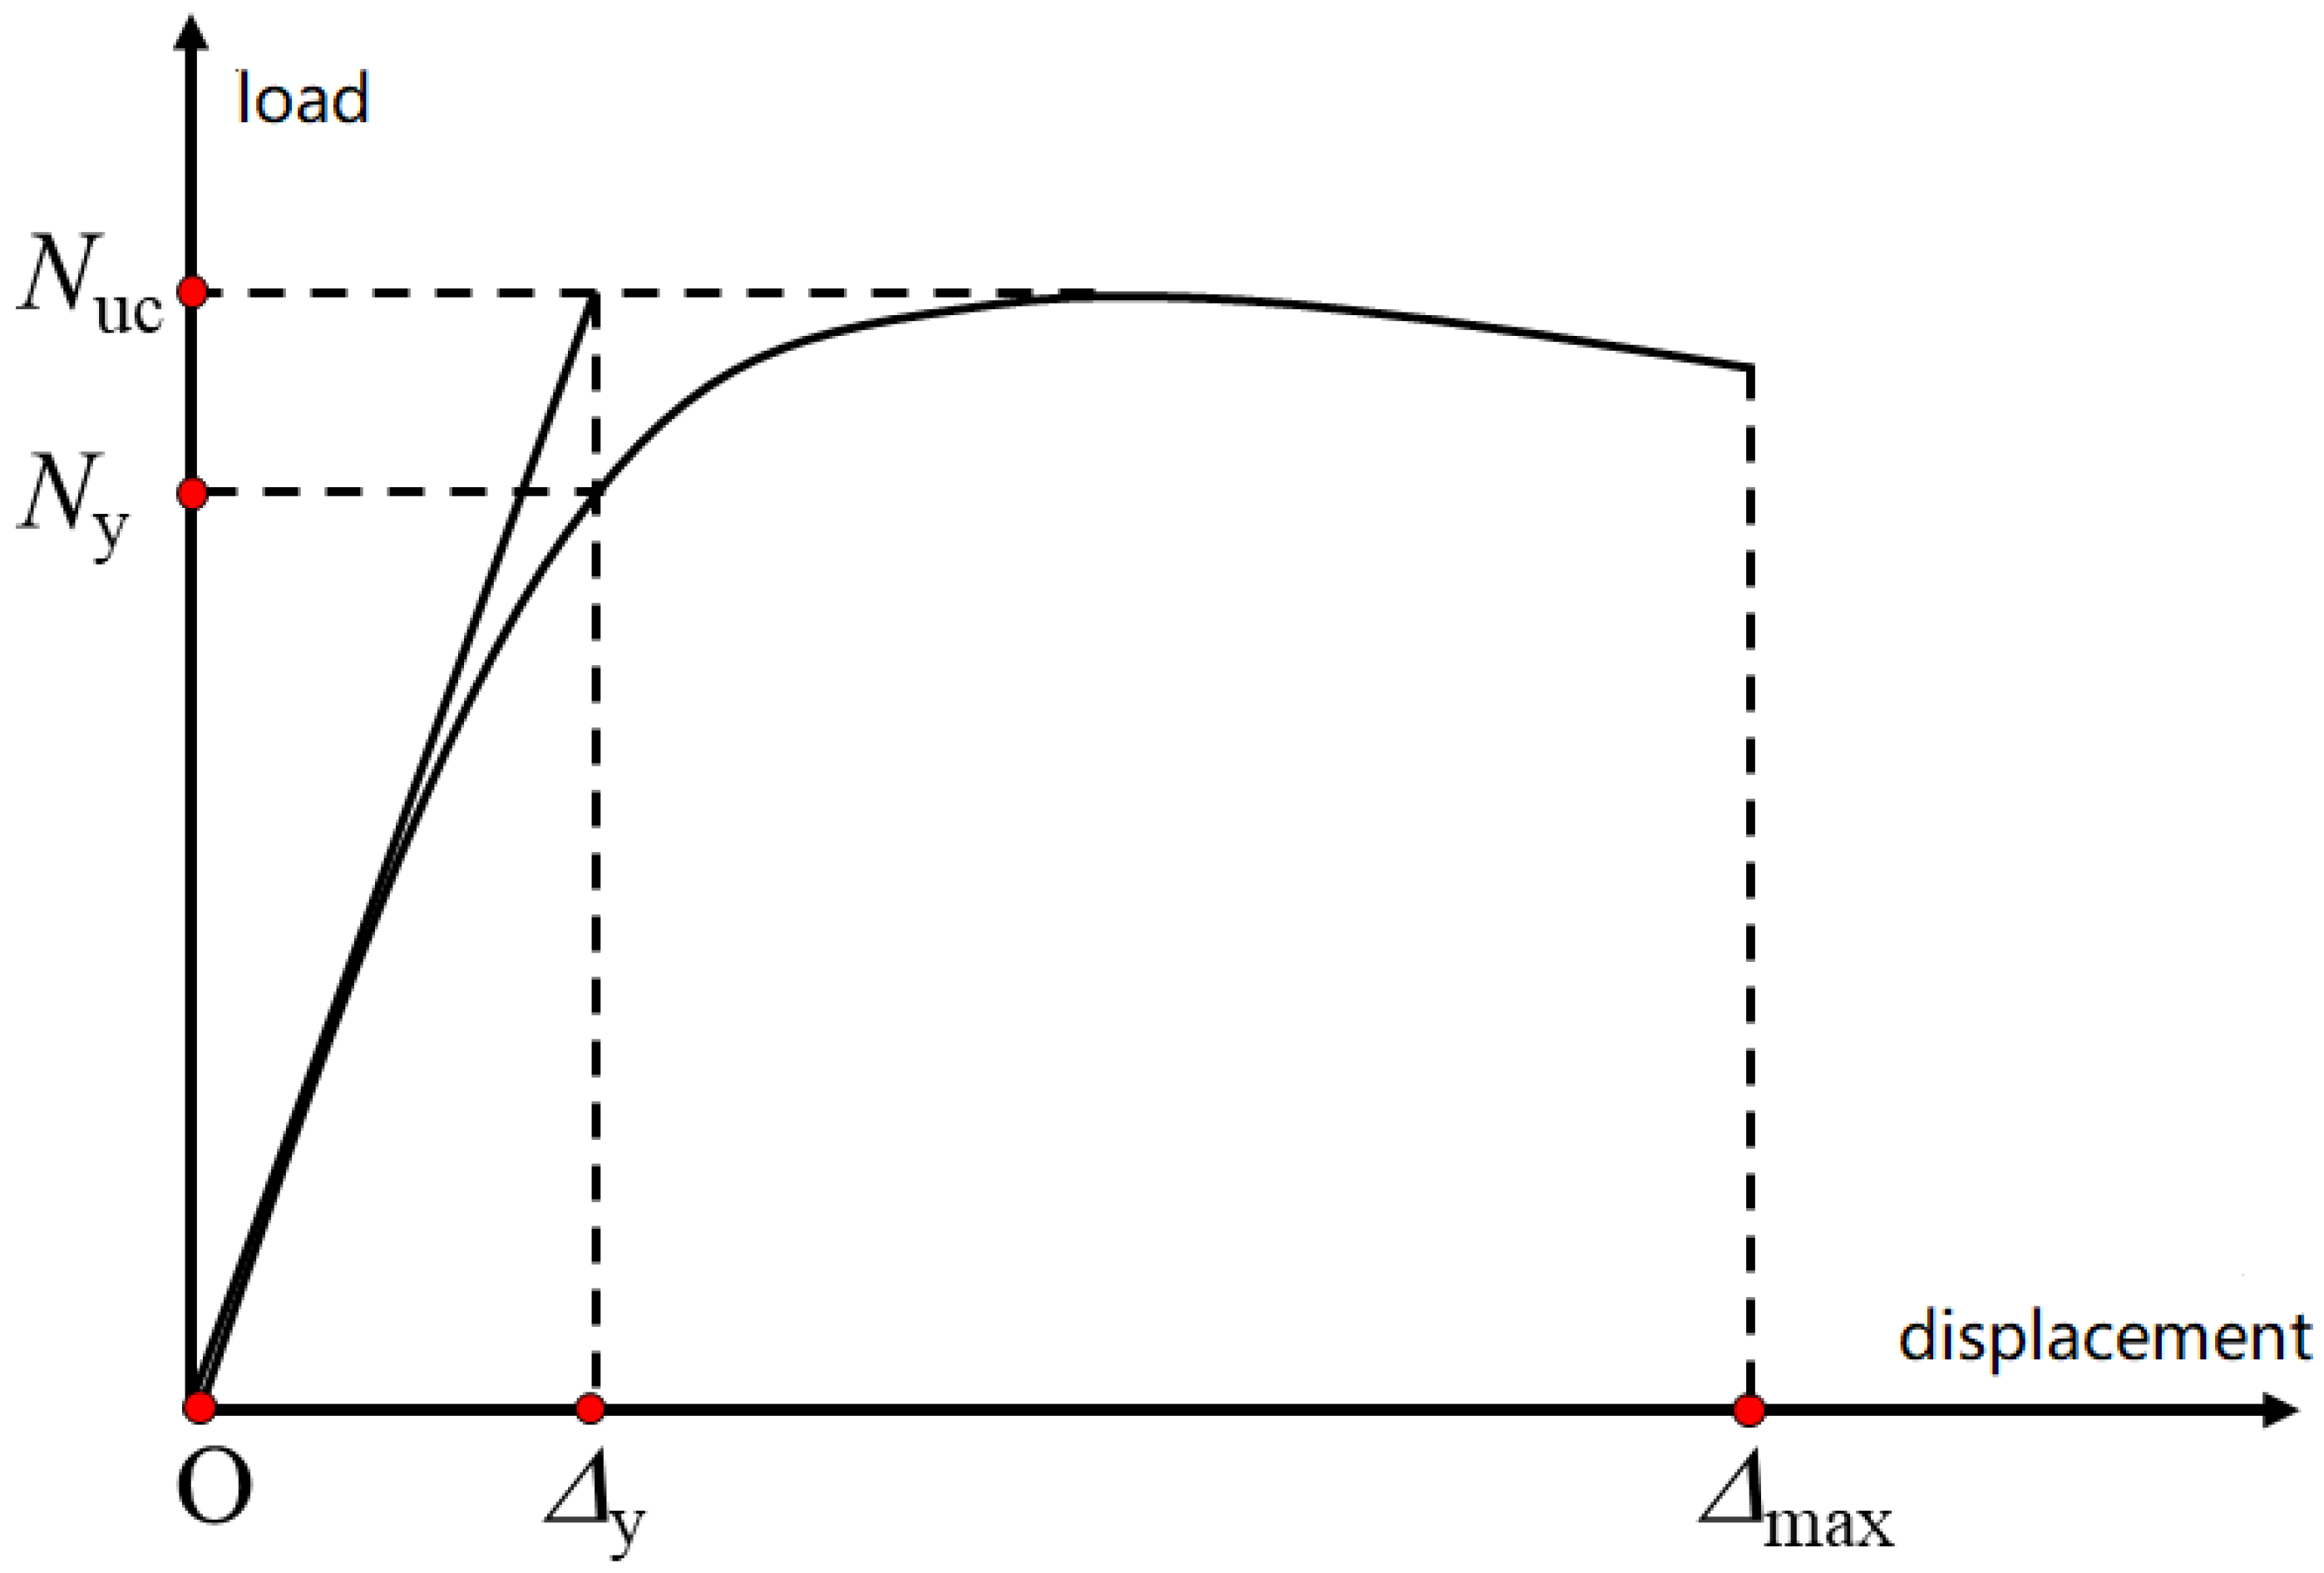
The cumulative energy dissipation coefficient E is a key index of structural energy dissipation capacity, and it can be calculated by the following Formula (2) [25].
E = S ( A B C + C D A ) S ( O B E + O D F )
where SABCD represents the hysteresis loop area, as shown in Figure 13, and SOBE and SODF represent the areas of the triangles ΔOBE and ΔODF.
In this experiment, the quantity dissipation coefficient (E)-cycle (n) curve is used to describe the energy dissipation characteristics of the specimens. Figure 14 shows the quantity dissipation coefficient of the specimens during loading. It can be seen from Figure 14 that the trend and shape of the quantity dissipation coefficient of each specimen are almost identical. It decreases slightly in the early stage and rises rapidly in the late stage. Using the same loading level, the quantity dissipation coefficient obtained by the second cycle loading calculation is less than that of the first loading calculation. The joints have a good energy dissipation capacity with about a 3.0 quantity dissipation coefficient.

3.5. Ductility

In general, the ductility coefficient is used to reflect the strength of the structure’s ductility. The displacement ductility coefficient is defined in the following equation [25].
μ = Δ max Δ y
Table 8 lists the displacement ductility coefficient of the joints during loading. It can be seen from Table 8 that the displacement ductility coefficient of the joints is increased, with the hollow ratio of the CFDST chord increasing from 0 to 0.5. The displacement ductility coefficient of the specimens could be improved by more than 50% by filling steel slag concrete with the 0.5 hollow ratio of the CFDST chord.

4. Finite Element Analysis

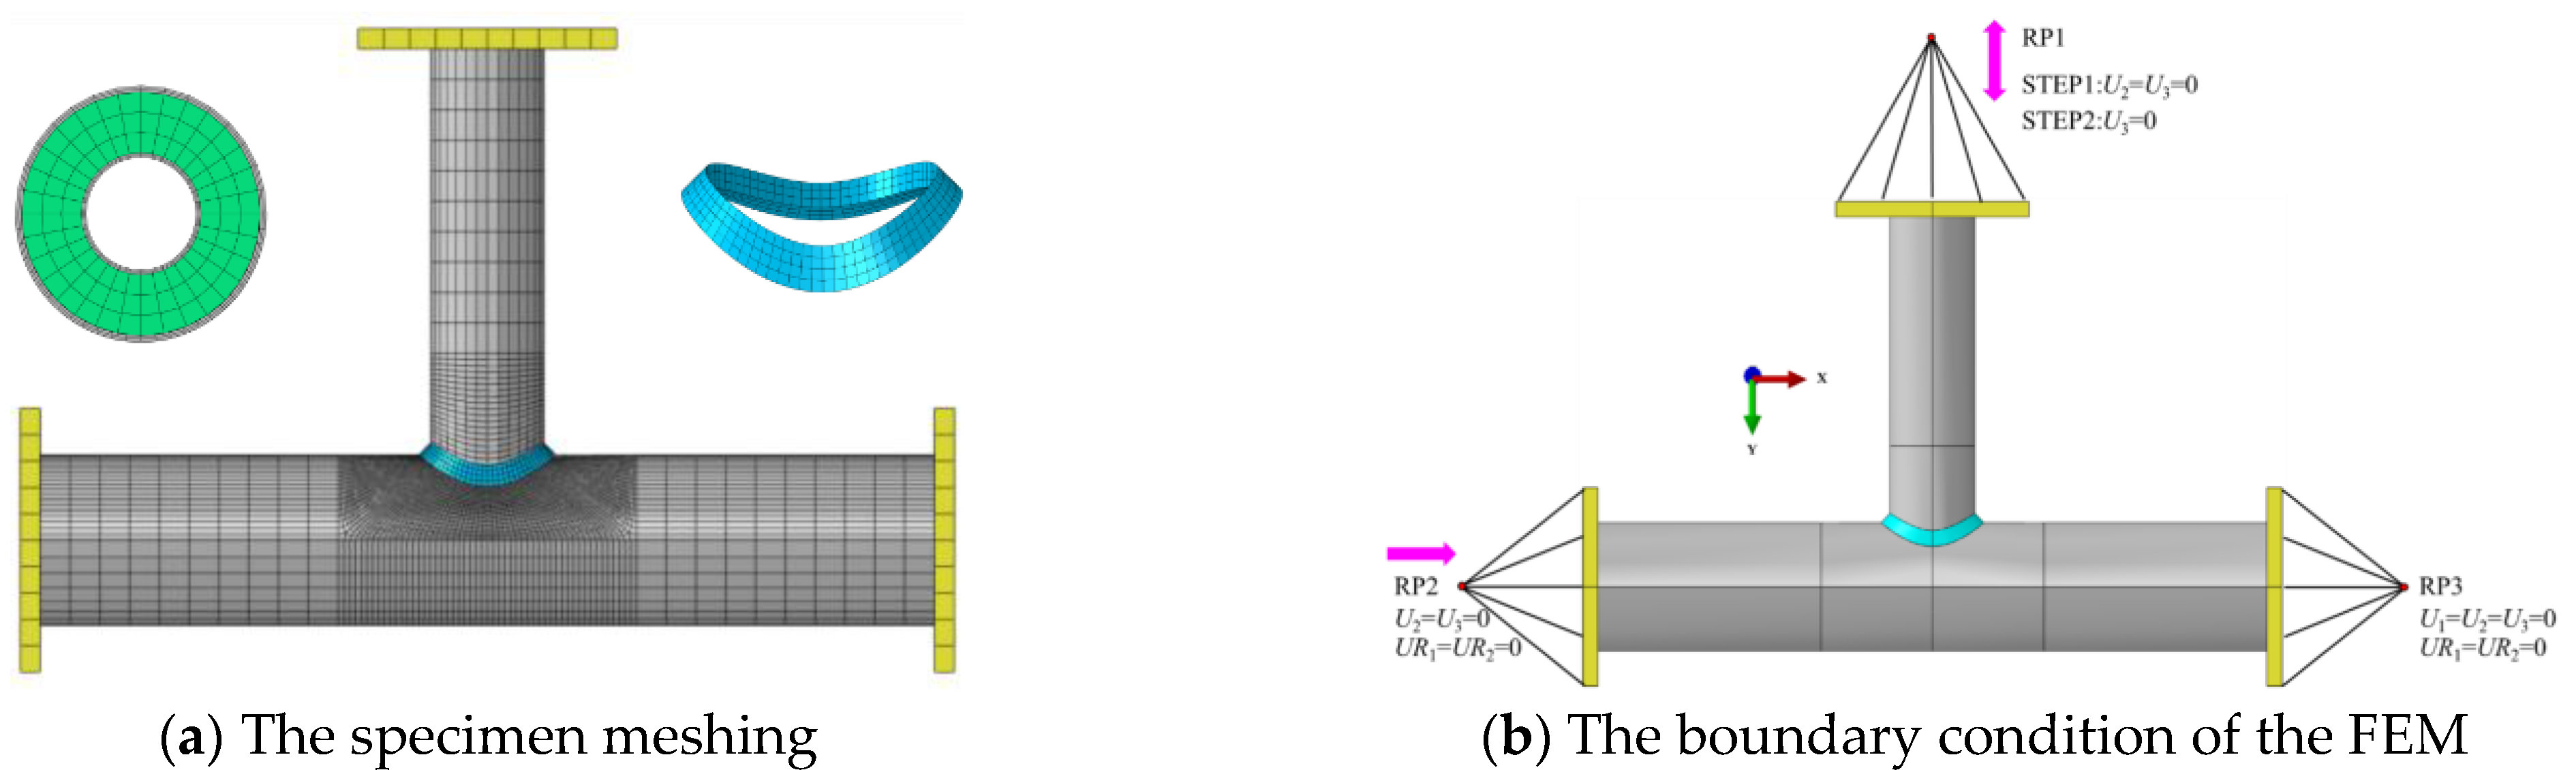
4.1. Finite Element Model

In order to analyze the stress development and failure mechanism of the steel slag CFDST T-joint in detail, a finite element model (FEM) was established with Abaqus software, as shown in Figure 15. The steel tube and concrete were modelled using the C3D8R brick elements. The uniaxial stress–strain relationship of concrete adopts the relationship proposed by Han [26]. The dimension and boundary conditions of the model are the same as the experimental specimens.

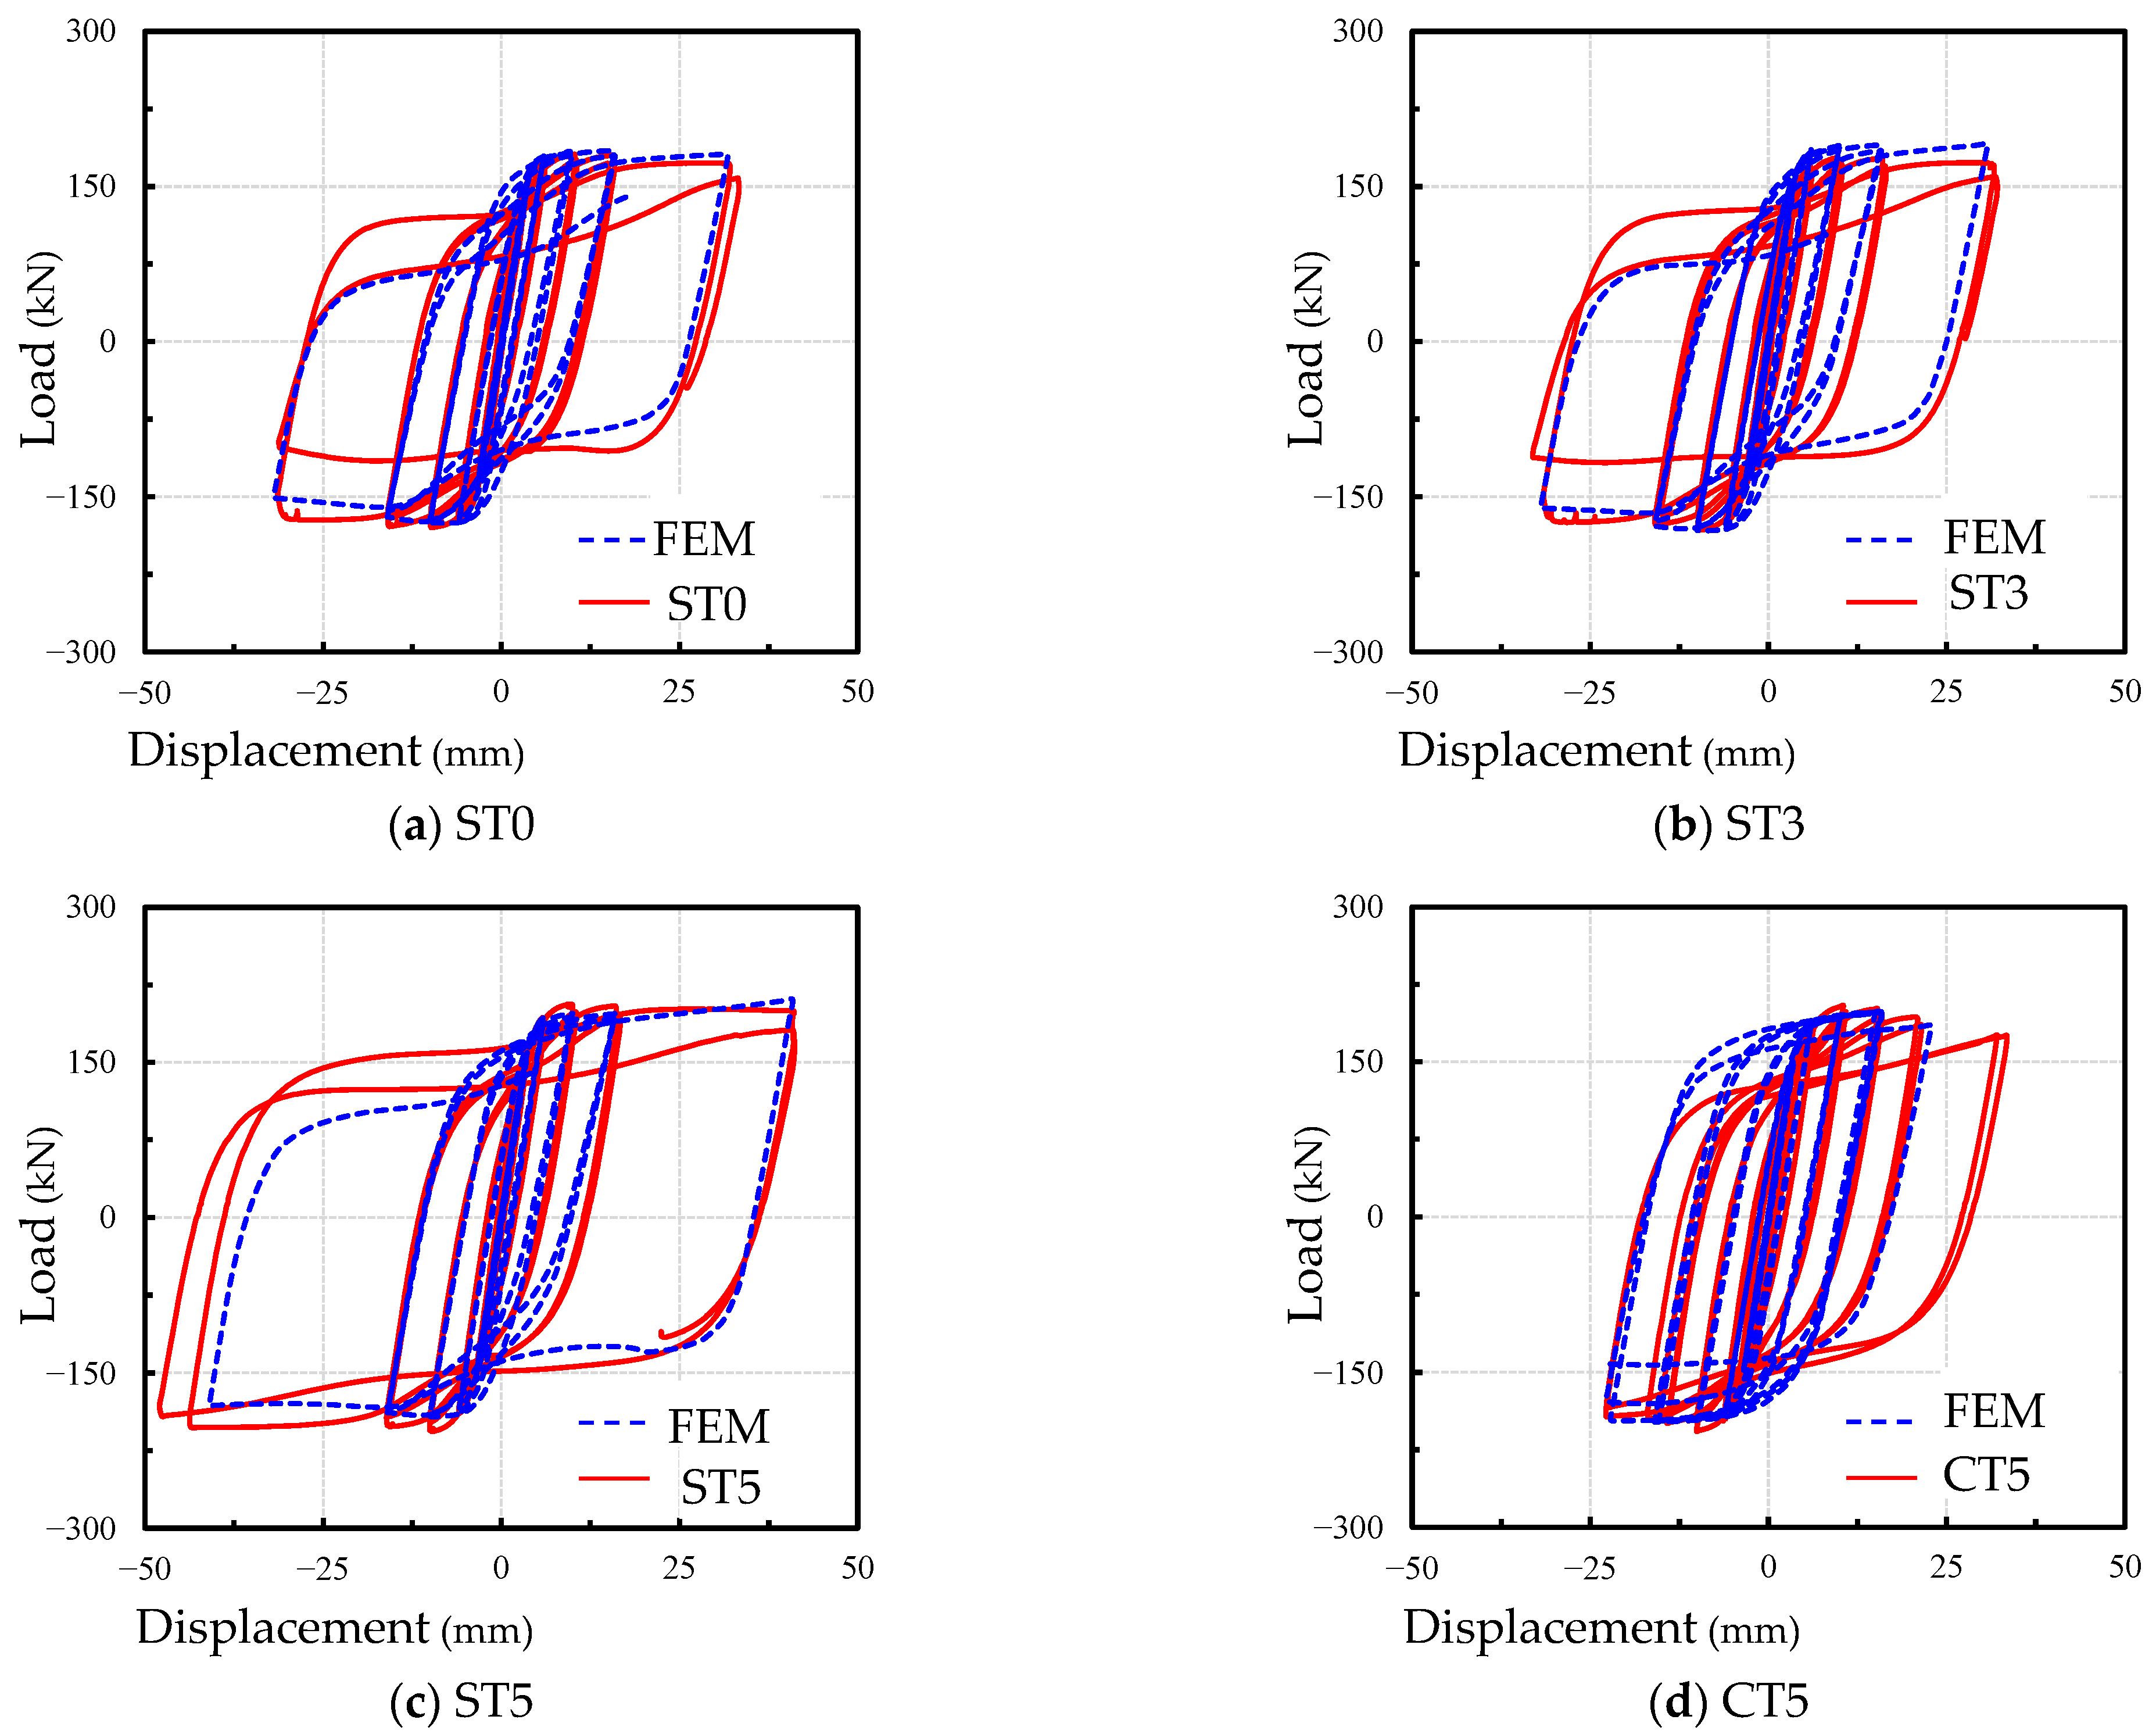
4.2. Verification of the Finite Element Model

The comparison between the FEM results and the experimental results is shown in Figure 16. It can be seen that the stiffness and ultimate bearing capacity of the FEM and experimental specimens are generally consistent with each other.

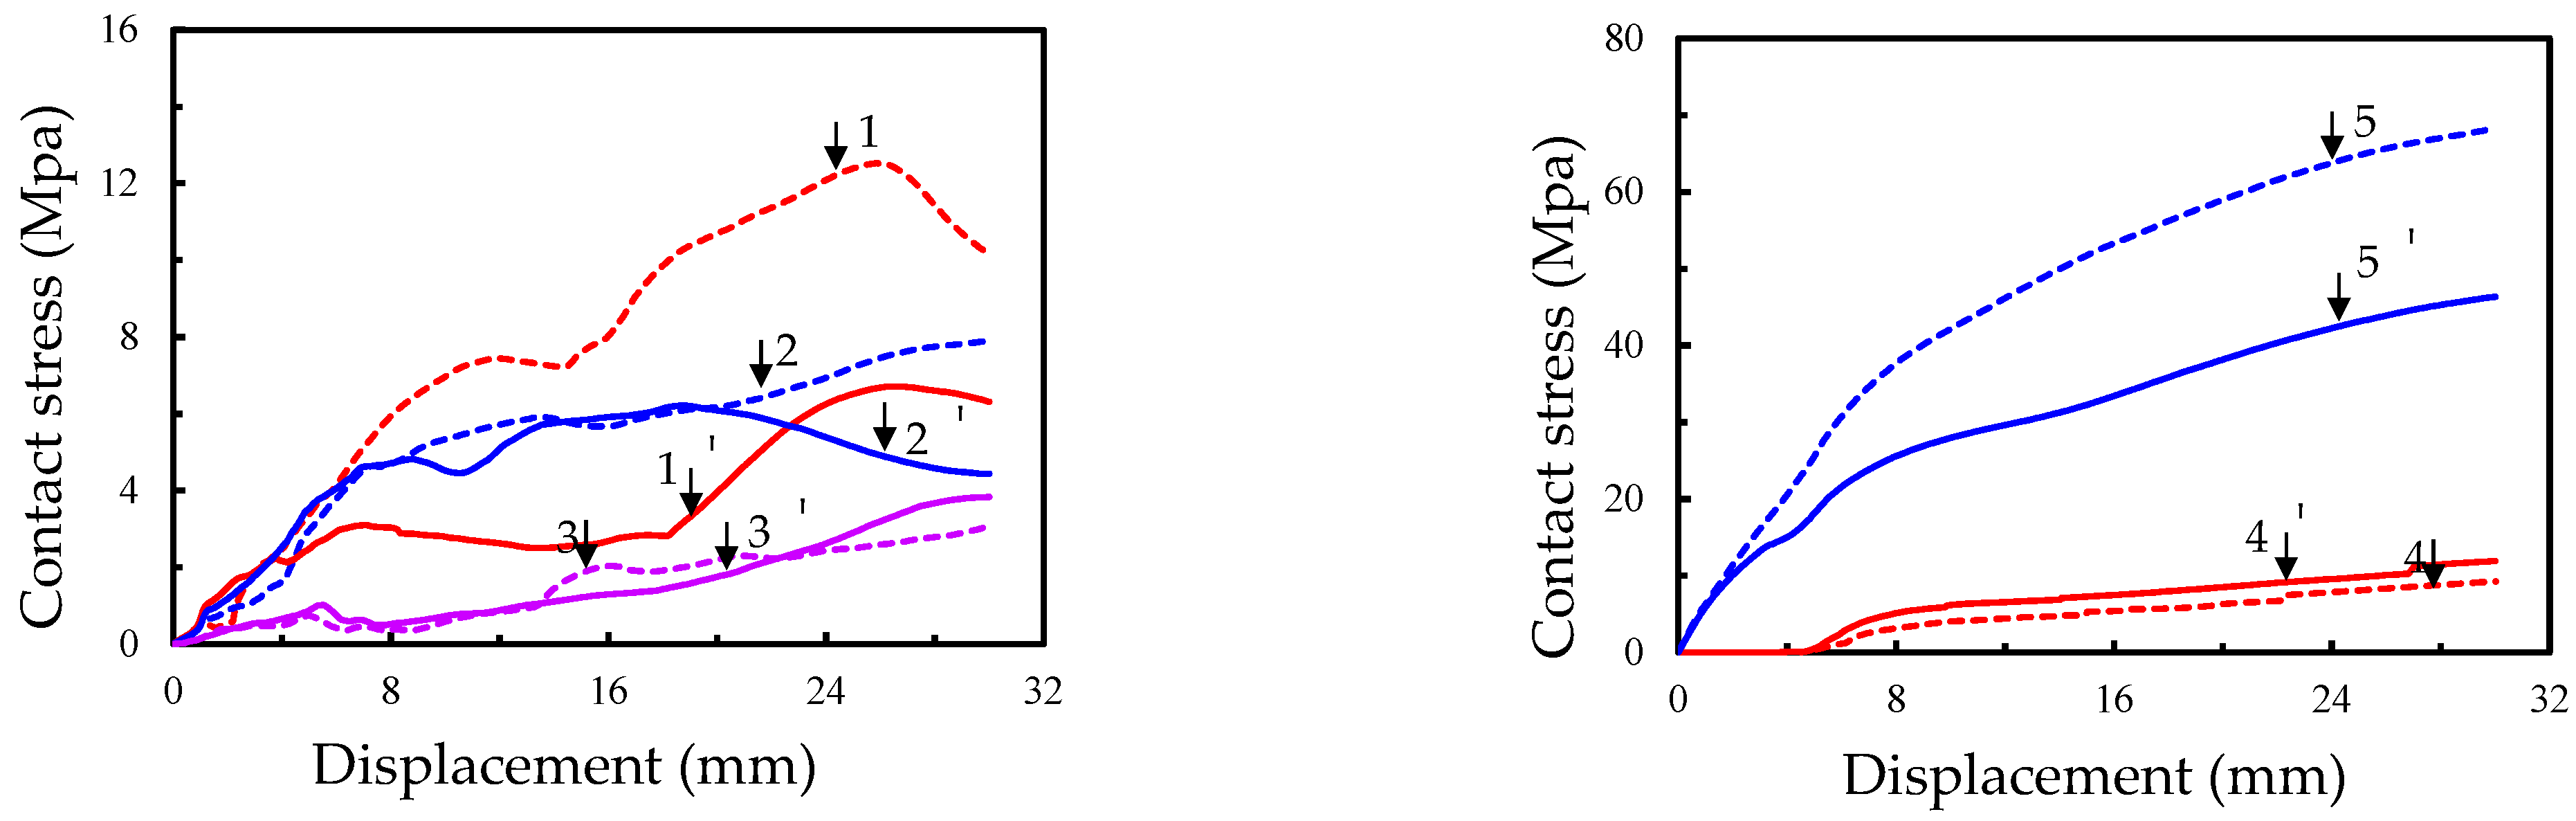
4.3. Failure Mechanism Analysis

From the experimental results above, there are two failure modes, with those being the main pipe fracture and joint area compression-bending failures. In order to clarify the failure mechanisms of the two typical failure modes, the ST3 specimen is considered to be the typical specimen for fracture failure and the ST5 specimen is considered to be the typical specimen for joint area compression-bending failure. Figure 17 shows the comparison of the failure modes between the two typical specimens from the FEM results and the experimental results. It can be seen that the failure modes between the FEM and experimental specimens are generally consistent with each other.
In order to analyze the contact stress development of the CFDST T-joint under the two modes of failure, the location of the span center section is studied, as shown in Figure 18. The contact stress development is shown in Figure 19. As shown in Figure 19, the contact stress with large hollow ratio distribution is more uniform, while for the specimens without hollow ratio, the stress is easier to concentrate. The reason for this is that the inter-reaction between the concrete and steel tube work better with a large hollow ratio. The location of the crown section is studied, as shown in Figure 20. The contact stress development is shown in Figure 21. As shown in Figure 21, the contact stress of the crown section is the stress concentration. The stress concentration at the crown point with the small hollow specimen is more serious. The failure mechanism of the steel slag CFDST T-joint concerns the stress concentration, leading to damage of the concrete and weakening effective support to the main pipe. Then, the main pipe will bear increasing stress until fracture. However, the stress concentration with the large hollow ratio specimen is not obvious. Therefore, the concrete will be damaged later, allowing the concrete to continue to provide good support for the main pipe in the later stages, with the final failure mode being compression-bending failure.

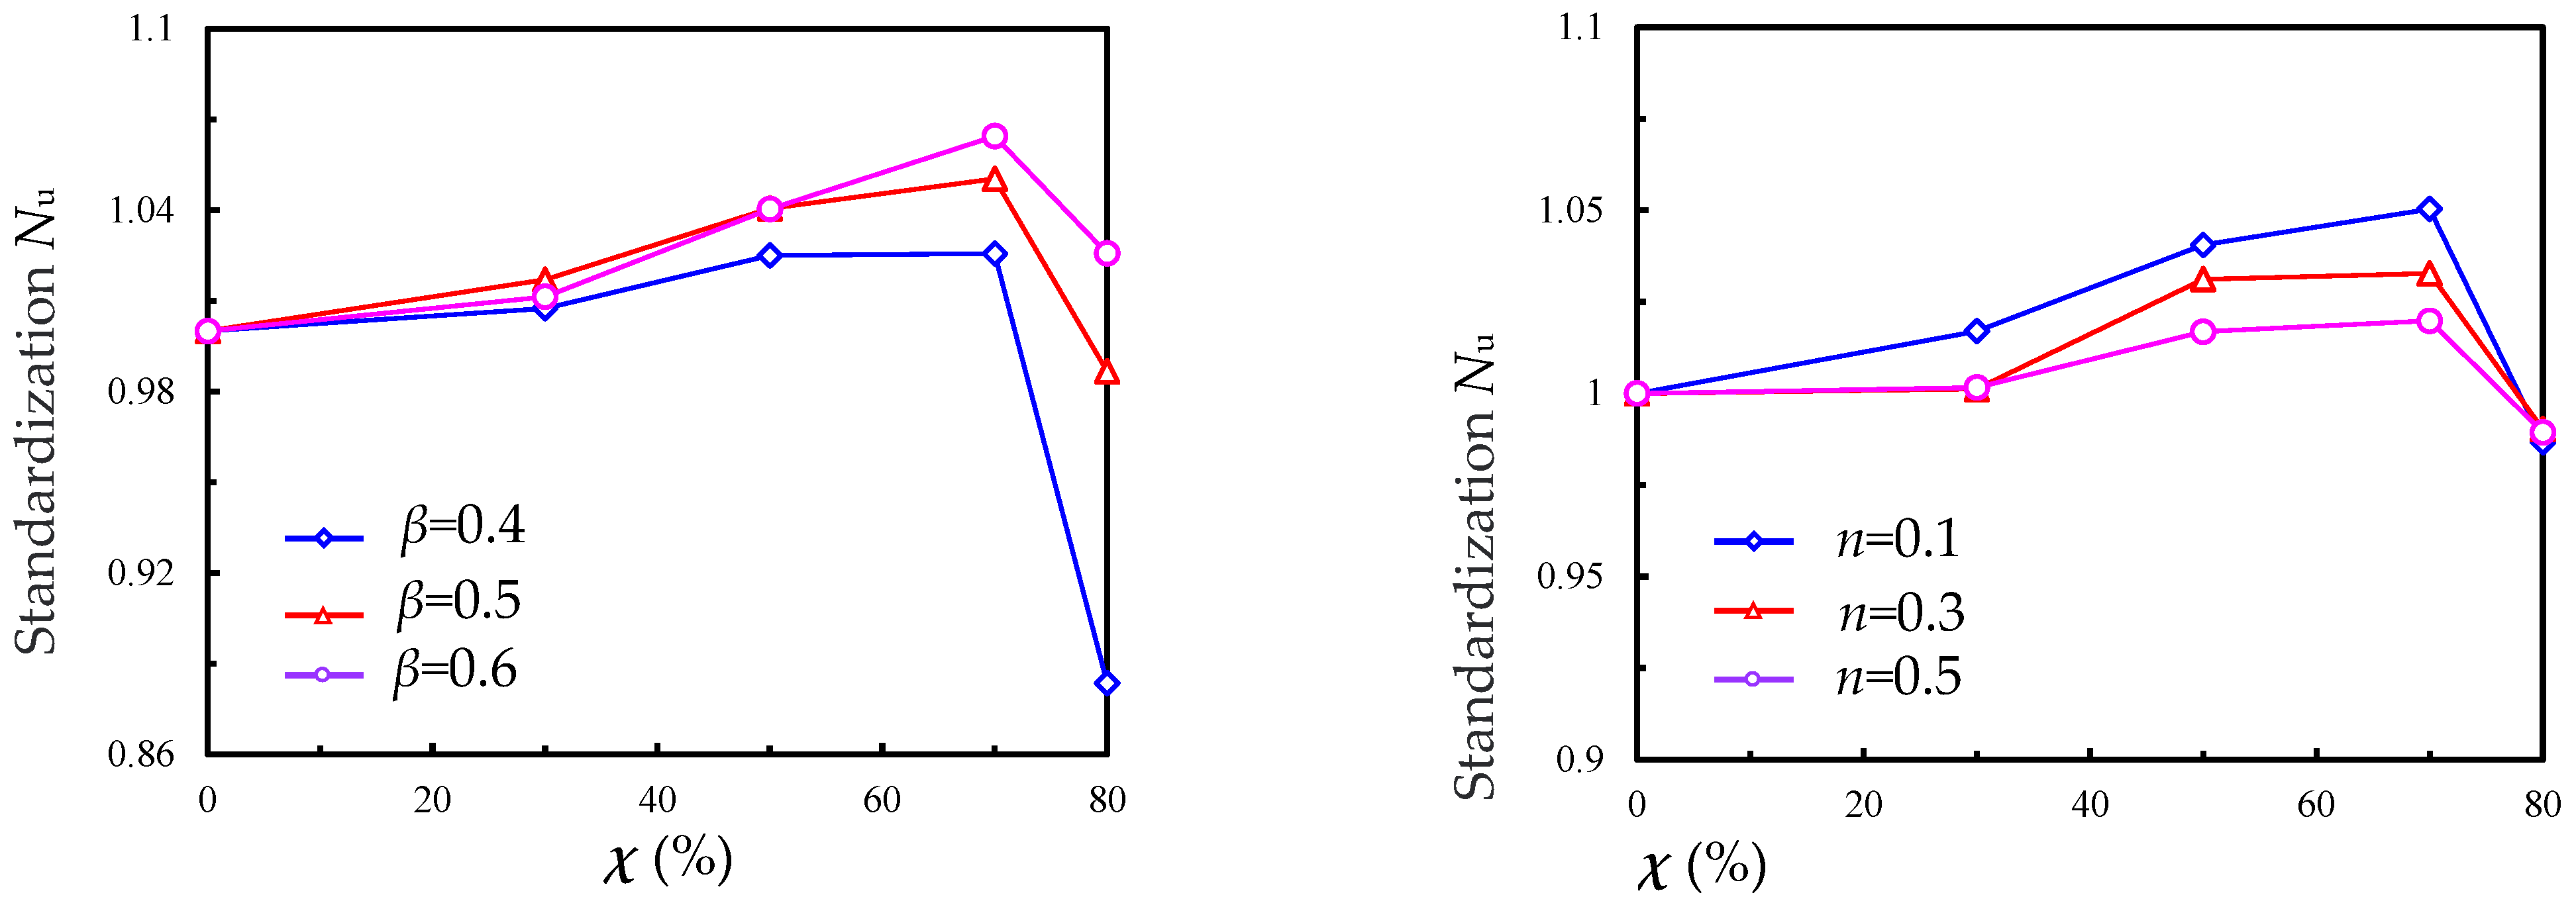
4.4. Parameter Analysis

The finite element models were established to analyze the effect of the hollow ratio, axial compression ratio and brace-to-main pipe diameter ratio. The bearing capacity Nu of the CFDST T-joint specimens with different parameters calculated by the finite element models are shown in Table 9.
Figure 22 shows the standardization Nu of the parameters with the benchmark result. It can be seen that the bearing capacity of the specimens are increased with increases in the hollow ratio while the hollow ratio is below 70%. The bearing capacity of the specimens are decreased with increases in the hollow ratio when the hollow ratio is above 70%. According to the parameter analysis in this paper, the optimal hollow ratio is 70%. The reason for this is that when the hollow ratio is too large, the filled concrete will be damaged and unable to provide effective support before the steel tube reaches its ultimate strength.

5. Conclusions

The seismic performance of the steel slag CFDST T-joint subjected to cyclic axial loading was investigated. Three parameters, including the effect of the hollow ratio, axial compression ratio and brace-to-main pipe diameter ratio, were considered. The following conclusions can be drawn from the analysis of the experimental results.
(1)
The analysis shows that the ultimate capacity of the specimens could be improved with 54% displacement by filling steel slag concrete with a 0.5 hollow ratio of the CFDST main pipe.
(2)
There are two failure modes for the CFDST T-joint specimens, with those being the main pipe fracture and joint area compression-bending failure. The hysteresis curves of all specimens have a full fusiform shape and good energy dissipation capacity.
(3)
The steel slag CFDST T-joint provided in this paper that generated the displacement ductility coefficient results is strongly encouraged. The steel slag used in the structure can promote the reuse of solid waste and reduce project costs.
(4)
The bearing capacity of CFDST T-joint specimens with different parameters calculated by the finite element models shows that the optimal hollow ratio is 70%. Further research should be conducted on the effect of different parameters, including the strength of materials and so on.

Author Contributions

Conceptualization, W.Z.; methodology, W.Z.; software, M.F.; validation, W.Z.; formal analysis, W.W.; investigation, Y.L.; resources, M.F.; data curation, M.F.; writing—original draft preparation, W.Z.; writing—review and editing, W.Z.; visualization, H.Z.; supervision, W.W.; project administration, W.Z.; funding acquisition, W.Z. All authors have read and agreed to the published version of the manuscript.

Funding

This research was funded by the Department of Science and Technology, Fujian Province, China (grant number: No. 2020J01389; 2022J011185).

Institutional Review Board Statement

Not applicable.

Informed Consent Statement

Not applicable.

Data Availability Statement

Data are contained within the article.

Conflicts of Interest

The authors declare no conflict of interest.

References

  1. Rashad, A. A synopsis manual about recycling steel slag as a cementitious material. J. Mater. Res. Technol. 2019, 8, 4940–4955. [Google Scholar] [CrossRef]
  2. Song, Q.; Guo, M.Z.; Wang, L.; Ling, T.C. Use of steel slag as sustainable construction materials: A review of accelerated carbonation treatment. Resour. Conserv. Recycl. 2021, 173, 105740. [Google Scholar] [CrossRef]
  3. Tian, E.; Liu, Y.; Cheng, X.; Zeng, W. Characteristics of Pavement Cement Concrete Incorporating Steel Slag Powder. Adv. Mater. Sci. Eng. 2022, 2022, 6360301. [Google Scholar] [CrossRef]
  4. Li, L.; Ling, T.C.; Pan, S.Y. Environmental benefit assessment of steel slag utilization and carbonation: A systematic review. Sci. Total Environ. 2022, 806, 150280. [Google Scholar] [CrossRef] [PubMed]
  5. Wang, Q.; Kang, Q.; Cao, P. Flexural Strength for Negative Bending and Vertical Shear Strength of Composite Steel Slag-Concrete Beams. Adv. Steel Struct. 1999, 1, 385–389. [Google Scholar]
  6. Qasrawi, H.; Shalabi, F.; Asi, I. Use of low CaO unprocessed steel slag in concrete as fine aggregate. Constr. Build. Mater. 2009, 23, 1118–1125. [Google Scholar] [CrossRef]
  7. Hai, Y.; Zhan, Q.; Xiao, Y. Optimization of Mineralization Curing System for Efficient and Safe Utilization of Steel Slag Wastes. J. Wuhan Univ. Technol. Mater 2022, 37, 595–602. [Google Scholar]
  8. Calmon, J. Effects of BOF steel slag and other cementitious materials on the rheological properties of self-compacting cement pastes. Constr. Build. Mater. 2013, 40, 1046–1053. [Google Scholar] [CrossRef]
  9. Han, L.; Li, W.; Bjorhovde, R. Developments and advanced applications of concrete-filled steel tubular (CFST) structures: Members. J. Constr. Steel Res. 2014, 100, 211–228. [Google Scholar] [CrossRef]
  10. Han, L.; Lam, D.; Nethercot, D. Design Guide for Concrete-Filled Double Skin Steel Tubular Structures; CRC Press: Boca Raton, FL, USA, 2018; pp. 1–7. [Google Scholar]
  11. Yang, Y.; Shi, C.; Hou, C. Experimental and numerical study on static behaviour of uniplanar cfdst-chs t-joints. J. Constr. Steel Res. 2020, 173, 106250. [Google Scholar] [CrossRef]
  12. Li, W.; Cheng, Y.; Wang, D.; Han, L.; Zhao, X. Behaviour of high-strength cfdst chord to chs brace t-joint: Experiment. Eng. Struct. 2020, 219, 110780. [Google Scholar] [CrossRef]
  13. Wang, D. Fatigue Performance of High-Strength Steel CFDST Chord to CHS Brace T-Joints; Tsinghua University: Beijing, China, 2017. [Google Scholar]
  14. Gao, D. Experimental Study on Hysteretic Behavior of Concrete-Filled Double Skin Tube Overlapped K-Joints; Ningxia University: Ningxia, China, 2018. [Google Scholar]
  15. Ma, Y. Static Behavior of Square Concrete-Filled Double-Skin Steel Tube T-Joints; Dalian University of Technology: Dalian, China, 2018. [Google Scholar]
  16. Shi, C. Static Behavior of Concrete-Filled Double-Skin Steel Tube T-Joints; Dalian University of Technology: Dalian, China, 2019. [Google Scholar]
  17. Yang, Y.; Bie, X.; Fu, F. Static performance of square CFDST chord to steel SHS brace T-joints. J. Constr. Steel Res. 2021, 183, 1–20. [Google Scholar] [CrossRef]
  18. Fang, Y.; Yu, F.; Zhang, Y. Mechanical behavior and bearing capacity calculation of self-stressing steel slag aggregate reinforced concrete filled circular steel tube columns. Acta Mater. Compos. Sin. 2020, 37, 1211–1220. [Google Scholar]
  19. Shen, Q.; Gao, B.; Wang, J. Experimental study on performance of steel slag concrete filled elliptical steel tubular stub columns under axial load. J. Build. Struct. 2021, 42, 197–203. [Google Scholar]
  20. Yu, F.; Cao, Y.; Fang, Y.; Zhang, Y.; Niu, K. Mechanical behavior of self-stressing steel slag aggregate concrete filled steel tubular short columns with different loading modes. Structures 2020, 26, 947–957. [Google Scholar] [CrossRef]
  21. Yu, F.; Qin, Y.; Yao, C.; Bu, S.; Fang, Y. Experimental investigation on the seismic behavior of self-stressing steel slag CFST column. Struct. Concr. 2022, 23, 1492–1507. [Google Scholar] [CrossRef]
  22. GB/T228. 1-2021; Metallic Materials-Tensile Testing-Part 1: Method of Test at Room Temperature. China Standard Press: Beijing, China, 2021.
  23. JGJ55-2011; Specification for Mix Proportion Design of Ordinary Concrete. Architecture and Building Press: Beijing, China, 2011.
  24. GB/T 50081-2019; Standard Test Method for Physical and Mechanical Properties of Concrete. China Standard Press: Beijing, China, 2019.
  25. JGJ/T 101-201; Specification for Seismic Test of Buildings. China Architecture & Building Press: Beijing, China, 2015.
  26. Han, L. Concrete-Filled Steel Tube Structures—Theory and Practice, 3rd ed.; Science Press: Beijing, China, 2016. [Google Scholar]
Figure 1. Design diagram of the CFDST T-joint specimens.
Sustainability 15 07991 g001
Figure 2. Size specifications of material specimens.
Sustainability 15 07991 g002
Figure 3. Loading devices.
Sustainability 15 07991 g003
Figure 4. Loading scheme.
Sustainability 15 07991 g004
Figure 5. Measuring points arrangement.
Sustainability 15 07991 g005
Figure 6. Failure modes of specimens: (a) Fracture failure of ST0 specimen; (b) Fracture failure of ST3 specimen; (c) Compression-bending failure of ST5 specimen; (d) Compression-bending failure of CT5 specimen.
Sustainability 15 07991 g006aSustainability 15 07991 g006b
Figure 7. Load–displacement curves of specimens.
Sustainability 15 07991 g007
Figure 8. Characteristic points of the skeleton curve.
Sustainability 15 07991 g008
Figure 9. Effect of the hollow ratio on the CFDST T-joint main pipe.
Sustainability 15 07991 g009
Figure 10. Effect of the CFDST specimen with steel slag or commercial Portland concrete.
Sustainability 15 07991 g010
Figure 11. Degradation of secant stiffness.
Sustainability 15 07991 g011
Figure 12. The stiffness degradation analysis of influencing factors.
Sustainability 15 07991 g012
Figure 13. Load–displacement curve.
Sustainability 15 07991 g013
Figure 14. The quantity dissipation coefficient of specimens.
Sustainability 15 07991 g014
Figure 15. The FEM of specimen.
Sustainability 15 07991 g015
Figure 16. Load–displacement curve comparison of FEM and experimental.
Sustainability 15 07991 g016
Figure 17. Failure simulation of specimens.
Sustainability 15 07991 g017
Figure 18. The diagram of the span center section.
Sustainability 15 07991 g018
Figure 19. Contact stress of the span center section.
Sustainability 15 07991 g019
Figure 20. The diagram of the crown section.
Sustainability 15 07991 g020
Figure 21. Contact stress of crown section.
Sustainability 15 07991 g021
Figure 22. Parameters’ effect on standardization Nu.
Sustainability 15 07991 g022
Table 1. Parameters of the CFDST T-joint specimens.
NumberD × L × T
(mm × mm × mm)
Dn × L × Tn
(mm × mm × mm)
D0 × L0 × t
(mm × mm × mm)
χ (Dn/D)β (D0/D)n
ST0168 × 900 × 40 × 900 × 3114 × 400 × 40.00.680.1
ST3168 × 900 × 450 × 900 × 3114 × 400 × 40.30.680.1
ST5168 × 900 × 480 × 900 × 3114 × 400 × 40.50.680.1
CT5168 × 900 × 480 × 900 × 3114 × 400 × 40.50.680.1
Note: ST is the steel slag concrete of the CFDST T-joint, CT represents the commercial Portland concrete CFDST T-joint; D is the outer diameter of the main pipe outer tubes; Dn is the outer diameter of the main pipe inner tubes; D0 is the outer diameter of the branch pipe; L is the length of the main pipe outer tubes; Ln is the length of the main pipe inner tubes; L0 is the length of the branch pipe; T is the thickness of the main pipe outer tubes; Tn is the thickness of the main pipe inner tubes; t is the thickness of the branch pipe; χ is the hollow ratio of the CFDST main pipe; β is the brace-to-main pipe diameter ratio of the CFDST T-joint; n is the axial compression ratio of the CFDST chord T-joint.
Table 2. Material properties of steel tubes.
Dimension of Steel Tube
D × t (mm × mm)
Yield Strength fy
(MPa)
Ultimate Strength fu
(MPa)
168 × 4280355
114 × 4328494
80 × 3283386
50 × 3372507
Table 3. Chemical compositions of commercial Portland cement and steel slag powder.
TypeCaOSiO2Al2O3Fe2O3MgOMnOP2O5SO3Na2OeqLoss
Commercial Portland cement56.1123.467.933.463.15--3.490.722.31
Steel slag powder44.5718.117.2619.014.172.551.87-0.291.38
Note: Na2Oeq = Na2O + 0.685K2O.
Table 4. Mix proportion of concrete.
TypeWater
(kg/m3)
Cement
(kg/m3)
Steel Slag
(kg/m3)
Flyash
(kg/m3)
Sand
(kg/m3)
Stone
(kg/m3)
Superplasticizer
(kg/m3)
Commercial Portland concrete18145001708158156.3
Steel slag concrete181405631538158156.3
Table 5. Mechanical properties of concrete.
NumberSlump (mm)Spread (mm)Ec (GPa)fcu (MPa)
ST0280600–61031.155.7
ST3280600–61031.153.7
ST5280600–61031.155.4
CT5285600–61030.651.2
Note: fcu is the cube compressive strength of the concrete, 150 mm × 150 mm × 150 mm.
Table 6. The experimental results of the specimens.
NumberYield LoadYield DisplacementUltimate LoadUltimate Displacement
Ny+ (kN)Ny (kN)Δy+ (mm)Δy (mm)Nu+ (kN)Nu (kN)Δu+ (mm)Δu (mm)
ST0119.2−124.72.57−2.75181.2−179.828.3−26.8
ST3120.7−120.12.74−2.38178.1−182.230.7−28.0
ST5144.9−144.13.27−3.46206.2−206.640.9−43.7
CT5151.2−1523.73−3.69204.3−206.732.1−22.8
Note: Ny+, Ny, Nu+ and Nu are the loads at the yield point and failure point, respectively. Corresponding to Ny+, Ny, Nu+ and Nu, the displacement is Δy+, Δy, Δu+ and Δu, respectively.
Table 7. The standardization coefficient of characteristic points.
NumberYield LoadYield DisplacementUltimate LoadUltimate Displacement
ST080%72%88%100%
ST379%69%88%107%
ST595%91%100%154%
CT5100%100%100%100%
Table 8. The displacement ductility coefficient of specimens.
NumberYield DisplacementUltimate DisplacementDuctility Coefficient
Δy+ (mm)Δy (mm)Δu+ (mm)Δu (mm)μ+μ
ST02.57−2.7528.3−26.811.019.75
ST32.74−2.3830.7−28.011.2011.76
ST53.27−3.4640.9−43.712.5112.63
CT53.73−3.6932.1−22.88.616.18
Table 9. Bearing capacity Nu of CFDST T-joint specimens with different parameters.
ParameterD × T × L
(mm × mm × mm)
D0 × T0 × L0
(mm × mm × mm)
nβχ (%)Nu
(KN)
Benchmark300 × 6 × 2000150 × 4 × 4000.10.50500.8
300 × 6 ×2000150 × 4 × 4000.10.530509.3
300 × 6 ×2000150 × 4 × 4000.10.550521.1
300 × 6 ×2000150 × 4 × 4000.10.570526.0
300 × 6 ×2000150 × 4 × 4000.10.580494.1
β300 × 6 × 2000120 × 4 × 4000.10.40495.7
300 ×6 × 2000120 × 4 × 4000.10.430499.4
300 × 6 ×2000120 × 4 × 4000.10.450508.1
300 × 6 × 2000120 × 4 × 4000.10.470508.4
300 × 6 × 2000120 × 4 × 4000.10.480438
300 × 6 × 2000180 × 4 × 4000.10.60503.1
300 × 6 × 2000180 × 4 × 4000.10.630508.8
300 × 6 × 2000180 × 4 × 4000.10.650523.4
300 × 6 × 2000180 × 4 × 4000.10.670535.5
300 × 6 × 2000180 × 4 × 4000.10.680516.0
n300 × 6 × 2000150 × 4 × 4000.30.50500.7
300 × 6 × 2000150 × 4 × 4000.30.530501.3
300 × 6 × 2000150 × 4 × 4000.30.550516.3
300 ×6 × 2000150 × 4 × 4000.30.570517.1
300 × 6 × 2000150 × 4 × 4000.30.580495.8
300 × 6 × 2000150 × 4 × 4000.50.50499.1
300 × 6 × 2000150 × 4 × 4000.50.530499.9
300 × 6 × 2000150 × 4 × 4000.50.550507.5
300 × 6 × 2000150 × 4 × 4000.50.570509.0
300 × 6 × 2000150 × 4 × 4000.50.580493.8
Disclaimer/Publisher’s Note: The statements, opinions and data contained in all publications are solely those of the individual author(s) and contributor(s) and not of MDPI and/or the editor(s). MDPI and/or the editor(s) disclaim responsibility for any injury to people or property resulting from any ideas, methods, instructions or products referred to in the content.

