1. Introduction
There is an increasing need for alternative protein sources to serve as an additive to current fish feeds. This is mainly due to the accelerated rate at which the global population is increasing, coupled with the inadequate allocation of arable land and water, which is also escalating problems [
1]. Macroalgae (seaweed, e.g.,
Alaria esculenta) [
2] and simple plants such as duckweed (the smallest flowering plants, e.g.,
Lemna minor) [
3] are all great sustainable alternative sources of protein. They are considered sustainable since they do not compete with traditional fish feeds for resources and space. These biomasses are sources of alternative proteins and are all high in nutritional value, which makes them a viable option as additives to current fish feeds.
Macroalgae have been increasing in popularity as a potential alternative source of protein to supplement fish feeds. A great benefit of using seaweeds is that their harvest does not require the use of arable land. They are easy to access along the coastal regions and also simple to farm. Furthermore, macroalgae have been used for many years as sources of iodine and have the potential to supply trace elements in animal feeds [
4]. Macroalgae have recently been studied more intently, and it was found that they enhance stress resistance, physiology, fish growth, fillet muscle quality and the fish immune system [
5]. Interestingly, the water surrounding fish farms is the ideal environment to cultivate macroalgae. This water is concentrated in fish waste (effluent) and nutrients which have been found to proliferate the growth of seaweed [
6].
Aquatic floating plants such as duckweed have similar advantages to macroalgae, with the addition of being more easily harvested, requiring no agitation system and having low sensitivity to pests and diseases [
7,
8]. Interestingly, duckweed grows readily as a byproduct of freshwater fish farms. Although there is an increasing interest in alternative protein sources from macroalgae and duckweed, more research needs to be undertaken.
There are barely any studies on the extraction of proteins from macroalgae and duckweed to date. Protein extraction serves to make nutrients more digestible and bioaccessible as the process breaks down the tough polysaccharide cell walls [
9,
10]. Ultrasound technology works by creating bubble cavitation [
11,
12]. Microbubbles grow and collapse repeatedly, creating shock waves that are powerful enough to create microtears in cell structures, causing the release of intracellular matter. Sonication has a high energy expenditure and causes pressure and temperature to increase in regions of cavitation. Care must be taken to control these parameters to ensure a good quality protein.
There is a gap in the literature regarding the combination of green technologies. Enzyme-assisted extraction alone is a very mild process that does not achieve cell lysis [
13]; however, coupled with other green technology, it is expected to make extraction more efficient overall. A crucial step is to understand the composition of the cell walls for the specific biomass being used as enzymes are highly specific [
14]. Algal cell walls have a very complex composition. Hence, enzymes should be chosen based on the target species and its matrix. One must be careful when adding enzymes as they can impact the structure and functionality of proteins, which must be retained for food implementation. However, there are also benefits of using enzymes as they can disrupt the cell wall and act as hydrolyzing agents to create protein hydrolysates [
15]. The cost of creating enzyme cocktails to target such complex matrices is quite high. However, the energy requirements are very low, and the operating conditions are mild [
16].
There is an evident need for alternative protein sources to act as additives in different types of feeds. Additionally, the use of green technologies such as ultrasound is still relatively undocumented as a means to extract bioactive compounds. It is also clear that studies are needed to optimize the production of alternative protein-rich sources that have enhanced stability following their treatment with green technologies such as ultrasound. This research aims to create alternative feed formulations by using biomasses of Alaria esculenta and Lemna minor, which are nutritious and easy to cultivate. Hence, these biomasses are considered sustainable sources of protein. The aim of this study was to extract compounds from Alaria esculenta and Lemna minor and assess the efficacy of ultrasound technology to increase the extraction yield.
2. Materials and Methods
2.1. Sample Procurement
Two alternative proteinaceous biomasses were chosen, i.e., Alaria esculenta (macroalgae, brown seaweed) and Lemna minor (smallest flowering plant). Pre-dried Alaria esculenta was supplied by Connemara, Organic Seaweed Company, Ireland. Thereafter, it was ground into finer powder (100 microns) using a grinder (Silvercrest SKEE 150 A1, Kompernaß Handelsgesellschaft mbH, Bochum, Germany). Lemna minor was purchased from AquaMona fish farm at Mount Lucas (Ireland) in pre-dried form, and it was ground to a fine powder (100 microns) using the same grinder.
2.2. Analysis
After the treatments, samples were tested further to quantify the protein, peroxide, total free amino acid, and total reducing sugar concentrations. Moreover, the supernatants were analyzed to determine each of their chlorophyll spectra and their surface structures. The objective of this experiment was to determine if ultrasound facilitates the extraction process for two different biomasses. Moreover, it served to establish whether different sonicators and different settings aided or hindered this extraction.
2.2.1. Protein Quantification
Bradford’s Assay
Bradford’s reagent was prepared by adapting the protocol from Marion Bradford’s paper [
17]. For the stock culture, a 5 mg/mL bovine serum albumin (BSA) solution was prepared. All standards were prepared fresh on the day of running the assay. After preparing the dilutions, 5 µL of standard/sample was placed in a well of a 96-well plate (Nunclon Delta Surface, Thermo Scientific, Roskilde, Denmark). This was followed by the addition of 250 µL of Bradford’s reagent. The procedure was performed in duplicate for each standard and sample. The plate was placed in the UV spectrophotometer (Sunrise, Tecan, Grödig, Austria) and left to incubate for 5 min at room temperature. The absorbance was then read at 600 nm. When a sample’s absorbance resulted in a value which was greater than 1, the test was repeated using a dilution of the sample.
Nitrogen Content
The nitrogen content (%) was assessed to determine which treatment resulted in the highest protein yield. The protein concentration determined using the LECO FP628 protein analyzer is based on the Dumas method and according to AOAC method 992.15, 1990. The nitrogen-to-protein conversion factor used for Alaria esculenta was 5, while for Lemna minor it was 6.25.
2.2.2. Antioxidant Content
The following method was adapted from a paper for the detection of lipid hydroperoxides in plant tissue [
18] (DeLong et al., 2002). Reagent A, 25 mM ammonium ferrous (II) sulfate in 2.5 M H
2SO
4, was prepared, followed by reagent B, 100 mM sorbitol and 125 µM xylenol orange. The working reagent was prepared fresh on the day of running the assay by adding 1 mL of reagent A to 100 mL of reagent B. A stock solution of 100 µg/mL H
2O
2 was prepared fresh on the day of running the assay. A standard curve was created and used to determine the concentration of peroxide in the biomass supernatants. All standards were prepared fresh on the day of running the assay.
After preparing the dilutions, 6 µL of standard/sample was placed in a well of a 96-well plate (Nunclon Delta Surface, Thermo Scientific, Denmark). This was followed by 240 µL of FOX working reagent. The procedure was performed in duplicate for each standard and sample. The plate was placed in the UV spectrophotometer and left to incubate for 20 min at room temperature. The absorbance was then read at 560 nm. When a sample’s absorbance resulted in a value which was greater than 1, the test was repeated using a dilution of the sample.
2.2.3. Total Free Fatty Acids
The following protocol was adapted from a method developed to detect the total free amino acids in soil solutions [
19] (Jones et al., 2002). In a 50 mL volumetric flask, 25 mL of 100 mM sodium tetraborate, 5 mL of 10% SDS (
w/
w), 1 mL of OPA solution and 100 µL of β-mercaptoethanol (Acros Organics, Geel, Germany) were added and mixed well. The flask was topped up with dH
2O until it reached the 50 mL mark. A stock solution of 1000 µg/mL (1 mg/mL) L-leucine (Biochem Chemopharma, Loire, France) was prepared. A standard curve was created and used to determine the concentration of total free amino acids in the biomass supernatants. All standards were prepared fresh on the day of running the assay.
After preparing the standards inside the wells, 10 µL of the sample was placed in a well of a 96-well plate (Nunclon Delta Surface, Thermo Scientific, Denmark). This was followed by 190 µL of OPA reagent. The procedure was performed in duplicate for each standard and sample. The plate was placed in the UV spectrophotometer and left to incubate for 3 min at room temperature. The absorbance was then read at 349 nm. When a sample’s absorbance resulted in a value which was greater than 1, the test was repeated using a dilution of the sample. It was ensured that any bubbles from the OPA reagent were popped using a sterile needle before reading the absorbance to minimize errors in the results.
2.2.4. Total Reducing Sugars
The following procedure was adapted from an improved DNS protocol [
20] (Wood et al., 2012). In a 100 mL volumetric flask, 1.6 g of sodium hydroxide (Sigma-Aldrich, Prague, Czech Republic) was dissolved in 40 mL of dH
2O. Subsequently, 30 g of potassium sodium tartrate tetrahydrate (Carlo Erba, Val-de-Reuil, France) and another 40 mL of dH
2O were added. Finally, 1 g of 3,5-dinitrosalicylic acid (Acros Organics, Mumbai, India) was added slowly, and the flask was topped up with dH
2O until the mark. The DNS reagent was filtered through a polyethersulfone (PES) syringe filter (Kinesis Scientific Experts, Vernon Hills, Illinois, USA) before use. A stock solution of 2 mg/mL glucose (Eurostar Scientific Ltd., Liverpool, UK) was prepared. A standard curve was created and used to determine the concentration of total reducing sugars in the biomass supernatants. All standards were prepared fresh on the day of running the assay.
After preparing the dilutions, 50 µL of standard/sample was placed in a polymerase chain reaction (PCR) tube. This was followed by 50 µL of DNS reagent. The PCR tubes were then placed in a thermal cycler (T100, BioRad, CL, USA) and boiled at 100 °C for 5 min. After the contents of the tubes cooled down to room temperature, 80 µL of each tube was transferred to an Eppendorf with 400 µL of dH2O. From this, 250 µL was transferred into wells of a 96-well microtiter plate. The procedure was performed in duplicate for each standard and sample. The plate was placed in the UV spectrophotometer, and the absorbance was then read at 540 nm. When a sample’s absorbance resulted in a value which was greater than 1, the test was repeated using a dilution of the sample.
2.2.5. Chlorophyll Spectra
The supernatants had very distinct colour shades and intensities, hinting that chlorophyll was being released from the biomass cells during all treatments. A spectrophotometer (UV-2600, Shimadzu, Kyoto, Japan) was used to measure the absorbance of all supernatants at wavelengths between 750 to 550 nm. A blank (dH2O in a glass cuvette) was first conducted, followed by the readings for all supernatants. The programme used to take these readings was a UV probe (Version 2.42). Measurements were set to be taken from 750 to 550 nm. Around 3 mL of dH2O was poured into the glass cuvette, which served as the baseline, and then 3 mL for each supernatant sample was analyzed.
The results generated from the UV probe 2.42 were used to create line spectra for all of the samples. The absorbance values at a wavelength of 670 nm were analyzed as this peak marks the region for chlorophyll a, which is present in all three biomasses.
2.2.6. SEM
The samples underwent primary fixation with 100 mM phosphate-buffered 2.5% glutaraldehyde fixative and secondary fixation using 1% osmium tetroxide. The biomasses were then dehydrated with an ethanol series ranging from 30–100% of ethanol absolute anhydrous (Carlo Erba, France). After mounting the samples on stubs, gold coating was performed using an automatic sputter coater (Agar Scientific, Stansted, UK). SEM imaging was implemented as follows: the samples were placed in the holder of the field emission scanning electron microscope (ZEISS GeminiSEM 360, Oberkochen, Germany). The samples were subject to the control treatment for 20 min, and the probe sonicator was used at 80% amplitude for 5 min for each biomass. Each sample was imaged at 150, 1 K, 5 K, 10 K, 20 K and 50 K magnifications. The resulting images were compared qualitatively with each other to determine if there were any changes in the structure of the biomasses after the different treatments.
2.3. Bioactive Compounds Extraction
2.3.1. Impact of Different Ultrasound Set-Ups on Biomass Treatments
Different sonication treatments were implemented to assess the extraction efficacy of different sonication equipment by using different durations of time, and 39 g of each biomass (
Alaria esculenta,
Lemna minor) was used for these experiments. These 39 g were split into 1 g portions, each of which was added to 40 mL of distilled water (dH
2O). Twelve of these diluted samples were left untreated to act as controls (three left for 1 min, three left for 2 min, three left for 5 min, and three left for 20 min). Nine of these samples were treated using a bath sonicator (Elma S 60 Elmasonic, Nürnberg, Germany, fixed power of 150 W) (three left for 1 min, three left for 5 min, three left for 20 min). Another 9 sample dilutions were treated using the UP400St probe sonicator set at 40% amplitude (three left for 1 min, three left for 5 min, and three left for 20 min). The last 9 sample dilutions were treated using the UP400St probe sonicator set at 80% amplitude (three left for 1 min, three left for 2 min, and three left for 5 min). Hence, 13 treatments (three replicates per treatment) per biomass were performed.
Table 1 below summarizes all the treatments.
All samples were centrifuged for 30 min at 3820 RCF (g-force) and set at 4 °C (PrO-Analytical centrifuge, Centurion Scientific Limited, Stoughton, UK). The supernatants were then filtered and kept at −20 °C until further analyses to assess chlorophyll spectra. The filtered supernatants were also analyzed using four assays to assess the protein content, the peroxide content, the total free amino acid (TFAA) content and the total reducing sugar (TRS) content. A small amount of each pellet was transferred to Eppendorfs for storage at −20 °C, to be used for scanning electron microscopy (SEM) imaging.
All the filtered supernatants were analyzed using four different assays (
Table 1). Bradford’s assay was used to assess the protein content of the samples. A ferrous oxidation xylenol (FOX) assay was used to check the hydrogen peroxide (H
2O
2) content in the samples. The TFAA content was found by using the o-phthaldialdehyde (OPA) reagent. The TRS content was analyzed using the 3,5-dinitrosalicylic acid (DNS) reagent. All four assay protocols were adapted so that the total volume fit in a well of a 96-well plate. Each plate was placed in the UV spectrophotometer (Sunrise, Tecan, Austria), and the machine was set to read the absorbance of each well at 600 nm, 560 nm, 540 nm and 340 nm according to
Table 2 below.
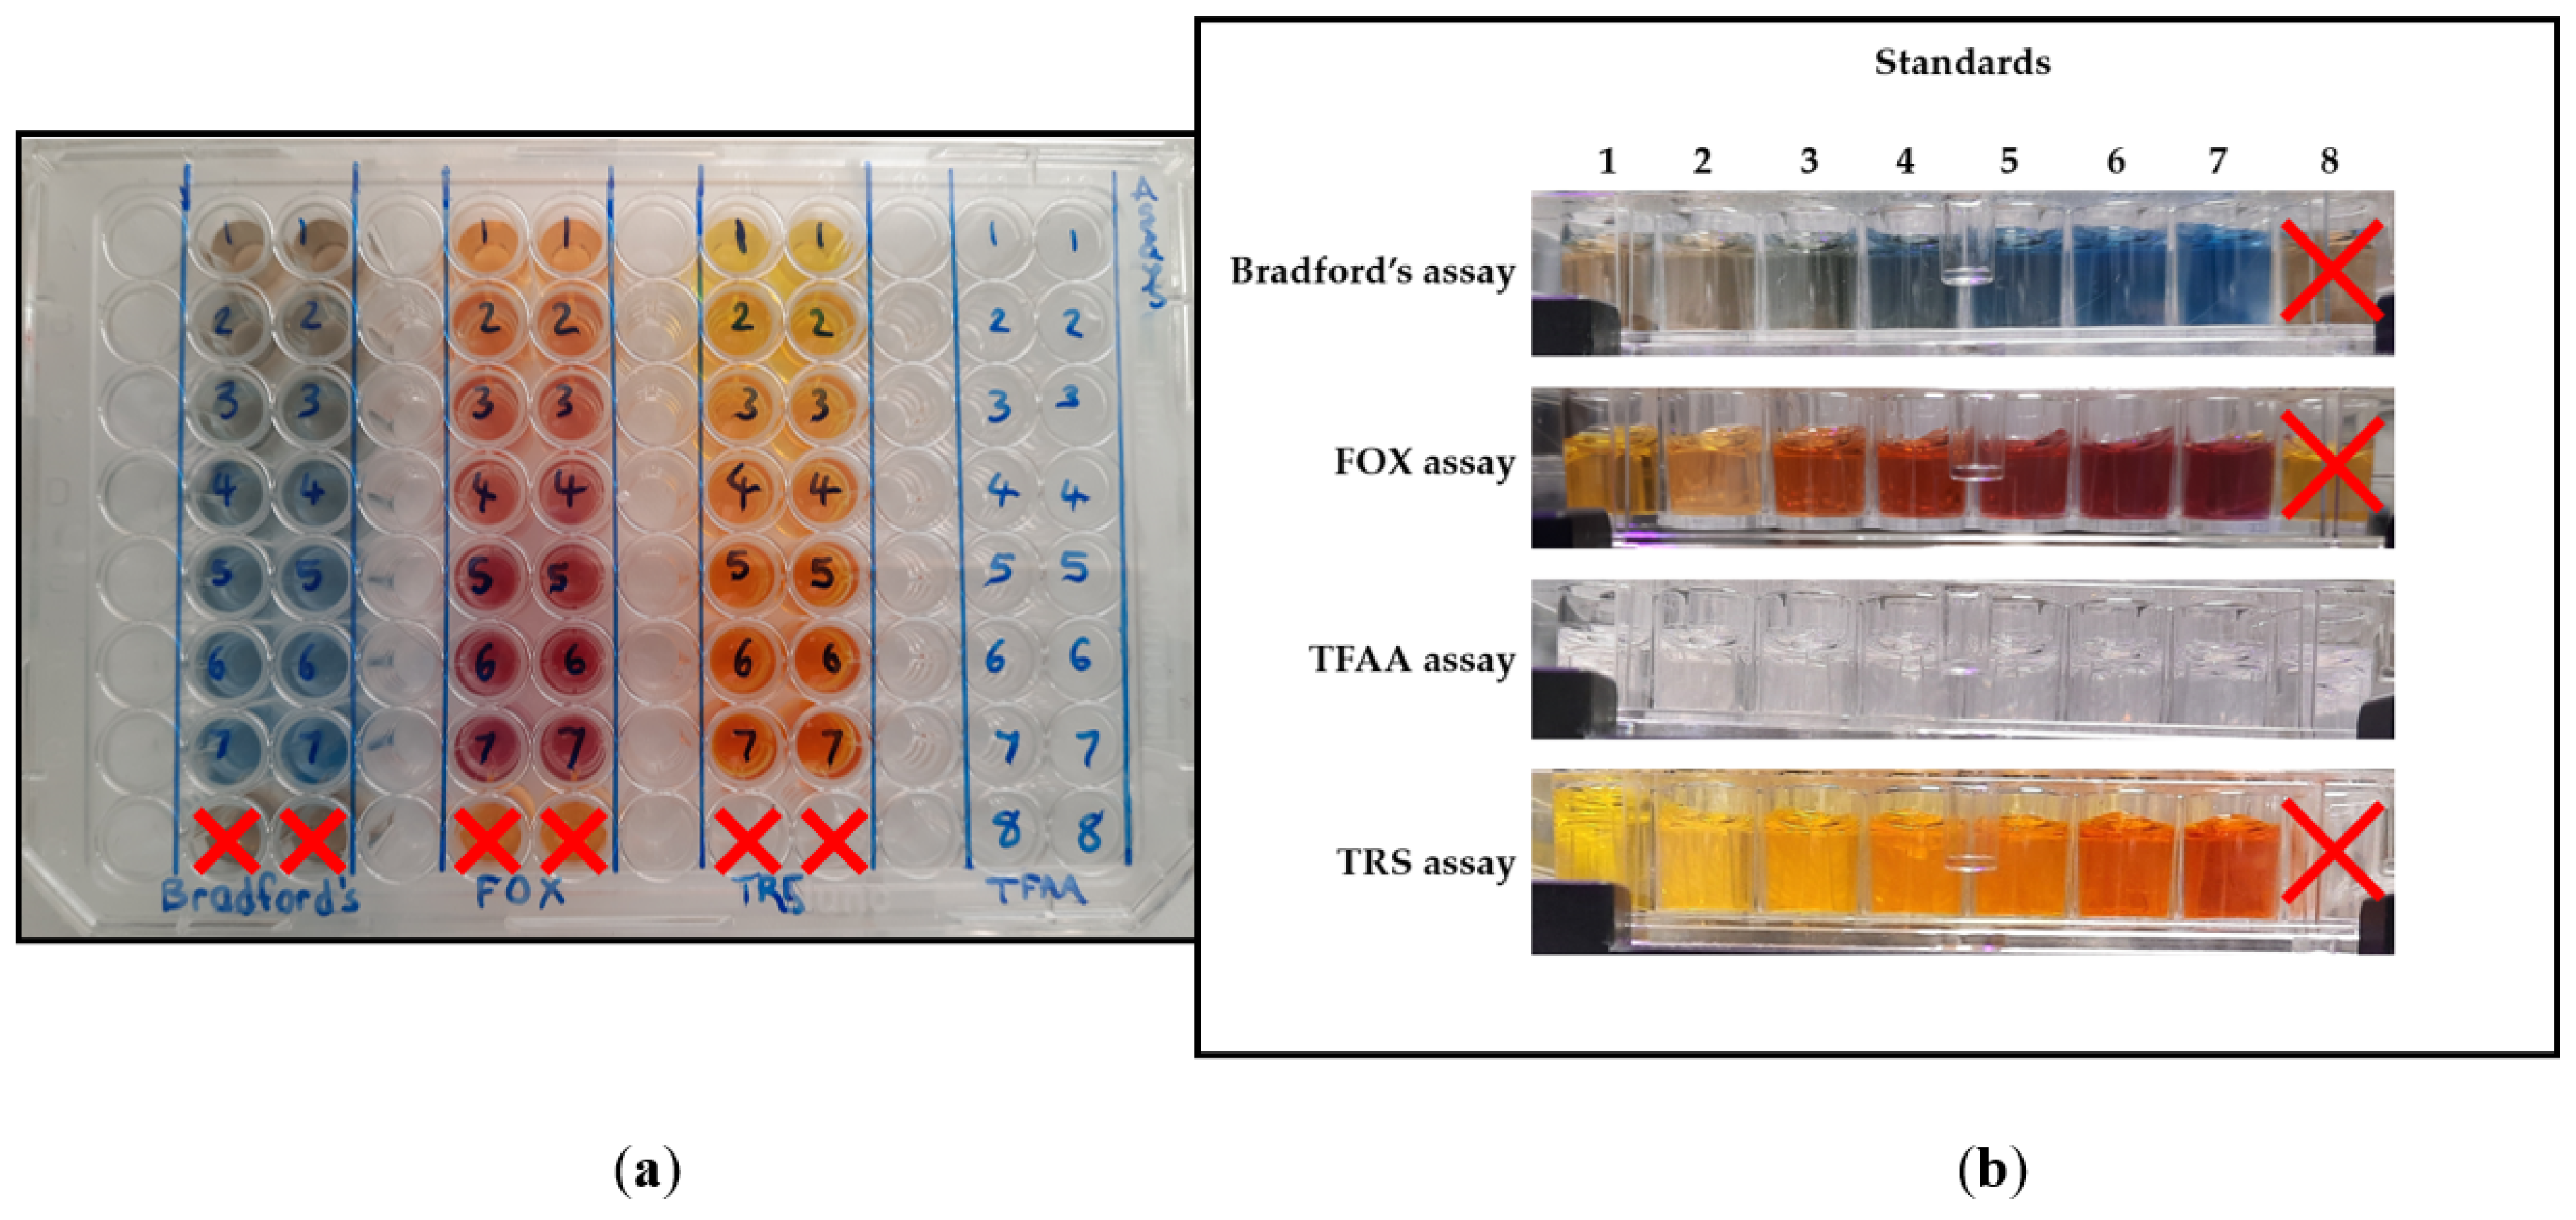
Each assay resulted in a change in colour/opaqueness, which indicated the amount of the desired component as in
Figure 1. Bradford’s assay caused the Bradford’s reagent to change from brown to varying intensities of blue in the presence of proteins. The FOX assay caused the reagent to change from orange to varying intensities of fuchsia. The TFAA assay caused the OPA reagent to change in opaqueness. The TRS assay caused the DNS reagent to change from bright yellow to varying intensities of orange.
The results generated from spectrophotometric assays were monitored by X Fluor 4 software. GraphPad Prism version 8 was used to create bar graphs for all of the samples. For almost all of the results, one-way ANOVA was used as the parametric test and Kruskal–Wallis was used as the nonparametric test, in order to compare any statistical differences between the biomasses. For the 2-min treatments of UP400St set at 80% and the control, the T-test (or the nonparametric equivalent, Mann–Whitney test) was used as there were only 2 groups to compare.
2.3.2. Impact of Assisted Ultrasound on Biomass Treatments
2.4. Statistical Analysis
A full factorial experimental research design (3 levels of amplitude, 2 levels of incubation with enzymes) was adopted in this study. Duplicates were performed for all the extraction treatments and triplicates for the analysis unless otherwise stated. The effect of different extraction methods was evaluated using a one-way analysis of variance (ANOVA) with a post hoc Tukey test, using SPSS (v20.0.0, IBM, Armonk, NY, USA). The significance level was defined as p < 0.05. Prism version 9.1.0 (GraphPad Softwares, Inc., La Jolla, CA, USA) was used to carry out curve fitting and statistical analysis. Data are presented as a percentage, error bars of all figures are presented using standard deviation (SD), and multiple comparison analyses were performed using post hoc Tukey’s test.
3. Results
3.1. Protein Quantification
3.1.1. Bradford’s Assay
The following graphs demonstrate the protein concentrations present in the supernatants of Alaria esculenta and Lemna minor, respectively, after each of the 13 treatments. Lemna minor was found to have the greatest protein content, followed by Alaria esculenta.
Figure 2a shows that for a fixed time, UP400St at 80% resulted in the most protein extraction from
Alaria esculenta, followed by UP400St at 40%, the bath sonicator and the control, respectively.
Figure 2b shows that the bath and UP400St at 40% have a similar trend in extraction rates with time while UP400St at 80% resulted in the highest protein extraction from
Lemna minor. Overall, each treatment gave a higher protein value with increasing durations. Interestingly,
Lemna minor extracted the highest quantity of protein followed by
Alaria esculenta.
Statistical analysis was performed to compare the difference between treatments (
Figure 2a) when set at the same time duration. No significant difference between any of the treatments for a given duration was observed. However, it was interesting to report that for the control treatments, approximately the same protein content was extracted after 20 min (11.15 µg/mL) when compared to 5 min (10.54 µg/mL). This shows that after 5 min, the extraction of protein reaches a plateau. For the treatment of
Lemna minor (
Figure 2b) there was a significant difference in protein concentration after using the UP400St set at 80% when compared to the control (
p < 0.01) and bath sonicator (
p < 0.01). The 80% amplitude setting resulted in a 1.76-fold higher protein concentration than the control and a 1.53-fold higher protein concentration than the bath.
For the 2 min treatments, there was a significant difference in protein extracted after using the UP400St set at 80% when compared to the control (p < 0.001). The 80% amplitude setting resulted in a 3.87-fold higher protein concentration than the control.
Similarly, for the 5 min treatments, the 80% amplitude setting resulted in a 3.43-fold higher protein concentration than the control, a 2.10-fold higher protein concentration than the bath, and a 2.29-fold higher protein concentration than the UP400St set at 40%.
3.1.2. Nitrogen Content
This analysis was carried out to assess the impact of assisted ultrasound on biomass treatments. The objective of this experiment was to determine if ultrasound facilitates the extraction process for two different biomasses. Moreover, it served to establish whether using ultrasound with enzymes or ultrasound with alkali gives better results than the conventional method for protein extraction that is currently being used in the food industry. Lemna minor was found to have the greatest protein content in the supernatants, followed by Alaria esculenta.
3.2. Antioxidant Content
It is known that a high peroxide content is not desirable as this reflects low antioxidant levels. The peroxide concentrations present in the supernatants of
Alaria esculenta and
Lemna minor, respectively, are depicted in
Figure 8.
Lemna minor was found to have the greatest peroxide generated after treatments, followed by
Alaria esculenta.
Figure 8a shows that after treatments with UP400St at 40%, the bath sonicator and the control, more peroxide is being generated from
Alaria esculenta with increasing durations; however, after treatment with UP400St at 80% the peroxide concentration is seen to decrease with longer durations of treatment.
The same trend was seen in
Lemna minor. Treatments with UP400St at 40%, the bath sonicator and the control treatments, resulted in more peroxide with increasing durations; however, after treatment with UP400St at 80%, the peroxide concentration was seen to decrease with longer durations of treatment (
Figure 8b).
Alaria esculenta and Lemna minor followed the same trend. Supernatants had more peroxide after treatment with UP400St at 40%, the bath sonicator and the control, with increasing durations; however, after treatment with UP400St at 80% the peroxide concentration was seen to decrease with longer durations of treatment. It is worth noting that Lemna minor extracted the highest quantity of peroxide followed by Alaria esculenta.
Statistical analysis was applied to compare the impact of different treatments on peroxide concentration for
Alaria esculenta (
Figure 8a) for the same duration. For the 1 min treatments, there was a significant difference in peroxide generation after using the UP400St set at 80% when compared to the control (
p < 0.01) and the UP400St at 40% (
p < 0.01). The 80% amplitude setting resulted in a 2.75-fold higher peroxide concentration than both the control and the UP400St at 40%.
For the 5 min treatments, there was a significant difference in peroxide generation after using the UP400St set at 80% when compared to the control (p < 0.01), the bath (p < 0.01) and the UP400St at 40% (p < 0.001). The 80% amplitude setting resulted in a 0.14-fold decrease in peroxide concentration than the control, a 0.13-fold higher peroxide concentration than the bath, and a 0.12-fold higher peroxide concentration than the UP400St set at 40%.
A similar analysis was applied for the
Lemna minor treatments (
Figure 8b) performed when set at the same duration. Overall, UP400St set for 1 min performed better than the control with the 80% amplitude setting resulting in a 3-fold higher peroxide concentration than the control and a 1.79-fold higher peroxide concentration than the bath. Finally, for the 5 min treatments, significant differences resulted between the peroxide generated after using the UP400St set at 80% and the bath (
p < 0.001) and UP400St set at 40% (
p < 0.01).
3.3. Total Free Fatty Acids
Lemna minor was found to have the greatest amount of TFAA released after treatments, followed by
Alaria esculenta.
Figure 9a shows that overall, after treatments with UP400St at 40% and UP400St at 80%, more TFAA was released from
Alaria esculenta. However, after treatment with the bath, the TFAA content seems to decrease with longer durations of treatment.
Figure 9b shows that no trend was present for the TFAA release from
Lemna minor, and minimal extraction took place after using the different treatments as compared to the controls.
There was no general trend for TFAA release overall. However, it is worth noting that Lemna minor extracted the highest quantity of TFAA followed by Alaria esculenta, respectively.
Statistical analysis was performed to assess the impact of the different
Alaria esculenta treatments (
Figure 9a). Overall, UP400St set at 80% for all time durations performed better than the control with the 5 min treatment, resulting in a 1.36-fold decrease in TFAA concentration compared to the control, and a 1.29-fold higher TFAA concentration than the bath.
In the case of
Lemna minor treatments (
Figure 9b), a significant difference in TFAA concentration is evident after using the UP400St set for 2 min at 80% when compared to the control (
p < 0.01). The 80% amplitude setting resulted in a 0.89-fold lower TFAA concentration than the control.
Finally, the 20 min treatments resulted in significant differences between the TFAA released after using the UP400St set at 40% when compared to the control (p < 0.001) and bath (p < 0.001). The 40% amplitude setting resulted in a 1.10-fold higher TFAA concentration than the control and a 1.08-fold higher TFAA concentration than the bath.
3.4. Total Reducing Sugars
TRS quantification was carried out using a DNS reagent. The following graphs demonstrate the TRS concentrations present in the supernatants of
Alaria esculenta and
Lemna minor respectively.
Lemna minor was found to have the greatest TRS release after treatments, followed by
Alaria esculenta.
Figure 10a has a general trend where after treatments with UP400St at 40% and UP400St at 80%, more TRS is being released from
Alaria esculenta with increasing durations; however, after treatment with the bath, the TRS concentration is seen to decrease with longer durations of treatment. In
Figure 10b, no trend was present for the TRS release from
Lemna minor, and minimal extraction took place after using the different treatments; however, it is worth noting that the bath treatments result in a decrease in TRS concentration with longer durations.
Alaria esculenta followed the trend where supernatants had slightly more TRS release after treatment with UP400St at 40% and 80%; however, after treatment with the bath sonicator, the TRS concentration was seen to decrease compared to the control samples.
Lemna minor showed no trend but also experienced a decrease in TRS release while using the bath sonicator when compared to the controls. It is worth noting that
Lemna minor extracted the highest quantity of TRS followed by
Alaria esculenta, respectively.
Statistical analysis was performed to compare the TRS content of
Alaria esculenta treatments (
Figure 10a) and
Lemna minor treatments (
Figure 10b). For example, there was also a significant difference in TRS content after using the UP400St for 5 min and 20 min set at 80% when compared to the control (
p < 0.001) and the bath (
p < 0.001). For the 5 min treatment, the 80% amplitude setting resulted in a 1.87-fold decrease in TRS concentration compared to the control and a 1.72-fold higher TRS concentration than the bath, while for the 20 min treatment, the 40% amplitude setting resulted in a 2.04-fold decrease in TRS concentration compared to the control and a 4.46-fold higher TRS concentration than the bath. In the case of
Lemna minor treatments, there was a significant difference in TRS concentration after using the UP400St set for 2 min at 80% when compared to the control (
p < 0.01). The 80% amplitude setting resulted in a 1.21-fold higher TRS concentration than the control.
3.5. Chlorophyll Spectra
A spectrophotometer was used to measure the absorbance of all supernatants at wavelengths between 750 to 550 nm. The chlorophyll spectra served as an estimate of the degree of chlorophyll release after applying the different treatments. The applied experiment clearly shows how the different treatments had different effects on the two biomasses. Supernatants of
Alaria esculenta treated with UP400St set at 40% and 80% showed a very minute peak at the 670 nm region (
Figure 11a). However, no peak was seen after the control and bath treatments. Thus, chlorophyll was only extracted when the probe sonicator was used.
Figure 11b shows that supernatants of
Lemna minor treated with UP400St set at 40% and 80% showed very distinct peaks at the 670 nm region. The bath treatment and control also resulted in small peaks at the same absorbance.
It is evident that more chlorophyll was released with longer durations of treatment. The UP400St set at 80% gave the highest chlorophyll content, followed by the UP400St set at 40% and the bath sonicator. Alaria esculenta experienced a dip in chlorophyll concentration when using the bath as compared to the controls. The bath sonicator seems to inhibit chlorophyll extraction in these two biomasses. Interestingly, Lemna minor resulted in the most chlorophyll extraction, followed by Alaria esculenta. It can be concluded that Lemna minor has the highest concentration of these substances and is possibly the most porous in structure, and thus releases the compounds more readily. On the other hand, Alaria esculenta must have a very tough and rigid structure that is not easily broken down.
3.6. SEM
It was decided to only compare the 20 min controls with the 5 min treated samples using UP400St at 80%. In this way, the differences in the structure were clearer, as the most hydrated samples were being compared to the samples treated with the harshest conditions. Similarly, the following treatments of each biomass are compared as the most representative: water only (6 h), buffer only (6 h), enzyme only (6 h), US 100% only (6 h) and US 100% + enzymes (6 h).
Figure 12 and
Figure 13 show quite clearly that the UP400St probe sonicator set at an amplitude of 80% (top rows) causes surface roughness on the biomass when compared to the control samples (bottom rows). It is also worth mentioning that small perforations in the structure can be seen after treatment with the probe, indicating that mechanical breakdown occurred.
Figure 14 and
Figure 15 show quite clearly that there is little change in the surface roughness of both biomasses when treated with the water, buffer and enzyme controls. However, noticeable perforations formed on the surface of the biomasses after treatment with US at 100% only and US at 100% with enzymes. This leads to the conclusion that the breakdown of the biomasses occurred due to the ultrasonic treatments.
4. Discussion and Conclusions
On the one hand, US probe treatments always resulted in an improved extraction efficacy compared to the controls; on the other hand, bath treatments did not show better extraction yield than the controls. When applying the same extraction conditions, the longer the extraction time, the higher the extraction yields that could be obtained. This concurs with what was reported in the literature, where it was stated that probe sonicators are more efficient than bath sonicators when it comes to extraction due to the former having a more focused and uniform distribution of energy [
21].
Lemna minor extracts had a better amino acid profile than the other biomass due to their original compositions [
22]. The peroxide content was also quantified as the literature states that the sonication of water creates radicals and H
2O
2 [
23]. However, the results show that sonication had little effect on peroxide generation. This might be due to the peroxide being short-lived, hence the test was not able to detect changes quickly enough. It can be concluded that any generated peroxide will not affect biomass quality.
When it came to chlorophyll spectra, it was found that
Lemna minor extracts had more chlorophyll than
Alaria esculenta. There are not enough data in the literature to confirm this; however, this trend of easily extracted chlorophyll from duckweed was seen throughout the study. Furthermore, it is evident that more chlorophyll was released with longer durations of ultrasound treatment. SEM images gave clear indications that the sonication treatments caused the mechanical destruction of all three biomasses. This is in line with what was reported in the literature for all three biomasses [
24,
25,
26].
When the impact of assisted ultrasound on biomass treatments was assessed, the enzyme treatments did not result in an increase in protein yield for either of the biomasses. This was not expected as the same enzyme, cellulase, was found to extract proteins efficiently from the two types of seaweed of
Macrocystis pyrifera and
Chondracanthus chamissoi [
27]. The possible reason for this is that cellulase is not as well-suited for the matrix of these particular biomasses. The ultrasound treatments alone did result in increased protein extraction. This matches with what was reported in the literature for the same biomasses [
28,
29]. For the combined ultrasound and enzyme treatments, a very noticeable increase in extraction yield was reported. This is very intriguing as such findings have not been documented for these particular biomasses as yet. As expected, longer durations of treatment gave a higher protein yield.
Interestingly, the conventional method did not result in an increase in extraction for either biomass. For the alkali extraction method, neither biomass had changes to its extraction yield when compared to the controls. Increasing the duration did not increase the yield. Several drawbacks for both of these methods have been published recently [
30]. This study mentioned how time-consuming these two methods are, how wasteful and expensive they can be due to the large amounts of toxic organic solvents required, and also how hazardous the exposure to these chemicals can be to workers and consumers alike. Hence, the adoption of ultrasound extraction, especially when coupled with enzymes, should be considered by the industry. SEM images of the biomasses before and after ultrasound-assisted enzyme extraction gave clear indications that the sonication treatments caused the mechanical destruction of both biomasses. These images can serve as a useful reference as so far, no similar results were published in the literature.
Ultrasound technology improves both the yield and the rate of extraction of compounds in solid–liquid extraction from cells [
31]. Ultrasound is a form of green technology that has become of increasing interest in the food industry, due to promising findings related to increased extraction yields with minimal requirements of reagents. Bath sonication is reported to provide a weak sonication with non-uniform distribution whilst probe sonication is said to provide stronger sonication that is much more focused and uniform in distribution [
32].
During a study performed by Vernès et al. (2019), it was found that for spirulina (a microalgae), ultrasonic treatments caused the fragmentation of the filaments. It was concluded that this increase in the surface area increased the protein-to-solvent contact, which in turn amplified the extraction rate and yield [
33]. A similar inference can be applied to the findings of the current research. The SEM images do suggest fragmentation of all the biomasses, and thus an increase in surface area.
Furthermore, a study carried out by Görgüç et al. (2019) found that combining ultrasound with the enzyme alcalase exhibited the highest protein recovery in sesame brans. Alcalase was found to be more effective than viscozyme, highlighting the importance of finding a highly specialized enzyme for each respective biomass [
34]. It is very likely that cellulase was better suited for
Lemna minor than it was for
Alaria esculenta. Carrying out further tests using different types of enzymes would be ideal so as to determine which is the best suited for each biomass. Ultrasound treatments might also lead to improved digestibility of the biomass. It was found that plant-based proteins treated with ultrasound were more bioavailable and readily absorbed in the intestines [
35]. In a study carried out by Sapatinha et al. (2022), it was found that the enzyme alcalase (a type of peptidase) had a significant enhancing effect on the extraction yield of compounds from macroalgae. Alcalase was found to be better suited than cellulase or viscozyme for assisted extraction. It is also worth pointing out that brown seaweeds (10.5–33.2%) were found to extract much fewer compounds than red seaweeds (24.6–63.3%) [
36]. Similarly, a study on
Chlorella vulgaris performed by Hildebrand et al. (2020) found that using the enzyme lysozyme coupled with ultrasound resulted in protein recoveries ranging from 33 to 42% while using proteases results in an enhanced recovery of proteins (58–82%). Furthermore, SEM imaging depicted significant changes in the morphology of the cell surface [
37].
No research has been reported on the use of ultrasound and enzyme extraction of compounds from
Lemna minor. However, with duckweed being the smallest flowering plant, it is safe to assume that it behaves in a similar way to other plant matrices. Cellulase was the enzyme of choice in this study as there is little documentation on its effect on extraction, however there are ample findings on the presence of cellulose in plant cells [
38,
39]. A fast and economical extraction method, with minimal hypothermic effects, is possible with ultrasound technology. As a result, the functional qualities of the extracted nutrients are improved, and their deterioration is decreased [
40,
41]. This technique can be utilized to produce high yields of thermo-labile proteins. Protein aggregation is stimulated because disulfide bonds between cysteine residues are formed as a result of the hydroxyl free radicals produced by ultrasound-assisted extraction [
42]. Long-term acoustic agitation brought on by cavitation during sonication causes the soluble protein fractions to become denatured, ultimately lowering the protein recovery. Therefore, it is essential to optimize ultrasound-assisted extraction parameters for various plant matrices in order to maximize yields while retaining the functional qualities of protein as well as other nutrients. Furthermore, ultrasound technology coupled with enzyme-assisted extraction can increase nutrient yields even more [
43].
Concluding, there were three main findings from the current research. The first is that ultrasonic probe devices were found to be more efficient in the extraction of compounds than bath sonicators. This implies that the industry would be better off opting to invest in probe sonicators rather than bath sonicator devices. Secondly, this study confirms that ultrasound technology fared better than conventional or alkali extraction methods. This indicates that the industry would benefit greatly in terms of increased extraction yields if it were to take the leap and change from current extraction methods to the more novel sonication method proposed. Lastly, one can conclude that Lemna minor (duckweed) was found to have the greatest extraction yield of nutrients, followed by Alaria esculenta. Thus, the aquaculture industry would be better off starting fish trials with duckweed, since this biomass is the cheapest to harvest and the easiest from which to extract compounds of interest.
The study shows that ultrasound technology does improve the extraction yield of nutrients from the three biomasses. Very few data on this topic were available before this study was carried out. The findings are promising as the use of ultrasound was found to surpass the extraction yields of conventional extraction methods. Current fish feeds are cheaper than any of the three proposed biomasses for now. This means that further efforts will be needed to reduce costs and make them more relevant for food security and hence food availability for future generations. However, with the cultivation of such biomasses being relatively low maintenance, this endeavour will surely be worth it in the long run.

 ,
, 


